
Abstract
Little is known about the quality of nursing homes in managed care organizations (MCOs) networks. This study (1) described decision-making criteria for selecting nursing home networks and (2) compared selected quality indicators of network and nonnetwork nursing homes. The sample was 17 MCOs participating in a California demonstration that provided integrated long-term services and supports to dually eligible enrollees in 2017. The findings showed that the MCOs established a broad network of nursing homes, with only limited attention to using quality criteria. Network nursing homes (602) scored significantly lower on 6 selected quality measures than nonnetwork (117) nursing homes. Low registered nurse and total nurse staffing were strong predictors of network nursing homes controlling for facility characteristics. Managed care organizations should consider greater transparency about the quality of their nursing homes and use specific quality criteria to improve the quality of their networks.
As integrated systems that include LTSS for dual eligibles are growing, some studies have found that dual eligibles in health plans are more likely to be discharged from hospitals to poorer quality nursing homes compared with individuals on Medicare only.
Because little is known about the quality of nursing home providers in health plan networks, this study is a first to examine how health plans participating in California’s dual-eligible demonstration selected their nursing home networks and to examine the quality of their nursing homes networks compared with nonnetwork nursing homes.
Because the findings showed that health plan network nursing homes had significantly lower scores on 6 quality indicators compared with nonnetwork nursing homes, the research has implications to suggest health plans need to give greater attention to improving the quality of their nursing home networks. CMS and state Medicare and Medicaid integration projects should consider developing guidelines that ensure adequate quality of nursing home networks.
Introduction
The recent trend of integrating long-term services and supports (LTSS) through managed care delivery systems is becoming more common nationally for beneficiaries who are dually eligible for Medicare and Medicaid (called “duals”). Managed care organizations (MCOs), hospitals, and accountable care organizations (ACOs) that integrate LTSS for duals must start by developing a provider network of long-term care facilities. Several recent studies have shown the benefits of integrating LTSS through 1 delivery system include reducing hospital readmissions for Medicare patients after major surgery, 1 overall fee-for-service nursing home readmissions,2-4 acute inpatient care admissions, length of nursing home stays, and postacute spending.3-4 Organizations that integrate LTSS are also more likely to have advanced transition management, end-of-life planning, readmission prevention, and care management capabilities. 5
Integrated care for dual eligibles has become more important, primarily because dual eligibles are more likely to have poor health status and live alone, 6 to have high costs 7 related to the use of LTSS, 8 to be rehospitalized within 30 days, 9 and to become long-stay nursing home residents than Medicare-only patients.10,11 As a result of their higher utilization of care, dual eligibles account for a disproportionate share of spending in both programs.7,8,10,12
In response to this, the federal government has taken several actions to make integration of LTSS through managed care more common. First, in 2014 the Centers for Medicare and Medicaid Services (CMS), using the authority in the Affordable Care Act, established financial alignment demonstrations in 13 states to improve the care and control costs for individuals dually eligible for Medicare and Medicaid services. 13 California’s dual demonstrations (called the Coordinated Care Initiative) created new health plans called Cal MediConnect (CMC) that were responsible for providing Medicare, Medicaid, and LTSS to dually eligible beneficiaries in 7 demonstration counties.14,15 The trend of integrating LTSS is likely to continue because Dual Special Needs Plans (DSNPs), a type of health plan for duals that integrates Medicare, Medicaid, and LTSS, were recently permanently certified by the Bipartisan Budget Act of 2018. 16
With the growth in integrated systems that include LTSS for dual eligibles, there is a concern about the quality of nursing home care provided to dual eligibles by health plans. 17 A recent study found that dual eligibles were more likely to be discharged from hospitals to poorer quality nursing homes having fewer nurses, compared with individuals on Medicare only. 18 One study found that fee-for-service Medicare enrollees had a substantially higher probability of entering high-quality skilled nursing facilities with lower hospital readmission rates than enrollees in Medicare Advantage (MA) plans, controlling for enrollees characteristics and nursing home choice within a geographical area near the enrollee’s residence. 19 The differences in nursing home quality may have occurred because fee-for-service enrollees were not limited when selecting a nursing home and may have been influenced by public information about quality, while MA plans may have had more limited nursing home networks and choices 19 and/or may have had lower quality nursing homes in their networks.
Extensive report card information about nursing home quality is available to inform consumers, providers, and MCOs about the quality of nursing homes. The CMS provides a Nursing Home Compare Web site 20 that includes information on facility characteristics and deficiencies, registered nurse (RN) staffing and total nurse staffing, resident quality measures, and a “five-star” overall rating system for Medicare and Medicaid certified facilities in the United States. 20 Some states (such as California) have Web sites with detailed information on the quality of both nursing homes and other LTSS providers in the state. 21 Report cards show wide variations in nursing home ratings, deficiencies, staffing, and resident quality measures such as rehospitalization rates.20,21 Nursing home quality is predicted by many factors, including facility characteristics (eg, the number of beds, percent of Medicare and Medicaid paid residents, chain ownership, for-profit ownership, and occupancy rates),11,19 geographical regions, 19 and market competition. 22
Since the introduction of the CMS Nursing Home Compare Web site, nursing homes have improved their scores on certain quality indicators,23,24 especially in competitive markets. 22 A clinical trial examining the use of a personalized version of Nursing Home Compare in the discharge planning process resulted in greater patient satisfaction, increased likelihood of going to higher ranked nursing homes, increased willingness to travel further to nursing homes, and reduced hospital stays compared with the control group. 25
While there is evidence showing the value of nursing home quality report cards to consumers and nursing homes themselves,23-26 hospital discharge planners generally have not been using quality report cards 27 and it is not clear that health plans are using quality data in developing networks and contracting practices. Only 1 study reported an ACO that established a network of high-quality skilled nursing homes by setting minimum criteria for network eligibility and secondary criteria for selecting network facilities. 28
Given the lack of research on the quality of nursing home providers in health plan networks, this study examined how health plans participating in California’s dual-eligible demonstration14,15 selected their nursing home networks and examined the quality of the nursing homes in their networks compared with nonnetwork nursing homes.
Study Design
The 2 specific aims of this descriptive study were to (1) describe health plan decision-making criteria in selecting nursing home provider networks, and (2) compare the quality of nursing homes in each health plans’ network with the nonnetwork nursing homes within each county in 2017. The overall goal of the study was to evaluate the quality of the nursing homes in networks compared with nonnetwork nursing homes. The study was part of a larger overall evaluation of the California duals demonstration.29,30
Sample Population
This study examined the 17 managed care plans in 7 counties that participated in the California’s dual financial alignment demonstration. To participate, each of the 17 Medicaid MCOs that previously served Medi-Cal-only beneficiaries created new health plans called CMC 29 which integrated medical, LTSS, and behavioral health for dually eligible beneficiaries in their counties.14,29 The program began enrollment in 2014, and by 2017 the CMC plans had enrolled a total of about 116 000 dually eligible beneficiaries in the 7 counties. 15
As part of the duals demonstration, each CMC health plan was responsible for providing LTSS, including short-term rehabilitation, long-term nursing homes services, as well as other home- and community-based services. Prior to receiving approval by the state to participate in the demonstration project, each plan had to show a satisfactory network of LTSS providers, including nursing homes. 27 CMC health plans were also required to continue to serve all CMC enrollees who were residing in nursing homes at the time of enrollment, without requiring enrollees to change nursing homes. While this may have initially limited the health plans’ ability to exclude low-quality facilities, the health plans had no restrictions on their networks (other than using certified providers) and were allowed to change their nursing home providers over the 3-year demonstration period. The CMC plans also made efforts to transition long-stay nursing home residents to home- and community-based settings where appropriate. 29
Data Collection
To identify information about the development of health plan networks of nursing homes, we designed a written survey and collected data from each health plan by e-mail in 2017. The survey asked specific questions: (1) did the plans established contracts with nursing homes that served its members in the demonstration; (2) how has the network changed over time; (3) was their network considered sufficient in terms of geographic coverage; (4) what type of payment rate was used; (5) were specific criteria used for selecting nursing homes; (6) were there other requirements of nursing homes; and (7) what were the successes and challenges in the development of the plans’ nursing home networks?
To identify the nursing home networks, provider directories from each plan’s Web site were examined to create a list of nursing home participants in each plan’s county network (coded as 1 for yes). The California Electronic Licensing Management System (ELMS) data were used to identify the nonnetwork nursing homes for each plan within the 7 counties (coded as 0 for no). 31 We identified 602 nursing homes that were in the network of at least 1 or more of the 17 MCOs and 117 nursing homes that were not in any of the 17 MCO networks in the study.
Descriptive data for all nursing home characteristics in the 7 counties were obtained from the California Office of Statewide Planning and Development cost reports and included number of beds, ownership type (for-profit), chain ownership, the occupancy rates, the percent of residents paid by Medicare, and the percent of residents paid by Medicaid. 32 Although we did not include any resident characteristics in the model because of the limited number of nursing homes in the study, the percent of residents paid by Medicare can be considered a proxy for residents with higher acuity compared with Medicaid residents.
Nursing Home Quality Indicators
For the quality indicators, we used existing data collected from publicly available federal and state nursing home databases. The federal data were obtained from CMS, the Certification and Survey Provider Enhanced Reports (CASPER), and the Nursing Home Compare databases; and state data were from the state survey and certification agency and from state cost reports.33,34
We selected 6 nursing home quality indicators that have been well documented by researchers and CMS to be useful metrics for quality and included overall nursing home rating, deficiencies and violation of regulations, staffing (total and RN), successful discharge home, and hospital readmission rates.35-38 Low staffing levels, particularly RN staffing, can result in poor quality that can reduce the quality of care and life, reduce rehospitalizations, and jeopardize the health and safety of residents.36,37,39,40 The new CMS nursing home quality measures of successful discharge home and hospital readmission rates were considered to be relevant for health plans that have an incentive to improve quality and reduce overall costs. 41 We considered these publicly available quality indicators as potentially important for health plan decision-making when establishing LTSS networks.
The first quality indicator was an overall composite quality rating of each nursing home developed using a combination of federal and state data consisting of (1) total nursing home deficiencies and citations issued in the most recent 3 years of health inspections; (2) nurse staffing for RNs and for total nurse staffing; and (3) CMS resident quality measures. Using a methodology similar to the CMS 5-star rating, an overall rating on a 5-point scale was created ranging from superior (5) to poor (1).33,34 The composite rating was considered more stringent than the CMS rating because it included all state citations and staffing data from state cost reports that were considered more accurate than federal staffing data collected at the time of the annual surveys.
The second quality measure was the total federal and state nursing home deficiencies and citations issued over the past 3 years from health inspections. It was important to include the state citations which may be issued up to a maximum of $100 000 for serious violations that cause death to residents as well as federal deficiencies to have a complete picture of quality. Lower total deficiencies and citations indicated better quality. These data were from CMS as well as the California Department of Public Health.33,34
The third and fourth quality indicators were the nursing home RN nurse staffing and the total nurse staffing hours per resident day for the most recent calendar year obtained from California cost reports. 32 The staffing hours per resident per day were calculated as the total number of hours worked by staff divided by the total number of resident days. Higher staffing hours per resident day indicated better quality.
The fifth quality measure was the percentage of short-stay nursing home residents who were readmitted to a hospital within 30 days for an unplanned stay, obtained from CMS’s Nursing Home Compare data that used Medicare claims data.33,41 Planned readmissions were not included. High readmission rates may indicate that nursing homes are not assessing or taking adequate care of their residents; lower rates indicated better quality.
The sixth quality measure was the percentage of short-stay residents who were successfully discharged to the community obtained from CMS’s Nursing Home Compare data that used Medicare claims data.33,41 This was defined as the percentage of all new admissions to a nursing home from a hospital where the resident (1) was discharged to the community within 100 calendar days of entering the nursing home; (2) did not have an unplanned hospital stay, and (3) was not readmitted to a nursing home and did not die within 30 days. Because higher rates of successful discharge show the nursing home may be helping residents to return to the community, higher rates were indicative of better quality. It should be noted that the CMS successful discharge measure excludes managed care enrollees, but it can still be considered a proxy for facility quality.
Data Analysis
For the health plan survey, the unit of analysis was the 17 plans. We summarized the written responses on each question from each health plan and developed a descriptive table of the responses.
For the analysis evaluating the network versus nonnetwork nursing homes, each nursing home in the 7 counties was linked to secondary data on nursing home characteristics and the 6 selected quality indicators, described above. All nursing homes in each of the 7 counties were identified as being either in 1 or more networks of the 17 MCOs compared with not being in any network for the 17 MCOs (total N = 719, network facilities = 602, nonnetwork facilities = 117). Each nursing home was only included once in the model. The data were analyzed using SAS/STAT software, version 9.3.
A multivariable procedure, multivariate analysis of variance, was use to analyze the nursing home facility characteristics and quality measures. This approach was chosen to examine the facility characteristics simultaneously with each quality indicator. We conducted a correlation analysis to assess for multicollinearity among the facility characteristics, which was not found to be an issue based on an r > .50 as a cut-point.
We conducted separate logit regressions with each of the quality indicators as a predictor of network status. In addition to each quality indicator, the 6 facility characteristics were included as covariates in each logistic model. Separate regressions were conducted for the quality indicators because some of these indicators were highly correlated (the overall rating and total deficiencies had a –.537 correlation; the RN and total staffing had a 0.727 correlation). In addition, the rehospitalization and successful discharge indicators had missing values that decreased the sample size for the nonnetwork nursing homes. Thus, a composite regression with the 6 measures could not be conducted.
The study had many limitations. First, it was a descriptive study that did not have access to data on individual enrollees so that we could not adjust for differences in the health status of enrollees and nursing home residents. Data on the number of plan enrollees living in nursing homes were not available during the demonstration study. The health plans were limited to those who participated in the dual-eligible CMC demonstration project so they were not representative of health plans that did not accept dual eligibles. The results were limited to California and may not be representative of financial alignment demonstrations in other states. The sample size was small representing only 17 health plans within 7 counties. Finally, the health quality indicators for the network nursing homes did not necessarily reflect the outcomes for dual-eligible enrollees.
Survey Findings
There were 17 health plans in the sample in 7 counties in 2017. Two counties had only 1 plan option, 3 counties had 2 plan options, and 2 had 4 or 5 plan options. There were 11 separate health plan companies that managed 1 or more plans in the sample. Of the 17 health plans, 16 responded to the survey (94%). One of the 17 health plans was unable to respond to the survey because each of the medical groups affiliated with the plan were given the responsibility of contracting with nursing homes and the health plan did not have information on the criteria used for contracting.
Network development
Table 1 shows the results of the survey of health plans. All the plans were required by the state to establish provider networks prior to the beginning the demonstration. Twelve plans added new nursing home contracts in addition to its existing contracts and the nursing homes where their enrollees were already living at the time of initial enrollment. All of the plans established wide networks that included between 76% and 88% of all nursing homes in each of their counties. Eight plans reported that their nursing home networks had remained substantially stable over the 3-year demonstration period, 7 plans reported increasing the size of their networks, and only 1 plan reported reducing its network size.
Survey of Managed Care Organizations Regarding Their Nursing Home Networks.

Plans could respond to more than 1 item.
Network size and sufficiency
Ten plans reported that their nursing home networks were “totally sufficient” and 4 plans reported that their networks were “mostly sufficient” except for a few remote areas to serve their members (and 2 reported they did not know). Only 1 plan located in a county with a limited supply of nursing home beds (with high occupancy rates) reported difficulties finding beds for long-stay custodial care Medicaid residents and residents with behavioral problems.
Plan reimbursement
Most plans (12 plans) reported using facility-specific negotiated rates that varied for the postacute and long-term residents. Eight plans used the same as or similar rates to the Medicare and state Medicaid payment rates. Only 3 plans were using a blended rate for those residents and 4 did not report. Finally, 1 plan in the county with limited bed supply reported developing tiered reimbursement rates that would provide an incentive for facilities to admit difficult-to-place residents and incentives for higher quality indicators.
Quality criteria
In terms of criteria for participating in the health plans network, 7 plans did not use other quality criteria for selecting nursing home providers (Table 1). One plan used 4 criteria for selecting networks, 4 plans used 2 criteria, and 4 plans used 1 criterion. Most plans did not use the CMS 5-star reporting system information (only 5 plans used the information), did not use state information on nursing home deficiencies and citations (only 7 plans did), and did not use a minimum staffing requirement (only 1 plan did). Only 1 plan used rehospitalization rates and another plan used community discharge rates for its network contracts. In terms of other requirements, 2 plans required nursing homes to have liability insurance, 1 plan required submission of state audits reports, and 8 plans required their admitting physicians to visit their residents within 24 to 72 hours after admission.
Accomplishments and challenges
A few plans also noted the importance of building good relationships with ongoing communications, care coordination, and issue resolution with nursing homes. Four plans mentioned the challenges of serving members located throughout a wide geographical area, such as Los Angeles County.
Network Versus Nonnetwork Nursing Homes Analysis
Table 2 shows the descriptive statistics for the 6 nursing home characteristics and 6 quality indicators for the network and nonnetwork nursing homes. Nursing homes in MCO networks were significantly more likely to have more nursing home beds, higher occupancy rates, to be for profit and chain owned, and to have a lower percent of Medicare residents and a higher percent of Medicaid residents.
Differences Between Managed Care Organization’s Network and Nonnetwork Nursing Homes.
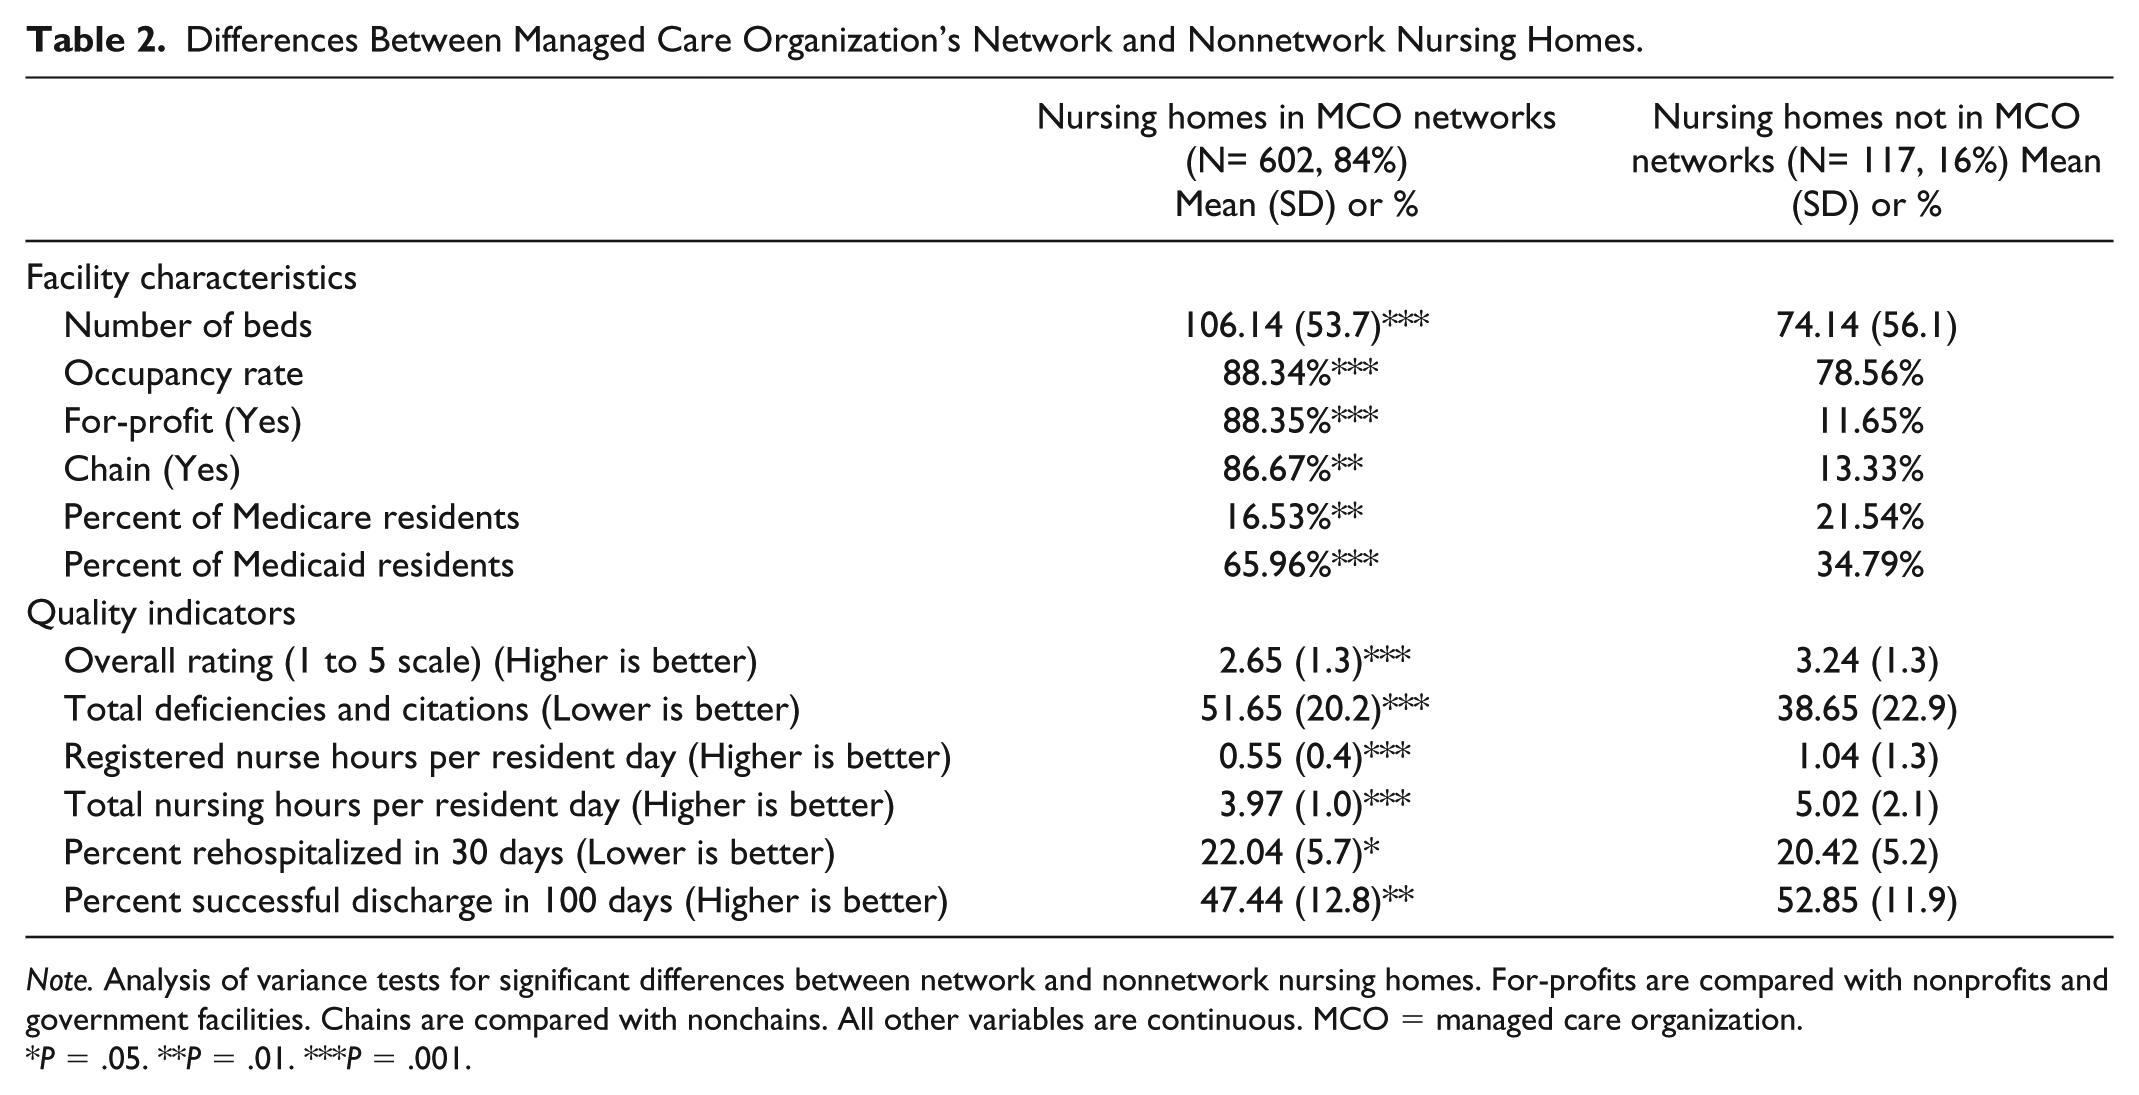
Note. Analysis of variance tests for significant differences between network and nonnetwork nursing homes. For-profits are compared with nonprofits and government facilities. Chains are compared with nonchains. All other variables are continuous. MCO = managed care organization.
P = .05. **P = .01. ***P = .001.
The findings revealed a wide range of overall quality ratings of nursing homes (from poor to superior) with a below average scores for network nursing homes and higher than average scores for nonnetwork homes (Table 2). Network nursing homes were 5 times more likely to have scores of 1 (the lowest category) than for nonnetwork nursing homes. Deficiencies and citations were significantly higher for network nursing homes compared with nonnetwork homes. The total RN staffing and total nurse staffing hours per resident per day in network homes were significantly lower than nonnetwork homes. The percent of 30-day rehospitalization rates were significantly worse (higher) and successful discharges to the community were significantly worse (lower) in network nursing homes.
Based on multivariable analysis of variance, the 6 facility characteristics significantly differed (P < .01 or P < .001) between the network and nonnetwork groups.
Prior to including the facility characteristic covariates in the logit models, each quality indicator was included as the sole predictor for the outcome variable, network inclusion. Each of the 6 quality indicators on their own were significant predictors of network nursing homes. Relatively lower quality nursing homes were more likely to be included in a network.
When the facility characteristics were included in the model, the quality indicators remained significant for only 2 logit regressions, RN staffing, and total staffing. Table 3 shows the results for the logit regressions for the 6 quality indicators. Lower RN hours and total nursing hours were strong predictors of being a network nursing home. Network nursing homes with lower RN hours were also likely to have a greater number of beds, higher occupancy rates, for-profit ownership, higher percentages of Medicare residents, and higher percentages of Medicaid residents. The total staffing model was similar to the RN model but for-profit ownership was not a predictor. In all the models, the percent of Medicaid residents was a positive predictor of being in a network nursing home.
Separate Logit Regressions for Each Quality Indicator for Managed Care Organization’s Network Nursing Homes Compared with Nonnetwork Nursing Homes.

Note. For-profits are compared with nonprofits and government facilities. Chains are compared with nonchains. Percent Medicare and Medicaid residents compared with total residents including private pay and other payers.
Separate logistic regression models were conducted for each outcome measure. The estimates are maximum likelihood estimates.*P = .05. **P = .01. ***P = .001.
Discussion
Health plans that provide LTSS are growing in enrollment, and they have the potential to improve the quality of care for nursing home users.13,16,42,43 The health plans in the study developed wide networks of nursing homes within each county with a wide range of quality scores. Overall, network nursing homes had significantly lower scores on 6 quality indicators than nonnetwork nursing homes. The study could not determine whether the health plan enrollees actually received poorer quality of care than nonenrollees.
Numerous research studies have established that RN and total staffing have strong positive relationships with quality care.35,36,39 The regression models in this study showed that low RN staffing and fewer total nurse staffing hours were strong predictors of network nursing homes even when facility characteristic covariates were included in the models, thus demonstrating that the health plans in this study are contracting with lower quality nursing home facilities.
Because only about half of the health plans reported considered a few objective quality criteria to establish their nursing home network, it is not surprising that the network homes had lower quality scores. This is unfortunate because the quality indicators used in this study are publicly available. Furthermore, much research is available that provide guidelines for adequate staffing levels.44-47 Health plan network planners/managers may be unaware of the easy access to quality report card information on nursing homes and the wide variations in the quality of nursing homes.
The findings of lower nursing home quality in the health plan networks in the study support recent findings that enrollees in MA plans used lower quality network nursing homes than Medicare fee-for-service members and a study that dual eligibles were admitted to poorer quality nursing homes.18,19 The lower nursing home network quality found in this study clearly suggests quality indicators can be a helpful metric for health plans when establishing their networks, particularly RN and total staffing levels. The plans could establish quality criteria to use in making network decisions and monitoring outcomes for their own enrollees. Also, health plans should give its members informed choice about the quality ratings of nursing homes in their network before admission.
Several nursing home characteristics were highly related to nursing homes in networks. Network nursing homes were more likely to be for-profit perhaps because those facilities are more aggressive in seeking managed care contracts than nonprofit or government homes. Higher percentages of nursing home residents paid by Medicaid was significantly associated with being in the health plan network. Higher percentages of Medicaid residents has previously been shown to be associated with poorer nursing home quality because Medicaid nursing home reimbursement rates are associated with lower expenditures and lower staffing levels.10,40
An interesting question is why some nursing homes were excluded from the MCO networks. Although we do not have specific information on exclusion decisions or MCO reimbursement rates, it is likely that the MCOs were contracting based primarily based on price. Some nursing homes with higher percentages of Medicare and private pay residents may have rejected the MCO rates that were offered. It is not clear whether the health plans were selecting nursing homes that already had high percentages of Medicaid residents without regard to quality or whether it was more difficult for the health plans to obtain contracts with higher quality nursing homes that had fewer Medicaid residents. The findings are consistent with previous studies showing that duals are more likely to be living in lower quality nursing homes even after controlling for distance from home and health status, possibly because of bias in the discharge planning process or discrimination by race/ethnicity.11,18,19,38
While having sufficient access to nursing home providers for dual-eligible enrollees is necessary, studies have shown that a more limited network within the health plans catchment area may afford better care and still ensure adequate access. Evidence from network studies of physicians show that narrower networks have led to reductions in utilization and spending.48,49 Fewer high-quality nursing homes in networks could improve the coordination with hospitals and reduce readmissions.4,5,28 Narrower nursing home networks could allow health plans to concentrate residents in nursing homes where the health plans could increase and improve the number of physicians, nurse practitioner, and physician assistant visits as well as visits by care coordinators. Encouraging the use of higher quality nursing homes in networks, although fewer nursing homes, would allow health plans to focus on care coordination and improved communications with the providers and greater oversight of the quality of those providers.
CMS and the states are rapidly expanding Medicaid managed care plans and encouraging integrated systems to provide medical and LTSS services.13,43 Moreover, special needs plans (SNPs) with coordinated care specifically designed to provide targeted care and limit enrollment to special needs individuals are also rapidly expanding. 43 As these plans expand, it is important to consider whether specific CMS guidelines should be developed to ensure access to high-quality nursing home services.
CMS could require health plans to be more transparent about the quality of their network nursing homes before enrollment decisions are made18,19 and when consumers are selecting a nursing home. CMS could encourage or require minimum quality criteria for nursing home networks. As an example is the model criteria established by an ACO for network participation which required a score of at least 3 stars on their most recent CMS Nursing Home Compare Five Star rating and the use of performance scores on items such as organizational structure, clinical capabilities, medical coverage, quality, infrastructure, reimbursement, and geography. 28
Conclusion and Future Studies
The study showed disparities exist in the quality of nursing homes in health plan network that contribute to duals to be placed in lower quality nursing homes. This combined with the common failures of discharge planners to provide quality information on nursing homes 27 to their members and the lack of transparency in health plan quality ratings of their network providers may be contributing to disparities in the quality of nursing home care for dual-eligible health plan enrollees. Health plans should use publically available quality ratings to determine what facilities they include in their networks and should provide their members with quality information about its network nursing homes. The challenges for health plans in developing contracts and networks among LTSS providers are complex but certainly LTSS report cards with quality indicators are a valuable tool for both care coordination and network development.23-26
As the goal for integrated care moves forward to provide more efficient and economical care, health plans should be encouraged, or required, to develop specific quality criteria for nursing homes to participate in their networks. Quality care is both economical and efficient. In addition, health plans should consider developing networks that limit providers to those that meet at least average quality standards, while meeting the geographical needs of their members. 28
Because the study was located in only 1 state with a small number of health plans, it is not known if these findings are representative of other health plan networks in other states. Given the importance of improving the quality and the outcomes for postacute and long-term care, future studies should continue to examine the quality of managed care nursing home networks and the barriers and benefits of using higher quality nursing homes.
Footnotes
Declaration of Conflicting Interests
The author(s) declared no potential conflicts of interest with respect to the research, authorship, and/or publication of this article.
Funding
The author(s) disclosed receipt of the following financial support for the research, authorship, and/or publication of this article: This study was supported by The SCAN Foundation.