
Abstract
This article examines whether California Medicare beneficiaries with HIV/AIDS choose Part D prescription drug plans that minimize their expenses. Among beneficiaries without low-income supplementation, we estimate the excess cost, and the insurance policy and beneficiary characteristics responsible, when the lowest cost plan is not chosen. We use a cost calculator developed for this study, and 2010 drug use data on 1453 California Medicare beneficiaries with HIV who were taking antiretroviral medications. Excess spending is defined as the difference between projected total spending (premium and cost sharing) for the beneficiary’s current drug regimen in own plan vs spending for the lowest cost alternative plan. Regression analyses related this excess spending to individual and plan characteristics. We find that beneficiaries pay more for Medicare Part D plans with gap coverage and no deductible. Higher premiums for more extensive coverage exceeded savings in deductible and copayment/coinsurance costs. We conclude that many beneficiaries pay for plan features whose costs exceed their benefits.
Introduction
The expansion of Medicare in 2006 to cover outpatient prescription drugs for the first time under Part D of the program provided much-needed financial protection to people living with HIV/AIDS (PLWHA). While other sources of coverage are available for expensive antiretroviral (ARV) regimens, since its inception Part D has filled an important gap, particularly among those who do not qualify for Medicaid. In 2016, Medicare was the largest single source of federal funding for HIV/AIDS medical coverage, spending nearly $10 billion, exceeding both the federal portion of Medicaid costs for HIV treatment ($5.9 billion) and the Ryan White Program ($2.3 billion). 1 When state spending is taken into account, Medicaid is the largest funder.
Unlike most other government-funded insurance programs, Part D requires that enrollees choose among numerous private insurers. In this way, the structure of the program resembles that of the employer health care market and the Affordable Care Act (ACA) exchanges. The amount of choice can be daunting, particularly in urban areas with high managed care penetration rates. In Los Angeles County, for example, there were 24 “stand-alone” Part D prescription drug plan (PDP) choices available for 2017, and another 35 Medicare Advantage (mostly Health Maintenance Organization) plan choices that covered prescription drugs. The drug plan a person chooses can have a considerable impact. Among the general Medicare population, it has been estimated that only about 5% of beneficiaries chose plans that would minimize their total drug costs in 2009 and that on average they were spending $368 more on the plans chosen compared with the least expensive plan available to them. 2
This article addresses the following questions about PLWHA in California who were enrolled in the Medicare program:
Are they choosing prescription drug insurance plans that are likely to minimize their total expenses for prescription drugs?
How much forgone savings might be expected for those not choosing the drug plan with the lowest total costs?
What insurance policy and beneficiary characteristics are most responsible in cases where the lowest cost plan is not chosen?
Background
Characteristics of PLWHA Covered by Medicare
PLWHA qualify for Medicare insurance coverage either because they have reached the age of 65 years or because they have been disabled for 2 years or more. Nearly all of California’s PLWHA who are Medicare beneficiaries initially qualify due to disability (90%). As a result of increases in longevity largely brought about by antiretroviral therapy (ART), people age 65 years and older is the age category that has shown the greatest growth among PLWHA. 3 Many of these Medicare beneficiaries have low income and receive dual Medicaid and Medicare coverage. Others do not receive this supplemental coverage: In California, 28% of Medicare beneficiaries with HIV/AIDS are not dually covered and are the focus of this article.
Coverage and Sources of Payment for ART Under Medicare
As the ACA now stands, Part D benefits have an unusual structure that will continue until 2020. Although insurers were given some flexibility by being permitted to modify the structure of benefits, the standard benefit package included a coverage gap, which is a period in which no drug coverage is provided, commonly known as the “doughnut hole.” In 2010, the year analyzed in this article, the standard Part D plans included the following:
A $310 annual deductible.
Twenty-five percent coinsurance for the next $2520 in total drug costs, ie, up to $630 in beneficiary cost sharing (the pregap benefit phase).
After $2830 in total drug spending ($940 in beneficiary cost sharing), no coverage for the following $3610 in drug costs (the gap).
After paying $4550 in cost sharing ($6440 in total drug costs), the beneficiary entered the catastrophic benefit phase, where coinsurance was 5% of all remaining drug costs during the year, with minimum contributions of $2.50 for generics and $6.30 for brand-name drugs.
Most plans did not follow the standard benefit format. “Actuarially equivalent” plans have the same deductible but may modify cost sharing in the pregap benefit phase. “Basic alternative” plans may modify the deductible, pregap cost sharing, and the spending threshold for entry into the gap. These 2 plan types must be actuarially equivalent to standard benefit plans. “Enhanced alternative” plans may provide supplemental benefits so that their value can exceed that of standard plans. In addition to modifying the deductible, pregap cost sharing, and gap entry, they may also provide coverage during the gap and cover additional drugs.
The exact method used to determine cost sharing in nonstandard plans depends on the “tier” to which the plan assigns each drug. Tier assignments are generally based on whether a drug is brand name or generic, preferred or nonpreferred. In 2010, copayments prior to the coverage gap averaged about $7 for a 30-day supply of a generic prescription, $42 for a preferred brand-name drug, $79 for a nonpreferred brand-name drug, and a 30% coinsurance rate for specialty drugs. 4 Depending on the particular drug and the plan in which a PLWHA was enrolled, ARVs could be considered preferred, nonpreferred, or specialty. While some nonstandard plans provided coverage for some or all generic drugs in the coverage gap, no plans offered in California in 2010 provided gap coverage for brand-name drugs such as almost all ARVs.
Previous Research on Part D Drug Plan Choice
A number of studies have examined whether Medicare beneficiaries are choosing plans that minimize their total cost—that is, the sum of premiums and coinsurance or copayment amounts. Like the present study, they rely on information from a few years ago because of the lag in receiving current claims data from the Medicare program. Most but not all of these studies have found that few beneficiaries are picking the lowest cost plans and, as a result, are leaving a considerable amount of “money on the table.” It is reasonable to suppose that Medicare beneficiaries with HIV/AIDS might do better for 2 reasons: Typically they have a great deal of experience with purchasing prescription drugs for their disease, and there are many support organizations (particularly in urban areas) where it is possible to rely on professional expertise or the experience of others in a similar situation.
Unlike Medicare Advantage plans, which differ because each insurance plan has a different provider network, there are far fewer potential plan quality differences for stand-alone Part D drug plans. A key factor for most beneficiaries is whether a plan’s formulary includes the drugs they anticipate taking during the coming year. This aspect of plan choice is less salient for PLWHA, whose drug use is dominated by ARVs, which are a protected class that all plans are required to include in their formularies. The only other factors that might affect the desirability of one plan over another are the network of pharmacies, the company’s reputation and service, and brand identification.
Abaluck and Gruber 5 analyzed Medicare claims data from a random sample of more than 100 000 Medicare beneficiaries from 2006 to 2009. Their main findings were that very few beneficiaries were choosing the lowest cost plans, and beneficiaries did not seem to choose such plans more frequently over time. Depending on how the authors defined “forgone savings,” this amount was estimated to be $264 to $323 in 2006, rising to $347 to $418 in 2009. Interestingly, another study, by Ketcham and colleagues, 6 reached a somewhat different conclusion: Medicare beneficiaries originally made poor plan choices in 2006 but quickly improved on them in 2007. A subsequent study by Abaluck and Gruber, using newer data, did not confirm that finding, and in fact concluded that “‘forgone savings’ (welfare loss) available to consumers choosing Part D plans actually grew over time, and was larger by 2009 than it was at the start of the Part D program in 2006” because consumers were enrolling, on average, in less expensive but lower quality plans (p. 2146). 5
Heiss and colleagues 7 examined claims for a sample of Medicare beneficiaries over the period 2006-2008—looking at more than 1 million people each year. They found that less than one-fourth of beneficiaries enrolled in the lowest cost plan, with excess spending exceeding $300 per year. Similarly, Zhou and Zhang 2 used a data set (N > 400 000) composed of a 5% sample of Medicare beneficiaries in Part D plans in 2009 and found that only 5% of beneficiaries chose the lowest cost drug plan, with overspending averaging $368 per year.
In a more recent study, Zhang and colleagues 8 examined a particular subgroup of Medicare beneficiaries with a serious chronic disease (schizophrenia) to determine whether they would save money if the government assigned them to a drug plan in 2010, based on their spending in 2009. The data source was a 20% random sample of Medicare beneficiaries with schizophrenia (N = 12 000). The study found large potential savings: an average of $600 per beneficiary for those who did not receive low-income subsidies. Among those receiving low-income subsidies, government would have shared in additional savings, as Medicare and Medicaid’s portion of premiums would have been lower.
One possible reason why Medicare beneficiaries living with HIV/AIDS might not choose the insurance plan with the lowest total annual cost is risk aversion: Risk-averse beneficiaries may prefer plans with more complete coverage so as to minimize the chances of facing very high out-of-pocket costs. Later in this article, we show that drug plans with higher premiums do not shield beneficiaries from higher costs; rather, they merely push out-of-pocket spending back slightly later in the year. Nevertheless, beneficiaries may not be aware of this. This raises the question of whether Medicare beneficiaries with HIV/AIDS are more risk averse than other people. While there is no previous research on this particular subgroup, one study of younger people with HIV/AIDS from South Africa shows the opposite: Those with the disease are actually less risk averse than those without the disease. 9
Of particular interest to the current article are the characteristics of the chosen Part D plan that contribute to increased total spending by beneficiaries. The Abaluck/Gruber and Zhou/Zhang studies both examined this and both found that 3 factors were largely responsible:
Excess sensitivity to premium prices relative to copayments.
Too much emphasis on choosing a policy with a zero deductible.
Too much emphasis on choosing a policy that covered generic drugs in the coverage gap.
The last factor appears to be most important; Zhou and Zhang found that overspending averaged $683 for those purchasing gap coverage, vs $325 for those who did not. This difference, $358 per year, was about the same as computed by Abaluck and Gruber.
Empirical Approach
Our goal was to examine whether Medicare beneficiaries chose the lowest cost plan available to them, based on expectations of drug use during the year and expected outlays for premiums and cost sharing in all available plans. We projected the expected (not actual) cost to beneficiaries of the PDP they chose, compared it to projected costs for alternative plans, and identified the plan and beneficiary characteristics that are most responsible when the least expensive option is not chosen. Our focus was on whether beneficiaries chose the cheapest plan given information available at the time of choice, regardless of whether the plan turned out to be cost minimizing due to unforeseeable events during the course of the year.
Data and Methods
This analysis is based on data from California PLWHA enrolled in a Medicare Part D plan for the entire year in 2010. From the Medicare claims files provided to us by the Centers for Medicare & Medicaid Services (CMS), we selected individuals whom we identified through diagnosis codes as HIV-positive. 10 The sample included beneficiaries with stand-alone Part D coverage and did not include beneficiaries who enroll in a Medicare Advantage plan. The decision to enroll and choice of plan within Medicare Advantage are more complicated and are determined by factors in addition to minimizing drug costs and financial risk, such as provider quality and accessibility.
To focus on choice of Part D plan that minimizes beneficiary cost, we examined those without low-income subsidies or dual coverage through Medicaid. Many subsidized beneficiaries do not select a Part D plan on their own and are randomly assigned, making the issue of plan choice irrelevant for them. Furthermore, although some small financial responsibility remains after the low-income subsidies are applied, cost sharing for subsidized beneficiaries does not generally vary by plan. (Subsidized beneficiaries may enroll in any plan, but if they choose one whose premium exceeds a certain threshold [“above benchmark” plans], they are responsible for the extra premium costs. They receive the same low-income cost-sharing benefits regardless of plan.) Finally, the study focuses on those with at least 90 days of ARV use prescribed in the first half of the year, which for most PLWHA constitutes the great majority of drug costs. We do, however, examine the cost sharing associated with all drugs, not just ARVs.
In addition to insurance claims for drugs, the Medicare files included information on Part D plan characteristics including formulary, as well as enrollee demographics including gender, age, race/ethnicity, and ZIP code (for linking to census data to ascertain characteristics of the beneficiary’s neighborhood).
The claims data report the prescriptions filled by each individual. We define an individual’s “drug regimen” as the set of drugs prescribed during the first half of 2010 for at least 90 days, at the most frequently observed dosage. The first half of the covered year was chosen as the best representation of drug use anticipated at the time of enrollment and to abstract from changes in regimen that may have occurred during the course of the entire year. Drug regimens include both ARV and non-ARV drugs. Each drug was linkable to formulary and plan characteristics files, which indicated how the drug was covered by each available plan.
This coverage information included whether the drug was on formulary and whether it was assigned to a tier with a high or low copay or coinsurance rate. We assumed that beneficiaries paid 100% of the costs for drugs when plans did not include them on their formularies.
Information on the retail price of each drug in each plan is necessary to estimate patient costs. However, the retail price within a given Part D plan is observed only if a least one Plan beneficiary purchased the drug (identified by National Drug Code [NDC]). We treated retail prices for each drug as consistent across plans, since negotiations with drug manufacturers result in rebates that usually affect premiums rather than prices. 11 We found minimal variation across plans in retail prices for particular drugs. The coefficient of variation (CV) across plans for brand-name drugs was 1.8 (94% of drugs had a CV of 5 or less) and for generic drugs was 11.1 (61% of drugs had a CV of 5 or less).
The patient’s total financial responsibility in any plan is the sum of the expected cost sharing, given their drug regimen and the plan premium. For each individual, we compared total estimated patient liability under the actual plan chosen with that of the cheapest alternative plan. We calculated differences between own and cheapest plans and estimated the means of these differences by beneficiary and plan characteristics that might be correlated with choice of PDP.
Plan characteristics included plan type, deductible and gap coverage, and assignment of drugs to copay or coinsurance tiers. In addition, beneficiaries may feel “invested” in a particular plan if they have to go through a step therapy process or receive prior authorization to take certain medications. With step therapy, patients must start with more cost-effective or safer drugs and may progress to more costly or riskier drugs only if medically necessary. With prior authorization, plans must approve certain drugs before they can be prescribed. Beneficiaries might be willing to pay more for their current plans to avoid the risk of not getting past either of these hurdles in a cheaper plan. To capture these factors, we include indicators for whether any drugs in a regimen were subject to step therapy or required prior authorization.
Beneficiary characteristics included gender, race/ethnicity, age, and education (estimated as percent of adults in the beneficiary’s zip code who are college graduates). Finally, the net effects of plan and beneficiary characteristics on excess spending were estimated using multiple regression analysis. In the regression models, the outcome measure was excess spending, logged to improve the normality of its distribution.
Results
We received a data set from CMS from which we identified 14 140 HIV-positive beneficiaries enrolled for all of 2010 in fee-for-service Medicare. Of those, 1814 had no Medicaid enrollment or low-income subsidies, and 1636 were enrolled in the same California PDP the entire year. Of those, 1453 beneficiaries had at least 90 days prescribed of any ARV drug during the first half of the year. Of the 1453 beneficiaries in our 2010 cohort, 1438 (99%) had been enrolled in 2009 and had evidence of HIV infection (diagnosis and/or ARV use) recorded in 2009 claims; some or all of the remaining 15 people may have been aware of their HIV-positive status at the time of open enrollment, but it was not documented. Forty-four PDPs in California had at least one beneficiary in the sample. The number of different drugs taken by beneficiaries in the first half of 2010 ranged from 1 to 24.
Table 1 provides characteristics for the 44 plans and the 1453 individuals enrolled in them. Over half of the chosen plans were the more generous (and expensive) enhanced alternative plans. Very few (2%) of beneficiaries were enrolled in standard benefit plans, with roughly equal proportions (31%-34%) enrolled in the remaining plan types.
Characteristics of Medicare Part D Prescription Drug Plans in California, 2010.

Source. Authors’ analysis of Medicare 2010 Part D data.
Note. Plans are Part D stand-alone prescription drug plans (PDPs) with California service area, not employer group waiver plan (EGWP). Beneficiaries are Medicare enrollees, confirmed HIV+ with at least 90 days of supply of any antiretroviral medication filled during the first half of 2010, full year enrollment in Part D in the same plan, not enrolled in managed care, no low-income subsidy, enrolled in a California nonemployer group waiver plan PDP. Plan statistics are unweighted—averaged across plans regardless of number of beneficiaries in each plan.
Not surprisingly, the enhanced alternative plans were the most expensive, with premiums averaging $758 annually—far more than the other 3 plan types and 78% more than the standard benefit plans. For these extra premiums, policyholders never faced the full deductible, which was waived in 16 and reduced (to $50-$175) in 8 of the 24 enhanced alternative plans. Half of the basic alternative plans (3 of 6) had no deductible, and only one of the remaining plans imposed the full $310, but the other 2 plan types always included the full deductible. The main distinction in benefits among the enhanced alternatives was that nearly 40% provided generic drug coverage in the gap—a feature not available in any of the other 3 plan types. One of the main issues we address is whether these additional premiums and the extra benefits they provide are worth it to Californians living with HIV/AIDS.
Figure 1 illustrates the differences in cost sharing due to different plan characteristics. For a hypothetical beneficiary, it compares cumulative spending over the year estimated for a typical standard benefit plan vs estimated spending for 2 enhanced plans. The enhanced plans are similar to each other, except that one has no deductible and covers generic drugs in the gap and the other has a reduced deductible and no gap coverage. The plan characteristics and premiums are from 3 PDPs active in California in 2010. The regimen in the figure is a frequently observed ARV combination, with an added allowance for 3 generic drugs costing $100 per month each.

Cumulative beneficiary liability with and without premium, prototype regimen under three actual part D plans.
Differences in cost sharing across plans result in a different accumulation of beneficiary nonpremium out-of-pocket expenses in the early months of the year, but by March they are nearly identical. Under this scenario, by the end of the year, annual cost sharing ranges from a low of $5718 in the plan with gap coverage to $5753 in the standard plan, a difference of only $35. The higher premiums paid for the enhanced plans, in particular the one with gap coverage, well exceed this reduction in cost sharing. While the standard plan requires $35 more in cost sharing compared with the enhanced plan with gap coverage, when premiums are taken into account, it costs $648 less.
Only 4% of beneficiaries chose the cheapest of the 44 plans available to them. Less than a quarter chose 1 of the 5 cheapest alternatives, and less than half chose 1 of the 10 cheapest plans. Nearly 3% chose 1 of the 5 most expensive options. Random plan choice would imply that half of beneficiaries would choose plans ranked 1 to 22 in terms of cost, and half would choose one of the more expensive plans. The fact that half of beneficiaries chose 1 of the 10 cheapest plans demonstrates that they did better than random, although they did not optimize.
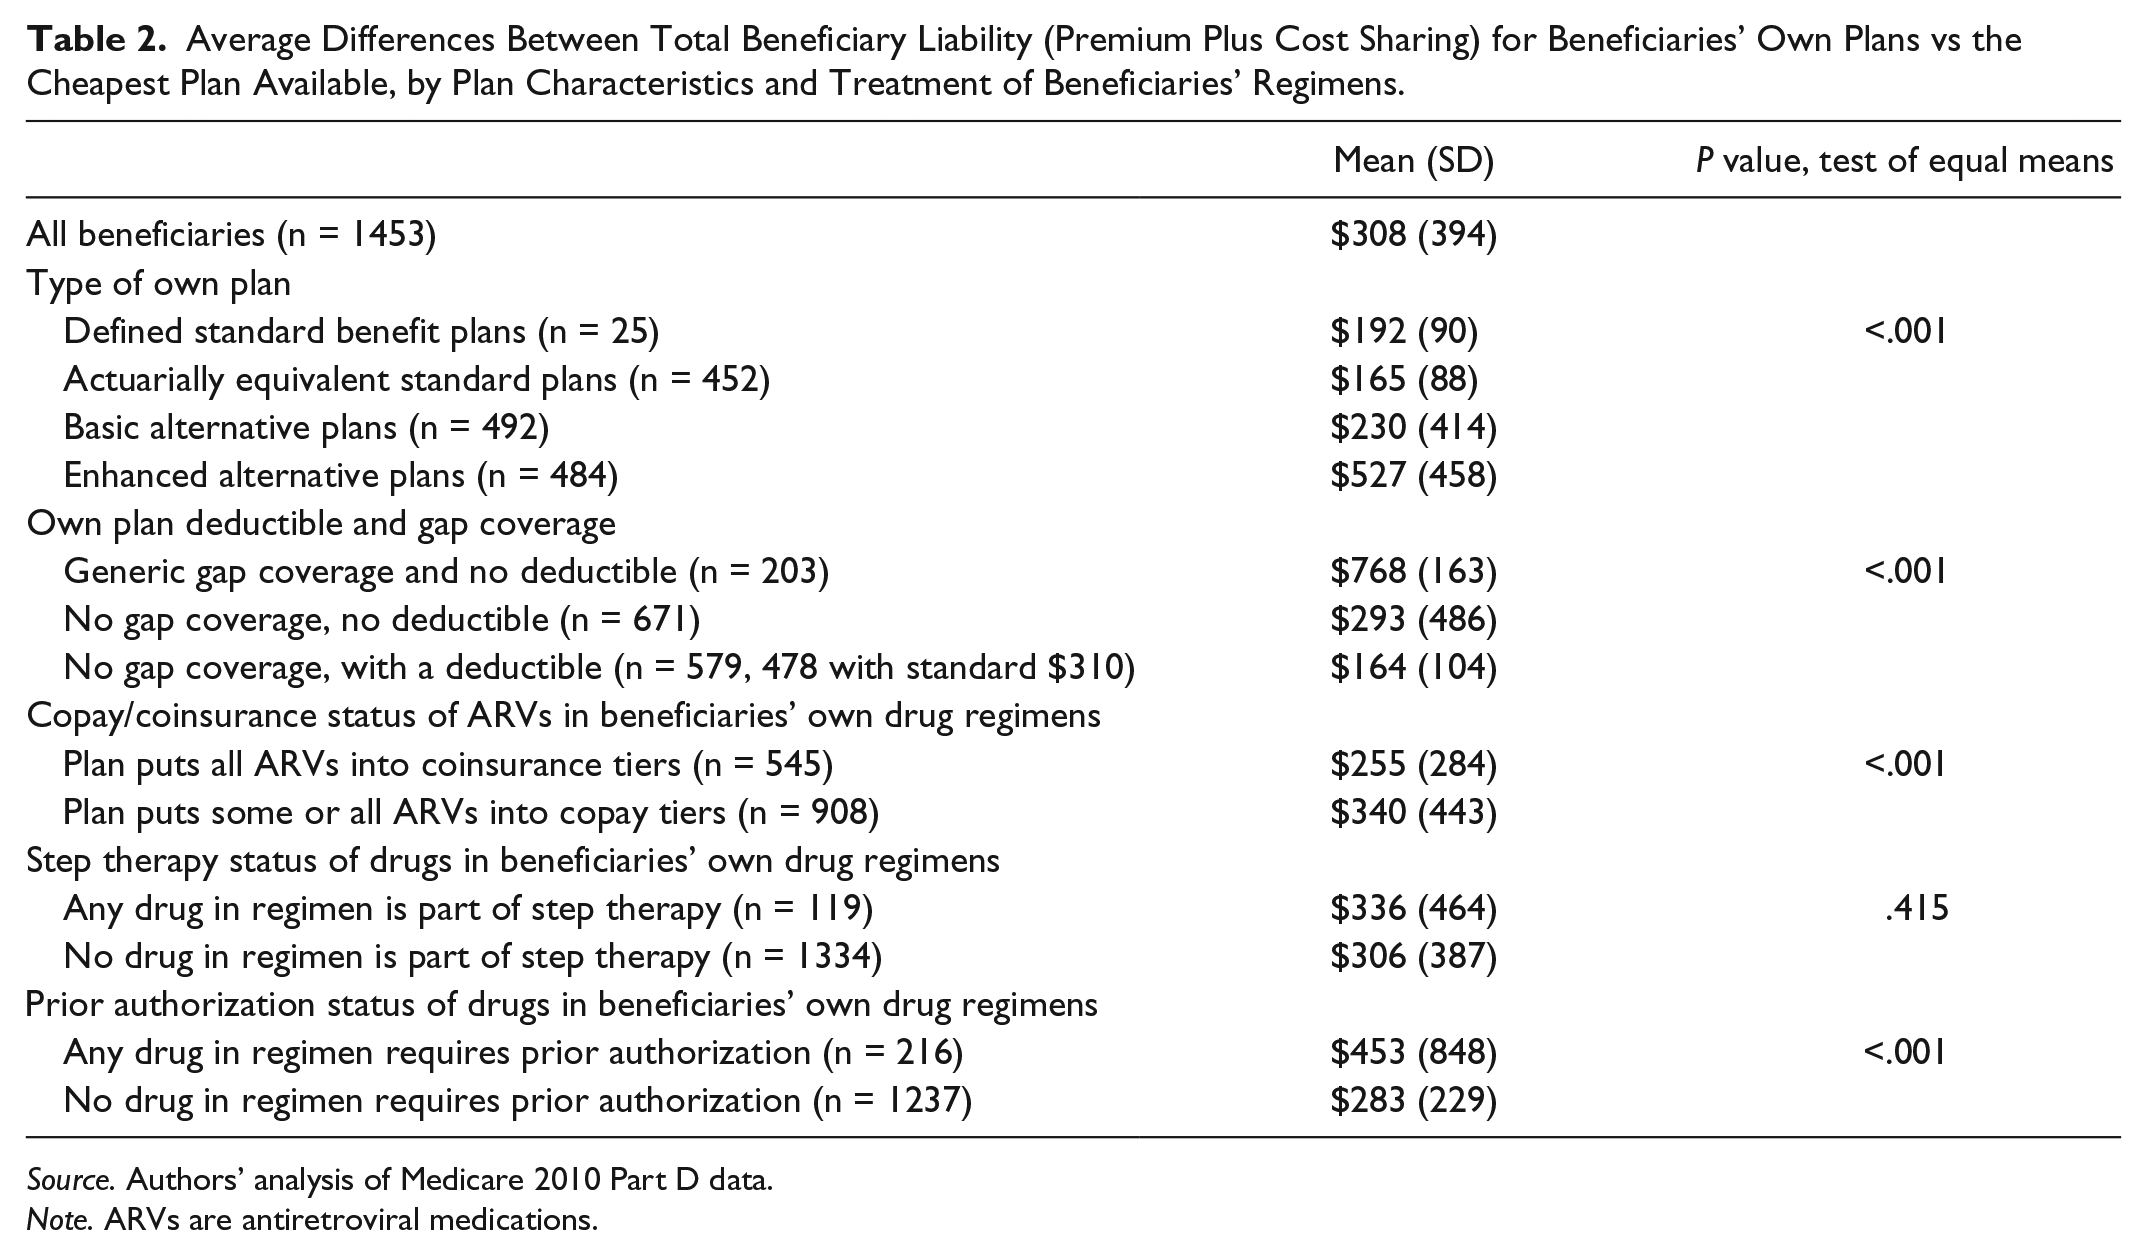
Table 2 shows estimates of mean excess spending by beneficiaries, comparing total projected spending for the plan they chose to that of the cheapest alternative. On average, beneficiaries spent $308 more on their own plan than they would have had they chosen the least expensive plan available to them. Plan characteristics had a large effect on the amount of extra spending. Those in enhanced alternative plans averaged $527 more in total costs above the cheapest plan available, while the differential was much lower for people in the other 3 plan types. Average spending above the cheapest plan available was $768 for those with gap coverage for generic drugs and no deductible, far higher than for those without gap coverage ($164 for those with a deductible, and $293 for those without one). These differences were highly statistically significant, with P values less than .001.
Average Differences Between Total Beneficiary Liability (Premium Plus Cost Sharing) for Beneficiaries’ Own Plans vs the Cheapest Plan Available, by Plan Characteristics and Treatment of Beneficiaries’ Regimens.
Source. Authors’ analysis of Medicare 2010 Part D data.
Note. ARVs are antiretroviral medications.
Beneficiaries with drugs in step therapy did not pay significantly greater excess costs than those who were not ($336 vs $306, P = .42), but those who had gone through a prior authorization process did pay more ($453 vs $283, P < .001).
Table 3 provides results from a regression that shows how plan and beneficiary characteristics affect spending in excess of the cheapest plan available. Several of the plan characteristics were highly significant (P < .02). Among people in plans without coverage for generics in the gap, paying for a $0 deductible led to 67% greater costs compared with having a deductible. Plans that offered coverage of generic drugs in the gap cost beneficiaries nearly twice as much. Paying more for a plan that provides a copay rather than coinsurance for some ARVs was also associated with greater excess spending. Although the bivariate results in Table 2 indicated that those with drugs in step therapy were no different from others in terms of excess spending, the regression results (which control for other factors) indicate that, all else equal, staying in your own plan if you have been through a step therapy process may be cost saving. It is possible that drugs subject to step therapy are less likely to be on formulary for other plans and would therefore cost the beneficiary 100% of the price if he or she switched plans. Prior authorization was not significant in the regression model.
Results of Ordinary Least Squares Regression Predicting Difference in Total Beneficiary Liability Between Beneficiaries’ Own Plan vs Cheapest Available Plan.

Note. Dependent variable is the natural log of (diff+1), where diff = beneficiary liability of own plan – beneficiary liability of cheapest alternative plan, if any model adjusted R2 = 0.24.
ARVs are antiretroviral medications.
For plan characteristics, gender, and race: difference between row category and omitted group; for prevalence and age: difference associated with a 1-unit increase in the predictor.
Source. Authors’ analysis of Medicare 2010 Part D data.
In general, the beneficiary characteristics were not statistically significant at the .05 level, with the exception of age (P = .03). Beneficiaries who were older were less likely to have excess spending.
Limitations
Our article has a number of limitations. First, the data relate to California and may not generalize to other states. If, for example, PLWHA enrolled in unsubsidized fee-for-service Medicare in other states have lower levels of education, less health insurance literacy, numeracy, or access to fewer supportive services, they may do less well than Californians in choosing the optimal Part D plan. Our findings also do not take into account the possibility that Medicare beneficiaries may consider factors other than total costs when choosing their drug plans, such as plan quality (although plan ratings were not available to consumers in 2010), or the network of affiliated pharmacies. In addition, we examined optimal plan choice assuming the beneficiary seeks to minimize costs and can accurately predict drug use over the coming year. Patients on ART are more able to accurately predict costs than patients without long-term medication use.
Our cost calculations viewed the drugs taken consistently at the beginning of the year as most likely to be those anticipated at the time of plan choice, during open enrollment at the end of the previous year. The regimen of drugs we observe, however, may reflect a response to the characteristics of the chosen plan, ie, people may choose drugs based on plan characteristics rather than the other way around. To the extent this happens, our estimates of excess spending in beneficiaries’ own plans are lower than they may have been with a possibly preferred regimen. Regardless, small variations in regimen should not alter our basic conclusion: that the extremely high cost of ARVs had the effect of moving beneficiaries so quickly through the various benefit phases in Part D that the overwhelming majority of additional drugs would be reimbursed at the 95% rate that prevails in the catastrophic phase of coverage, regardless of plan choice. Our finding that the relative costliness of plans is largely driven by premiums reinforces the conclusion that changes in drug use during the year are not likely to be an important factor in altering the cost calculation for this population of ARV users.
Although retail prices were very consistent across plans for brand-name drugs, we did observe some variation across plans in the prices for generics. It is possible that some beneficiaries chose plans on the basis of these price differentials, which we did not address, as we assigned the same cost to a given drug across all plans. Again, the high cost of ARVs makes it less likely that price differentials among lower cost drugs was a strong driver of plan choice.
Discussion
This study allows us to examine whether PLWHA choose Part D plans that minimize their own spending. Examining plan choice in a group of beneficiaries sharing a single chronic disease for which the drugs are in a protected class that all Part D formularies must include, this study is able to focus on the drug plan characteristics that affect plan choice. As noted, the choice of plan should have been particularly straightforward for this population, because all ARVs are covered and because their high cost made it likely that beneficiaries would enter the catastrophic coverage phase early in the year. However, two-thirds of beneficiaries chose the higher cost basic alternative or enhanced alternative plans, despite these plans’ higher premiums. This resulted in higher total consumer spending, particularly when beneficiaries chose enhanced benefit plans.
The amount of overspending we detected in our sample of PLWHA was comparable to the amounts found in Abaluck and Gruber, 5 Heiss et al, 7 and Zhou and Zhang. 2 But the factors that others found responsible for unnecessarily high spending differed. Previous research focused on the Part D population as a whole, who were found to overemphasize premiums, having no deductible, and having gap coverage for generic drugs. However, for this population of PLWHA, who have extremely high expected brand-name drug costs, beneficiaries would have been better off had they paid more attention to premium. Plan features (such as lower copays, coinsurance, or deductibles and generic drug coverage in the gap) that reduce cost sharing may be worth extra premiums for the typical Medicare beneficiary, but are not necessarily valuable for a population with such high drug expenditures that they enter and exit the gap quickly. The bulk of expenditures for PLWHA occur during the gap and catastrophic benefit phases. As a result, annual spending does not differ greatly as a function of plan characteristics. Although our findings relate specifically to California PLWHA who use ARVs, these results may apply to other beneficiaries in the same situation, having chronic conditions requiring consistent use of expensive medications that push them quickly through the pregap and gap phases of the Part D benefit structure.
Previous research has shown that beneficiaries are better able to make cost-effective plan choices when fewer options are available 12 and that having available only a handful of choices could maximize consumer welfare. 5 In addition, the literature contains other policy ideas, including
Altering choice architecture in the fashion of a “sequential tournament,” where choice sets are kept small and only the most appealing options are part of the final choice decision, 13
Actually presenting less information in simpler-to-understand ways such as symbols rather than numbers, 14 or
Having CMS inform Medicare beneficiaries each year of which plan would be cheapest given each person’s current regimen of medicines. 15
Providing information, however, may not be a sufficient stimulus to beneficiaries who are not invoking deliberative reasoning. One suggestion proposed is to change an “opt-in” selection to an “opt-out” selection by assigning beneficiaries to the plan that would cost them the least, given their drug regimen, and allow them to “opt out” if they prefer another plan. 6
In the next few years, beneficiaries will be facing a changing and more complex landscape. By 2020, the doughnut hole will be closed under current law, so that beneficiaries in standard plans will be responsible for 25% of drug costs all the way up to the catastrophic phase. The beneficiaries’ 25% share will count toward reaching the catastrophic phase for both brand-name and generic drugs, while the treatment of the remaining 75% will differ. For brand-name drugs, 50% of costs will be covered by a discount from drug manufacturers that will count toward reaching the catastrophic phase, while the remaining 25% will be covered by the plans and will not count. For generic drugs, the entire 75% will be covered by the plans and will not count toward reaching the catastrophic phase.
Simultaneously, generic equivalents of some ARVs will become available. Beneficiaries and providers will have to determine both the medical advisability of switching to a generic ARV, as well as whether the lower price for a generic makes for a better choice. The latter decision involves calculating whether beneficiaries will be better off using brand-name drugs and taking advantage of the drug company discount and its contribution toward reaching the catastrophic phase. In addition, there will likely be changes in plan benefit structures and drug tier assignments in response to the closing of the doughnut hole and growth in availability of generic ARVs. All of these changes will present new challenges in predicting costs and choosing the lowest cost plan available.
Footnotes
Acknowledgements
The authors are grateful to Jennifer Gildner, MS, UCLA Department of Public Policy, for programming assistance.
Declaration of Conflicting Interests
The author(s) declared no potential conflicts of interest with respect to the research, authorship, and/or publication of this article.
Funding
The author(s) disclosed receipt of the following financial support for the research, authorship, and/or publication of this article: This research was supported by grants from the California HIV/AIDS Research Program (CHRP) of the University of California (grant RP11-LA-020). This work was also supported by the Center for HIV Identification, Prevention, and Treatment (CHIPTS) NIMH grant MH58107; the UCLA Center for AIDS Research (CFAR) grant 5P30AI028697; and the NIH/National Center for Advancing Translational Science (NCATS) UCLA CTSI Grant Number UL1TR000124.
This research was approved by UCLA IRB #G09-10-016-01.