
Abstract
Hospitals vary from one another in terms of their specialty, services offered, and resource availability. Their services are widely measured with scales that gauge patients’ perspective. Therefore, there is a need for research to develop a scale that measures hospital service quality in Asian hospitals, regardless of their nature or ownership. To address this research need, this study adapted the SERVQUAL instrument to develop a service quality measurement scale. Data were collected from inpatients and outpatients at 9 different hospitals, and the scale was developed using structural equation modeling. The developed scale was then validated by identifying service quality gaps and ranking the areas that require managerial effort. The findings indicated that all 5 dimensions of SERVQUAL are valid in Asian countries such as Pakistan, with 13 items retained. Reliability, tangibility, responsiveness, empathy, and assurance were ranked first, second, third, fourth, and fifth, respectively, in terms of the size of the quality gap. The gaps were statistically significant, with values ≤.05; therefore, hospital administrators must focus on each of these areas. By focusing on the identified areas of improvement, health care authorities, managers, practitioners, and decision makers can bring substantial change within hospitals.
Introduction
In the 21st century, all successful organizations adopt a customer focus as the central pillar of their strategic planning. The concept of quality originated in manufacturing organizations, but it is equally important for service organizations. It is now well recognized that the provision of quality services is closely associated with organizations’ incremental customer satisfaction,1-3 consumer maintenance,1-4 consumer allegiance, 5 budgets and productivity,6,7 facility assurance, 8 and economic presentation. 9
Similar to other service industries, health care has become a highly competitive and rapidly growing industry worldwide. 10 In the health care industry, patient observations are a focal point of service quality.11,12 Patient contentment is a principal decision-making tool in selecting health care services, 13 and service quality should meet customers’ expectations.14-17
SERVQUAL, created by Parasuraman et al, 17 is a widely used scale for measuring service quality in the service sector. Aghamolaei et al 18 argued that it is also suitable for measuring service quality in hospitals; however, its suitability must be evaluated in different contexts. Patients from various parts of the world have different expectations and perceptions of service quality based on the social, cultural, and economic conditions in which they live.
In countries such as Pakistan, the majority of the population lives in rural areas. 19 The people living in these areas have insufficient knowledge of their rights, especially with regard to health care services. 20 Thus, the current study was motivated to develop a scale for assessing the service quality of hospitals in countries such as Pakistan. In this study, SERVQUAL items were adapted to make the scale context specific for Pakistan to evaluate patients’ perception of service quality in hospitals.
Literature Review
Across the globe, economic conditions shape people’s expectations of service quality and their lifestyle. Customers’ perceptions play a vital role in the failure of any product or service. 12 Consequently, organizations develop tactics to provide greater service quality to customers to thrive in the current economic climate.17,21
The foundation of the service industry is the relationship between 2 parties: the consumer and service provider. 22 Many scholars have studied the connections among service quality, customer satisfaction, and behavior in several service organizations, particularly hotels and restaurants.6,12,23-25 They have found that service quality is an abstract and elusive concept 26 and is determined by customers’ personal understanding of their knowledge. 27
In hospitals, the customers are patients, and the service providers are doctors, paramedical staff, or nurses, who vary in terms of their intellectual skills, knowledge competencies, and professional attitude. Generally, services in hospitals are intangible, such as the skills of doctors, the hospital atmosphere, a caring staff, and hygiene, and they represent a combination of tangible and intangible products. Patients’ assessment of services is based on their entire understanding and shaped by the effectiveness of the operation, the hospital atmosphere, hygiene in rooms and wards, and the devotion of surgeons, nurses, and staff.
In the aggregate, the model “health care process quality” suggests a statistically significant positive association between procedure quality and patient fulfillment. Patients evaluate procedure quality based on, among other things, the actual procedures performed by surgeons, the communications between medical staff and patients, and the result of these interactions. 26 Both physicians and researchers have acknowledged the importance of service quality and become more devoted to it the past 2 decades.28,29
Seth et al 30 identified 19 models of service quality in diverse service settings (shown in Table 1). They revealed a close relationship between service quality and customer satisfaction. Earlier, Grönroos 31 noted that organizations must have the ability to influence the perceptions of consumers and should manage service quality by narrowing the gap between consumer expectations and perceptions. He described 2 distinct aspects of service quality in his model: technical and functional quality. Both of these aspects of quality shape the image of an organization. This image may be built by word of mouth, tradition, ideology, and public relations. 30
Service Quality Models.

Parasuraman et al 17 proposed a gap model that presented a set of discrepancies between the expectations and perceptions of service consumers. These discrepancies can be a hurdle for services to deliver high-quality services to consumers. According to those authors, this model depicts the consumer side of service, focusing on the magnitude and direction of each gap. Gap 1 is the difference between management’s perception of consumers’ expectations and consumers’ actual expectations. Gap 2 is the discrepancy between management’s perception of consumers’ expectations and the service quality specifications translated from those perceptions. Gap 3 is the difference between management’s perceived service quality specifications and the actual service delivered to customers. Gap 4 is the difference between the actual service delivery and the communication to consumers about the services delivered. Gap 5 is the difference between consumers’ expectations and perceptions of services. 30
After this exploratory research, Parasuraman et al 51 developed SERVQUAL, a more concise model to assess service quality within an organization. This model was continuation of a previous model in which 10 dimensions (tangibility, reliability, assurance, responsiveness, empathy, communication, competence, credibility, courtesy, and security) were decreased to 5 dimensions (tangibility, reliability, assurance, responsiveness, and empathy), with 97 items in the former model and 22 items in the latter.
Later, other models, such as the attribute service quality model, 32 suggested that in developing a service quality model, service attributes should be separated and then focused based on consumers’ expectations and perceptions simultaneously. The authors described 3 attributes of service: physical facilities and processes, people’s behaviors, and professional judgment. Similarly, other models described in Table 1 have been identified in the literature as enriching the current knowledge. However, none of these models has gained as much importance among academicians, professionals, and researchers as SERVQUAL.
Service Quality in the Health Sector
Health services are unique in identifying new challenges. Academics, practitioners, policy makers, and decision makers are still in the process of identifying valid tools to assess service quality.52,53
The health care facility can be divided into 2 quality dimensions: technical quality and functional quality. 31 Technical quality in health care is mainly related to technical correctness and medical analyses and techniques, whereas functional quality refers to how the health care service is provided to patients. 54 Furthermore, technical quality is about what the customers get, whereas functional quality is about how they get it. Ware and Snyder 55 state that although technical quality has high significance among patients, most patients do not have the information to assess efficiently the quality of the investigative and relaxing involvement procedure or material needed. Maximum patients cannot discriminate among the caring presentation and the curing presentation of doctors. 54
Through a system approach, quality standards are formulated according to needs, but most of them focus on the technical delivery of services and ignore the customer’s point of view. 56 This technical perspective focuses on the accuracy of diagnosis, success of procedures, and satisfaction of professional requirements at the facility. 57 As customers, patients describe the quality of services delivered in a limited way because they have insufficient knowledge about technical aspects of the service. Nonetheless, based on customers’ perceptions, expectations, and observations, both technical and nontechnical aspects of services can be evaluated. Patients’ feelings are crucial to improving services. 58 Patients’ arguments are important, in line with the “marketing concept,” which focuses on ensuring customer satisfaction and considering that patients are neither right nor wrong but satisfied. 59
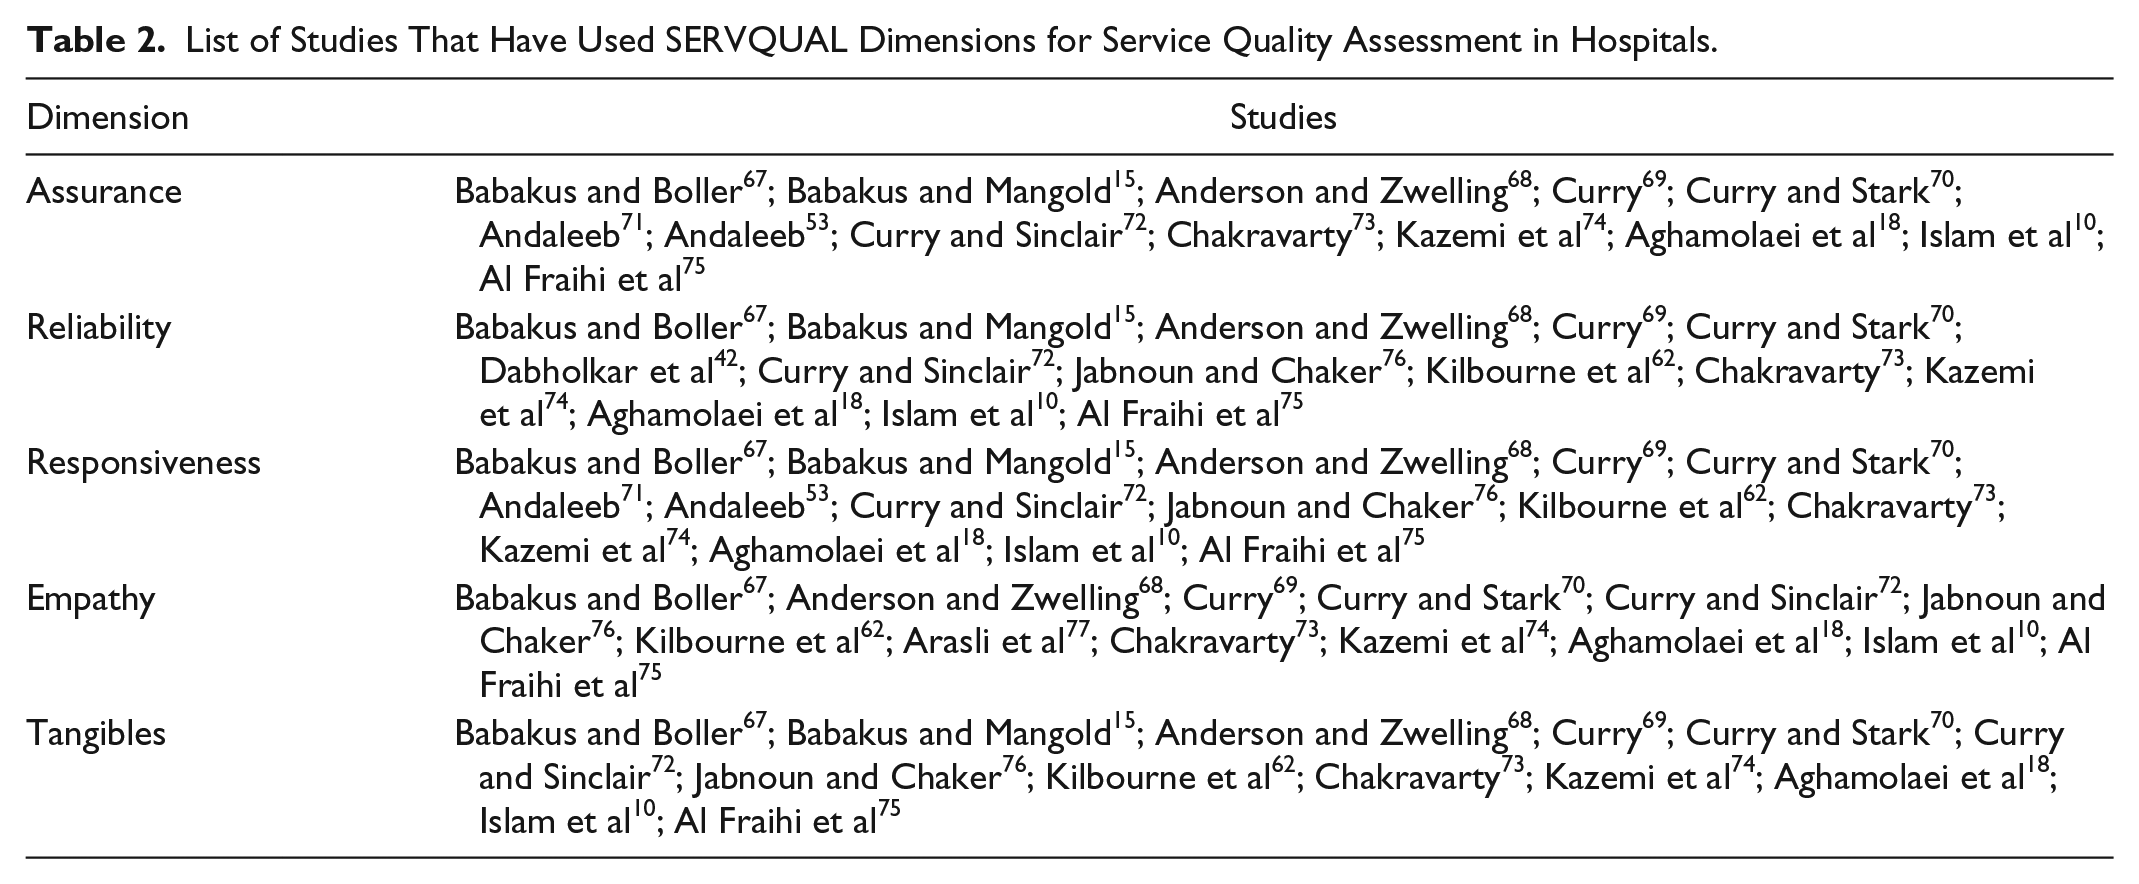
Service quality and patient satisfaction have a significant impact in health care. Patients’ perceptions of hospital facilities affect the image and cost-effectiveness of the hospital. 60 Perceived service quality also determines patients’ loyalty and word-of-mouth behavior. 53 Due to increased patient expectations, health care service workers have been encouraged to recognize the factors that are essential to expanding health care services, which can lead to patient satisfaction and allow health care services to decrease the time and money they spend. 61 The SERVQUAL instrument has been broadly used to measure the service quality of health care,15,16,54,62-66 as shown in Table 2.
List of Studies That Have Used SERVQUAL Dimensions for Service Quality Assessment in Hospitals.
Pakistan is the sixth most populated country, with a population of around 191.71 million. Its population growth rate is 1.92% as stated in the Pakistan Bureau of Statistics. 78 According to its constitution, the provision of health care services is the responsibility of federal and provincial governments, which plan and devise national health policies. The majority of people in urban areas go to public hospitals when they need care, 79 but these facilities are inadequate to serve the large numbers of people who use them. A strong government focus is required to support these services.
In Pakistan, service quality has been assessed by various researchers, such as Shabbir et al, 80 Sabir et al, 81 Irfan et al, 82 and Irfan and Ijaz. 20 They either used SERVQUAL or modified it; Sabir et al 81 studied service quality using SERVQUAL, whereas Irfan and Ijaz 20 and Irfan et al 82 studied hospital service quality using a modified version of SERVQUAL. The former studied service quality in Combined Military Hospital (CMH) and private and public sector hospitals and found that CMHs and private hospitals were a source to meet patient requirements due to timely treatment and other facilities, whereas later two studied public and private hospitals with the dimensions empathy, tangibles, timeliness, responsiveness, and assurance. They concluded that private hospitals deliver better services than public sector hospitals.
Methodology
A cross-sectional study was conducted at 9 hospitals (5 public and 4 private) in Lahore. The sample size was calculated as suggested by Hair et al, 83 and 340 valid questionnaires were administered to both inpatients and outpatients. The questionnaire was self-administered using a simple random sampling method. Hospitals were selected based on convenience and permission granted by hospital authorities to conduct the study. The study instrument was primarily based on standard SERVQUAL items 17 and also context-based items from Irfan and Ijaz. 20 The designed tool was discussed with experts of service quality to obtain content validity. The modified form comprised 68 items and 6 dimensions. These dimensions included tangibles (8 items), reliability (5 items), responsiveness (7 items), assurance (5 items), empathy (5 items), and timeliness (3 items) each for the perception and expectation measurements. All statements were measured on a 5-point “Agree-Disagree” Likert scale. 84 The instrument was translated into Urdu through a careful translation and back-translation process. 85 First, the author translated the 68-item scale into Urdu; then, experts back-translated the items into English to ensure that the original content was preserved in the translation. 86
Informed patient consent was also obtained prior to the questionnaire completion. Pilot testing was conducted by collecting feedback from 15 patients (7 outpatients and 8 inpatients, based on convenience) to assess the content validity and to ensure that the statements were easy for respondents to understand. These responses were not included in the study. 87 The Cronbach alpha coefficient was calculated to measure the reliability of the scales, and the values were found to be greater than 0.7, indicating high reliability. 88 Then, patients were instructed to fill in questionnaire after they provided informed consent. Ethical approval for the research project was obtained from the institutional review board. Patients aged 18 years or older were allowed to participate in the study, and their responses were calculated and analyzed. The data analysis was carried out using IBM SPSS version 20 and IBM AMOS version 20.
Results and Discussion
Sample Characteristics
The characteristics of study participants are described in Table 3. Of the participants, 10.6% were aged 18 to 20 years, 28.5% were aged 21 to 30 years, 29.7% were aged 31 to 40 years, and 31.2% were older than 40 years. In addition, 23.4% were uneducated, 23.2% had a high school degree, 22.9% had higher secondary school degree, 23.5% were college graduates, 13.2% had a postgraduate education, and 0.3% had a PhD. In addition, 58.8% were patients at public hospitals, and 41.1% were patients at private hospitals.
Characteristics of Study Participants.

Monthly income was 10 000 to 19 000 PKR for 42.1% of participants, 20 000 to 50 000 PKR for 35.3%, 50 000 to 100 000 PKR for 16.5%, and more than 100 000 PKR for 6.2%.
Development of Perception-Based Scale
To measure sampling adequacy, Kaiser-Meyer-Olkin (KMO) and Bartlett tests were performed, and the values were found to be significant (KMO value: 0.914; P value: 0.000). Based on patient perception data, a covariance matrix was created between service quality dimensions, and the first run of the confirmatory factor analysis (CFA) provided satisfactory goodness of fit with the deletion of the “timeliness” dimension (with factor loadings ≤0.5).
Scale reliability and validity
Items used in the service quality measurement tool were screened earlier using CFA to establish whether the items actually measured their assigned practices. The unidimensionality, reliability, convergent validity, and criteria-related validity were also assessed.
Unidimensionality analysis
CFA was used to evaluate the unidimensionality of service quality constructs. The cutoff value of the comparative fit index was suggested by Bentler and Bonnet 89 to be 0.90. However, others, such as Hu and Bentler 90 contended that this value should be 0.95 for a strong fit and that the RMSEA value should be less than 0.08. Table 4 indicates that the CFI value is 0.962, and the RMSEA value is 0.087. The values mentioned above indicate that the constructs are unidimensional.
Summary of Goodness-of-Fit Statistics for CFA of Model Constructs.
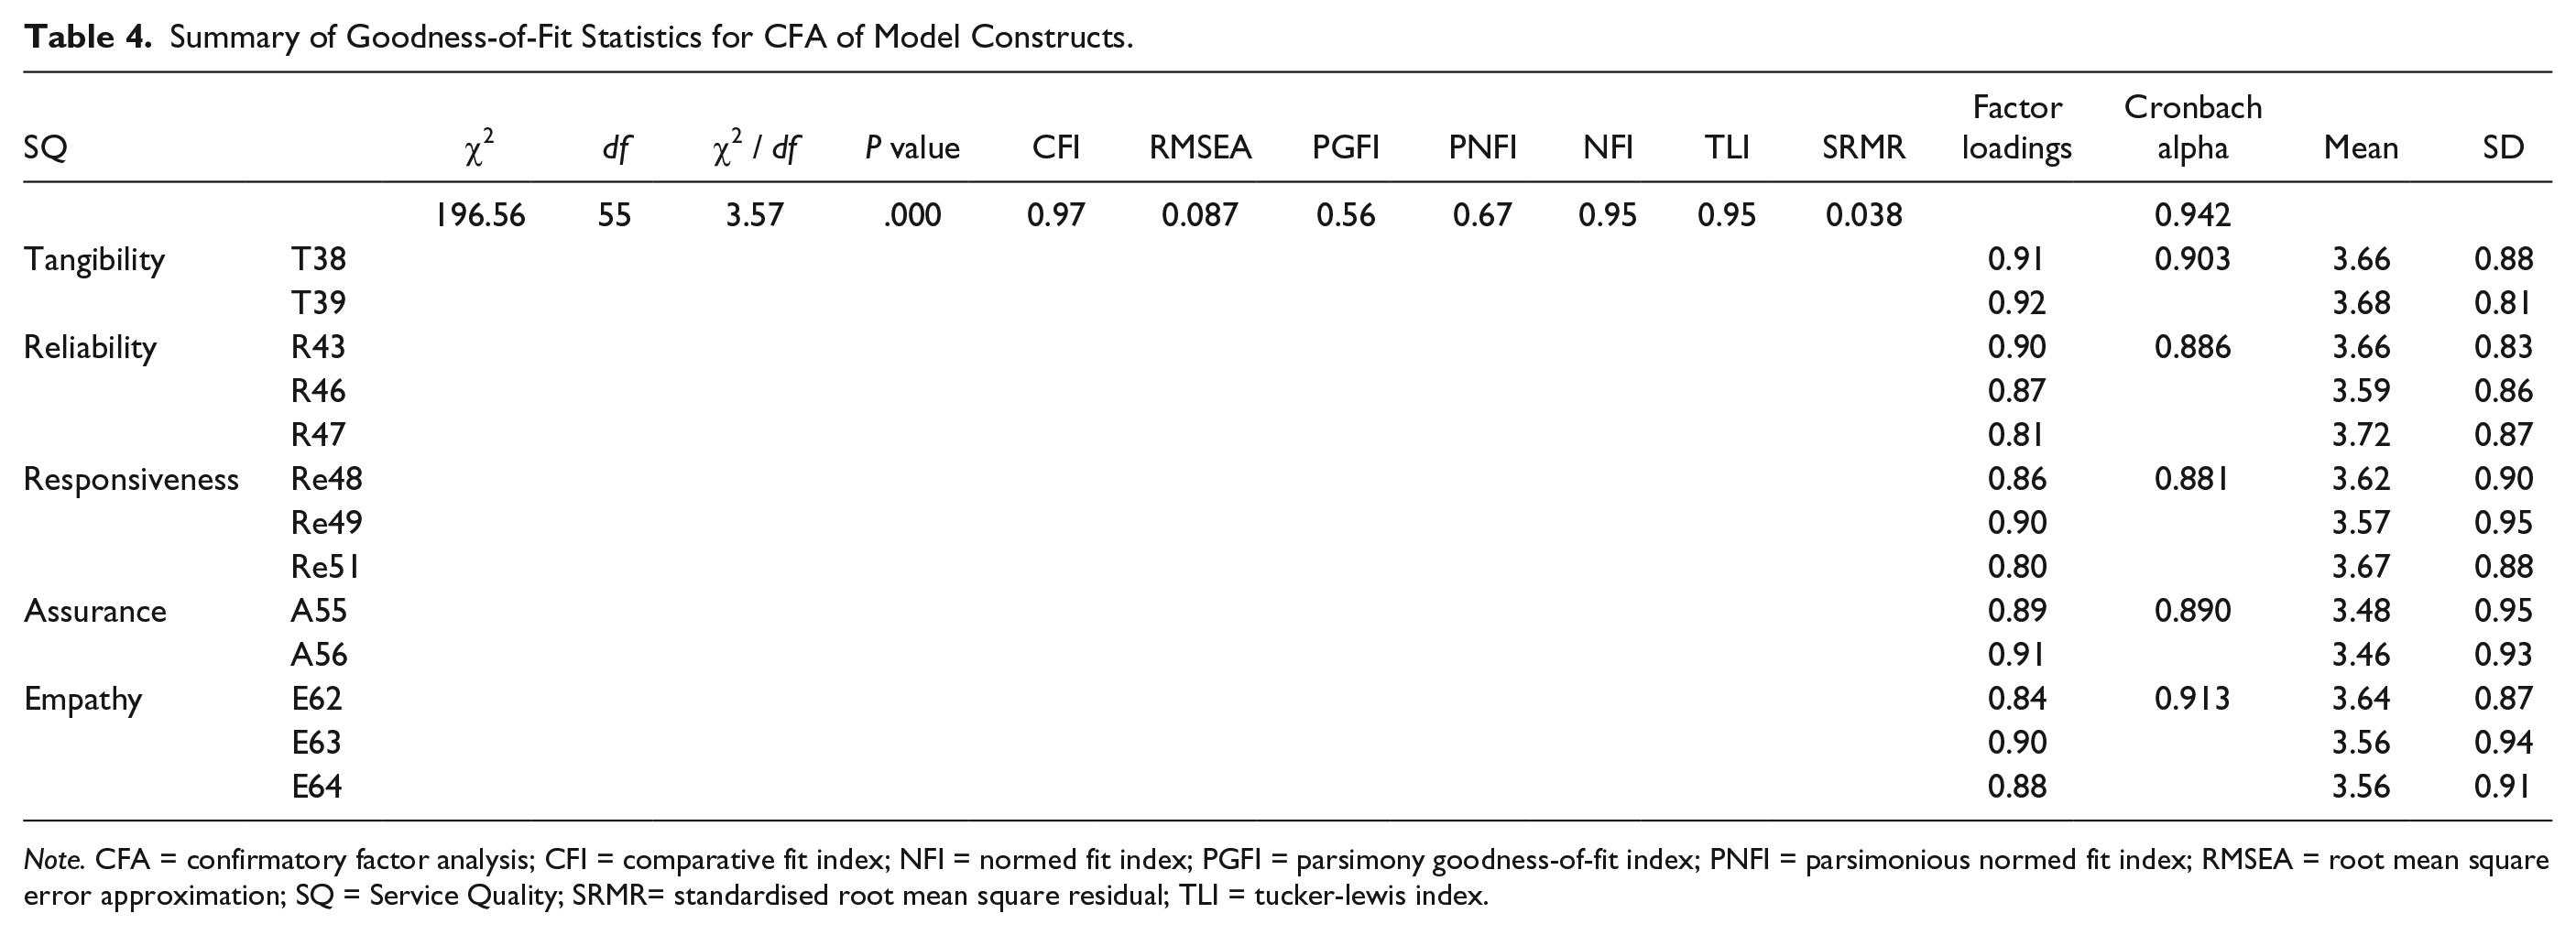
Note. CFA = confirmatory factor analysis; CFI = comparative fit index; NFI = normed fit index; PGFI = parsimony goodness-of-fit index; PNFI = parsimonious normed fit index; RMSEA = root mean square error approximation; SQ = Service Quality; SRMR= standardised root mean square residual; TLI = tucker-lewis index.
Reliability analysis
The Cronbach alpha value is used to evaluate the reliability of the constructs. This value is more than 0.70, which indicates reliability of the construct. 91 As shown in Table 4, the alpha value for the 5 dimensions ranges from 0.889 to 0.920. The overall value of Cronbach alpha for the service quality construct is 0.947. These values show that all constructs are extremely dependable.
Convergent validity
Bagozzi et al 92 suggested that CFA can be used to evaluate convergent validity and that convergent validity can be established if all factor loadings have significant values on their respective constructs. As shown in Table 4, all factor loadings range from 0.79 to 0.92 and are significant on their respective constructs.
The proposed service quality model of 5 dimensions is shown in Figure 1. The CFA evaluated the proposed modeled constructs. These constructs are actually quality dimensions that are built on collected data. Multiple items were converted to single construct that reflected the quality dimension. The goodness-of-fit statistics used to assess the fit of the data for the proposed model are shown in Table 5. The values of RMSEA = 0.08, CFI = 0.969, χ2 / df = 3.57, PGFI = 0.557, and PNFI = 0.669 indicate a satisfactory fit of the model. Therefore, these values indicate that the structural model has the best fit. 93

The theoretical framework for perceived service quality among patients.
Measurement of Service Quality Gap and Its Statistical Significance.

This perception-based model, which was validated by CFA, consists of 5 dimensions and 13 items, 2 each for tangibility and assurance and 3 each for reliability, responsiveness, and empathy. The tangibility items were “the beds in the hospital are highly hygienic” (t-38) and “the rooms in the hospital are hygienic and ventilated” (t-39). The reliability items were “the hospital is trustworthy for its patients” (r-43), “the investigations conducted in the hospital are reliable” (r-46), and “the consultation provided by the doctors is trusted” (r-47). The responsiveness items were “the hospital always provides its services within the promised time limits” (re-48), “the hospital’s employees provide services to its customers quickly” (re-49), and “the hospital employees are fully trained in their fields” (re-51). The assurance items were “employees of the hospital have developed a level of trust among their patients” (a-55) and “the hospital employees receive adequate support from top management to do their jobs well” (a-56). The items for empathy were “the hospital is committed to working in the best interest of the patient” (e-62), “the hospital has operating hours convenient to all their patients” (e-63), and “the hospital workforce is concerned and sympathetic towards patient’s issues” (e-64).
Measurement of quality gap
Based on the retained items, the quality gap was calculated by subtracting the scores of patients’ expectations of service quality from their perceptions of service quality, and these scores were compared with similar items to validate the scale in Table 5. The Wilcoxon signed-rank test was applied to measure the significance of the gaps between all dimensions. The results showed the mean perception-expectation (P-E) gap for tangibility was −1.01 ± 0.98, for reliability was −0.98 ± 0.92, for responsiveness was −1.05 ± 0.95, for assurance was −1.19 ± 1.04, and for empathy was −1.10 ± 0.96. These gaps were consistent with the findings of other studies18,75 and demonstrated the need to concentrate on all areas of service quality to satisfy patients. Managers and decision makers should lean forward, listen the voices of patients, and try to bridge the existing gap.
The validity of the scale items was tested by measuring the quality gap, and they were found to be valid, as a significant gap existed between patients’ expectations and perceptions. This indicates that patients were dissatisfied with the quality of services they received and that next time, they may switch to another facility for better services. This may lead to a poor image of the hospital in the community. Reliability appears to require more focus as it was ranked first, and patients lacked trust in services provided by the facility providers. The gap in tangibility ranked second, which may indicate that the resources were scarce or improperly utilized or maintained. Gaps in responsiveness ranked third, which may indicate that there is lack of hierarchy and a lack of management interest in employee training regarding customer service. The 4th- and 5th-ranked gaps also need attention for services to be convenient for patients and for staff to be more committed and sympathetic to patient needs.
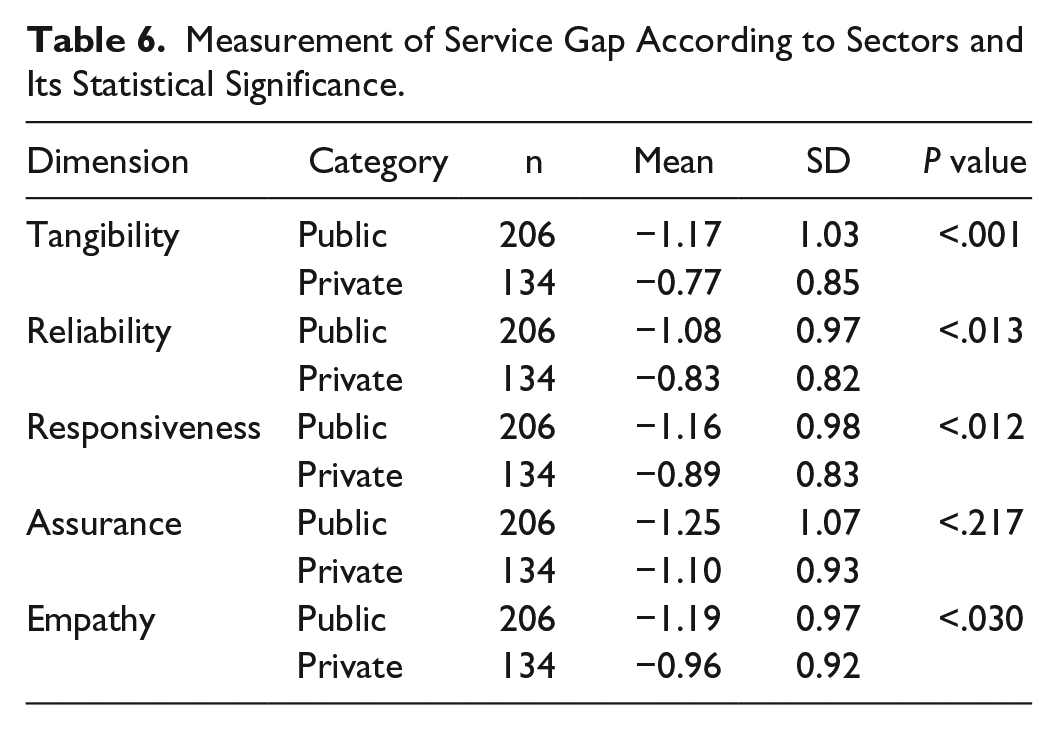
The P-E gap calculated for each dimension in different sectors (public and private) was also calculated (Table 6) and found to be significant in each dimension except assurance (P ≥ .05). The mean gap in all dimensions was higher in public hospitals than in private ones, indicating that private hospitals are better than public ones. These results are in line with the findings of Angelopoulou et al 94 reinforcing the fact that patients across the world go to private hospitals for higher service quality.
Measurement of Service Gap According to Sectors and Its Statistical Significance.
Conclusion
The model developed in this study has both theoretical and practical implications. Regarding theoretical contributions, many researchers have developed service quality models based on SERVQUAL 71 or applied SERVQUAL in their own cultural context 18 ; however, such studies are scarcely conducted in Asian countries such as Pakistan.
In management research, it is also well known that different contexts can lead to varied results. 95 Therefore, this research bridges the gap in theoretical contributions in the form of developing a service quality model based on modified SERVQUAL dimensions that are appropriate for public and private hospitals in Asian countries such as Pakistan. This study evaluates the meticulous understanding of patients regarding the services they receive and then compares it with their expectations. 74
The current study is limited in that it examines only the patient perspective, and patients are not completely knowledgeable of the services delivered to them; therefore, there is a need to investigate the view point of health care providers. Another limitation is that although we investigated service quality based on the SERVQUAL questionnaire and later adapted some items from the literature, there is need for qualitative studies to investigate more service quality dimensions.
For researchers, this study contributes by testing the applicability of SERVQUAL in developing countries such as Pakistan. This model was developed in the European context and needed to be evaluated in a developing area; therefore, more studies with the items suggested in this study and/or items from a more in-depth literature review should also be conducted in hospitals with a larger sample size to see whether the scale developed in this study is useful in similar situations to make generalizations.
Footnotes
Acknowledgements
The authors thank Higer Education Commission, Pakistan, University of the Punjab, Lahore, Pakistan for financial support; all volunteer patients who participated in this research project and hospital management that was instrumental to conduct the study.
Author Contributions
Each author contributes equally in conceptualization of idea, research work, manuscript writing and revision except Muhammad Shafiq who supervised the conduct too.
Declaration of Conflicting Interests
The author(s) declared no potential conflicts of interest with respect to the research, authorship, and/or publication of this article.
Funding
The author(s) disclosed receipt of the following financial support for the research, authorship, and/or publication of this article : The author(s) received partial financial support from Higher Education Commission, Pakistan and University of the Punjab, Lahore, Pakistan for current study.