
Abstract
From 2004 to 2014, the overall abortion rate in Texas fell by almost a third from 10.7 to 7.2 abortions per 1000 women aged 10 to 49 years. During this same period, the number of abortion clinics operating at least 6 months in the year fell from 40 to 27. We examined the relationship between the abortion rate and the proximity of abortion facilities. We matched annual, county-level data on abortion rates in Texas from 2004 through 2014 with the distance from the county centroids to the nearest abortion facility in operation. Linear regressions were used to estimate the association between abortion rates and proximity to abortion facilities. The regressions controlled for county-level and state-level characteristics as well as the availability of abortion services in neighboring US states and Mexico. We found that a 100-mile increase in distance to the nearest abortion facility was associated with a 10% decrease in the overall abortion rate. The relationship appeared to be driven largely by distances of 200 miles or more. The overall relationship was generally present for whites and blacks, whereas the pattern was less clear for Hispanics. The analysis indicated that the overall association was driven largely by women aged 20 to 34 years. Decreased access to abortion facilities was associated with decreases in the abortion rate, yet the relationship varied by race/ethnicity and age. As such, regulations that affect the operational status of abortion facilities likely have differential effects on women.
Introduction
From 2000 to 2008, the number of abortion facilities in the United States remained relatively constant at approximately 1800 and then decreased somewhat to 1720 by 2011. 1 However, since 2011, 162 facilities have closed while only 21 have opened. 2 A potential important factor leading to the closing of abortion facilities during this time is state targeted regulation of abortion providers (“TRAP”) laws that require clinics to meet certain conditions to operate. As of 2016, 28 states had enacted restrictions on abortion facilities, the clinicians, or both. 3
Since 2004, Texas has implemented restrictions involving second trimester abortions4,5 and stopped funding family planning clinics affiliated with organizations that provided abortion services. 6 House Bill 2 (HB2), signed into law in 2013, contained a number of restrictions on abortions. One provision required that doctors who provide abortion services must have admitting privileges at a hospital no further than 30 miles from the clinic. Abortion facilities were mandated to meet structural standards similar to those of surgical centers. HB2 also banned abortions 20 weeks or later post fertilization (with an exception for risk to the pregnant woman or fetal abnormality) and set new restrictions on medical abortions. In the time from when HB2 was debated until it was implemented, the number of abortion clinics operating in Texas fell from 41 to 22. 7
We examined the relationship in Texas between annual, county-level abortion rates and proximity to abortion facilities from 2004 to 2014. Our regression analysis controlled for year-specific and county-specific factors that may have influenced abortion rates. Furthermore, we accounted for the availability of abortion services in neighboring states and Mexico. Our work contributes to the literature that analyzes the effect of distance to health care providers or clinics on health outcomes and utilization.8-10
Data and Methods
Data Sources
Our sample was all 254 counties in Texas during 2004-2014. From Texas Vital Statistics reports, 11 we obtained annual, county-level abortion counts. The counts were restricted to women who were confirmed to be Texas residents and for whom their county of residence was known and include only in-state abortions. To calculate abortion rates, we matched the counts to annual, county population estimates from the US Census Bureau.12,13 For each of the overall and subgroup analyses, we excluded counties from the respective sample in which the population was not at least 100 for each year of the sample period. The overall rates are per 1000 women aged 10 to 49 years.
In addition to overall abortion counts, we obtained from Texas Vital Statistics reports counts by race/ethnicity (white, black, Hispanic) and age group (10-40 years by 5-year increments and 40-49). Rates for these subgroups were calculated by dividing the counts by the relevant population in that county and year.
The locations of Texas abortion facilities were obtained through open records requests to the Texas Department of State Health Services of clinics and ambulatory surgical centers (ASCs) licensed to perform abortions in Texas since 2004. The dates of operation are based on dates during which the licenses were effective. A facility was classified as operating in a given year if its license was effective for at least 6 months. Using license dates may overstate the period during which a facility was in operation. Specifically, a clinic may have ceased performing abortions even though its license was in effect. These instances would attenuate the regression coefficients we estimate, as the resulting decrease in the abortion rate would not be correlated in our data with an increase in the distance to the nearest clinic. The facility’s street address was used to obtain its geographic coordinates.
The determination of cities in neighboring states with abortion facilities was based on current state license records, open records requests, review of online documentation, and phone calls to facilities. Using information from the US Census Bureau, 14 we computed the centroid of the urban area where these facilities are located and assigned those coordinates as their geographic location.
Texas residents have been known to enter Mexico to purchase medications to induce abortions that are only available in the United States with a prescription. 15 To account for this possibility, we obtained the locations of all 27 border crossings between Texas and Mexico. 16
We calculated the geodesic (“as the crow flies”) distance from each Texas county centroid to every Texas abortion facility, every city centroid in a neighboring state with an abortion provider, and every Texas border crossing to Mexico.
Statistical Analysis
We employed linear regression to assess the relationship between changes in the distance to the nearest abortion facility and abortion rates. The estimated models were as follows:
model 1:
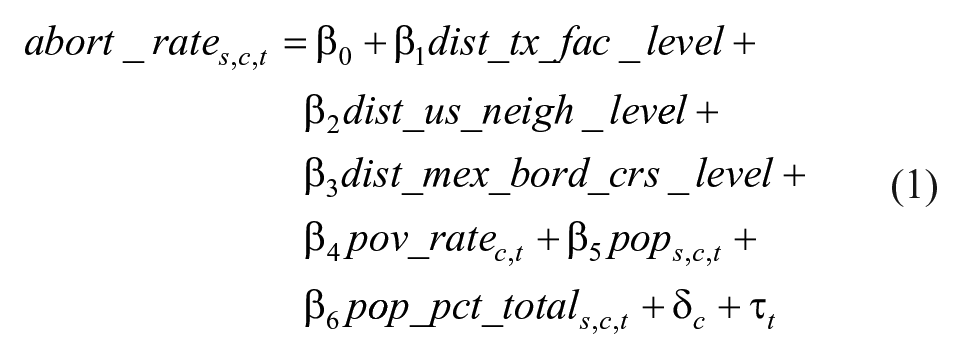
model 2:

where s denotes the subgroup, c denotes the county, and t denotes the year.
The dependent variable was the abortion rate (abort_rate). We estimated separate regressions for each type of rate (overall, by race/ethnicity, and by age).
We employed two models to gain insight into the relationship between abortion rates and distance to the nearest clinic. In model 1, distance was measured as the actual mileage (dist_tx_fac_level), and thus, β1 estimated the change in the abortion rate associated with a 1-mile increase in distance to the nearest abortion facility, holding the other explanatory variables constant.
Model 2 follows earlier studies and examined distance thresholds of 0 to 50 miles, 51 to 100 miles, 101 to 200 miles, and greater than 200 miles. Indicator variables (dist_tx_fac_51_100_ind, dist_tx_fac_101_200_ind, and dist_tx_fac_201_plus_ind) were used to denote whether the facility nearest to the county centroid was in the specified range. Given the reference case was 0 to 50 miles, γ1 measures the average difference in the abortion rate for a county in which the nearest facility was 51 to 100 miles from its centroid relative to the rate for a county in which the nearest facility was within 50 miles of its centroid. γ2 and γ3 have corresponding interpretations for 101 to 200 and 201+ mile thresholds.
To maintain consistency with the Texas distance measures, the distance measures to the nearest facility in a neighboring state or nearest border crossing also differed in models 1 and 2. In each model, a separate variable was used corresponding to the nearest US city with a facility and the nearest Mexican border crossing. In model 1, the respective variables (dist_us_neigh_level and dist_mex_bord_crs_level) equaled 0 if the nearest US city or border crossing was not closer than the nearest Texas facility in that county/year and the difference in distance if it was closer. Indicator variables (dist_us_neigh_ind, dist_mex_bord_crs_ind) were used in model 2 that equaled 1 if the nearest US city or Mexican border was closer than the nearest Texas facility in that county/year and 0 otherwise.
The panel nature of our data allowed for the use of both county and year fixed effects that resulted in more precise measures of the relationship between abortion rates and proximity to abortion facilities. The county fixed effects (α c ) controlled for any county characteristics that may be associated with the abortion rate and did not vary during the sample period. For instance, these effects captured cultural differences across counties that impacted abortion rates and did not vary during 2004-2014. Analogously, the year fixed effects (π t ) controlled for any statewide factors specific to a given year that were related to the abortion rate. These effects captured state-level trends over time in the demand for abortions. The inclusion of fixed effects implied that our coefficient estimates measured the effects of within-county variation of explanatory variables.
Given the presence of county and year fixed effects, additional control variables were limited to those that varied within county during our sample period. The poverty rate (pov_rate) was included to account for the potential of financial hardship affecting the abortion rate. The population level (pop; overall and by subgroup, where applicable) and percentage of total (pop_pct) were included to account for the possibility that the number or proportion of women in the given subgroup could be related to the abortion rate.
The error terms were clustered by county to account for the potential of error terms not being independent within counties while the observations were weighted by the square root of the population. All calculations were performed in Stata 14. 17
Results
State Trends
Figure 1 shows state abortion rates in Texas from 2004 to 2014. Panel A shows the overall rate, whereas panels B and C display the rates by race/ethnicity and age, respectively. The overall rate peaked at roughly 11.5 in 2006 and then decreased at a roughly constant rate until reaching a minimum of 7.2 in 2014. The graph in panel B indicates that the rates were generally falling for all 3 groups during the sample period, but the decrease began later for blacks. The graph by age group shows an especially large drop for the 20-24 age group from more than 31 in 2006 to approximately 18 in 2014.

Texas abortion rates, overall, by race/ethnicity, and by age, 2004-2014.
Figure 2 depicts the number of abortion facilities in Texas, where the total line is the sum of the number of clinics and ASCs. The number of clinics was relatively flat through 2010 and then dropped somewhat in 2011 followed by significant drops in 2012-2014. While the number of ASCs increased throughout the period, they only partially offset the decreases in clinics at the end of the sample period.
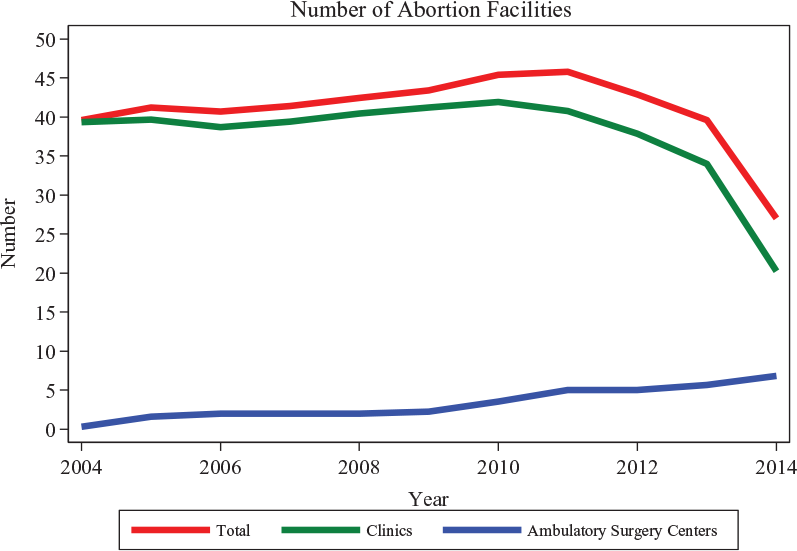
Texas abortion facilities, 2004-2014.
The figures indicate that while both abortion rates and facilities fell during the 2004-2014 period, the timing of the drops did not perfectly coincide. The county-level analysis that follows employed more granular data to explore the relationship between abortion rates and distance to the nearest clinic.
County-Level Analysis
Table 1 shows the characteristics of the variables employed in the regressions, both over the entire sample period and for the first and last years in the period. Unlike the mean state-level abortion rates depicted in Figure 1, these values represent rates averaged by county.
County-Level Characteristics, 2004-2014.

Note. For the variables other than abortion rate, the means and standard deviations are based on the sample for the overall abortion rate.
While the mean overall county abortion rate was 5.8 over the entire period, it fell from 6.4 in 2004 to 3.3 in 2014. The second section in Table 1 describes the average values describing proximity from county centroids to the nearest Texas abortion facility. The average distance for the entire sample period was 74.5, but from 2004 to 2014, the mean increased from 81.2 to 121.7. Likewise, the percentage of counties for which the nearest facility was more than 200 miles away increased from 1.2% to 23.9%.
Table 2 details the coefficient estimates for the Texas abortion facility distance measures in regressions where the dependent variable was the overall abortion rate. The second column contains the estimates for model 1 in which distances were used to measure proximity to abortion facilities, whereas the third column contains estimates for model 2 in which indicator variables were used.
Coefficient Estimates for Overall Abortion Rate Regressions.

Note. The dependent variable is the overall abortion rate per 1000 women aged 10 to 49 years. The county fixed effects coefficients are not shown. The observations are weighted by the square root of the county population, and the errors are clustered by county. The sample excludes counties in which the population was not 100 or greater in every year of the sample period.
Significant at the 5% level. ***Significant at the 1% level.
The −0.005 coefficient on distance to Texas abortion facility for model 1 indicated that for every additional mile to the nearest facility from a county’s centroid, the county abortion rate fell on average by 0.005. The coefficient was statistically significant at the 1% level and corresponded with a 10% drop in the rate (based on the sample average) for every 100-mile increase.
The coefficients for the Texas abortion facility indicator variables suggested that the overall relationship was driven by counties for which the distance to the nearest clinic increased from 0-50 miles to more than 200 miles. Relative to having a clinic within 50 miles, having the nearest clinic within 51 to 100 or 101 to 200 miles was associated with a negative but statistically insignificant relationship with the county abortion rate. However, the −1.18 coefficient for the 201+ miles variable was statistically significant and corresponded to an approximately 20% lower abortion rate.
The coefficients for the year fixed effects indicated the presence of significant state-level effects. The negative and increasing coefficients for the latter years suggest that factors beyond increased distance were associated with lower abortion rates. There were no statistically significant relationships in either model for measures of abortion services in neighboring US states or Mexico.
Table 3 details the coefficient estimates for the Texas abortion facility distance measures in regressions where the dependent variable was the abortion rate for specific race/ethnicity or age subgroups. The second column corresponds to model 1, whereas the last 3 columns contain the coefficient estimates for the 3 indicator variables in model 2. The coefficients for the overall results in Table 1 are repeated in the first row.
Coefficient Estimates for Distance Measures by Subgroup Regression.

Note. Each row corresponds to the sample for that subgroup. The samples exclude counties in which the population for that subgroup was not 100 or greater in every year of the sample period. The dependent variable is the abortion rate per 1000 women for the specified subgroup. The coefficients shown are for the distance measures in the specified regression. The explanatory variables that are not shown above are proximity to US cities in neighboring states with abortion facilities, proximity to Texas-Mexico border crossings, poverty rate, population, percentage of total population, time fixed effects, and county fixed effects. The observations are weighted by the square root of the county population, and the errors are clustered by county.
Significant at the 10% level. **Significant at the 5% level. ***Significant at the 1% level.
The coefficients for whites and blacks exhibited a similar pattern as the overall results. There existed a negative relationship when the distance was employed as the explanatory variable, while the coefficients on the indicator variables indicated the effect was strongest for instances when the nearest facility was greater than 200 miles away. However, the whites’ coefficient estimate also indicates a negative relationship for counties in which the nearest clinic was 101 to 200 miles away. While the coefficients for blacks are larger than for whites, the relatively higher abortion rates for blacks imply that the percentage effects were roughly similar. For Hispanics, the distance coefficient is nearly zero, while there exists a surprisingly positive and large coefficient for the corresponding 51-100 mile indicator variable.
The results by age group suggest that the overall relationship between abortion rates and distance to the nearest clinic was driven by the 20-24, 25-29, and 30-34 groups. The distance coefficients for the latter 2 groups are statistically significant at the 5% level and correspond with a roughly 7% decrease in the abortion rate for every 100 additional miles from a facility. The coefficient for the 20-24 age group is of similar magnitude but not statistically significant. The indicator variables for these 3 groups follow the previously observed pattern of greatest magnitude on the 200+ miles, but the estimates are noisy. None of the coefficients for the other age groups statistically differ from 0.
Discussion and Conclusions
Given the state’s abortion regulations, reduction in number of facilities, and high-quality county-level data, Texas is an important case study of overall US abortion trends. Our study follows existing research that links the impact of proximity to health care providers or clinics on utilization, including studies that analyze the effects of distance to Supplemental Nutrition Program for Women, Infant and Children clinics in Texas, 10 women’s clinics in Texas and Wisconsin, 8 and abortion facilities in New York. 9
Our results are consistent with previous studies that found increased burden 18 and decreased abortion rates 7 associated with facility closings in Texas. While our estimate of a 10% decrease in the abortion rate associated with an increase of 100 miles to the nearest clinic is seemingly large, it is roughly in line with an earlier estimate of a 13% drop in the statewide abortion rate due to Texas abortion clinic closings. 7 However, as other studies have found, our estimates indicate that other factors also contributed to the drop in abortion rates. 1
Our analysis also highlights the differential effects that facility closings have depending on geography, race/ethnicity, and age. Our estimates indicate that the closings had the largest effect on counties for which the distance of the closest clinic increased from 0-50 miles away to more than 200 miles away. In our subgroup analysis, the presence of statistically significant relationships varied by race/ethnicity and age, suggesting that the effects of closings are not constant across these demographic categories.
Limitations
Our study suffers from a number of limitations. First, a disproportionately large number of facility closings (and thus increases in distance to the nearest facility) occurred in a 2-year period at the end of our sample. Abortion data beyond 2014 are unavailable, and we are thus unable to extend our analysis. As a robustness check, we repeated our analysis but omitted 2014 from the sample period. The model 1 point estimate in our overall rate regression was unchanged from −0.005 but was no longer statistically significant.
Our study is further limited by the inability to control for contraception access. During our sample period, state funding for family planning services dropped significantly and may have increased the number of unintended pregnancies, thus potentially increasing the number of abortions. While our year fixed effects control for statewide changes in contraception access, the funding cuts likely affected counties differentially. If the extent to which counties experienced funding cuts is not correlated with the distance to the nearest abortion clinic, our coefficient estimates would be unaffected but have larger standard errors. Alternatively, given that decreased planning services funding likely increased the distance to contraception services concurrently with increases in the distance to abortion clinics, our estimates may be biased toward zero.
We are also unable to perfectly control for the availability of medical abortions outside of a doctor’s supervision. We believe that our use of Mexico border crossings in our estimations is an improvement over past techniques and addresses an important channel. However, women were also potentially able to obtain abortion medications within Texas and online.
Another limitation is our inability to assign causal interpretations to our coefficient estimates. In some respect, the closing of facilities due to the implementation of HB2 was an exogenous shock that would allow us to interpret our coefficients as representing the effects of closings on abortion rates. However, HB2 contained provisions beyond those involving facilities that could have also affected abortion rates. Furthermore, closings before HB2 may have been endogenously determined due to reverse causation or unobserved factors influencing both abortion rates and closings.
Summary and Future Research
Our study examines the relationship between the distance to the nearest abortion clinic and the abortion rate using data from Texas for the 2004-2014 period. We find that increases in the distance to the nearest abortion clinic were associated with reductions in the abortion rate, especially for larger distances and for younger women. However, our analysis also indicates that other factors appear to have contributed to the reduction in abortion rates.
There are a number of directions that future research could provide greater detail into the relationship between abortion clinic proximity and abortion rates. For instance, although we attempt to control for out-of-state abortion access, we cannot perfectly control for abortions outside of Texas. Furthermore, we cannot measure the number of medical abortions that occurred outside of a doctor’s supervision. Data that capture these abortions would potentially allow for insight into the extent to which the decrease in abortion rates that we observe is due to fewer abortions or substitution to other means of abortion.
A similar analysis of other states would also be helpful in establishing whether our findings are specific to Texas during this time period. Finally, extending the sample period would provide information regarding the long-term effects of changes in clinic proximity, especially given the vast majority of clinic closings occurred in the last 2 years of our sample.
Footnotes
Acknowledgements
The authors acknowledge the helpful assistance provided by Sara Richards of the Open Records Office of the Texas Department of State Health Services.
Declaration of Conflicting Interests
The author(s) declared no potential conflicts of interest with respect to the research, authorship, and/or publication of this article.
Funding
The author(s) received no financial support for the research, authorship, and/or publication of this article.