
Abstract
Investment, especially through merger and acquisition (M&A), is a leading topic of concern among health care managers. In addition, the implications of this activity for organization and market concentration are of great interest to policy makers. Using a sample of 2256 firm-year observations in the health care industry during the period from 1985 to 2011, this article provides novel evidence that managers learn from financial markets in making capital expenditure (CAPEX) and M&A investment decisions. Within the industry, managers in the Drugs subsector are most likely to do so, whereas managers in the Medical Equipment and Supplies are least likely to do so. We find informative stock prices improve firm financial performance. This article highlights the importance of financial markets for real economic activity in the health care industry.
Keywords
Introduction
Investors collect, analyze, and interpret firm-related information to create their own private firm-specific information. This information can be about the demand for the firm’s products or about strategic issues, such as competition with other firms. 1 Informed investors trade on their private firm-specific information so that this information is stored in stock prices as stock price firm-specific information. 2 The first present direct evidence that managers learn from this information is in capital expenditure (CAPEX) decisions. 1 Stock price firm-specific information significantly increases the sensitivity of CAPEX to Tobin’s Q, the stock price–based measure of the value of firm fundamentals, suggesting that stock price firm-specific information provides managers new information in their decision making. In other words, managers learn from financial markets. 1
Some may wonder why outside investors possess firm-specific information that managers, who run the business daily, do not have. We do not argue that managers know less than outside investors do. However, it is possible that managers do not possess every piece of information related to firm valuation. A firm’s valuation depends not only on internal information about business operations but also on external information, such as the state of the economy, the position of competitors, the demand by consumers, and so on. 3 Outside investors discipline the market and related information can be useful to managers. Stock prices aggregate many investors’ information offering considerable firm-specific information not known by managers.
Recently, the stream of literature about manager learning from financial markets has grown rapidly. It extends from CAPEX to cash savings, dividend payments, seasoned equity issuance, labor investment, and M&A investment.4-10 These studies argue that when stock prices reflect more firm-specific information, managers make corporate decisions that are more aligned with the value of firm fundamentals and therefore achieve higher operating performance. Among all these studies on stock price informativeness, no such study has focused on a particular industry. This article aims to fill this gap with a health care focus.
Our research question is whether managers in the health care industry learn from financial markets in making investment decisions. Insider trading is widely understood, but we explore what in some respects is the reverse of insider trading, where public information is profitably employed by private parties. We not only examine CAPEX investments but also investments through M&A deals. The article goes beyond reporting health care specific financial analysis. It is translational research with the objective of informing the health care management community of relevant developments in the field of academic finance. It is an effort to cross-fertilize the silos that too often divide us.
Using a sample of 2256 firm-year observations during the period from 1985 to 2011, we find that stock price firm-specific information increases the sensitivity of both CAPEX and M&A to Tobin’s Q. The results provide novel industry-level evidence to the literature that managers in the health care industry learn from financial markets. As the health care industry is heterogeneous and includes important subsectors, we split the industry into 3 subsectors—Drugs, Health Services, and Medical Equipment and Supplies. We find that in the Drugs subsector, both CAPEX and M&A investment increase sensitivity to Q when stock prices are more informative. However, this relation holds in M&A investment only in Health Services and does not hold at all in Medical Equipment and Supplies. After comparing firm characteristics, we find that firms in the Drugs subsector have the highest stock price firm-specific information and least managerial private information. Therefore, managers in a better information environment are more likely to believe the information creation ability of financial markets. In addition, Drug firms are much larger than those in the other 2 subsectors, which may motivate managers to learn from the market.
This article is the first to address managerial learning from financial markets in the health care industry. Financial markets bridge managers with investors who do not always have direct communication with management. Previous studies show that inside managers possess more firm-specific information and information flows from inside managers to outside investors through announcement of firm-specific issues such as earnings announcements and equity issuance.11,12 We argue that the information flow can also be the other way around from outside investors to inside managers. Possessing more complete knowledge from financial markets can help health care managers improve decision making.
Data and Methods
We begin our sample collection from the entire universe of stocks found in COMPUSTAT/Center for Research in Security Prices (CRSP) database. We define the health care industry using the health care industry classification in Fama-French 12 industry definition. Furthermore, we define subsectors following the Standard Industrial Code (SIC) definition in the SIC Manual from US Department of Labor online resource. We use SIC codes 2833 to 2836 to define the Drugs subsector. This includes the following nomenclature: Medicinal Chemicals & Botanical Products, Pharmaceutical Preparations, In Vitro & In Vivo Diagnostic Substances, and Biological Products. SIC codes 3841 to 3845 are used to define Medical Equipment and Supplies. The nomenclature here includes the following: Surgical & Medical Instruments & Apparatus Orthopedic, Prosthetic & Surgical Appliances & Supplies, Dental Equipment & Supplies, X-Ray Apparatus & Tubes & Related Irradiation Apparatus, and Electro Medical & Electrotherapeutic Apparatus. SIC codes 8000 to 8099 define Health Services. This nomenclature includes the following: Offices & Clinics of Doctors of Medicine; Nursing & Personal Care Facilities; Skilled Nursing Care Facilities; Hospitals; Medical Laboratories; Home Health Care; Misc. Health & Allied Services, NEC; and Specialty Outpatient Facilities, NEC. These 3 subsectors compose the health care industry. Firms with negative capital expenditure or negative acquisition are excluded as are those with less than $10 million book value. To avoid extreme values, firms with Tobin’s Q greater than 100 or less than zero are excluded. Table 1 lists the sample distribution and descriptive statistics for the sample of 2256 firm-year observations in the health care industry during the period 1985 to 2011.
Summary Statistics.

Note. Drugs, Health Services, and Medical Equipment and Supplies are 3 subsectors in the health care industry. Other than M&A and CAPEX, variables are collected in the previous fiscal year. Detailed descriptions of all variables and data sources are provided in the supplementary material. All continuous variables are winsorized at 1% and 99%. M&A = merger and acquisition; CAPEX = capital expenditure; CF = cash flow; LEV = leverage.
We measure M&A investment with COMPUSTAT item 129 and measure CAPEX investment using COMPUSTAT item 128.1,13 The main measure of stock price firm-specific information is stock return nonsynchronicity (ψ). It equals log [(1 − R2) / R2], where R2 derives from specification (1):
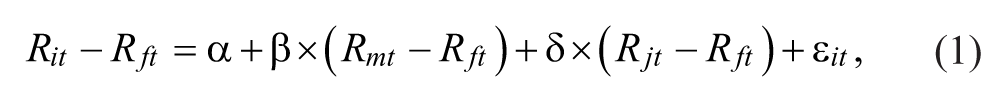
where Rit is firm i’s daily stock return, Rft is the daily risk-free return measured by the 1-month Treasury bill rate, Rmt is the daily market value-weighted return on all New York Stock Exchange (NYSE), American Stock Exchange (AMEX), and National Association of Security Dealers Automated Quotations (NASDAQ) stocks (from CRSP), and Rjt is the daily value-weighted return of the SIC 3-digit industry.
This model is the Capital Asset Pricing Model (CAPM) controlling for industry return. It splits the variation of a stock return into 3 components: a market-related variation, an industry-related variation, and a firm-specific variation. As prices move in response to new information, stock price movements should reflect new market, industry, and firm-specific information. Under the standard theoretical framework of the Efficient Market Hypothesis, price movements should reflect all related information. If there is no public news announcement of any kind about a firm, its stock price movements are completely attributable to market and industry news. That is, the R2 of the specification (1) shall be 1. However, the R2 increases marginally when excluding dates when firm-specific news is publicly released, indicating that stock return nonsynchronicity (1 − R2) may reflect investors’ private firm-specific information. 2 Empirical evidence provides strong support that stock return nonsynchronicity increases with informed trading profit and decreases with information collection and trading cost, suggesting that it proxies for investors’ private firm-specific information about the value of firm fundamentals.14-16
As (1 − R2) is skewed, we employ logistic transformation of the ratio (1 − R2) / R2. 17 Recent studies employ similar measures of stock return nonsynchronicity to proxy for stock price firm-specific information.6,14,16-22 We require at least 100 daily stock return observations during the last fiscal year to ensure explanatory power. One concern of our study is whether the primary results are sensitive to the particular measure of stock price informativeness. In unreported tests, we rerun the regressions using the stock return nonsynchronicity including Fama-French 3 factors and the momentum factor in the market model or including lagged market and industry returns in the model. We also employ the measure when cumulating the returns in days where no trading took place to account for infrequent trading of daily frequency returns. Our results hold when using these alternative measures.
Tobin’s Q is measured as the ratio of market-to-book value of assets. The market value of assets is comprised of the value of assets in place and the present value of growth opportunities. If Tobin’s Q is greater than 1, it suggests that the firm has positive net present value growth opportunities. Therefore, higher Tobin’s Q suggests a firm has more growth opportunities. The Q-theory of investment argues that the firm’s investment rate should rise with its Q. 23 M&A is investment through purchase of second-hand assets from the target firm and empirical neoclassical studies report that these investments also increase with Q.13,24
Because M&A investment can be initiated by managerial private information, we control for managerial private information with earnings’ surprise data.1,11,12 This variable is defined as the average of absolute abnormal return (−1, +1) around previous 4 quarterly earnings announcements. A positive absolute earnings’ surprise reveals that there is some information in earnings not fully anticipated by the market and hence not held in prices yet. Because managers presumably know the accounting numbers beforehand, the earnings’ surprise can be a reasonable measure of managerial private information. We control for firm size since smaller firms tend to have higher stock return nonsynchronicity and they are less likely to have resources other than equity to finance large acquisitions. We need to address the concern that our main results are not driven by the firm size effect. We also include controls of firm leverage and cash holdings as high leverage can lead to underinvestment and excess cash flow can cause over-investment.25,26 All these variables are measured at the previous fiscal year. The supplementary material provides a detailed explanation of each variable.
Results and Discussion
Table 1 presents basic statistics for the main variables in each health care subsector as well as in the whole health care industry. The average M&A investment accounts for 10.55% of total book assets in the health care industry. Health Services has the highest M&A investment (11.77%), significant at 1% level. The average CAPEX investment accounts for 5.55% of book assets in the health care industry, much lower than M&A investment. Among the 3 subsectors, Health Services has higher CAPEX investment, significant at 1%. Tobin’s Q is highest in the Drugs and lowest in Health Services, significant at 1%. Stock return nonsynchronicity is highest in Medical Equipment and Supplies. However, as it is negatively correlated with firm size (coefficient, −0.66; P < .01), we split firm size and rank stock return nonsynchronicity into quintiles. The average ranking of stock return nonsynchronicity in Drugs becomes the highest, and significant at 1%. Firms in the Drugs category have the biggest size, lowest managerial private information, and highest cash flow. Firms in Medical Equipment and Supplies have the lowest leverage ratio. It is important to note the heterogeneity of the 3 subsectors. The Drugs subsector enjoys patent protection for much of its revenue and is very much a for-profit arena. To some extent, this applies to Medical Equipment and Supplies as well. But Health Services competes differently and includes a substantial nonprofit element which is not directly observed in this study because of the nature of our data.
Table 2 presents estimation results from ordinary least squares (OLS) regressions. Panel A reports the whole sample. Results show both CAPEX and M&A investments increase with Q. Stock price informativeness (ψ) increases sensitivity of internal capital investment to Q, suggesting managers learn from financial markets in making CAPEX investment. Moreover, ψ increases sensitivity of M&A investment to Q, suggesting managers learn from financial markets in making M&A investment decisions. The coefficient of managerial private information and Q (AI × Q) is not statistically significant. The last 3 columns of Table 2 show total investment also becomes more sensitive to Q because of higher stock price informativeness.
Price Informativeness and Merger Investment Sensitivity to Q.
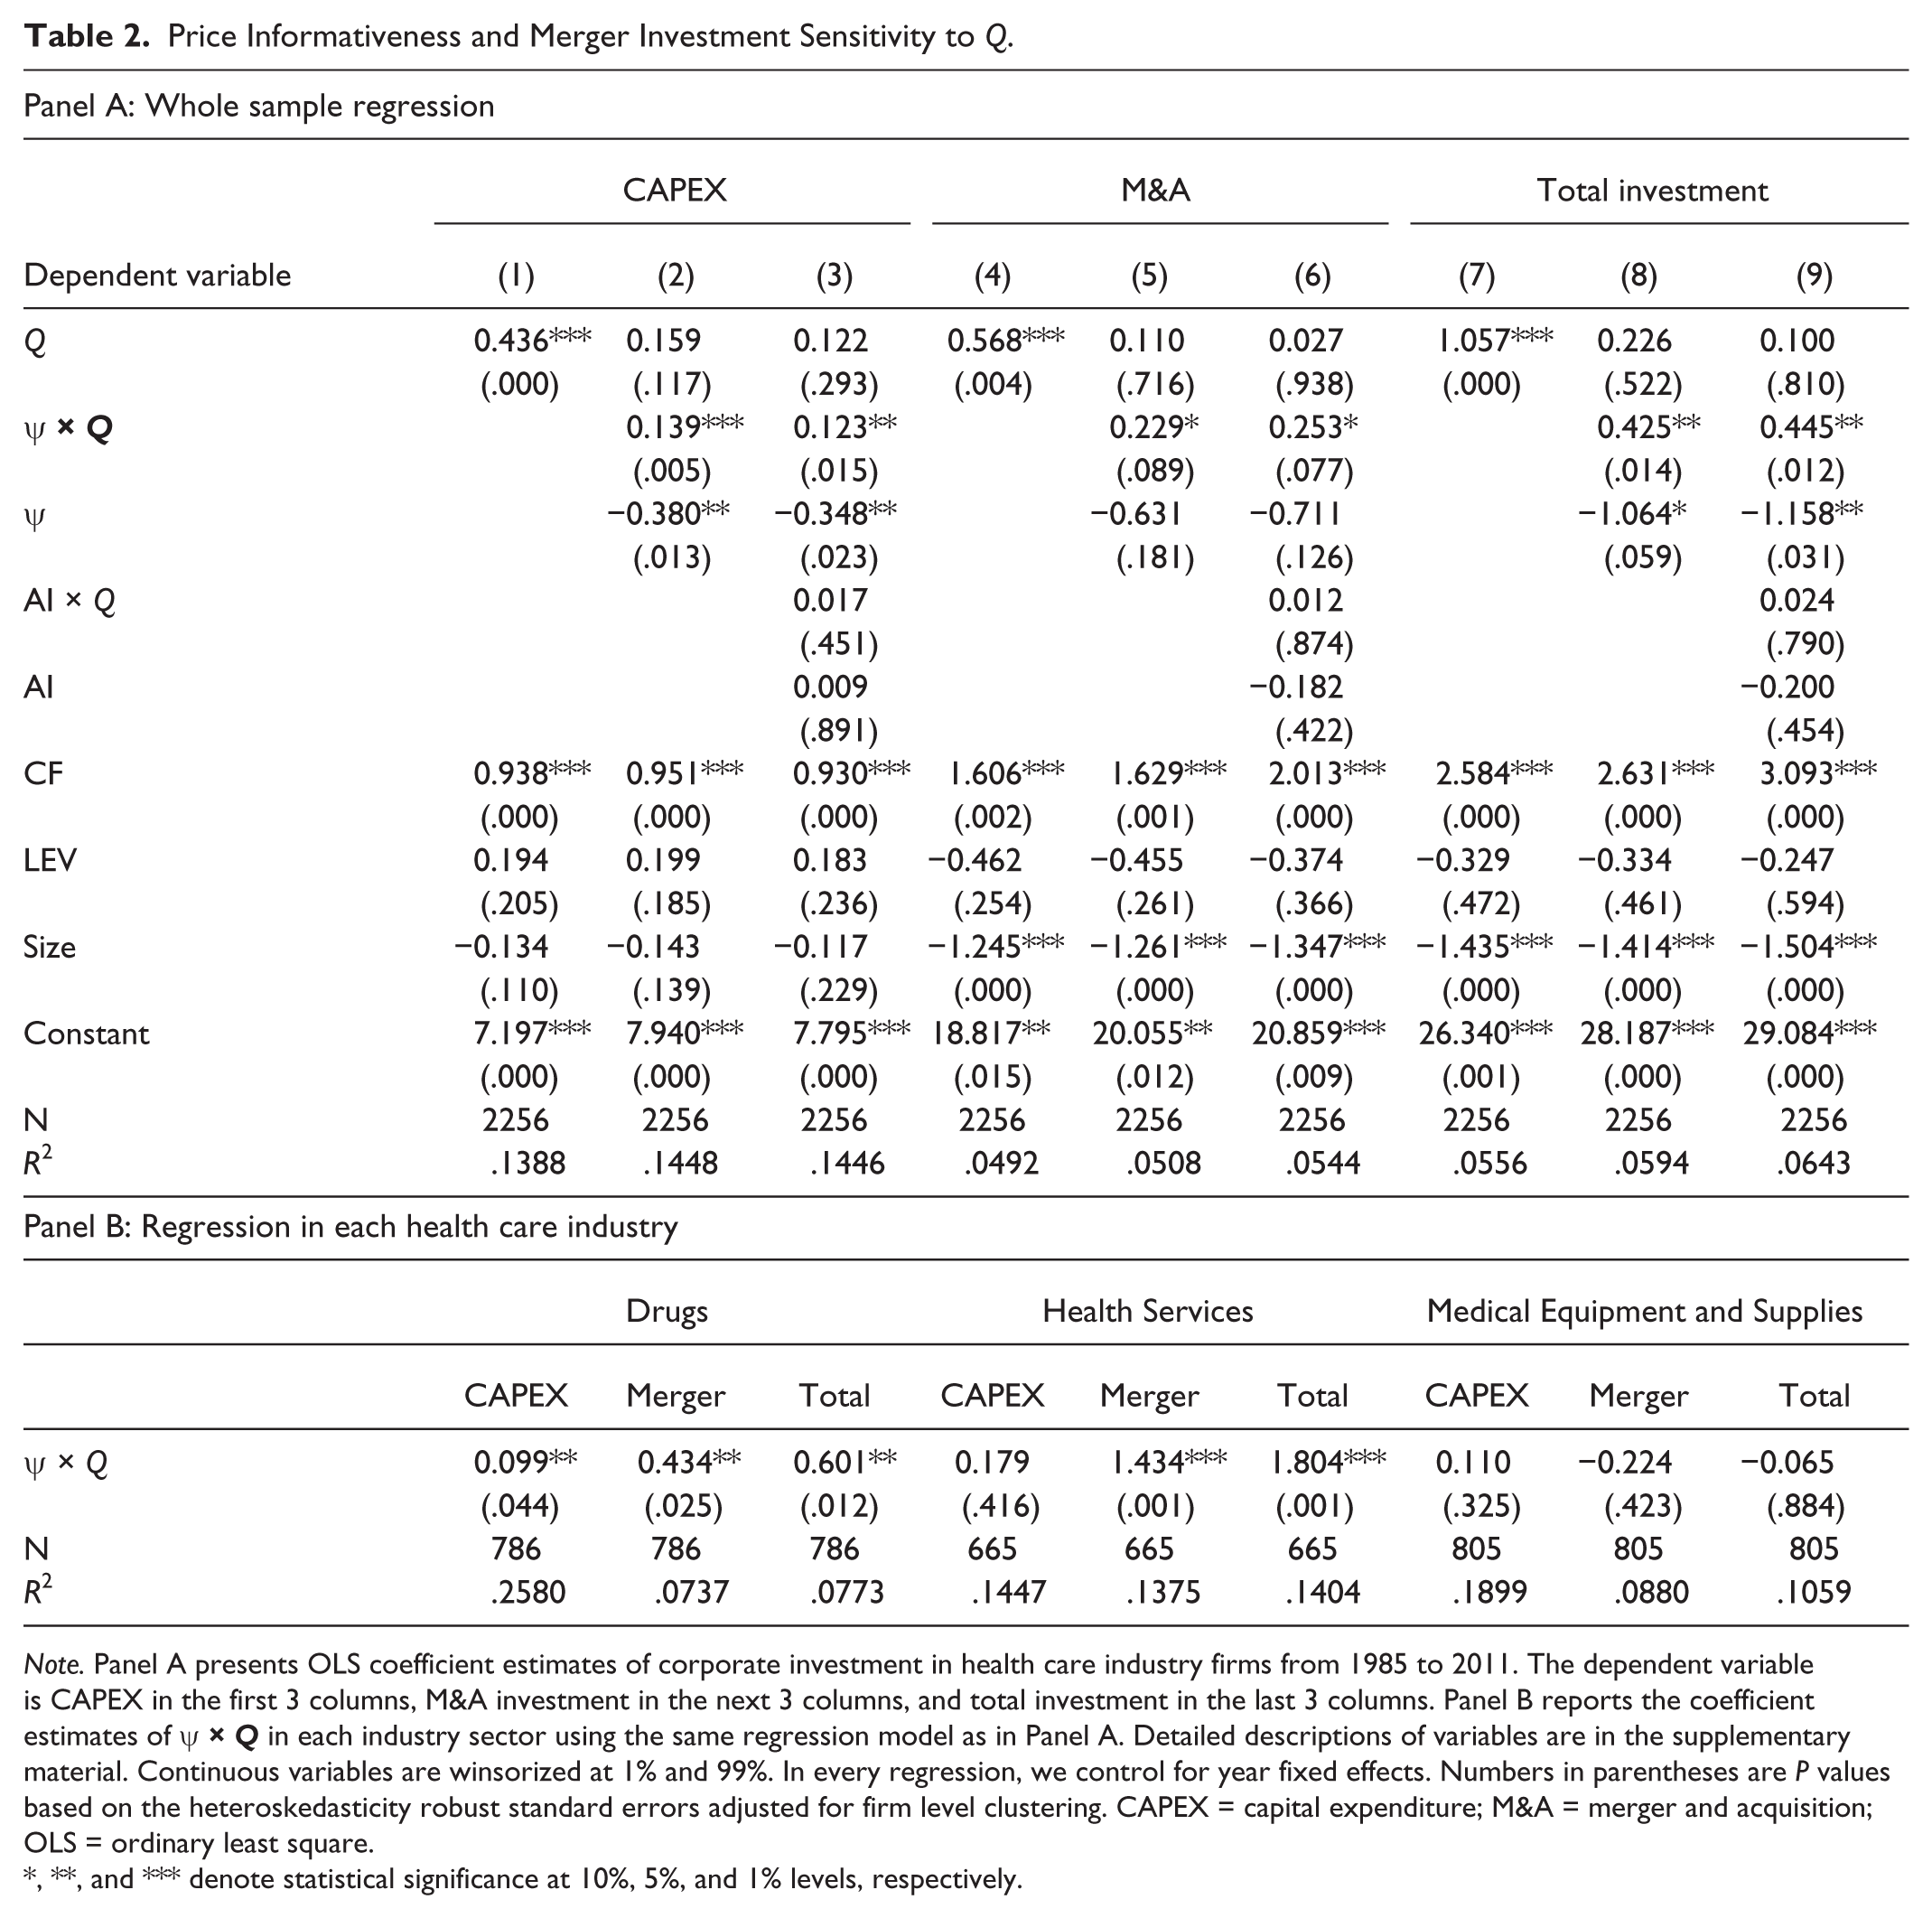
Note. Panel A presents OLS coefficient estimates of corporate investment in health care industry firms from 1985 to 2011. The dependent variable is CAPEX in the first 3 columns, M&A investment in the next 3 columns, and total investment in the last 3 columns. Panel B reports the coefficient estimates of
**, and *** denote statistical significance at 10%, 5%, and 1% levels, respectively.
Panel B in Table 2 shows estimation results in each industry subsector. Due to limited space, we only report the coefficient estimates of ψ × Q using the same regression models as in panel A. These regression models are models (3), (6), and (9). In the Drugs category, findings indicate managers learn from financial markets in both CAPEX and M&A investments. This observation is not surprising as Table 1 shows firms in this subsector have the largest size, highest stock price informativeness, and lowest managerial private information. Managers in Health Services appear to only learn from the market in making M&A investment decisions. Managers tend to be more receptive to financial markets in making these strategic decisions perhaps because Health Services has the highest level of M&A investment. In Medical Equipment and Supplies, stock price informativeness does not affect the sensitivity of CAPEX or M&A to Q.
If managers learn from financial markets, we would expect more informed decisions aligned with firm fundamentals and improved future firm performance. In Table 3, we test the relation between stock price firm-specific information and future operating performance including return-on-asset (ROA), sales increase, and asset turnover. ROA measures total asset profitability, Sales Increase measures sales revenue growth, and Asset Turnover measures total asset management efficiency. We did not use ψ × Q but ψ directly because managerial learning should benefit firm performance for both high and low Q firms. For high Q firms, managerial learning helps to increase investment to achieve growth opportunities; for low Q firms, managerial learning helps to curb overinvestment, which also helps to improve firm performance. We find that stock price firm-specific information consistently increases future operating performance. This observation is consistent with the managerial learning argument. In unreported tests, we find that stock price firm-specific information increases future asset turnover and ROA, respectively, in Drugs and Health Services, supporting the argument that manager learning improves future firm performance. In Medical Equipment and Supplies, we find that stock price firm-specific information increases future sales growth even though Table 2 does not show evidence of manager learning. Results suggest stock price informativeness affects future firm performance through channels other than manager learning from the market.27-29
Future Firm Performance and Stock Price Informativeness.
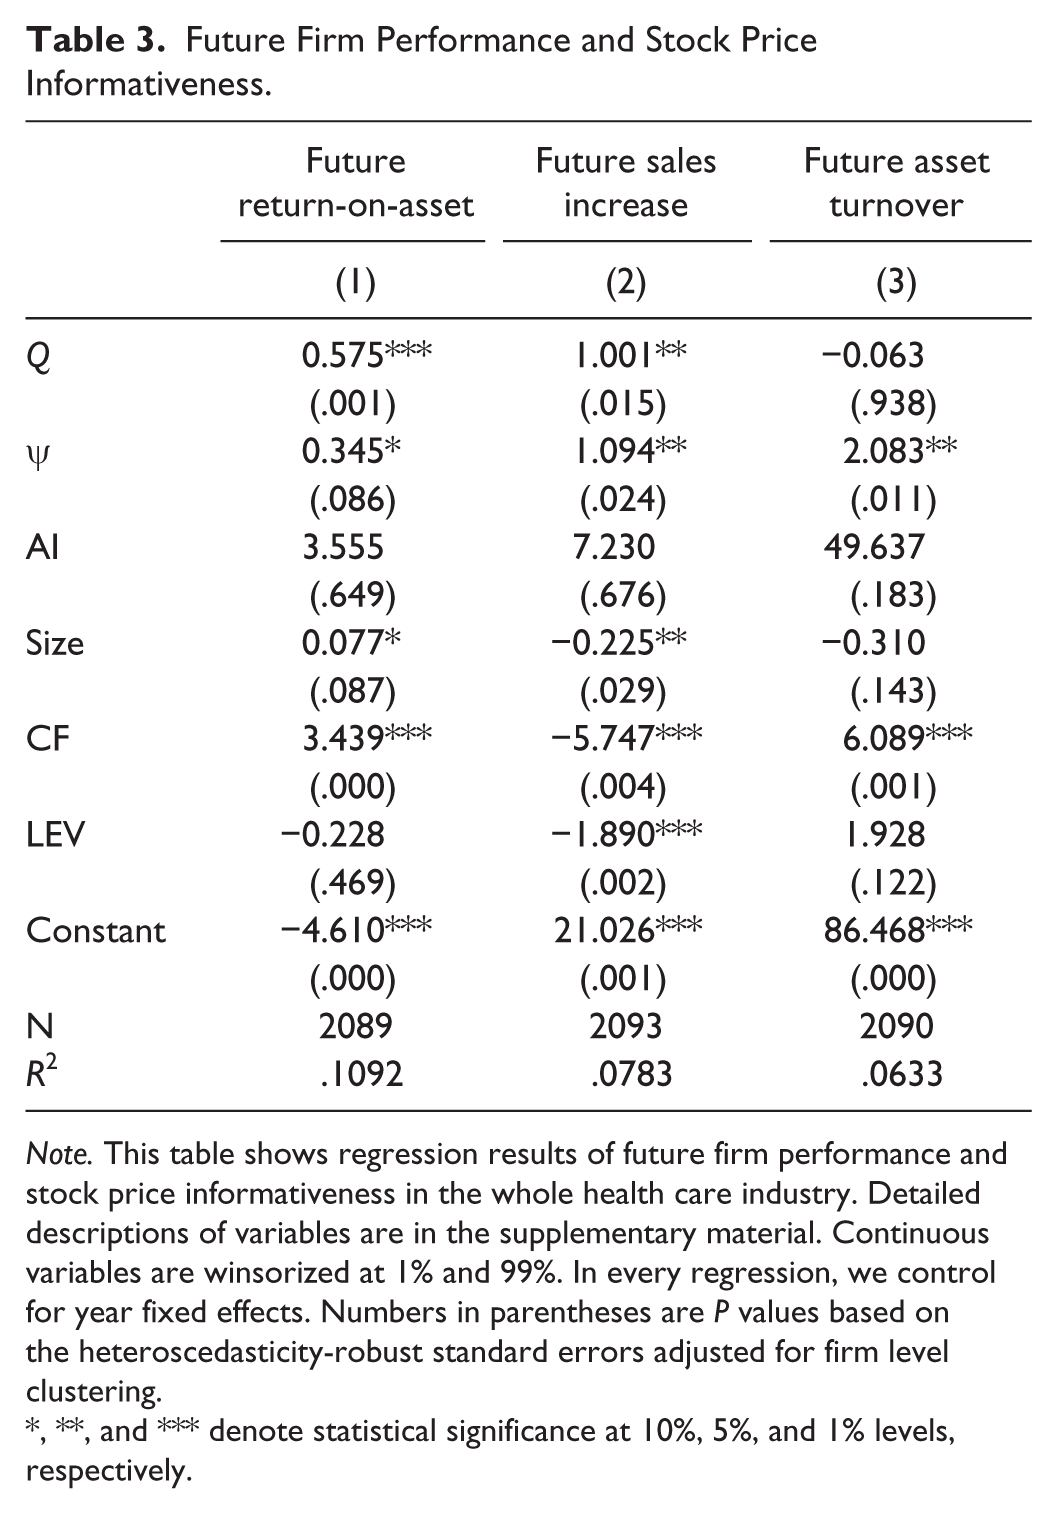
Note. This table shows regression results of future firm performance and stock price informativeness in the whole health care industry. Detailed descriptions of variables are in the supplementary material. Continuous variables are winsorized at 1% and 99%. In every regression, we control for year fixed effects. Numbers in parentheses are P values based on the heteroscedasticity-robust standard errors adjusted for firm level clustering.
**, and *** denote statistical significance at 10%, 5%, and 1% levels, respectively.
Conclusions
This article presents new evidence that managers in health care learn from financial markets in making organizational decisions about CAPEX and M&A investment. We find both CAPEX and M&A investment become more sensitive to Q when stock prices are more informative of firm-specific information. Results suggest financial markets provide managers new information about the value of firm fundamentals so that managers are more likely to invest through M&A and CAPEX when informed stock prices are higher. Further analysis shows managerial learning from financial markets improves future firm operating performance. Among the 3 industry subsectors, managers in the Drug subsector are most likely to learn because firms in this sector have the highest stock price information and lowest managerial private information. Managers in Health Services tend to learn only for M&A investment. This subsector also has the highest percentage of investment through M&A.
There is much concern about consolidation and market power in health care, especially in the wake of the Affordable Care Act which facilitates clinical and financial integration. The purpose of integration is to improve efficiency and avoid “tragedy of the commons” thought to be behind poor cost and outcome performance in the United States. 30 Unfortunately, integration is also associated with consolidation and higher levels of market power. The result may yield greater productive efficiency but higher allocative inefficiency.31,32 Economists and others have been concerned about social welfare and monopoly since at least the time of Adam Smith. Yet, most of the related literature, especially in health care, does not fully explore mechanisms by which managers invest and acquire to gain efficiency in production and/or market power. This article helps fills the void and may serve to stimulate further research in this arena.
Footnotes
Declaration of Conflicting Interests
The author(s) declared no potential conflicts of interest with respect to the research, authorship, and/or publication of this article.
Funding
The author(s) received no financial support for the research, authorship, and/or publication of this article.
References
Supplementary Material
Please find the following supplemental material available below.
For Open Access articles published under a Creative Commons License, all supplemental material carries the same license as the article it is associated with.
For non-Open Access articles published, all supplemental material carries a non-exclusive license, and permission requests for re-use of supplemental material or any part of supplemental material shall be sent directly to the copyright owner as specified in the copyright notice associated with the article.