
Abstract
Under the Hospital Readmissions Reduction Program (HRRP) of the Centers for Medicare & Medicaid Services (CMS), hospitals with excess readmissions for select conditions and procedures are penalized. However, readmission rates are not risk adjusted for socioeconomic status (SES) or race/ethnicity. We examined how adding SES and race/ethnicity to the CMS risk-adjustment algorithm would affect hospitals’ excess readmission ratios and potential penalties under the HRRP. For each HRRP measure, we compared excess readmission ratios with and without SES and race/ethnicity included in the CMS standard risk-adjustment algorithm and estimated the resulting effects on overall penalties across a number of hospital characteristics. For the 5 HRRP measures (heart failure, acute myocardial infarction, chronic obstructive pulmonary disease, pneumonia, and total hip or knee arthroplasty), we used data from the Healthcare Cost and Utilization Project’s State Inpatient Databases for 2011-2012 to calculate the excess readmission ratio with and without SES and race/ethnicity included in the model. With these ratios, we estimated the impact on HRRP penalties and found that risk adjusting for SES and race/ethnicity would affect Medicare payments for 83.8% of hospitals. The effect on the size of HRRP penalties ranged from −14.4% to 25.6%, but the impact on overall Medicare base payments was small—ranging from −0.09% to 0.06%. Including SES and race/ethnicity in the calculation had a disproportionately favorable effect on safety-net and rural hospitals. Any financial effects on hospitals and on the Medicare program of adding SES and race/ethnicity to the HRRP risk-adjustment calculation likely would be small.
Hospitals are being held increasingly accountable for the quality of care delivered to their patients. The Affordable Care Act of 2012 requires that the Centers for Medicare & Medicaid Services (CMS) reduce payments to hospitals with excess readmissions. Through the Hospital Readmissions Reduction Program (HRRP), CMS reduces payments to hospitals if their risk-adjusted readmission rates for select conditions and procedures are higher than expected. 1 The CMS risk-adjustment methodology for excess readmission ratios incorporates patient age, sex, and comorbidities but not race/ethnicity and socioeconomic status (SES). Studies have shown that race/ethnicity and SES are significantly associated with readmissions.2-10 To the extent that inclusion of race/ethnicity and SES in the risk adjustment would result in significant changes to hospitals’ excess readmission ratio, exclusion of race/ethnicity and SES from the risk-adjustment algorithm could have a significant impact on HRRP-related penalties. The National Quality Forum has recommended incorporating SES into risk-adjustment algorithms for common performance measures, and the US Congress passed a law in 2014 calling for CMS to examine the effect of SES on Medicare quality measures.11,12 The lack of race/ethnicity and SES adjustment may inordinately affect hospitals that can least afford financial penalties, such as safety-net hospitals. 13
Despite public support for risk-adjusting readmission rates and evidence that race/ethnicity and SES are correlated with readmissions, no studies to date have demonstrated that adding race/ethnicity and SES into the CMS risk-adjustment methodology would affect the financial impact of the HRRP on hospitals. One recent study found that when race/ethnicity and SES were included in the risk-adjustment methodology, there were no significant effects on metrics closely related to those used in the HRRP, but this study was focused only on readmissions for total hip arthroplasty or total knee arthroplasty (THA/TKA). 14
This study aimed to test the extent to which the addition of race/ethnicity and SES to the CMS HRRP risk-adjustment algorithm affects hospitals’ excess readmission ratios and the resultant payment reductions under the program across the full range of conditions included in the HRRP financial adjustments: heart failure (HF), acute myocardial infarction (AMI), chronic obstructive pulmonary disease (COPD), pneumonia, and THA/TKA. To do this, we (1) estimated the proportion of hospitals that experience favorable, unfavorable, or no impact on their excess readmission ratios for each HRRP measure after adding race/ethnicity and SES, and (2) estimated changes in hospitals’ HRRP penalty after adding race/ethnicity and SES. On the basis of those analyses, we describe the types of hospitals likely to experience a favorable or unfavorable change in penalties.
Methods
Data Source
We used hospital discharge data from the 2011 and 2012 Healthcare Cost and Utilization Project (HCUP) State Inpatient Databases (SID). 15 From these data, we included discharge information such as diagnosis and procedure codes, and patient age, sex, and race/ethnicity. We used data from 15 states that had unique synthetic patient linkage numbers that track patients across hospitals, encompassing 43% of the US population. We linked HCUP SID data to 2011 American Hospital Association Annual Survey of Hospitals data to capture hospital characteristics and to American Community Survey (ACS) data to measure the SES of the ZIP Code Tabulation Area (ZCTA) in which patients reside.
Population
Discharges were included in the study if they met the CMS inclusion criteria16,17 for at least 1 of the 5 HRRP measures: HF, AMI, COPD, pneumonia, and THA/TKA. We limited our analyses to patients aged 65 years and older whose expected payment source was Medicare, which included traditional Medicare Fee-for-Service and Medicare Advantage (MA). Consistent with CMS specifications, all hospitals were included in the calculation of the risk-standardized readmission ratio; however, only hospitals included in the HRRP were used in subsequent analyses (eg, only those with a minimum of 25 discharges for at least 1 measure that were paid based on prospective payment). We focused on data from January through November of each year to allow a 30-day postdischarge follow-up.
Excess Readmission Ratio
Our key outcome variable was hospitals’ excess readmission ratio, which is calculated separately for each of the 5 HRRP measures used to determine hospitals’ financial penalties. In fiscal year 2014, CMS included HF, AMI, and pneumonia in the HRRP, and in fiscal year 2015, they added COPD and THA/TKA. 1 The excess readmission ratio is the ratio of the risk-adjusted predicted number of readmissions to the expected number of readmissions from logistic regression models (described below). 1 A ratio of less than 1 indicates better performance and greater than 1 indicates poorer performance. CMS uses these excess readmission ratios to calculate hospitals’ payment penalties. 1
To estimate excess readmission ratios, we replicated the CMS HRRP methodology.16,17 To estimate the predicted and expected number of readmissions, we ran patient-level hierarchical logistic regression models regressing the presence of a readmission on patient age, sex, and comorbidities. All of the variables included in our models are shown in the HRRP methodology documentation.16,17 For these models, we focused on readmissions (as defined by CMS specifications) occurring within 30 days of discharge from the index admission. Drawn from the results of the logistic regression models, a hospital’s predicted number of readmissions is based on its own readmissions performance after controlling for case mix; a hospital’s expected number of readmissions is based on the performance of all hospitals in the data set that have a mix of patients similar to that hospital. The logistic regression models allowed each hospital to have its own intercept to estimate the predicted number of readmissions and used one intercept across all hospitals to estimate the expected number of readmissions. Our approach to these calculations was consistent with the CMS HRRP methodology with 2 exceptions. First, CMS uses a 3-year period to measure hospital performance; we used a 2-year period.16,17 Second, CMS defines comorbidities on the basis of the prior year of inpatient and outpatient data; however, HCUP SID include only current year inpatient data, so we modified the approach by using comorbidities at the time of the inpatient index admission only.
We performed this set of logistic regression models twice for each condition, resulting in 2 separate risk-adjusted excess readmission ratios. We first used the basic CMS methodology. We then repeated the risk-adjustment approach but added race/ethnicity and SES into the hierarchical logistic regressions.
We measured race/ethnicity using 3 patient-level binary variables—Hispanic, black non-Hispanic, and other non-Hispanic—with white non-Hispanic as the reference. We obtained race/ethnicity information from the HCUP SID hospital administrative discharge record provided by each state. Because of variability in state reporting, HCUP maintains a uniform set of race/ethnicity categories into which state values are coded. 18 Hospital personnel assigned race/ethnicity based on observation or patient self-identification.
We created a ZCTA-level SES index using 6 variables: percentage of adults older than 25 years with less than a high school education, percentage male unemployment, percentage of households with income below the federal poverty level, percentage of households receiving public assistance, percentage of female-headed households with children, and median household income. The index was calculated by transforming each variable such that higher values corresponded to higher levels of SES, and each had a mean of 0 and a standard deviation of 1. We summed all 6 variables and restandardized the index to a mean of 0 and a standard deviation of 1. This index has been used in previous studies to estimate SES and has been validated using factor analysis.19,20 To improve precision of the estimates for each ZCTA, we used 5-year averages from 2009 to 2013. We then merged these SES variables at the patient level using each patient’s ZCTA of residence which is available in the HCUP databases.
Analysis
For each HRRP measure, we assessed the extent to which adding race/ethnicity and SES to the risk-adjustment model affected the hospitals’ excess readmission ratio. Although the payment penalty is not directly calculated for each measure, the formulation of the overall penalty implicitly penalizes a hospital for each readmission ratio greater than 1. 1 So, although we used the full CMS penalty formula to calculate overall penalties, we calculated the excess readmission ratio and examined the effect of race/ethnicity and SES separately for each measure before examining the overall impact on payments. We designated hospitals as having no impact on their payments if their excess readmission ratio was 1 or less and remained 1 or less after race/ethnicity and SES were added. We considered hospitals as having a favorable impact on their payments if their excess readmission ratio was above 1 and decreased after including race/ethnicity and SES, so that the ratio was either closer to 1 or crossed the threshold to less than 1. We separately identified hospitals whose excess readmission ratio fell to 1 or below and, therefore, they no longer would be subject to any payment reductions. Hospitals were considered as having an unfavorable impact on their payments if their excess readmission ratio was above 1 and increased, or if it was at or below 1 and increased to above 1, after including race/ethnicity and SES. For hospitals experiencing an impact, we estimated the magnitude of the change in their excess readmission ratio.
We used the measure-specific excess readmission ratios to estimate the impact of adjusting for race/ethnicity and SES on penalties following the basic CMS methodology. Because we did not have CMS reimbursement data, we estimated diagnosis-related group (DRG) payments for each admission. We used each hospital’s wage index to calculate its adjusted base operating rate.21,22 This rate was then multiplied by the appropriate DRG weight to calculate an approximate payment for each discharge. We used this information in combination with the excess readmission ratios to estimate payment penalties under the HRRP, designating hospitals as having a favorable or unfavorable change in penalties after race/ethnicity and SES risk adjustment. We also calculated the percentage change in HRRP penalty amount for each hospital, as well as the overall percentage change in Medicare base payment.
Finally, we assessed the extent to which the risk and magnitude of readmission-related penalty changes varied across different hospital characteristics, including teaching status, safety-net status, ownership, region, urban-rural location, and size. To do this, we used multivariate logistic regression models to estimate the correlation between the probability of having a favorable or unfavorable change in penalties and hospital characteristics.
Results
Table 1 provides descriptive statistics for the hospitals in our study by HRRP measure. Depending on the measure, the number of hospitals with at least 25 Medicare discharges ranged from 876 to 1188. Between 25.1% and 30.7% of all hospitals were teaching hospitals, and between 27.5% and 34.9% were safety-net hospitals. The majority of hospitals (60.6%-66.0%) were private not-for-profit. The largest number of hospitals were in large metropolitan areas (48.8%-57.2%), large in size (47.5%-55.6%), and in the South (40.9%-43.8%). Approximately half of hospitals (49.3%-52.7%) had an excess readmission ratio ≤1 across the measures. The average excess readmission ratio ranged from 1.002 to 1.011. The average number of qualifying admissions ranged from 177 to 317 per hospital. Therefore, we had a total of 376 635 for HF, 159 734 qualifying index admissions for AMI, 329 930 for COPD, 308 188 for pneumonia, and 294 534 fo r THA/TKA. The risk-adjusted readmission rates (without race/ethnicity and SES) ranged from 4.8 per 100 for THA/TKA discharges to 21.9 for HF.
Characteristics of Hospitals in 15 States, by Condition and Procedure Included in the CMS HRRP.

Note. Data source was the 2011-2012 Healthcare Cost and Utilization Project State Inpatient Databases from 15 states. Hospitals with fewer than 25 qualifying Medicare index admissions for patients aged 65 years and older were excluded. CMS = Centers for Medicare & Medicaid Services; HRRP = Hospital Readmissions Reduction Program; HF = heart failure; AMI = acute myocardial infarction; COPD = chronic obstructive pulmonary disease; THA = total hip arthroplasty; TKA = total knee arthroplasty.
Safety-net hospitals were defined as hospitals in the top quartile on percentage of all discharges that are uninsured or covered by Medicaid among community, non-rehabilitation hospitals.
Small, medium, and large bed size categories were defined within region and location/teaching category such that approximately one third of all hospitals in the region are allocated to each category. 23
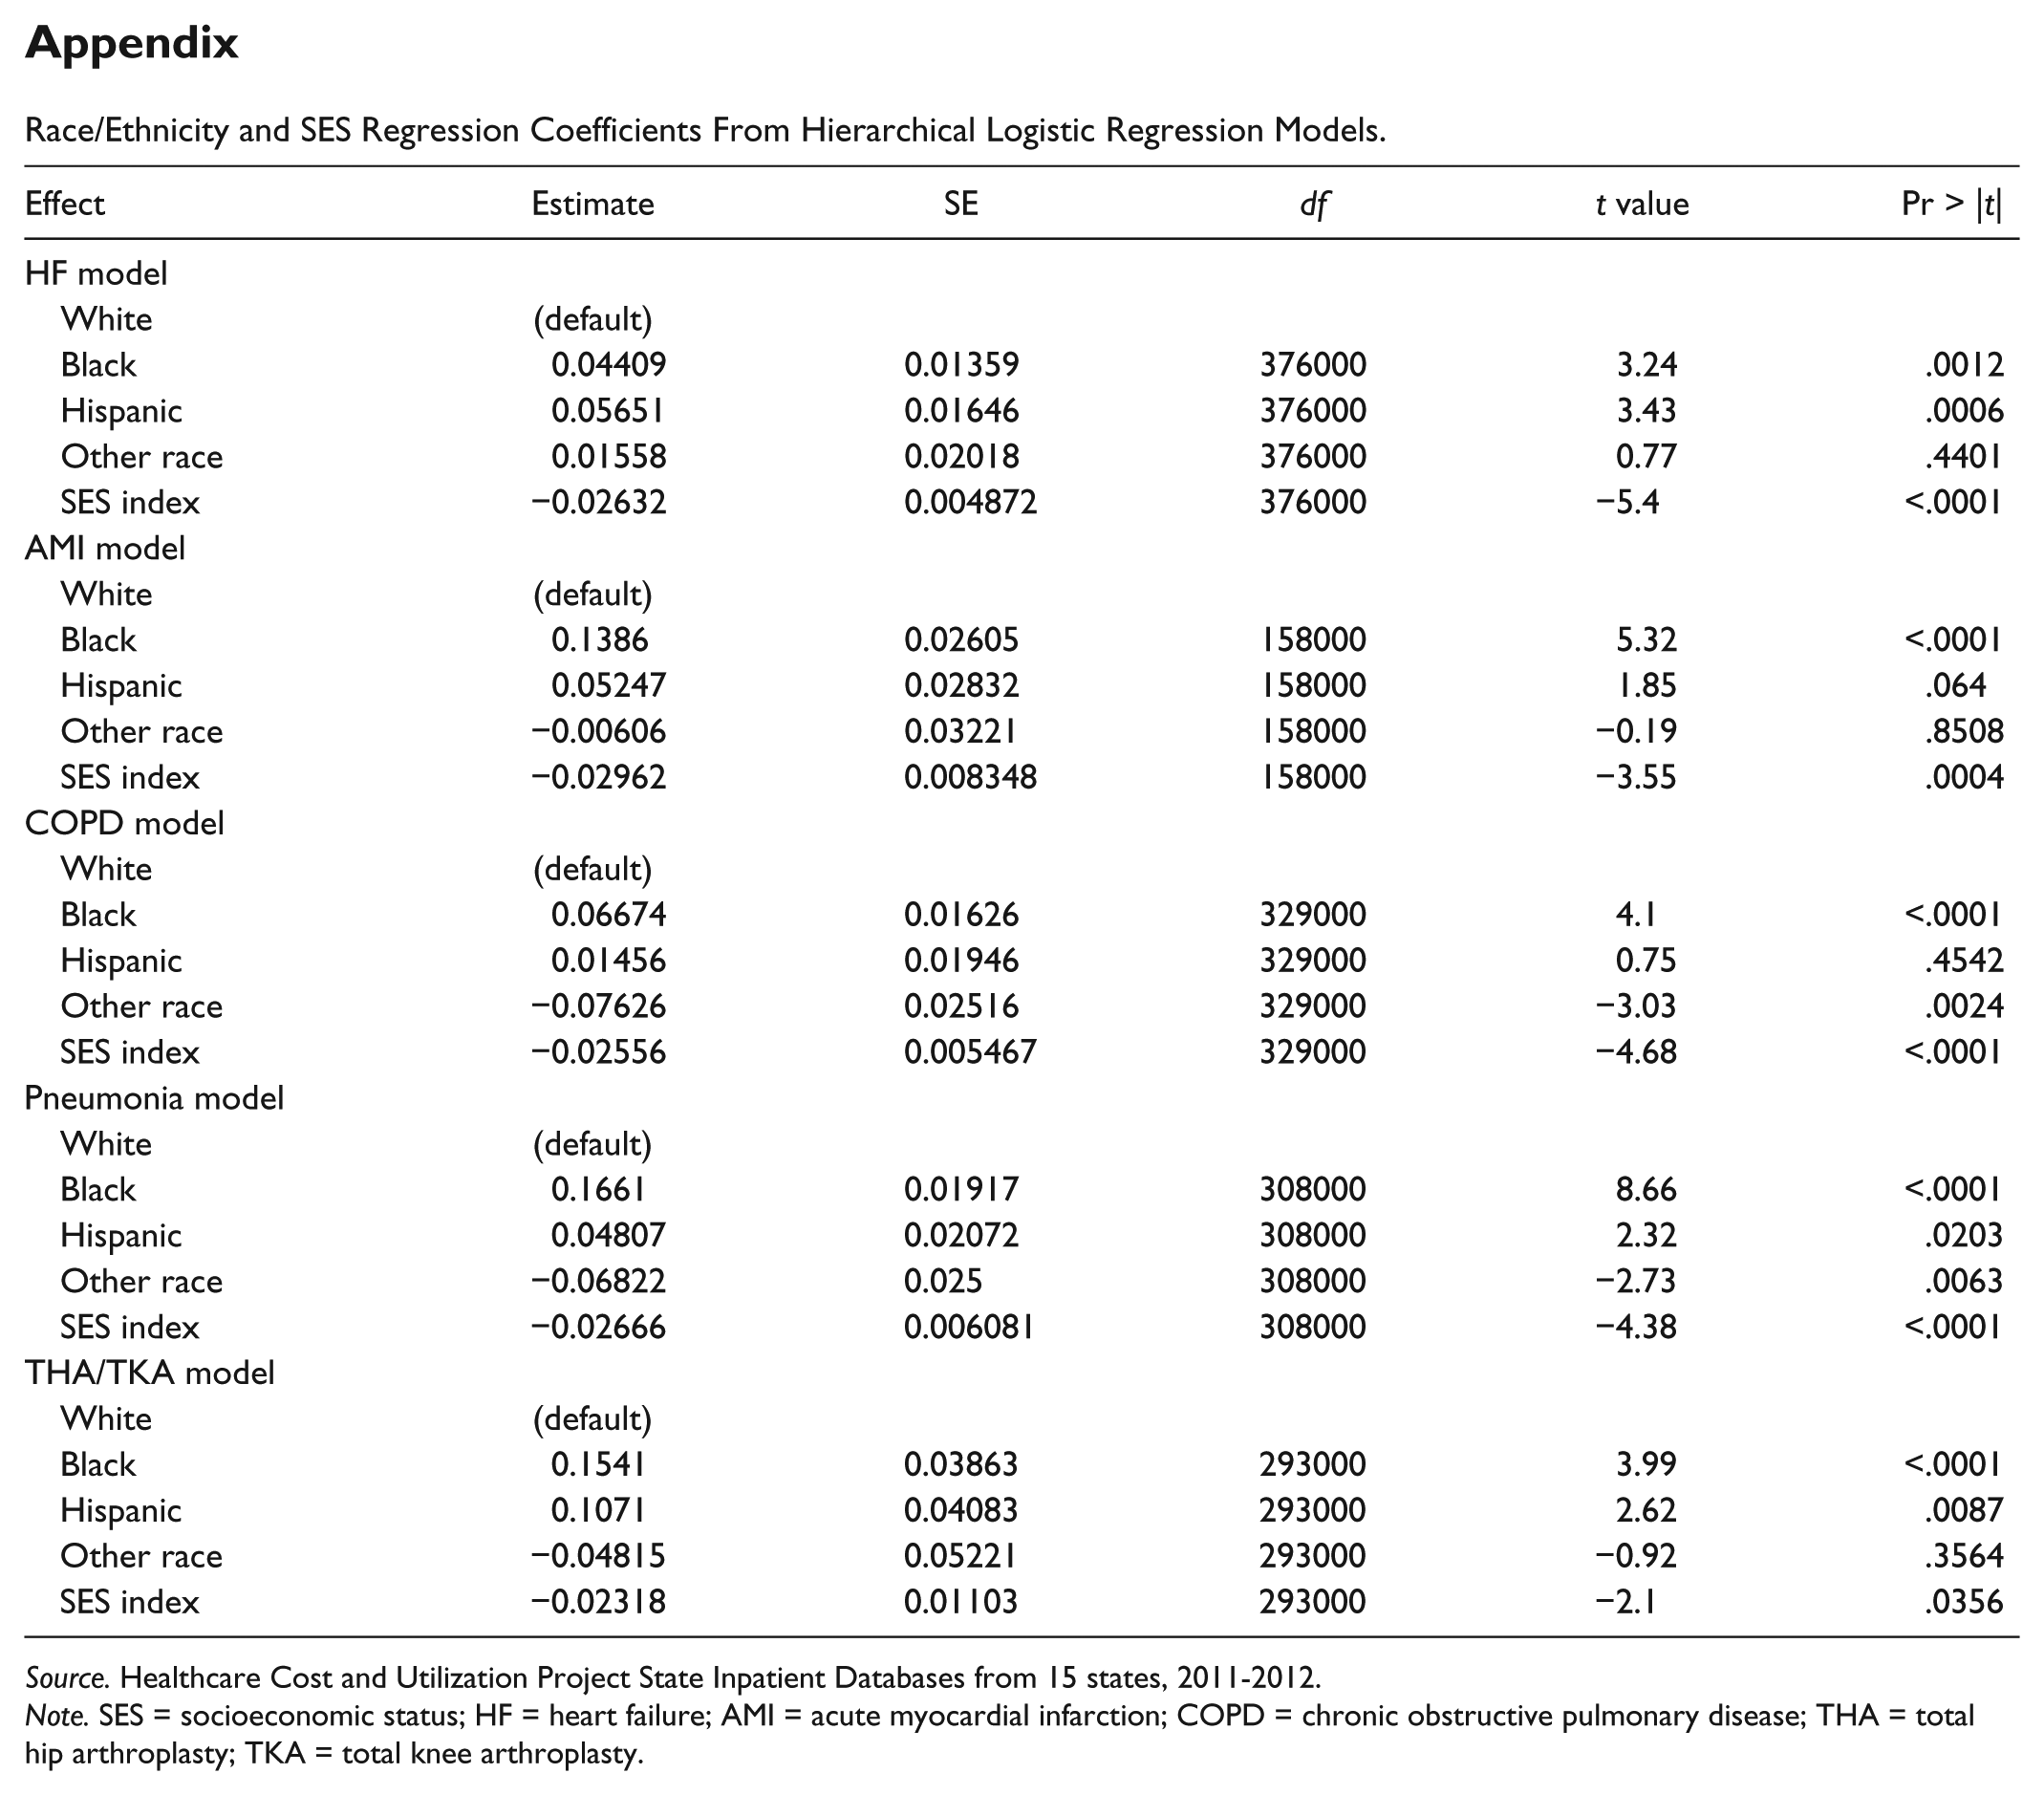
Consistent with previous literature, we found that race/ethnicity and SES were consistently associated with the probability of readmission for all 5 of the HRRP measures. We include these regression coefficients in the appendix. We present the impact on hospitals’ payments attributable to each HRRP measure of adding race/ethnicity and SES into the CMS risk-adjustment algorithm (Table 2). For each measure, we found that approximately half of hospitals experienced an impact on their financial penalties that was attributable to that specific measure. Of those that experienced an impact, between 24.7% (for COPD) and 29.8% (for HF) of hospitals experienced favorable change and between 20.0% (for AMI) and 25.1% (for COPD) experienced unfavorable change. Very few hospitals (0.8%-2.2%) crossed over the readmission ratio threshold of 1 either to eliminate penalties altogether or to add new penalties. Despite the high proportion of hospitals experiencing some change in penalty, the average change in the excess readmission ratio for each measure was relatively small, ranging from approximately −0.023 to 0.016.
Impact on Hospitals’ Penalty After Adjusting for Race/Ethnicity and SES, by Condition and Procedure Included in the CMS HRRP.

Note. Hospitals with fewer than 25 qualifying Medicare index admissions for patients aged 65 years and older were excluded. Data source was the 2011-2012 Healthcare Cost and Utilization Project State Inpatient Databases from 15 states. SES = socioeconomic status; CMS = Centers for Medicare & Medicaid Services; HRRP = Hospital Readmissions Reduction Program; HF = heart failure; AMI = acute myocardial infarction; COPD = chronic obstructive pulmonary disease; THA = total hip arthroplasty; TKA = total knee arthroplasty.
No penalty impact means the excess readmission ratio stayed at or below 1.
Favorable impact means either that the excess readmission ratio moved from above 1 to at or below 1 or that the ratio stayed above 1 but decreased.
Unfavorable impact means either that the excess readmission ratio moved from at or below 1 to above 1 or that the ratio stayed above 1 and increased.
In Table 3, we combined information from across the 5 HRRP measures to estimate the impact on hospitals’ overall financial penalties by hospital characteristic. Most hospitals (83.8%) experienced some change in penalties. The average penalty reduction was approximately 14.4% (range, 10.1%-19.4%), and the average penalty increase was 25.6% (range, 5.6%-42.6%). The magnitude of change in penalties as a percentage of all Medicare base payments for a hospital was extremely small, between 0.02% and 0.12%. The median hospital payment reduction was less than $10 000 in 2012 (not shown in tables). Safety-net and rural hospitals were most affected by the addition of race/ethnicity and SES, being much more likely to experience a decrease in penalties.
Proportion of Hospitals by Characteristic That Experienced a Change in Penalties Under the CMS HRRP After Adjusting for Race/Ethnicity and SES.
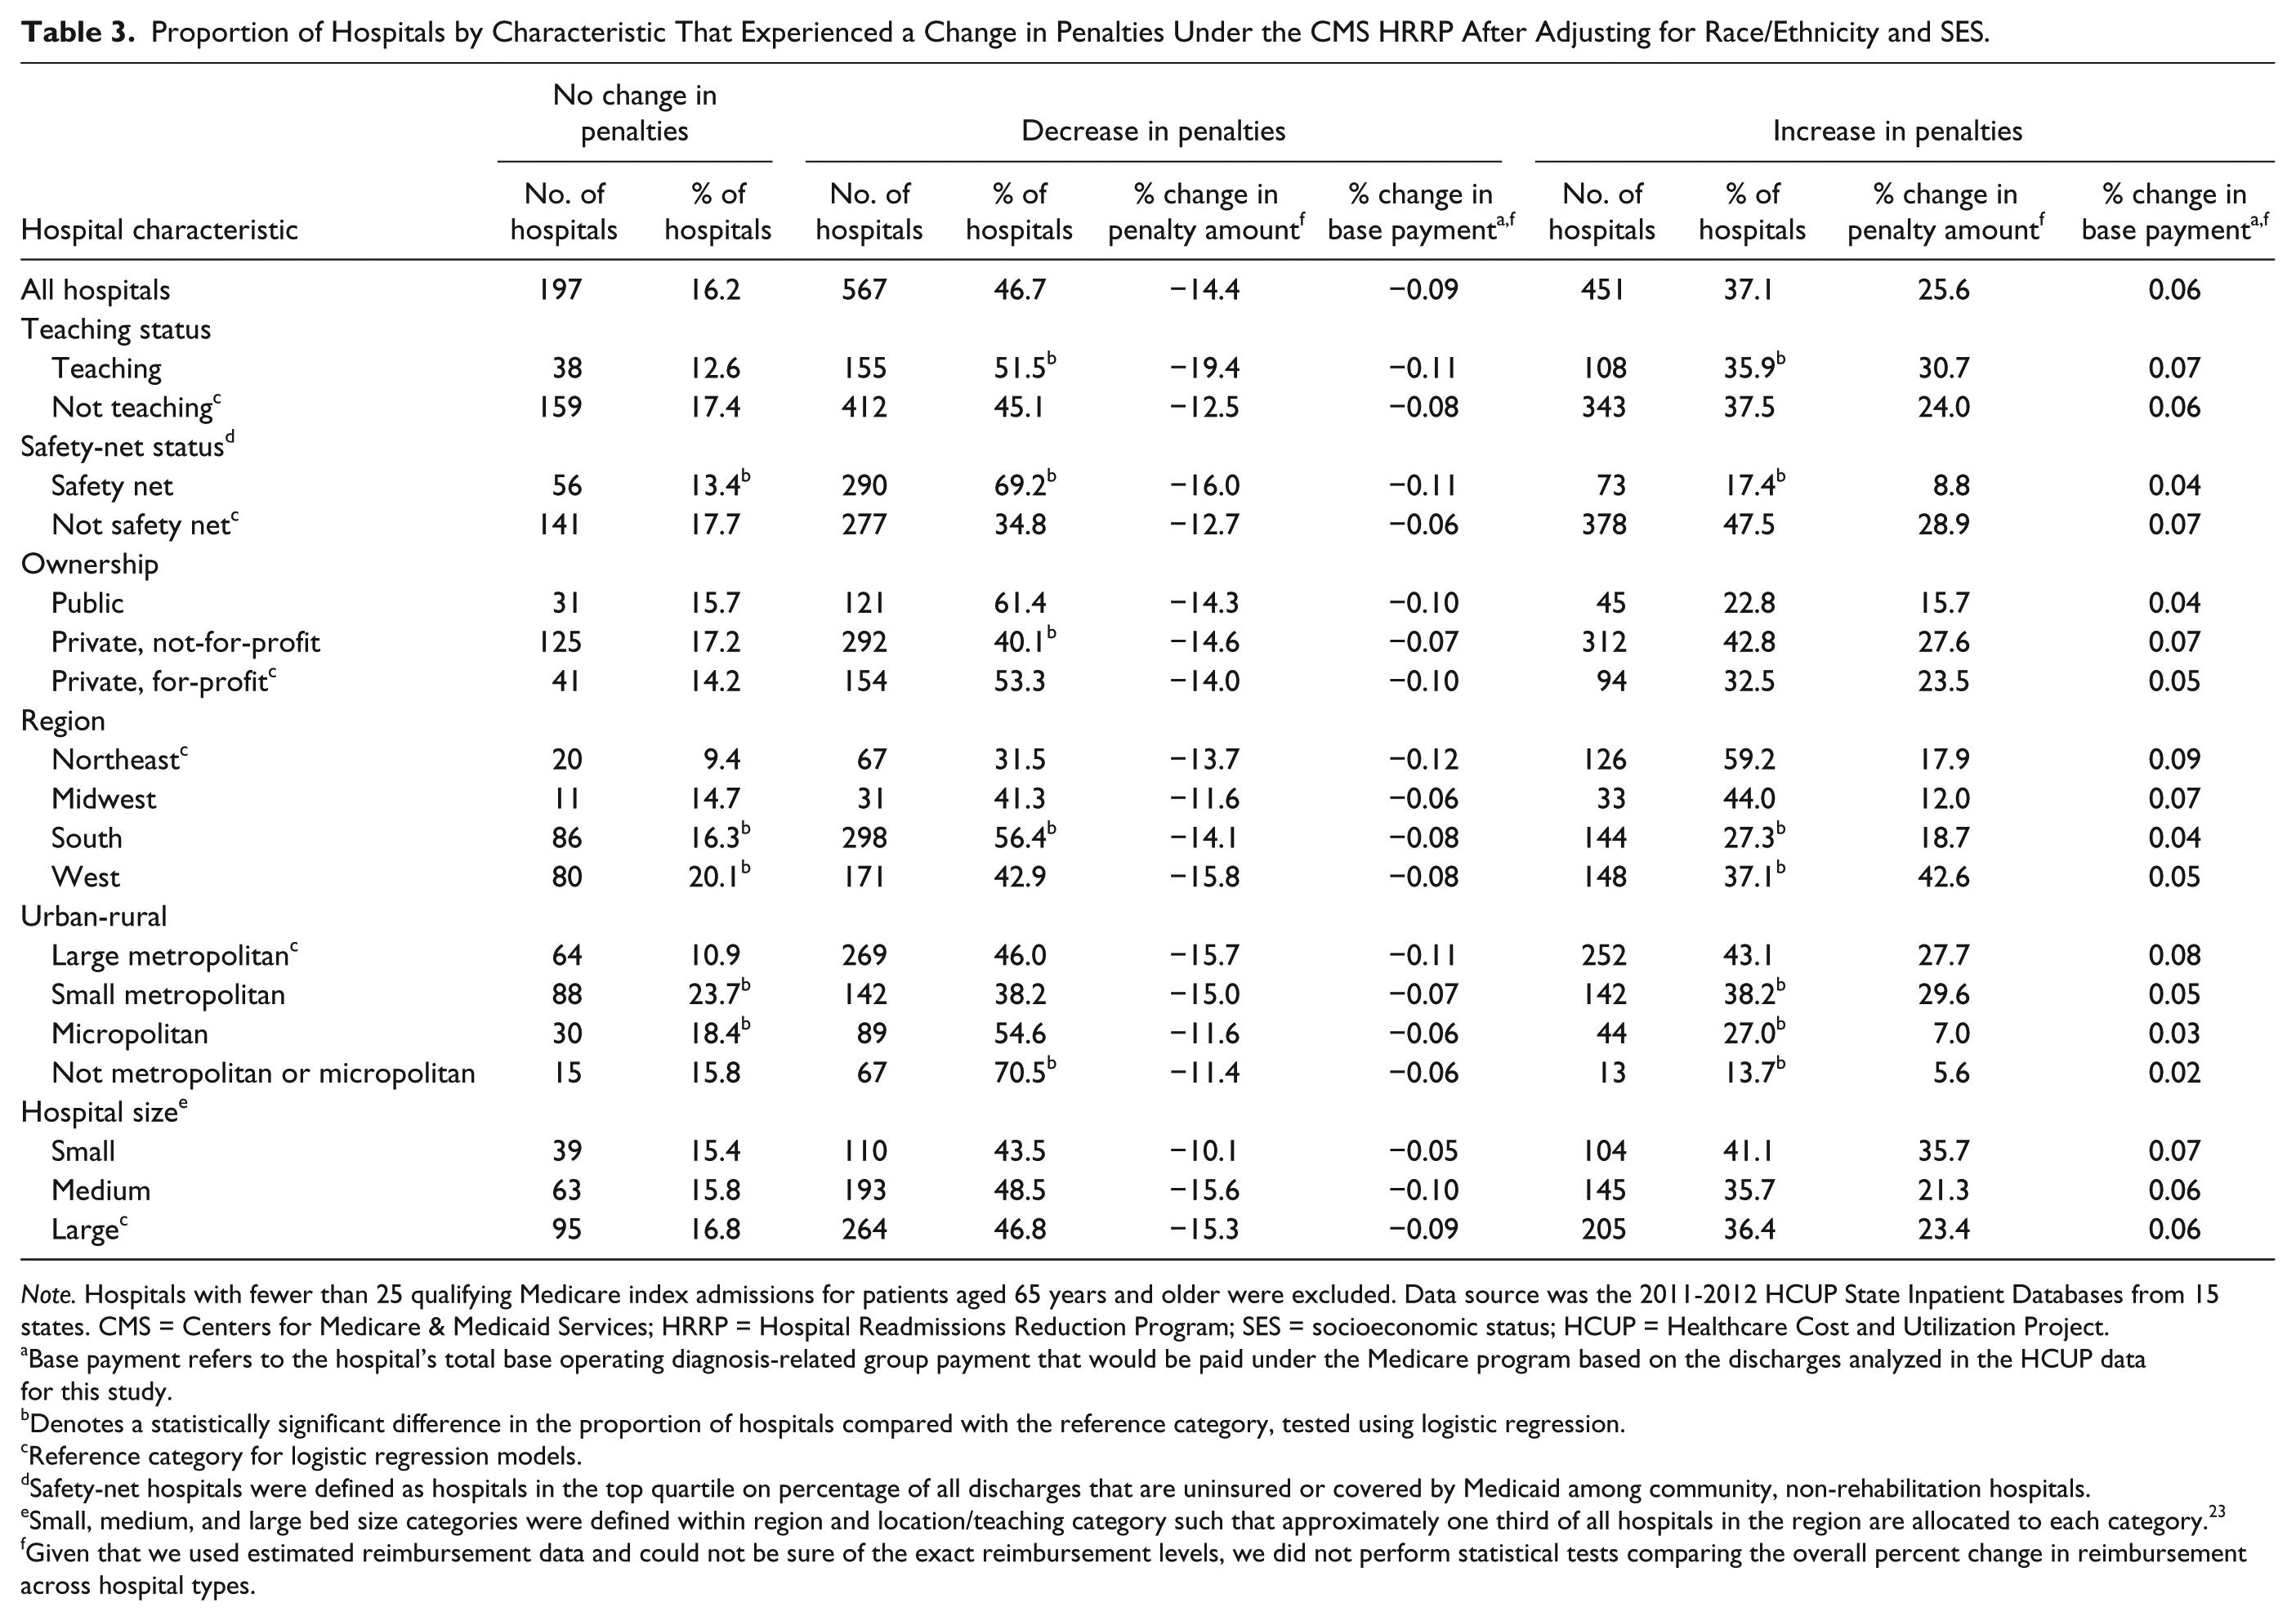
Note. Hospitals with fewer than 25 qualifying Medicare index admissions for patients aged 65 years and older were excluded. Data source was the 2011-2012 HCUP State Inpatient Databases from 15 states. CMS = Centers for Medicare & Medicaid Services; HRRP = Hospital Readmissions Reduction Program; SES = socioeconomic status; HCUP = Healthcare Cost and Utilization Project.
Base payment refers to the hospital’s total base operating diagnosis-related group payment that would be paid under the Medicare program based on the discharges analyzed in the HCUP data for this study.
Denotes a statistically significant difference in the proportion of hospitals compared with the reference category, tested using logistic regression.
Reference category for logistic regression models.
Safety-net hospitals were defined as hospitals in the top quartile on percentage of all discharges that are uninsured or covered by Medicaid among community, non-rehabilitation hospitals.
Small, medium, and large bed size categories were defined within region and location/teaching category such that approximately one third of all hospitals in the region are allocated to each category. 23
Given that we used estimated reimbursement data and could not be sure of the exact reimbursement levels, we did not perform statistical tests comparing the overall percent change in reimbursement across hospital types.
Discussion
Our study demonstrates that most eligible hospitals were affected by race/ethnicity and SES adjustment. This finding is consistent with previous studies showing that race/ethnicity and SES can influence patients’ probability of readmission and potentially hospitals’ readmission rates.2-10 To our knowledge, no studies have investigated extensively how the addition of race/ethnicity and SES to risk-adjustment algorithms might affect measures related directly to the CMS HRRP and hospital payments. One study found that adding SES to risk-adjustment algorithms would alter the risk-adjusted readmission rates for HF, AMI, and pneumonia. 24 However, that study focused only on hospitals in Missouri and did not examine the excess readmission ratio, which has direct implications for the HRRP. Another study found that adding race and SES to risk-adjustment algorithms for total hip and knee replacements had little impact on whether hospitals’ readmission rate differed from the national mean or crossed over the HRRP excess readmission ratio threshold of 1. 14 Our study advances this literature by showing the impact of adding race/ethnicity and SES directly on HRRP penalties, including all relevant conditions and procedures. We found that adding race/ethnicity and SES had a nontrivial effect on the size of the penalty (about a 10%-40% change), but it did not have substantial financial implications for hospitals because the penalty currently represents a very small proportion of hospitals’ overall Medicare base payments. In a sensitivity analysis, we tested adding only SES and found the impact would be similar.
The implications of these findings for reimbursement policy could be considered in different ways. On the one hand, although race/ethnicity and SES do affect readmission rates for a substantial proportion of hospitals, the estimated financial impact on hospitals is relatively small. On the other hand, adding race/ethnicity and SES to the risk-adjustment algorithm has nontrivial effects on the overall penalty—as high as 43% for some hospitals. If the HRRP penalty rate (currently a maximum of 3% of base operating DRG payments) increases in the future, the lack of race/ethnicity and SES risk adjustment may have a significant impact on the financial health of some hospitals. This is especially important considering that safety-net and rural hospitals were most affected by the addition of race/ethnicity and SES. Our findings regarding impacts on safety-net hospitals are consistent with a recent study using Medicare claims. 25
Limitations
Our results should be interpreted cautiously considering a number of methodological limitations. Because we did not have access to actual Medicare reimbursed amounts by hospital, we estimated the magnitude of the effect on readmission penalties. Our method for estimating reimbursement amounts differed from the CMS methodology in a number of important ways. First, we did not incorporate select payment adjustments such as transfers, outliers, and new technology add-ons, but we expect that the payment impact would be relatively small across hospitals. Second, our penalty calculations included MA, which accounts for approximately 30% of Medicare enrollees. The HRRP uses only Medicare Fee-for-Service, so our payment estimates per hospital are probably overstated and the impact on readmission rates is unknown. 26 Consequently, the effect of race/ethnicity and SES adjustment likely is even smaller than the small impact that we identified.
The following are additional limitations: (1) We were able to identify only comorbidities at the admission event, whereas the CMS approach uses a full year of comorbidities from all care settings; (2) although our SES measure was limited to the ZCTA, it is likely the same type of data that would be available to others, including CMS; (3) CMS estimates penalties for current year hospital payments on the basis of a prior 3-year performance period, whereas we estimated 2012 payments using 2011-2012 performance data. Small hospitals may be underrepresented, although inclusion of MA data may compensate for the shorter time frame; and (4) our data are drawn from 15 states. Although the data come from a set of diverse states, the results may not generalize to the nation.
Conclusions
We found that after adding race/ethnicity and SES to the CMS readmissions algorithm, most hospitals would experience changes in their penalty payments under the HRRP. Although the change in penalties was nontrivial, the effect on overall financial health of hospitals would be very small given the current size of the HRRP penalties. Safety-net and rural hospitals would fair substantially better than other hospitals although the penalty impact itself would be small. Policy makers should continue to consider the effect of race/ethnicity and SES on HRRP payments as the program evolves over time. Researchers might also explore strategies other than risk adjustment that account for hospitals providing care to a large number of patients with low income or patients from minority groups.
Footnotes
Appendix
Race/Ethnicity and SES Regression Coefficients From Hierarchical Logistic Regression Models.
| Effect | Estimate | SE | df | t value | Pr > |t| |
|---|---|---|---|---|---|
| HF model | |||||
| White | (default) | ||||
| Black | 0.04409 | 0.01359 | 376000 | 3.24 | .0012 |
| Hispanic | 0.05651 | 0.01646 | 376000 | 3.43 | .0006 |
| Other race | 0.01558 | 0.02018 | 376000 | 0.77 | .4401 |
| SES index | −0.02632 | 0.004872 | 376000 | −5.4 | <.0001 |
| AMI model | |||||
| White | (default) | ||||
| Black | 0.1386 | 0.02605 | 158000 | 5.32 | <.0001 |
| Hispanic | 0.05247 | 0.02832 | 158000 | 1.85 | .064 |
| Other race | −0.00606 | 0.03221 | 158000 | −0.19 | .8508 |
| SES index | −0.02962 | 0.008348 | 158000 | −3.55 | .0004 |
| COPD model | |||||
| White | (default) | ||||
| Black | 0.06674 | 0.01626 | 329000 | 4.1 | <.0001 |
| Hispanic | 0.01456 | 0.01946 | 329000 | 0.75 | .4542 |
| Other race | −0.07626 | 0.02516 | 329000 | −3.03 | .0024 |
| SES index | −0.02556 | 0.005467 | 329000 | −4.68 | <.0001 |
| Pneumonia model | |||||
| White | (default) | ||||
| Black | 0.1661 | 0.01917 | 308000 | 8.66 | <.0001 |
| Hispanic | 0.04807 | 0.02072 | 308000 | 2.32 | .0203 |
| Other race | −0.06822 | 0.025 | 308000 | −2.73 | .0063 |
| SES index | −0.02666 | 0.006081 | 308000 | −4.38 | <.0001 |
| THA/TKA model | |||||
| White | (default) | ||||
| Black | 0.1541 | 0.03863 | 293000 | 3.99 | <.0001 |
| Hispanic | 0.1071 | 0.04083 | 293000 | 2.62 | .0087 |
| Other race | −0.04815 | 0.05221 | 293000 | −0.92 | .3564 |
| SES index | −0.02318 | 0.01103 | 293000 | −2.1 | .0356 |
Source. Healthcare Cost and Utilization Project State Inpatient Databases from 15 states, 2011-2012.
Note. SES = socioeconomic status; HF = heart failure; AMI = acute myocardial infarction; COPD = chronic obstructive pulmonary disease; THA = total hip arthroplasty; TKA = total knee arthroplasty.
Acknowledgements
The authors gratefully acknowledge Bob Houchens, PhD (Truven Health Analytics), for providing statistical expertise; Minya Sheng, MS (Truven Health Analytics), for assistance in programming and data management; and Paige Jackson, MS, and Linda Lee, PhD (Truven Health Analytics), for providing editorial review of the article. They also wish to acknowledge the 15 Healthcare Cost and Utilization Project (HCUP) Partner organizations that contributed to the 2011 and 2012 HCUP State Inpatient Databases (SID) used in this study: Alaska State Hospital and Nursing Home Association, Arkansas Department of Health, California Office of Statewide Health Planning and Development, Florida Agency for Health Care Administration, Georgia Hospital Association, Hawaii Health Information Corporation, Massachusetts Center for Health Information and Analysis, Missouri Hospital Industry Data Institute, New Mexico Department of Health, New York State Department of Health, South Carolina Revenue and Fiscal Affairs Office, Tennessee Hospital Association, Utah Department of Health, Virginia Health Information, and Washington State Department of Health. Dr Audrey J. Weiss and Ms. Marguerite L. Barrett had full access to all of the data in the study and take responsibility for the integrity of the data and accuracy of the data analysis.
Authors’ Note
The views expressed in this article are those of the authors and do not necessarily reflect those of the Agency for Healthcare Research and Quality (AHRQ) or the US Department of Health and Human Services.
Declaration of Conflicting Interests
The author(s) declared no potential conflicts of interest with respect to the research, authorship, and/or publication of this article.
Funding
The author(s) disclosed receipt of the following financial support for the research, authorship, and/or publication of this article: This research was supported by the Agency for Healthcare Research and Quality (AHRQ); Center for Delivery, Organization, and Markets; and Healthcare Cost and Utilization Project (HCUP).