
Abstract
Risk adjustment and reinsurance protect plans against risk of losses and contend with adverse selection in the new health insurance Exchanges. This article assesses the power of reinsurance in the context of other plan payment features, including prospective and concurrent risk adjustment. Using data from the Medicare Expenditure Panel Survey (MEPS) to draw an “Exchange population,” we simulate the contribution of reinsurance to improving the fit of the payment system to plan costs and to mitigating incentives for adverse selection for groups of enrollees with selected chronic illnesses. Modest reductions in attachment points equate the payment-system fit of retrospective to concurrent risk adjustment. Reinsurance is very powerful in fitting payments to costs and moderately effective in dealing with selection incentives.
Introduction
Health insurance Exchanges are a centerpiece of the 2010 Patient Protection and Affordable Care Act (ACA). Beginning in 2014, U.S. citizens and legal residents not eligible for employer-sponsored or public coverage will be able to purchase health insurance that covers federally specified “essential health benefits.” Plans fall into one of four cost-sharing tiers (platinum, gold, silver, or bronze) defined by actuarial value. 1 Premium and cost-sharing subsidies will apply on a sliding scale for individuals and families earning up to 400 percent of federal poverty level. An estimated 25 million people are expected to purchase health insurance through these Exchanges (Congressional Budget Office 2012).
The goal of the Exchanges is to expand health insurance coverage, improve the quality of benefits offered, and reduce premiums in the small group and individual markets. Their success will depend on, among other things, how insurance plans are paid. The main problem facing health plans in an individual health insurance market with small numbers is the risk of enrolling some extraordinarily expensive enrollees, whether due to random variation, adverse selection, or other market problems. Adverse selection is a particular concern in the Exchanges because plans offering more generous benefits may attract individuals more likely to have high health care costs. Adverse selection creates incentives for issuers to degrade certain plan offerings. At its extreme, adverse selection can drive out the most generous plans altogether, as was the case in the Exchange-like Health Insurance Plan of California (HIPC) in the early 1990s (Wicks and Hall 2000).
The ACA includes several provisions that protect Exchange plans against financial risk and address adverse selection. First, Exchange plans can charge higher premiums to enrollees likely to cost more. Within regulated limits, plans can charge more to older enrollees, smokers, and those from more expensive regions. Second, the ACA mandates risk adjustment among plans to better match compensation to the expected health care costs of enrollees (Health and Human Services [HHS] 2013). Risk adjustment reallocates premium revenue among plans to account for differences in enrollees’ expected costs. Third, transitional reinsurance and risk corridors add further protections during the first three years of the Exchanges, from 2014 to 2016. Reinsurance protects plans from risks associated with high-cost individuals by reimbursing a share of the annual costs of care for enrollees who incur spending above a specified threshold. Risk corridors transfer payments from plans with low costs to plans with higher costs, relative to the revenues plans receive through premiums; this program targets the plan-level gains and losses associated with mispricing premiums (Baicker and Dow 2009; Hall 2011). When viewed as a package, the Exchange payment system aggressively protects issuers and reduces incentives for adverse selection.
Federal recommendations and state decisions about the specifics of risk adjustment and other payment-system features are likely to evolve over the first few years of Exchanges, making it useful to study how payment policies work together. In this study, we assess the power of the temporary reinsurance program of the ACA in the context of other plan payment features. We focus on how well reinsurance improves the fit of the payment system to plan costs and mitigates incentives for adverse selection. The fit of the payment system goes beyond the R-squared statistic from the risk adjustment model because premiums are adjusted by age and other factors, and reinsurance partly corrects for “outlier” cases. We therefore assess fit with a generalized form of the R-squared measure to capture the fit of revenues to costs taking account of the multiple features affecting the revenues. We assess incentives for adverse selection using predictive ratios (the ratio of net revenue to cost) for groups of enrollees with selected chronic illnesses. Using data from the Medical Expenditure Panel Survey (MEPS) to draw an “Exchange population,” we simulate the effect of reinsurance in the presence of premiums and risk adjustment consistent with ACA regulations. We study both concurrent risk adjustment, as recently recommended in federal regulations (HHS 2013), and the more traditional prospective approach to risk adjustment.
Background
Reinsurance
In exchange for a small premium for each enrollee, reinsurance payments cover a percentage of claims paid above a certain level (“attachment point”) and up to a specified annual amount. Private reinsurance has been available in the health insurance market for many years, and government-sponsored reinsurance has gained traction recently as a key feature in health care reform proposals (Swartz 2006). The power of reinsurance derives from the well-known skewness of the health expenditure distribution. The top 1 percent of the spending distribution has been estimated to account for between 22 and 29 percent of all expenditures (Conwell and Cohen 2005). Based on 2009 MEPS data, the top 1 percent of non-elderly privately insured individuals spend more than $51,951 in annual health expenses; the top 5 percent have expenditures above $17,402 (Kaiser Family Foundation [KFF] 2012). Without some protection from drawing these highest cost cases, insurers might set initial rates too high or decline entry into Exchange markets altogether. By transferring the risk of very large losses to third-party reinsurers, reinsurance also reduces selection incentives among plans (Dow, Fulton, and Baicker 2010). Reinsurance has drawbacks, however. In particular, because the responsibility for spending above the attachment point is largely offset for plans, reinsurance weakens plan incentives to constrain spending and to manage care delivery to the highest cost patients.
The ACA transitional reinsurance program seeks to stabilize premiums in the individual health insurance market as Exchanges are implemented (HHS 2013). The program will be financed by a per capita assessment on insurers, determined as a percentage of premiums and set annually. All non-grandfathered insurers and self-insured group health plans will contribute to the reinsurance pool based on this uniform national contribution rate, estimated to be $63 per capita in 2014. The ACA defines the national aggregate contributions for reinsurance payments to be $10 billion in 2014, $6 billion in 2015, and $4 billion in 2016, with U.S. Treasury contributions totaling $2 billion in 2014, $2 billion in 2015, and $1 billion in 2016 (HHS 2012). A state may collect additional contributions to provide funding for its administrative expenses or additional reinsurance payments.
Although all non-grandfathered insurers are required to contribute to the reinsurance pool, only plans in the individual market (inside and outside the Exchanges) can receive reinsurance payments. All covered claims, not just claims for the federally determined essential health benefits, will be eligible for reinsurance (Winkleman et al. 2012). Specifically, reinsurance under the ACA has an “excess-of-loss” function, reimbursing plans for a proportion of expenses incurred by the highest spenders. 2 For 2014, HHS specifies that reinsurance payments will cover 80 percent of costs exceeding $60,000 and up to a $250,000 cap (HHS 2012). Plans are expected to have commercial reinsurance covering costs above $250,000.
Public excess-of-loss reinsurance schemes in New York and Idaho, among other states, mitigate plan losses for high spenders (Bovbjerg et al. 2008; Swartz 2006). In an SCHIP-eligible population, Sappington et al. (2006) simulated plan profits under varying reinsurance parameters and find that aggressive public reinsurance reduces large financial losses associated with high-cost enrollees. At an attachment point of $10,000, reinsurance reduced average plan losses by 40 percent. However, Dow, Fulton, and Baicker (2010) used data from a Medicare population to demonstrate that even with reinsurance, insurers can still expect to lose $5,400 per individual in the top 1 percent, and $1,700 per individual in the top 3 percent of spenders. Thus, even after reinsurance, some financial risks to plans of enrolling high-cost patients remain, and incentives to enroll healthier patients can persist.
Reinsurance resembles “outlier risk sharing,” which can be regarded as mandatory reinsurance for insurers without risk-adjusted premiums (Van Barneveld et al. 2001). In outlier risk sharing, health plans are (partially) reimbursed for the expenditures of a member above a certain threshold. Van Barneveld et al. (1998), van Vliet and van de Ven (1992), and Beebe (1992) have shown that outlier risk sharing for a small proportion of high-cost users can protect against predictable losses at a relatively modest cost. There is little evidence regarding an optimal risk sharing mechanism, but there is a growing consensus that risk sharing is a useful tool in reducing predictable losses when risk adjustment is insufficient (Kifmann and Lorenz 2011). The ACA’s mandatory reinsurance program adds a new dimension to the empirical evidence regarding the power of reinsurance in reducing risk selection.
Risk Adjustment
Risk adjustment transfers payments across insurers, conditioned on observable characteristics of an enrollee related to health care spending. By compensating plans based on the underlying health status of enrollees, risk adjustment improves the match between plan payments and expected costs, protecting plans from drawing a sicker, more costly population. van de Ven and Ellis (2000) and Breyer, Bundorf, and Pauly (2012) reviewed the economic and policy literature on risk adjustment, including methods for construction of risk adjustment formulas, and international experience with risk adjustment systems. In the United States, formal risk adjustment has been used almost exclusively by public insurance programs (Keenan et al. 2001), most notably by the Medicare program that uses the Hierarchical Condition Category (CMS-HCC) model to adjust payments to Medicare Advantage and Part D (prescription drug) plans (Pope et al. 2011).
Unlike the transitional reinsurance program in the Exchanges, risk adjustment will be permanent. As stipulated in the ACA legislation and through subsequent regulations developed by the Department of HHS, risk adjustment will be based on state-level risk pools containing enrollees in the four metallic-tiered Exchange health plans and in individual (i.e., non-group) health plans purchased outside of the Exchanges. 3 HHS projects that $45 billion will be transferred among insurers through the risk adjustment program in the first three years of the Exchanges. The federal government will charge plans a nominal user fee, estimated to be less than $1 per capita, to fund the administration of the program, which is designed to be budget neutral within each state (HHS 2012).
The federal government has recently proposed a risk adjustment formula (HHS 2013). States are free to adopt their own system with appropriate notification and approval, but many states will likely follow federal recommendations. HHS proposes separate risk adjustment models for adults, children, and infants, and a separate model for each metal tier. The risk adjustment model adopts a modified version of the CMS-HCC model, adjusted to reflect different patterns of use within an Exchange population. The CMS-HCC model is the most well-known risk adjustment method, and it incorporates both demographic information and a set of major medical conditions to predict an individual’s health care expenditures. The model maps individual diagnoses from ICD-9 (International Classification of Diseases–Ninth Revision) codes (from both inpatient and outpatient visits) onto hierarchical condition categories (HCCs). The HCC diagnostic classification system imposes hierarchies among related clinical conditions such that a person is coded for only the most severe manifestation among related diseases (Pope et al. 2004). For each enrollee, a risk score is computed using 127 HCCs, multiple age/sex categories (eighteen for adults, eight for children), and an interaction between disease severity and selected HCCs. Infants are classified separately by gender, maturity, and severity of condition. The HHS risk adjustment system predicts plan liability for each enrollee without taking into account the proposed reinsurance program.
An important design choice for risk adjustment is the period over which enrollee health status is assessed. “Prospective” risk adjustment, the most commonly used method in the United States and internationally, uses information on an individual’s experience in the previous year (time t − 1) to determine how a plan should be paid for that individual in the subsequent year (time t). In contrast, “concurrent” risk adjustment uses an individual’s experience in the current year (time t) to determine payment in the same year (time t). With concurrent risk adjustment, plan payments must be reconciled after the end of a year to incorporate the effect of health events. HHS recommends concurrent risk adjustment in the Exchanges (HHS 2013).
By contrast, Medicare and Medicaid pay plans with a prospective risk adjustment system. Under prospective risk adjustment, plan payments are determined independently of current health care utilization, and plans have stronger incentives to manage use of services. Prospective risk adjustment has improved recently in its ability to match payments to costs. McWilliams, Hsu, and Newhouse (2012) showed that risk adjustment using the prospective CMS-HCC model reduced incentives for Medicare Advantage plans to enroll healthy patients and avoid sick ones. Using 2007 Medicare fee-for-service data, the Government Accountability Office (GAO) found that a revised CMS-HCC model targeting high-risk beneficiaries improved the accuracy of risk-adjusted payments for new enrollees with chronic illnesses and for those with multiple chronic diseases (GAO 2011).
Some research has begun to examine the properties of risk adjustment systems in Exchanges using simulation methods. McGuire et al. (2013) studied the fit of a prospective CMS-HCC risk adjustment model alone, and with premiums, using similar data as employed here. Because of the larger age range included in Exchanges and the contributions of premiums as well as risk adjustment to payment-system fit, the R-squared of the payment system in Exchanges will substantially exceed that achieved in Medicare. Weiner et al. (2012) used private claims data to simulate the impact of various risk adjustment methods and found that a diagnosis-based prospective risk adjustment substantially reduced under- and over-payments at the plan level in a simulated Exchange.
Because diagnoses that occur in a given year are more highly correlated with current year costs, concurrent models predict expenditures more accurately than do prospective models. Concurrent models can also be used when limited or missing historical data preclude the use of prospective models, as will be the case in the Exchanges: even after the start year, many participants may be new to a particular plan or market because of movement geographically or between plans. This new-enrollee problem also occurs in Medicare as beneficiaries “age in” with no prior experience in Medicare. CMS uses a separate age/gender-based risk adjustment model for Medicare Advantage beneficiaries with less than twelve months of data. New beneficiaries are assigned an age/gender risk score, and after one year of eligibility are assigned a risk adjustment score based on age/gender and prior health care use.
Concurrent models may heighten incentives to “upcode” diagnoses to increase payments (Dudley et al. 2002). Upcoding distorts the health risk profile of a plan and undermines risk adjustment. Concurrent models also replicate the incentives to over-provide care that are observed in fee-for-service reimbursement regimes because increases in current utilization can directly produce additional revenue. In their review of risk adjustment, van de Ven and Ellis (2000) argued that although greater predictive power is generally desirable, reimbursement incentives associated with concurrent payments render it inferior to prospective risk adjustment. Additional concerns about disincentives for medical management arise because acute conditions resulting from “loose” case management are rewarded under a concurrent model.
Combining Reinsurance and Risk Adjustment
Risk adjustment and reinsurance each offset some limitations of the other (Baicker and Dow 2009). In comparison with reinsurance alone, risk adjustment rewards insurers for covering those with above-average risk, not just the top spenders. Neither does it change the marginal incentive to save money on high-cost cases. Conversely, risk adjustment severely underestimates costs for individuals at the extreme high end of the spending distribution; reinsurance targets this problem directly. Hybrid models of risk adjustment and reinsurance reduce risk selection in research and practice. Using claims data from a sample of private and public health plans, Barry et al. (2012) found that reinsurance effectively addressed the most serious underpayment problems remaining after risk adjustment for mental illness. In the Netherlands, risk adjustment, alongside reinsurance covering 90 percent of all costs exceeding 20,000 euros, reduced but did not eliminate risk selection incentives (van de Ven and Schut 2008; van de Ven, van Vilet, and Lamers 2004).
Fundamentally, however, reinsurance and risk adjustment are substitutes: the presence of reinsurance reduces the contribution of risk adjustment to improving fit and to mitigating selection incentives; the converse is also true. An implication of this substitutability is that various combinations of reinsurance and risk adjustment programs can be adapted to achieve a policy target. Suppose we want the payment system to match costs to a certain degree, as measured by the payment-system R-squared. This could be done by a more aggressive risk adjustment policy (e.g., concurrent risk adjustment) paired with a less aggressive reinsurance policy (e.g., high attachment point). Alternatively, policymakers could choose a less aggressive risk adjustment policy (age–gender only) and a more aggressive reinsurance policy (low attachment point). Quantifying these policy trade-offs in the context of an Exchange population and ACA rules is a major objective of this article.
At present, little is known about how the various features of reinsurance and risk adjustment interact to impact incentives for selection within an Exchange population. This information can be helpful to states choosing the mix of risk mitigation programs. Examples of useful questions to answer include the following: How will variations in reinsurance parameters affect payment-system fit and risk selection incentives? How do alternative choices for risk adjustment (prospective vs. concurrent models, age/gender vs. diagnosis-based approaches) contribute to system fit in the presence of reinsurance? To what extent do selection incentives remain after risk adjustment and reinsurance are both applied? These questions can be addressed by a simulation of Exchange payment systems on a population representative of potential Exchange participants.
Data and Method
Data on the Exchange Population and Health Care Spending
The Medical Expenditure Panel Survey (MEPS) is a large, nationally representative survey of the civilian non-institutionalized U.S. population with information on approximately 33,000 individuals annually. We identify an Exchange-eligible population following methods in McGuire et al. (2012). Pooling MEPS data from Panels 9 (2004/5) through 14 (2009/10), and requiring participation in both years of the panel (i.e., dropping those who die during their first survey year), we select a population of individuals and families eligible for Exchanges based on income, insurance, and employment status. Specifically, we select adult, non-elderly individuals (aged 18–64) in households earning at least 138 percent of the federal poverty level (FPL) and children in households with income of at least 205 percent of FPL. Selection criteria into the Exchange population, as defined by the ACA, include individuals living in households in which an adult was ever uninsured, a holder of a non-group insurance policy, self-employed, employed by a small employer, or paying an out-of-pocket premium for their employer-sponsored health insurance (ESI) plan that is deemed unaffordable. The data set comprises 25,227 “Exchange-eligible” individuals, each with two complete years of health events, enabling us to compare prospective and concurrent risk adjustment. Because we require diagnostic data from the prior year to implement prospective risk adjustment, an individual in her second year of the survey is considered one observation.
MEPS data understate health expenditures (Aizcorbe et al. 2012; Sing et al. 2006; Zuvekas and Olin 2009). Discrepancies are driven both by underreporting of health care utilization and under-representation of high-expenditure cases due to the exclusion of patients who are institutionalized or hospitalized longer than forty-five days. Zuvekas and Olin (2009) determined that a two-step methodology corrects for this underreporting. Their method first calls for inflation of total expenditures by a factor of 1.09 for individuals with an inpatient claim and by a factor of 1.546 for all other claims. The second step re-weights the sample so that all individuals with total expenditures above $25,000 receive a weight of 1.3. We adopt these corrections, inflating expenditures of the individuals in our sample as directed and implementing a variation on the second-step up-weighting via resampling, described below (‘Resampling and Confidence Intervals’).
Risk Adjustment
We model three risk adjustment schemes: concurrent risk adjustment using HCCs, prospective risk adjustment using HCCs, and risk adjustment using age and gender only. We base our HCC models on the CMS-HCC model Version 12, adapted for the MEPS Exchange population following methods in McGuire et al. (2013). We use the same age categories as the CMS-HCC model but omit those older than sixty-five years old. We also exclude variables for Medicaid and disability status, as these individuals will not be participating in the Exchanges. We use publicly available three-digit ICD-9 codes in the MEPS data set rather than the five-digit codes used in the CMS-HCC model and include only forty-two HCCs due to limitations of our sample size. The remaining HCCs are categorized into “low” and “high” cost groups, based on whether average annual health expenditures of individuals in the HCC exceed $10,000. HCCs are included in the risk adjustment regressions as dummy variables. 4 Finally, the CMS/HCC categories omit certain conditions likely to be important in the Exchange population. Following procedures described by CMS, we introduce an HCC for pregnancy and pregnancy-related complications (Pope et al. 2011).
We estimate risk adjustment models through linear regression of total expenditures of plan-covered services on indicators for each of forty-two HCCs and a series of age/sex dummies. 5 Following HHS practice, the dependent variable in these regressions is total spending, not total spending after reinsurance or total covered spending (HHS 2012). The prospective model is estimated by regressing total expenditures in year t on the values of the HCCs from year t − 1, while the concurrent model uses both expenditures and values of the HCCs from year t. The prospective and concurrent models are otherwise identical. For the age–gender-only model, we restrict the predictor variables to be the age–gender variables from the CMS-HCC model.
Reinsurance
We model reinsurance in two parts that can be applied separately or in combination: HHS “transitional” reinsurance and “traditional” commercial reinsurance. For transitional reinsurance, we follow the policy proposed by HHS and model a program that reimburses health plans for 80 percent of claims paid by the plan above an attachment point of $60,000 and up to a cap of $250,000. In sensitivity analyses, we vary the level of the attachment point. For traditional reinsurance, we model a program that reimburses health plans for 85 percent of the claims paid by the plan above $250,000. Plans’ paid claims are estimated based on insurance coverage that will be provided through the Exchange silver-level plans (actuarial value = 0.70). 6
We assume that reinsurance is funded through a per capita actuarially fair premium collected for each Exchange enrollee. As we alter the attachment point in simulations, this premium changes to match the funding required for the reinsurance pool.
Simulations
We simulate the application of risk adjustment and reinsurance in Exchanges in four scenarios. The first scenario models concurrent risk adjustment, transitional reinsurance at an attachment point of $60,000, and traditional reinsurance at an attachment point of $250,000 to correspond with HHS proposals for the first three years of the Exchanges. Second, we simulate concurrent risk adjustment with no transitional reinsurance but with traditional reinsurance to correspond with HHS proposed policy for the Exchanges in year 4 and beyond. The third model simulates risk adjustment applied prospectively, with both transitional and traditional reinsurance. In this simulation, we vary the attachment point for transitional reinsurance, in increments of $1,000 from $10,000 to $250,000, to identify the combination of prospective risk adjustment and transitional reinsurance that gives an equivalent fit to that achieved with concurrent risk adjustment. In the fourth scenario, we simulate risk adjustment using age and gender only, in conjunction with the two reinsurance policies. We do so as a basis for comparison, and also to evaluate the performance of reinsurance when applied to individuals without historical claims data, which will be the case for new enrollees in the Exchanges.
Outcomes: Payment-System Fit and Selection Incentives
One objective of payment policy is to match payments to expected costs for individuals. Risk adjustment systems are commonly graded by their R-squared, a statistic reporting how much of the variation in health care costs is explained by the variables in the regression underlying the risk adjustment formula. Our generalization of the statistical R-squared metric reflects how much of the total variation in plan-paid costs is captured by all payment-system features. For each individual, we construct a measure of total payments to the plan (i.e., plan revenues), including the premium, risk adjustments, and reinsurance if applicable. This value is then compared with the individual’s costs to construct our fit measure.
7
Specifically, let ri be the total revenue a plan receives for person i after risk adjustment and reinsurance, and ci be the total costs for person i. Total variation in plan costs is
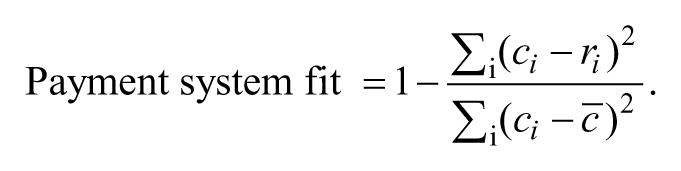
Simulations change the revenue for each person, ri, whereas plan costs for each person are constant in all simulations.
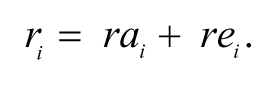
Plan revenues for each individual are the sum of the premiums, risk-adjusted payments, and net reinsurance payments (payments less reinsurance premiums). In a preliminary analysis, we calculated the premiums necessary to cover costs for various premium categories in the context of concurrent and prospective risk adjustment and assuming premiums are set competitively.
8
Because these risk adjustment systems also use age, among other variables, to predict cost, the premiums necessary to cover the residual variation in costs (given risk adjustment) varied very little among age categories. Moreover, in simulations allowing premium discrimination on age, we observed a very small impact on our results. In what follows, we therefore assume uniform premiums at value

Because premiums are set competitively,
The net reinsurance payment
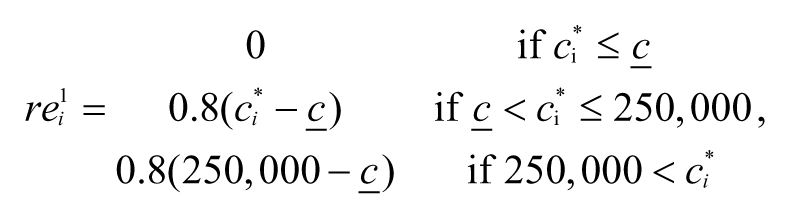

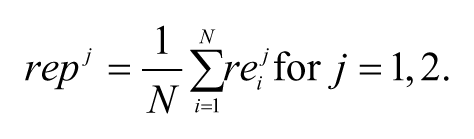
As discussed above, the reinsurance premiums are calculated to be actuarially fair and are the same for every individual. Therefore, we calculate them as follows:
Thus, as the attachment point
A second objective of payment policy is to mitigate incentives related to adverse selection. A risk adjustment system that fully captures the variation in spending predictable by plans and enrollees could eliminate incentives for selection, but real-world risk adjustment systems are far from achieving this standard (van de Ven and Ellis 2000). One concern regarding adverse selection is that plans will discourage enrollment by groups with certain chronic illnesses. For example, a plan might discourage membership by persons with mental illness by including only a limited network of poorly paid mental health providers, impeding access relative to persons with other illnesses. A risk-adjustment-payment system will typically cover mean costs for the entire population, but there is no guarantee that mean payments will equal mean costs for particular subgroups.
Incentives related to this group-level section are commonly assessed by predictive ratios for groups defined according to the presence of one or more illness (Pope et al. 2011). Specifically, the predictive ratio for members of group G (e.g., persons with a certain illness in time t) is

A predictive ratio indicates underpayment for a group if it is less than one and overpayment if it is more than one. 10 For the entire population, because payments track plan costs on average, the predictive ratio is always one. For higher-cost groups, we expect the predictive ratio to be less than one. As in the calculation of payment-system fit, the estimates of revenue paid to plans for each person varies by the simulation, but costs for each person are constant.
We report the predictive ratios for four subgroups of Exchange participants: patients with current (year t) diagnoses of Heart Disease, Cancer, Mental Health and Diabetes. These disease groups were chosen because they tend to be persistent and high-cost conditions. Diagnoses are based on Clinical Classification Software (CCS) categories that are derived from ICD-9 diagnosis codes in MEPS event files. 11 An individual with at least one event with a CCS code belonging to a disease group is classified as a member of that group.
Resampling and Confidence Intervals
Although MEPS data have been used previously to study reinsurance (Baicker and Dow 2009; Dow, Fulton, and Baicker 2010), we recognize that our data set is relatively small for payment-system simulations involving risk adjustment and reinsurance. CMS estimates HCC risk adjustment models, by comparison, on data with more than one million observations. Results from a smaller data set are vulnerable to outliers in spending and the distribution of spending. 12 To partially contend with this problem, we conduct a resampling exercise.
Our resampling method is as follows. Using the MEPS Exchange population, we drew a weighted random sample with replacement of 20,000 individuals, where the resample weights are set such that an individual with total annual expenditures above $25,000 is 1.3 times more likely to be chosen than any other individual (Zuvekas and Olin 2009). We perform all of the above simulations on the drawn sample and then repeat this for 1,000 resamples from our data. We report in the text the average R-squared and predictive ratios across all the resamples. The appendix reports the 5th–95th percentile range for our results.
Results
Table 1 reports the demographic and health characteristics of our Exchange population. Two-thirds of individuals are age forty-four or younger, and half are male. The population is racially diverse: half are white, non-Hispanic, nearly 30 percent are Hispanic, and 13 percent are black. Most are continuously employed (70 percent of the overall sample and 79.2 percent of all adults age nineteen and over). Uninsured individuals make up 53.8 percent of the population, while another one-third is enrolled through a small-group Employer-Sponsored Insurance (ESI) plan. Overall, the population is healthy, with 63.8 percent rating their health status as “excellent” or “very good.” The prevalence of the four chronic diseases we include in our simulations is relatively low, as to be expected in this young population; the share of patients in each of these diagnostic groups ranges from 2 percent (cancer) to 9 percent (mental health).
Sample Demographic and Health Characteristics (N = 25,227).

Source. Medical Expenditure Panel Survey (MEPS), waves 9–14.
Employment status includes the entire sample. Among adults age 19+, 79.2% are continuously employed and 10.8% continuously unemployed.
Table 2 reports some statistics on the distribution of total medical expenditures (payments from all sources). Average annual per capita medical expenditures are $3,103. 13 Table 2 divides the Exchange population into three groups according to health care expenditure categories consisting of individuals in the top 1 percent (n = 252), the remainder of the top 10 percent (n = 2,270), and the bottom 90 percent of the distribution of health care expenditures (n = 22,705). We decompose the mean and variance into the contribution from each group. The top 1 percent spends $70,000 annually on average, five times more than individuals in the rest of the top decile and much more (fifty-seven times more) than the lowest 90 percent, whose average expenditures are $1,235. As expected, the top 1 percent of enrollees disproportionately contributes to the mean, accounting for 23 percent of the mean spending.
Distribution of Health Care Expenditures within Study Sample.
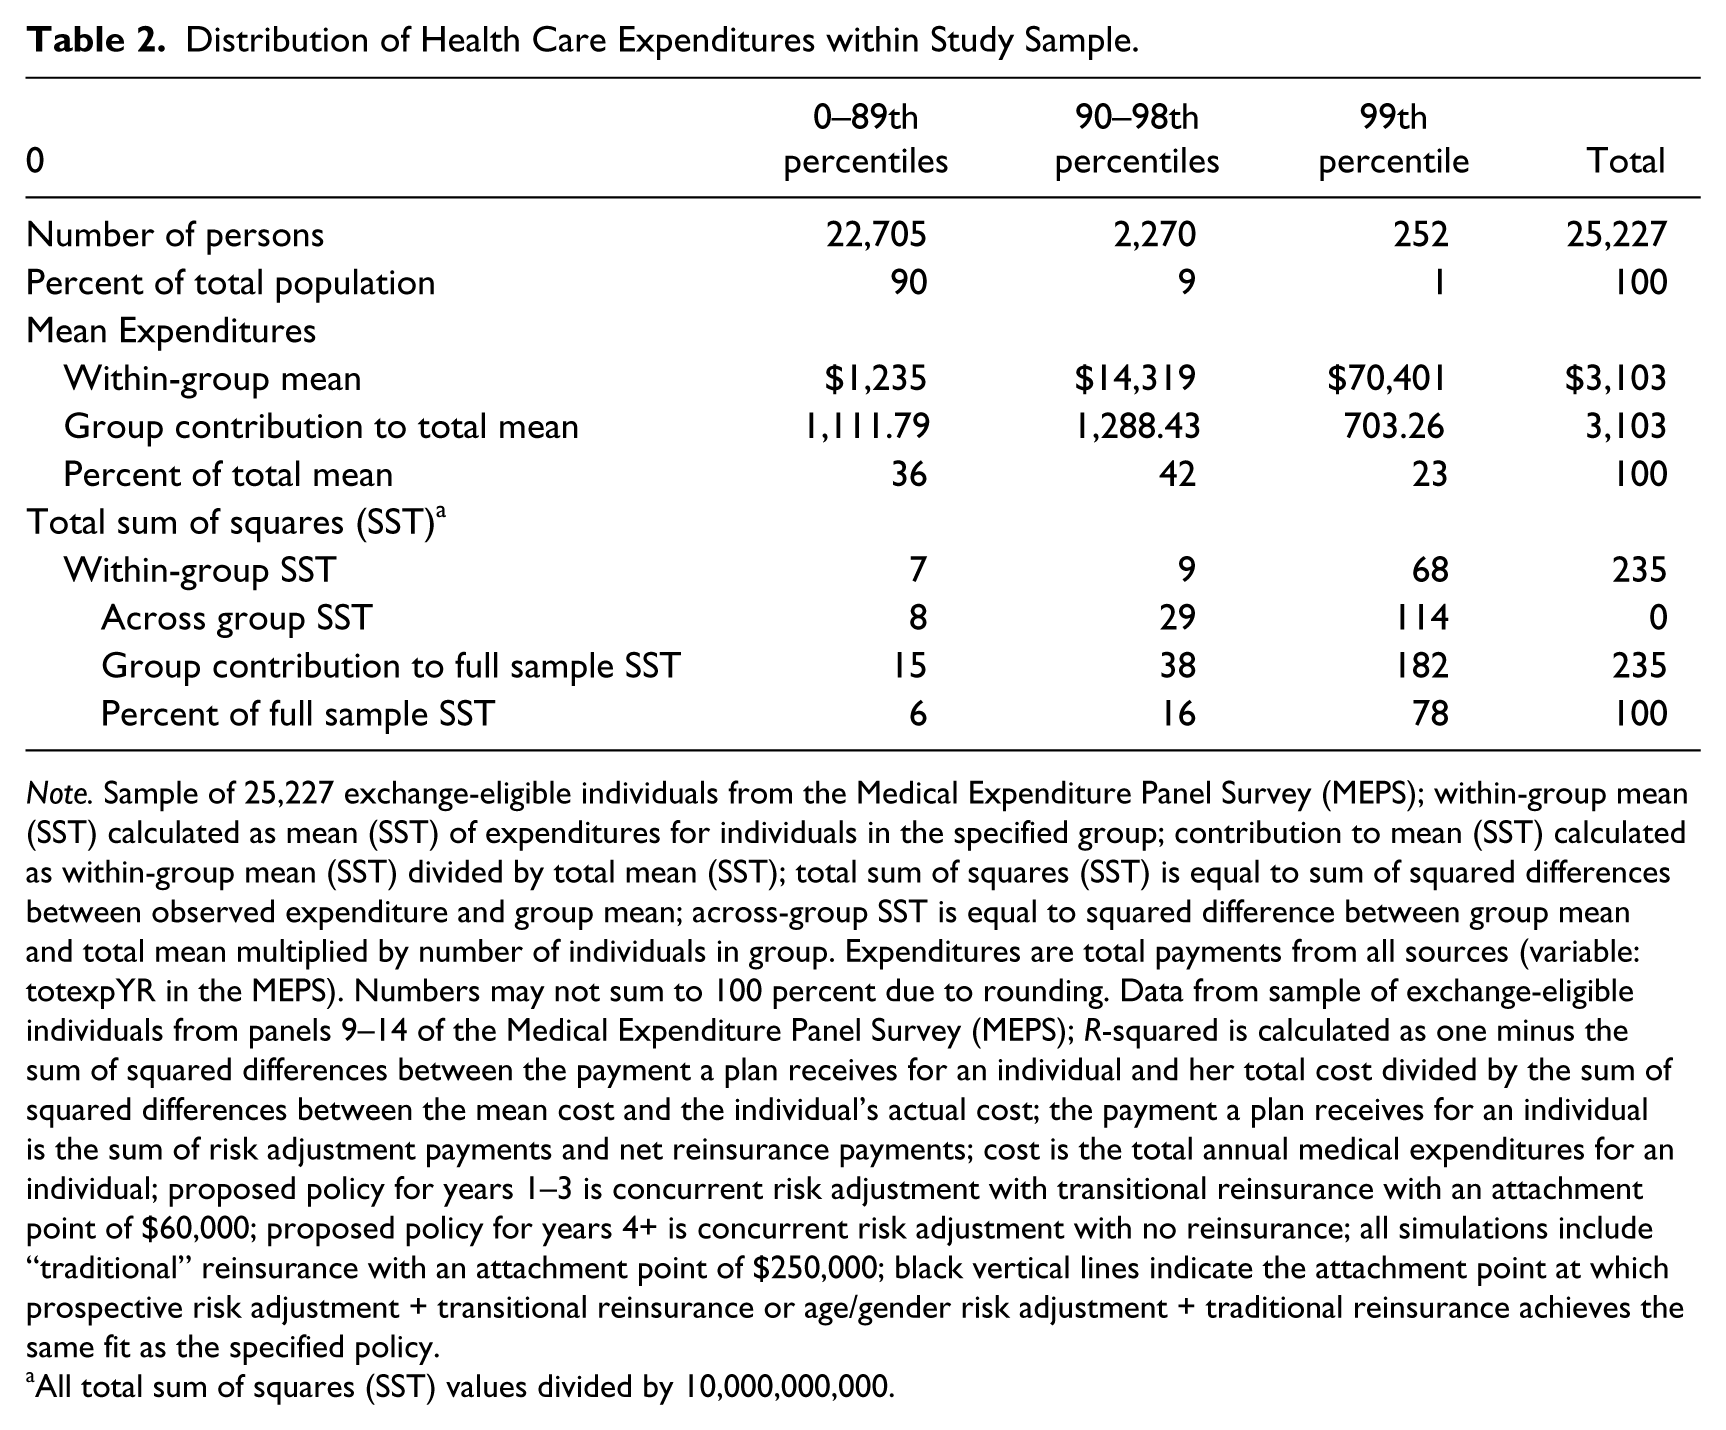
Note. Sample of 25,227 exchange-eligible individuals from the Medical Expenditure Panel Survey (MEPS); within-group mean (SST) calculated as mean (SST) of expenditures for individuals in the specified group; contribution to mean (SST) calculated as within-group mean (SST) divided by total mean (SST); total sum of squares (SST) is equal to sum of squared differences between observed expenditure and group mean; across-group SST is equal to squared difference between group mean and total mean multiplied by number of individuals in group. Expenditures are total payments from all sources (variable: totexpYR in the MEPS). Numbers may not sum to 100 percent due to rounding. Data from sample of exchange-eligible individuals from panels 9–14 of the Medical Expenditure Panel Survey (MEPS); R-squared is calculated as one minus the sum of squared differences between the payment a plan receives for an individual and her total cost divided by the sum of squared differences between the mean cost and the individual’s actual cost; the payment a plan receives for an individual is the sum of risk adjustment payments and net reinsurance payments; cost is the total annual medical expenditures for an individual; proposed policy for years 1–3 is concurrent risk adjustment with transitional reinsurance with an attachment point of $60,000; proposed policy for years 4+ is concurrent risk adjustment with no reinsurance; all simulations include “traditional” reinsurance with an attachment point of $250,000; black vertical lines indicate the attachment point at which prospective risk adjustment + transitional reinsurance or age/gender risk adjustment + traditional reinsurance achieves the same fit as the specified policy.
All total sum of squares (SST) values divided by 10,000,000,000.
The skewness of expenditures has an even more striking effect on the variance. Variance can itself be decomposed into across-group components (squared differences of the group mean from the overall mean) and within-group components (squared differences between the observation value and the group mean). Table 2 shows both summing these to the total variance accounted for the three groups. Notably, individuals in the top 1 percent of health care spending account for 78 percent of the total variance in spending for the entire population. We can thus expect that reinsurance policies that match payments for a small fraction of high spenders can be very effective at improving a payment system’s fit, as measured by a reduction in variance (like an R-squared). To illustrate the skewness of expenditures and reinsurance under the parameters being implemented in the Exchanges, just 0.4 percent (110) of individuals in our sample receives a reinsurance payment, but these payments comprise 4.5 percent ($3,493,920) of total costs in the sample.
Figure 1 assesses the fit of prospective CMS-HCC risk adjustment and age/gender (only) risk adjustment with different attachment points. The figure compares these fits to those of the payment system under the short- and long-term proposed ACA policies. 14 Considering first the prospective risk adjustment model (dotted line), the fit of the payment system declines as the attachment point increases, as reinsurance picks up fewer and fewer of the high-cost cases. Age–gender risk adjustment, represented by the dashed line, has the same properties, but the fit is lower for any given attachment point, reflecting the lower explanatory power of age and gender compared with age–gender plus HCCs. Comparing the CMS-HCC system with age–gender risk adjustment illustrates the substitutability between risk adjustment and reinsurance. As Figure 1 indicates, a target fit of the payment system, for example, capturing 30 percent of the variance in plan cost, could be achieved by CMS-HCCs with an attachment point of approximately $165,000 or age–gender risk adjustment with an attachment point of $110,000. The lower attachment point in the age–gender approach substitutes for the better explanatory power of the HCC system.

Payment-system fit of prospective and age/gender risk adjustment models combined with reinsurance compared with proposed policies.
The upper horizontal line shows the payment-system fit for concurrent risk adjustment as proposed for years 1–3 of the ACA coupled with transitional HHS reinsurance at an attachment point of $60,000. Simulations on our Exchange population find that the fit of this proposed policy is 0.57. Prospective risk adjustment achieves this same level of fit with a transitional reinsurance policy attachment point of $50,000; for the age–gender-only risk adjustment, the attachment point is slightly lower, at $40,000. Thus, relatively modest reductions in attachment points bring the very simple risk adjustment system (age–gender) into equality with the complicated concurrent system as measured in terms of payment-system fit to costs. It is important to keep in mind that these alternatives achieve the same payment-system fit by working at different parts of the distribution of spending. The payment options may have quite different effects on the plan’s incentive to select for particular diseases, a subject we pursue with our predictive ratio analysis.
The lower horizontal line shows the fit of concurrent risk adjustment without transitional reinsurance, as proposed for the ACA exchanges in years 4 and beyond. The fit associated with this policy is lower, at a value of 0.31. The prospective risk adjustment model matches this fit under a transitional reinsurance policy with an attachment point of $160,000. For age–gender risk adjustment, a lower attachment point of $106,000 is needed to match payments to costs as well as the concurrent risk adjustment policy.
Figure 2 assesses the performance of the same four payment systems in terms of the predictive ratios for patients with Heart Disease, Cancer, Mental Health, and Diabetes. We observe considerable differences in predictive ratios across disease groups. Under concurrent risk adjustment with transitional reinsurance, the ACA policy for years 1–3, predictive ratios are greater than 1 (1.06) for heart disease, cancer, and diabetes, implying that under this policy plans will be overpaid for enrollees with these diagnoses by about 6 percent. In contrast, this policy yields a predictive ratio of 0.78 for mental health, indicating that plans will be underpaid by about 22 percent for these individuals. Considering the ACA policy for Exchanges for year 4 and beyond, the predictive ratio for the heart disease, cancer, and diabetes groups is approximately 1, whereas the predictive ratio for persons with mental illness is only 0.75. Adding transitional reinsurance to concurrent risk adjustment with traditional reinsurance does little to improve underpayment for mental illness.
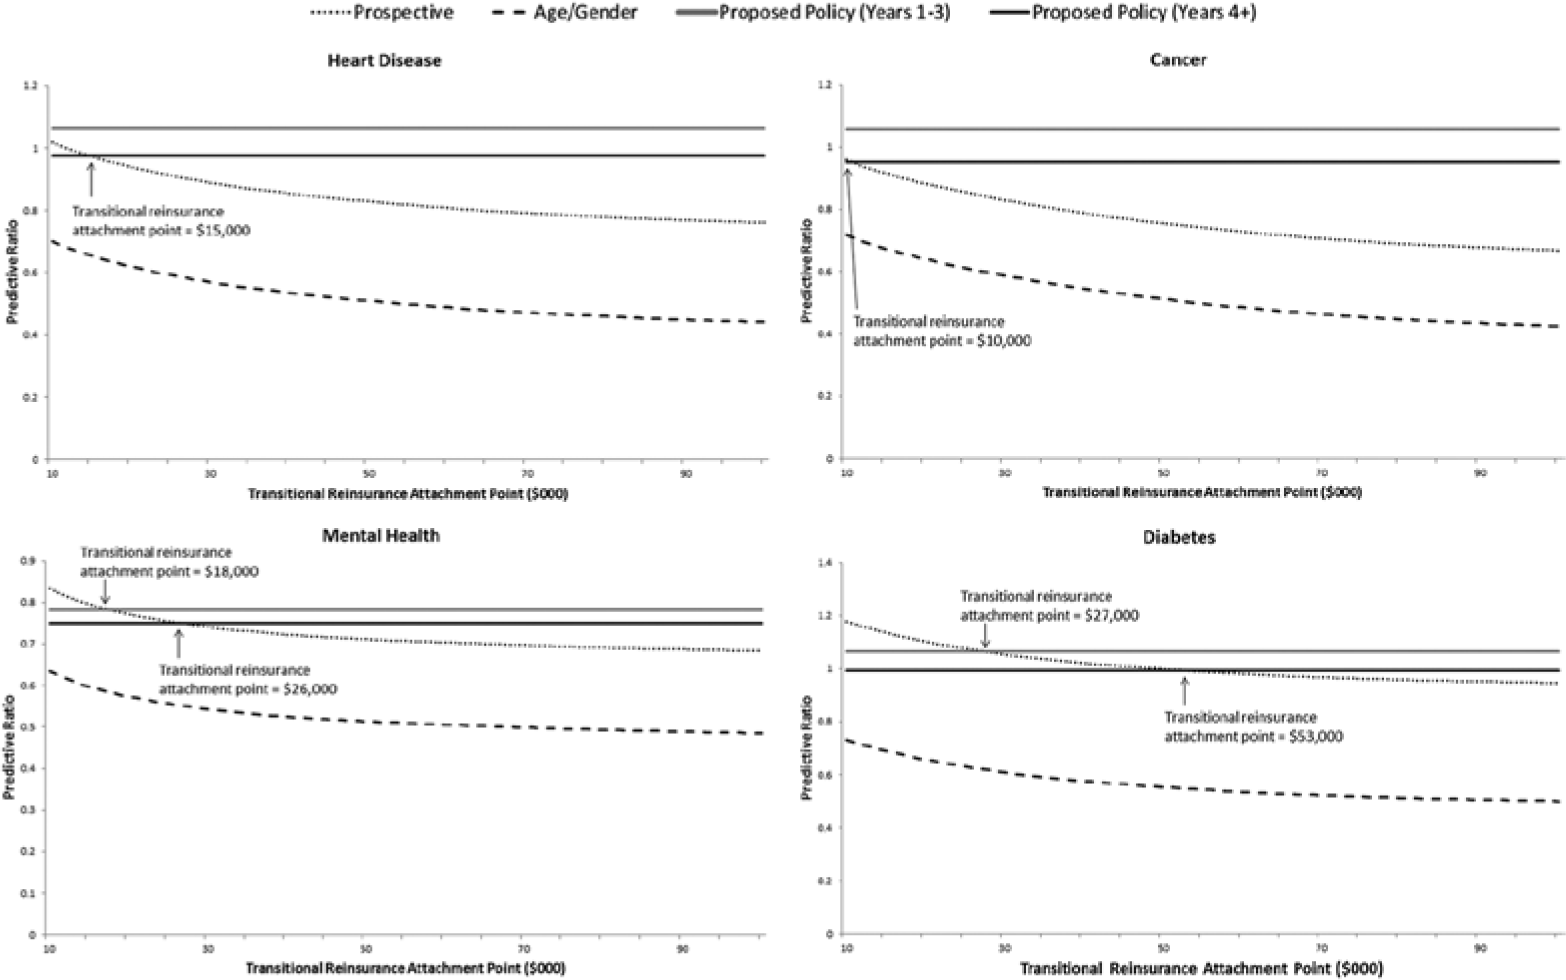
Predictive ratios under reinsurance and alternative risk adjustment policies, by disease group.
Prospective risk adjustment and transitional reinsurance requires low attachment points to match the predictive power of concurrent risk adjustment for individuals in our selected disease categories. For heart disease and cancer attachment, points of $15,000 and $10,000, respectively, are necessary to match the predictive ratio we estimate to characterize long-term ACA (years 4+) policy. Attachment points in a prospective system matching the concurrent system in years 4+ are $26,000 and $53,000 for diabetes groups, respectively. Note that in the case of mental health, the target predictive ratio is lower than for the other groups. An age–gender-only risk adjustment system is too weak to be rescued by attachment points down to $10,000.
Discussion
Prospective risk adjustment and reinsurance each improve the fit of the Exchange payment system. The severe skewness of health care costs means that the few reinsurance dollars going to the highest cost cases are well spent in improving the fit of a payment system. When used together, alternative combinations of risk adjustment and reinsurance can attain performance targets. The power of reinsurance means that with a modestly lower attachment point, prospective risk adjustment can fit costs as well as concurrent risk adjustment, a noteworthy finding given HHS’ recommendation that risk adjustment in the Exchanges be conducted concurrently. While a concurrent approach has greater predictive power, paying more as more services are provided weakens incentives to control utilization.
In addition to fit, another appeal of concurrent risk adjustment is avoiding the need for a prior year of data to construct risk scores, which will not exist for many Exchange enrollees in the initial years. This is not a new problem. Medicare, for example, uses age and gender to pay for new enrollees. We show here that even a primitive risk adjustment system when paired with reinsurance supplies a good fit. A modest reduction in the attachment point (from $60,000 to $50,000) brings the performance of age–gender near that of concurrent risk adjustment. When paired with reinsurance, a system like Medicare with a risk adjustment system for enrollees with and without history would sacrifice little in terms of payment-system fit.
In sum, prospective risk adjustment and reinsurance, aligning Exchange policy with Medicare and other risk adjustment contexts, is a feasible design choice that allows policymakers to hit policy targets for the predictive accuracy of payments without introducing the perverse incentives associated with a concurrent risk adjustment model. Indeed, reinsurance is so effective that it may be worth considering extending the period of mandatory low attachment point reinsurance beyond the first three years of an Exchange.
The story is different when it comes to incentives for selection as measured by predictive ratios for four chronic illness groups. Paired with reinsurance with a $60,000 attachment point, concurrent risk adjustment delivers predictive ratios above one for cancer, diabetes, and heart disease, meaning that plans will be more than adequately compensated for enrollees with these conditions. Even with traditional reinsurance with its much higher attachment point, concurrent risk adjustment yields predictive ratios near one for these three disease groups. Prospective risk adjustment needs impractically low attachment points to match this performance.
All risk adjustment systems studied perform worse for mental health and substance abuse as measured by the predictive ratio. Even with an attachment point of $60,000, concurrent risk adjustment pays on average only 80 percent of the plan costs of persons in this illness group. Concurrent risk adjustment is again superior, however, to prospective adjustment on this score. HCC payment models do less well at capturing costs for persons with mental illness than the other conditions studied, a finding that mirrors earlier results (Barry et al. 2012; McGuire and Sinaiko 2010). The implication of this finding is that plan selection incentives will be more problematic for mental health and substance abuse, as plans can try to avoid these patients by offering low-quality mental health care and making access to care difficult.
This study has several important limitations. First, results are based on a simulated Exchange population using MEPS data, not from actual Exchange participants. The fit of any payment system depends on the actual enrollees in a health plan, and this is especially true in the case of reinsurance—which depends in large part on the characteristics of patients who are extreme outliers in terms of health care expenditures. However, there will be outliers in health care spending in the Exchange plans, and thus it is important not that our sample represents the right-tail of the spending distribution perfectly but that it is able to represent the extreme outliers well. Because the MEPS is a nationally representative survey, and care has been taken to reweight the sample so as to more accurately account for high-cost cases, we believe this to be the case. We do note that the confidence intervals for measures of fit of the payment systems (produced through resampling whereby outliers are randomly added or dropped for sensitivity analyses) are wider for payment systems with transitional reinsurance than for those without (Table A3 of the appendix). Thus, it will be important that our results be replicated on larger claims data sets, and eventually drawn from operating Exchanges.
Our models consider a typical Exchange plan from within the silver tier to illustrate the interaction between risk adjustment and reinsurance. Under the ACA’s requirement to offer coverage in different benefit, or “metallic” tiers, there may be incentives for adverse selection across tiers that we do not study. We do not model all payment-system features, including risk corridors, which are also intended to protect plans from risk and deal with selection. Analysis of risk corridors requires modeling costs at the plan level (where risk sharing is calculated), not costs at the individual level as modeled here. Analysis of risk corridors would also require different measures of payment-system fit and selection incentives than are used here that take account of effects at the plan level. Clearly though, a full understanding of properties of Exchange payment systems requires evaluation of risk corridors.
Missing from our analysis is consideration of how alternative payment-systems incentives to contain cost. If the only objectives of payment systems were to match revenues to costs and push predictive ratios to one, a cost-based reimbursement system would be optimal, but this is obviously incomplete. Both reinsurance and risk adjustment (either concurrent or prospective) alter the supply-side incentives to contain costs. Reinsurance, for example, weakens incentives for cost control once a patient’s expenditures exceed the attachment point. These incentives change the care provided in ways that are not modeled in our static simulation analysis, affecting overall costs as well as costs for particular types of care. A comprehensive analysis of payment-system alternatives would take such effects into consideration.
Reinsurance can be a powerful tool to improve the functioning of individual health insurance markets, serving insurer interests of reducing exposure to risk and social interests of mitigating incentives for adverse selection. The power of reinsurance creates options for risk adjustment and other plan payment policy. Modest reductions in the attachment point can save the need to collect detailed data to construct an elaborate risk adjustment formula, or may permit use of prospective rather than concurrent information about health care utilization to feed into the risk adjustment scheme. These properties may be important both for state-level policymakers, who have annual options for proposing alternative risk adjustment models and reinsurance parameters for their operation of Exchanges, and for policymakers at the federal-level setting guidelines for states.
Footnotes
Appendix
R-squared and Predictive Ratios from Resampling Exercise.
| M | 5th percentile | 95th percentile | |
|---|---|---|---|
| R-squared | |||
| Concurrent | 0.22362 | 0.19417 | 0.25721 |
| Prospective | 0.13512 | 0.10969 | 0.16519 |
| Concurrent + TR | 0.31133 | 0.22143 | 0.42847 |
| Prospective + TR | 0.23098 | 0.13603 | 0.36204 |
| Age–gender | 0.039632 | 0.032558 | 0.047932 |
| Age–gender + TR | 0.13853 | 0.04072 | 0.29168 |
| Predictive ratio—heart disease | |||
| Concurrent | 0.95185 | 0.8683 | 1.03161 |
| Prospective | 0.69636 | 0.61168 | 0.78075 |
| Concurrent + TR | 0.97673 | 0.87139 | 1.09487 |
| Prospective + TR | 0.72124 | 0.65266 | 0.79128 |
| Age–gender | 0.37709 | 0.33734 | 0.41887 |
| Age–gender + TR | 0.40197 | 0.3632 | 0.44307 |
| Predictive ratio—cancer | |||
| Concurrent | 0.91928 | 0.88014 | 0.95782 |
| Prospective | 0.58831 | 0.5069 | 0.66962 |
| Concurrent + TR | 0.95289 | 0.90173 | 1.01204 |
| Prospective + TR | 0.62192 | 0.56203 | 0.6841 |
| Age–gender | 0.34576 | 0.29719 | 0.39778 |
| Age–gender + TR | 0.37937 | 0.3342 | 0.42561 |
| Predictive ratio—mental health | |||
| Concurrent | 0.75084 | 0.71133 | 0.79106 |
| Prospective | 0.67303 | 0.63617 | 0.70799 |
| Concurrent + TR | 0.74937 | 0.71105 | 0.78853 |
| Prospective + TR | 0.67156 | 0.63589 | 0.70611 |
| Age–gender | 0.47476 | 0.44877 | 0.50205 |
| Age–gender + TR | 0.47329 | 0.44766 | 0.50003 |
| Predictive ratio—diabetes | |||
| Concurrent | 0.99396 | 0.97531 | 1.01239 |
| Prospective | 0.90997 | 0.86474 | 0.94746 |
| Concurrent + TR | 0.993 | 0.97462 | 1.01176 |
| Prospective + TR | 0.90901 | 0.8652 | 0.94687 |
| Age–gender | 0.46439 | 0.42509 | 0.5073 |
| Age–gender + TR | 0.46344 | 0.42503 | 0.5044 |

Note. Results from 1,000 random resamples of study sample; observations with spending over $25,000 weighted 1.3 times the weight of other observations. R-squared is the sum of squares of the difference between the individual’s cost and the individual’s payment divided by the sum of squares of the difference between the individual’s cost and the average cost; predictive ratios are the average cost for individuals in a disease group divided by their average payment. Concurrent (prospective) refers to a risk adjustment model where current expenditures are regressed on current (previous year) HCCs; age–gender refers to a risk adjustment model where current expenditures are regressed on a series of age groups and a gender dummy. TR = Transitional Reinsurance; HCC = Hierarchical Condition Category.
Authors’ Note
We thank Kate Baicker, Randy Ellis, Laura Hatfield, Joe Newhouse, Alan Zaslavsky and Sam Zuvekas for comments on an earlier draft.
Declaration of Conflicting Interests
The author(s) declared no potential conflicts of interest with respect to the research, authorship, and/or publication of this article.
Funding
The author(s) disclosed receipt of the following financial support for the research, authorship, and/or publication of this article: Research for this paper was supported by the National Institute of Mental Health (R01 MH094290).