
Abstract
Between 1996 and 2003, a series of amendments were made to the Tax Reform Act of 1986 that gradually increased the tax deduction for health insurance purchases by the self-employed (SE) from 25 to 100 percent. We study how these changes have influenced the likelihood that a SE person has health insurance coverage as the policyholder. The Current Population Survey is used to construct a data set corresponding to 1995–2005. Both the difference-in-differences and price elasticity of demand estimates suggest that the series of tax deductions did not provide sufficient incentives for the SE to obtain health insurance coverage.
Introduction
The 2010 Affordable Care Act (ACA) took effect in 2014 and aims to make health care affordable for the millions of Americans lacking coverage, eliminate pre-existing condition exclusions, and prevent insurers from dropping individuals when adverse health conditions arise. According to the Kaiser Commission on Medicaid and the Uninsured (2012), 48 million non-elderly Americans (ages sixty-four and below) were without coverage in 2011. This amounts to nearly one-fifth of the non-elderly population. More than half of non-elderly Americans receive their health insurance through their employers; nearly all midsize/large firms (more than two hundred employees) offer health insurance to their employees while only 61 percent of smaller firms offer coverage. Among individuals covered by employer-based plans, about half have coverage from a plan under their own name and the remaining half is covered as dependents. Only 5.7 percent of non-elderly Americans have health insurance through a private non-group plan. Those who lack health insurance often include low-income persons, single mothers and their children, and self-employed (SE) individuals. A recent Employee Benefit Research Institute report reveals that the SE and those who work for very small businesses (fewer than ten employees) make up more than a third of uninsured working non-elderly Americans (Fronstin 2010).
The cost and availability of health insurance has long been identified as a major concern for small businesses as they have to face many difficulties and expenses associated with finding, qualifying, and obtaining private health insurance in the non-group market. According to a recent survey conducted by the Kaiser Family Foundation (KFF 2010), the most common reason individuals mention for purchasing coverage in this market is being SE or a small business owner (45 percent of all responses). The ACA attempts to address some of these disadvantages and creates opportunities for coverage outside of employer arrangements. For example, among the provisions is the formation of state-based health insurance exchanges where individuals and small business owners (fewer than twenty-five workers) can purchase qualifying coverage for themselves (and their employees). There are other provisions of the health care reform that are designed to offer relief for individuals who find themselves in the non-group market, such as tax credits and temporary exemptions from employer fines and subsidies for small businesses. As the implementation of some health care reform provisions have already begun, an analysis of tax incentives previously offered to the SE may provide insights for understanding the effects of insurance exchanges. As Krueger and Kuziemko (2013) acknowledge, studying the SE can provide insights for understanding the effects of the ACA on the uninsured. They state that, despite other differences between the two groups, “the [SE] may be a good analogue for the uninsured,” as the majority of the uninsured does not have access to employer-sponsored insurance and has to make their decisions to purchase health insurance independently from their employers or fellow employees. In this article, we provide an assessment of how the amendments to the Tax Reform Act of 1986 (TRA86) affected non-group health insurance take-up among the SE.
The TRA86 granted SE persons the ability to deduct 25 percent of their health insurance premiums (i.e., own, spouse, and dependents) from their taxable income. The Small Business Job Protection Act of 1996 established a schedule that would gradually increase this deduction to 80 percent by 2007. Since then, the schedule has been accelerated twice with passage of the Taxpayer Relief Act of 1997 and the Tax and Trade Extension Relief Act of 1998. Through these series of amendments, the initial TRA86 tax deduction was increased to 30, 40, 45, 60, 70, and 100 percent in 1996, 1997, 1998, 1999, 2002, and 2003, respectively. Prior to this, the SE, who did not itemize their income tax deductions, paid for their health insurance with after-tax dollars. We use data from the 1996–2006 March Supplements of the Current Population Survey (CPS) to analyze the effect of these amendments over the period of 1995–2005. Specifically, we examine how changes in the tax code, concerning the deductibility of health insurance premiums by the SE, have affected whether an individual has coverage as a policyholder.
The most notable article addressing the issues surrounding the initial tax reform is Gruber and Poterba (1994), hereafter G&P94. They examine the original TRA86 with respect to the price elasticity of demand for health insurance coverage. Using data from the 1986–1987 and 1989–1990 CPS, they analyze the decision of the SE to purchase insurance before and after the initial 25 percent tax deduction. Using a difference-in-differences (DD) model, they compare wage/salary (WS) employees with the SE and show that the subsidy increased the demand for health insurance among the latter, albeit with marginal statistical significance. By comparison, we focus on estimating the effects of the entire series of amendments made to the TRA86 using eleven years of CPS data. The time frame we consider is not only longer than that analyzed by G&P94 but also provides a cleaner natural experiment. Their analysis is complicated by other changes that accompanied the TRA86 (as outlined in further detail below); the marginal tax rates (MTRs) and medical care expenditure deduction rules and rates were also altered during the same time period they consider.
Following G&P94’s strategy, we take a twofold approach. We first use a DD model where we study whether SE persons were more likely to purchase health insurance as a policyholder, relative to WS employees, over time as the TRA86 amendments provided increasingly generous tax deductibility. Second, we estimate the price elasticity of health insurance demand for various groups. Due to data limitations, G&P94 cannot distinguish between private coverage in one’s own name and that in someone else’s name (such as a spouse), and we show that this leads to somewhat inflated estimates of elasticity. Our empirical analysis is performed for prime-age (ages twenty-five to sixty) workers, separately for men and women. Overall, we find modest effects of the TRA86 amendments. Our estimates suggest that during the entire period of our analysis, 1995–2005, the tax deductions increased the likelihood that a SE man (woman) has coverage in his (her) own name by 6.53 (9.59) percentage points. Single persons and individuals eligible for TRA86 tax deductions tend to have the most elastic demand. These findings, taken together with our DD estimates, provide no evidence that the increased generosity of the TRA86 tax deductions were able to close the gap in health insurance coverage between the SE and WS workers.
In this article, we estimate DD models by comparing the WS with the SE as well as price elasticity models. The eleven years of CPS data we use offer several advantages over the existing studies, namely, we (1) consider the entire set of TRA86 amendments; (2) use a very large sample (639,493 total observations) from a nationally representative data set; (3) perform the analysis separately for men and women due to the large sample; (4) include a rich set of personal and family characteristics in our analysis; (5) utilize information on self-reported SE status, which is preferable to the income-based definitions of SE; and perhaps most importantly (6) observe health insurance policyholder status, which allows us to better gauge the effect of the tax deductions. With respect to this latter point, G&P94 cannot distinguish between health insurance coverage under one’s own name versus that in someone else’s name (such as a spouse). Presumably, the TRA86 amendments would impact not just health insurance coverage but policyholder status for the SE. Fortunately, the recent CPS data enable us to specifically address these issues.
Previous Research
Two recent studies, Heim and Lurie (2009) and Selden (2009) specifically focus on the SE and the amendments made to the TRA86. Heim and Lurie investigate the TRA86 amendments made between 1999 and 2003 using data from the 1999 Edited Panel of Tax Returns. They estimate the take-up elasticity of the demand for health insurance by the SE to be −0.316 (extensive margin) whereas the elasticity of demand for the amount of insurance purchased (intensive margin) is −0.733. While they report a statistically significant response by single taxpayers, they do not find significant effects for the sample of married couples. Overall, their estimated elasticities are substantially smaller than those of G&P94, which suggest limited effects of the tax policy. By using the tax return data, Heim and Lurie are able to form a panel and also observe whether the deduction was claimed and the corresponding amount as well. In spite of these advantages, there are also some drawbacks. First, they must rely on an income-based definition of SE, which can be problematic. 1 Second, they express concern that their sample may not be nationally representative (Heim and Lurie 2009, 1200) 11 Third, they observe the SE income at the tax unit level and not at an individual level. Fourth, the tax records do not contain detailed information on personal or family characteristics. Finally, Heim and Lurie have difficulty distinguishing between the extensive and the intensive margins. For example, yearly differences in the amount of the tax deduction claimed could be due to changes in the health insurance status of various household members.
By comparison, Selden (2009) considers the entire set of TRA86 amendments using data from the 1996–2004 Medical Expenditure Panel Survey (MEPS). He finds that the TRA86 amendments were associated with very large responses among the SE. His elasticity estimates of the demand for private coverage among the SE range between −0.951 and −2.656, depending on the specification and the sample being considered. In explaining these rather large figures, Selden notes that different price measures and specifications yield noticeably different results. In fact, estimates of the price elasticity of demand for health insurance in the existing studies vary widely depending on the specific population studied, time frame, unit of analysis, data source, price measure, source of variation in the price measures, and the methods that are used for analysis.
To begin, given the fundamental differences between the group and non-group markets, the price elasticity estimates need to be considered separately for these two markets. Second, some studies model the decision to purchase insurance by individuals while others focus on families; the latter typically produce smaller estimates of the price elasticity than the former do. Third, a comparison between the price elasticities can still be difficult because the estimates are based on the percentage change in the initial coverage rates that vary greatly depending on the various populations and time periods analyzed (which is why using semi-elasticities may be more appropriate). Furthermore, a simple comparison of elasticities may be misleading because studies use price variations around different premium levels. Krueger and Kuziemko (2013) make this point and go on to explain that there is no theoretical reason why one would expect the insurance demand to exhibit a constant elasticity with respect to price. They estimate the price elasticity of demand for health insurance based on a 2008 survey experiment that assessed the willingness to pay for a health plan among the uninsured. Their experiment yielded a price elasticity greater than one—this is larger than those uncovered in the prior literature. Krueger and Kuziemko note that because they study the effect of substantially subsidized premiums, their estimates of the price elasticity correspond to price variation around lower premiums than those investigated by other researchers. Similarly, Marquis et al. (2004) report a greater response around lower premiums than at higher levels.
Studies investigating the price elasticity in the private non-group market face an additional challenge due to the lack of reliable and meaningful price measures. This is also acknowledged by Dafny (2010), who argues that the difficulty in obtaining data on the private health insurance market arises from the complexity of the contracts that are renegotiated on a yearly basis and are not subject to the usual reporting requirements. One of the first studies of the non-group market is Marquis and Long (1995), who estimate the price elasticity of demand for working families using data from the 1988 March CPS and the 1987 Survey of Income and Program Participation (SIPP). Their policy simulations suggest that even a tax subsidy reducing the after-tax premium by 40 percent would increase the number of families purchasing non-group plans by no more than 8 percentage points. Their estimated price elasticities range from −0.27 to −0.64, depending on the sample. Long and Marquis (2002) analyze Washington’s Basic Health program—the first state subsidized insurance program in the country. To this end, they use data from Washington State’s Survey of the Uninsured in 1997 and find that increasing subsidies have only modest effects on participation in such programs. Their results suggest price elasticities ranging anywhere from −0.3 to −0.7. Marquis et al. (2004) use data for California collected from various sources including the CPS, SIPP, and National Health Interview Survey for 1996–2002. They estimate the price elasticity of demand for coverage by families who do not have access to group plans. Overall, their estimated elasticities vary between −0.2 and −0.5, with somewhat higher elasticities for the SE.
The Congressional Budget Office’s (CBO 2005) estimates of the price elasticity of demand, using data from the 2001 SIPP, also reveal a very limited response. For example, a 50 percent tax subsidy is estimated to increase an individual’s demand by 3.5 percentage points, yielding a price elasticity of −0.57. They uncover somewhat larger elasticities for the sample of poor individuals and smaller ones for less healthy individuals. This last finding is echoed by Auerbach and Ohri (2006). They use data from the 2002 SIPP and consider non-group insurance for single workers who are not offered employer-sponsored health insurance. Their full sample yields a price elasticity estimate of −0.59, which translates into a rather small effect on the uninsured given the low rate of initial coverage (16 percent). While the elasticity estimates differ somewhat in each of these studies, they agree that even sizable tax subsidies given to the working uninsured will generate only a limited response in the non-group market. Our findings are consistent with these empirical studies, which concluded that policies reducing the effective premiums for non-group coverage decrease the number of uninsured but with only very modest success.
In what follows, we neither do argue in favor of tax incentives to provide health insurance coverage nor do we address whether the policy is effective in terms of improving health outcomes for the SE. Instead, our aim here is to evaluate the effects of the policy changes on the health insurance coverage for the SE, abstracting away from any welfare gains or losses. The descriptive findings, reported below, indicate that even though many SE individuals are uninsured, WS employees and the SE seem very similar in terms of their self-reported health status despite the gap in insurance coverage. Similarly, Perry and Rosen (2004) find that the lack of coverage among the SE does not necessarily translate into worse health outcomes when they are compared with their WS counterparts. Meer and Rosen (2002) note that the determinants of health status are mainly due to factors other than health insurance (e.g., genetics, behavior, environment).
This article proceeds next by discussing the conceptual framework and the empirical implementation, which is followed by a description of the data used in the analysis. Finally, we present the results and conclude.
Conceptual Framework and Empirical Specification
We analyze the effects of the TRA86 amendments on the likelihood that a SE person has health insurance coverage as the policyholder. The TRA86 granted SE persons the ability to deduct their (i.e., own, spouse, and dependents) premiums from their taxable income. Eligibility is restricted to unincorporated SE persons with positive net profits who do not have access to employer-provided health insurance, for example, through their spouse. 2 Currently, SE persons are allowed to deduct 100 percent of their health insurance premiums from their taxable income—previously it had been 25, 30, 40, 45, 60, and 70 percent. Originally, the 25-percent deduction was temporary and set to expire in 1992. The deductions were, however, made retroactive for persons who filed an amended return and were made permanent in 1996. 3 A report to Congress (Lyke 2008) states that most SE who purchase health insurance in the individual market cannot claim the tax deductions given all the conditions. In 2008, only about 5.4 percent of all returns claimed the SE deduction, and the estimated tax expenditure corresponding to the deduction was about $5.2 billion (Joint Committee on Taxation 2009).
To examine the effects of the TRA86 amendments on the health insurance coverage of the SE, we first utilize a DD approach and follow G&P94’s strategy by comparing the SE with WS employees over time. For this purpose, we use the following regression where the dependent variable,

Some individuals may have coverage from alternative sources, such as through their spouse’s plan. The TRA86 amendments would not necessarily affect having any kind of coverage but it is more likely that they provided incentives for the SE to obtain coverage in their own name. Thus, we focus specifically on having a health insurance plan as the policyholder. By comparison, G&P94 focus on coverage under a private plan either in one’s own name or in someone else’s name. They do this because the CPS questionnaire changed in March 1988 making the survey responses regarding policyholder status inconsistent over their study period.
The key identifying assumption in estimating our model is that in the absence of the TRA86 amendments, the unobservable differences between the SE (treatment group) and the WS employees (control group) would be the same over time. In other words, the DD approach provides an unbiased estimate of the effect of the tax policy change assuming that the unobservable trend factors do not vary across the groups.
5
Another assumption made in estimating equation (1) is that changes in
In offering support for the aforementioned assumptions, we exploit the longitudinal feature of the CPS in addressing the possible endogeneity of any trends in SE. 6 The CPS can be used to create a short panel of two-year cross-sections by matching a subsample of individuals between each consecutive survey year. This subset of the CPS is referred to as the “outgoing rotation group” (ORG). 7 This feature of the CPS provides us with an opportunity to examine the possible effects of the TRA86 amendments on the year-to-year changes in labor market status, that is, between WS employment and SE. For this subset of individuals, we find that the fraction of individuals who switch jobs—from WS employment into SE and vice versa—in any given year is quite small; it is well under 0.5 percent of our ORG sample. Only about 2 percent of the sample switches over the entire ten-year period.
More importantly, there does not seem to be any discernible pattern over time that would indicate that the increasing generosity of the TRA86 amendments encouraged WS employees to switch into SE. Only about 10 percent of those who switch from WS employment to SE gain health insurance coverage over the entire period considered. In fact, it is more likely that they lose their policyholder status when they switch to SE. Similarly, among the SE who transition into WS employment, a larger portion gains coverage as a policyholder rather than lose it. 8 This is similar to the findings of Holtz-Eakin, Penrod, and Rosen (1996) who find no effect of health insurance portability on the likelihood of transition from WS employment to SE. Selden (2009) also concludes that there are no unobservable differences between the WS and the SE that would confound the estimation of the effects of the TRA86 amendments. While we are not claiming that the decision to be SE is exogenous, it seems very unlikely that the switch into SE is related to the likelihood of gaining coverage. Nor does the decision seem to be made in response to the TRA86 amendments. 9
We use a linear probability model (LPM) to estimate equation (1).
10
This specification allows us to see how SE persons were affected, relative to WS employees, and to gauge the effects of the increased generosity of the TRA86 deductions over time. Hence, the

where
Data
The data used in this article come from the CPS. The CPS is a monthly survey sponsored by the Census Bureau and the Bureau of Labor Statistics (BLS). Each month the CPS surveys some fifty thousand households (“occupied units”) and is designed to represent the U.S. civilian, non-institutionalized population. 11 Respondents are asked questions about themselves and persons in the household who are ages sixteen or older. The questions center on demographic characteristics and labor market activities but include other annual supplementary information as well (e.g., health insurance, tobacco use, computer ownership). The respondent (“reference person”) is often the owner or renter of the selected housing unit.
This study uses data from the 1996–2006 CPS surveys. The 1996 survey was the first year in which detailed questions concerning the source of coverage were asked. The analysis for this article focuses on workers between the ages of twenty-five and sixty. We exclude individuals who were (1) working in agriculture, (2) disabled, (3) full-time students, (4) in the Armed Forces, as well as those who were (5) unemployed, (6) not in the labor force, and/or (7) working without pay. 12 In our sample, we not only include the respondents but also any other individual in their family (e.g., spouse) who satisfies the age restriction and the other criteria mentioned above.
We perform the empirical analysis for men and women separately. In addition, we divide each gender into further subsamples based on family structure and eligibility status. Marital status is important in terms of having alternative sources of coverage. 13 Single individuals are a special group because they should be limited to having coverage only as policyholders. Married individuals, however, may be covered under their spouse’s health insurance plan. We also address the eligibility restrictions of the TRA86, as noted previously, by identifying individuals who are not covered as a dependent under an employer-provided plan and whose real annual earnings are at least $2,000.
The CPS uses a 4-8-4 sampling scheme meaning that each household is in the survey for four consecutive months, out for the next eight, and then returns for the following four months. This survey design creates a longitudinal, albeit short, component called the “outgoing rotation group.” Our analysis uses a series of pooled cross-sections that include duplicate observations on individuals who are part of the ORG sample. 14 The pooled cross-sections include repeated observations for the ORG respondents, and thus we adjust the standard errors by clustering within individuals to correct for possible autocorrelation. 15 This allows us to maintain the largest sample size and improves the precision of our estimates.
The 1996–2006 CPS cross-sectional data correspond to 1995–2005. This is because the health insurance questions are asked once a year in March and refer to coverage at any time during the previous calendar year. The CPS contains information on health insurance coverage from the following sources: (1) a private plan purchased through an employer (either as a policyholder or dependent), (2) a private plan purchased directly (either as a policyholder or dependent), (3) a private plan provided by someone outside of the household, (4) Medicare, (5) Medicaid, or (6) another type of plan (i.e., state-only, Military Health, and Indian Health Service). 16 The dependent variable used in our empirical analysis is whether an individual was covered by a non-public plan in his or her own name in the prior year, that is, WS policyholders of plans in category 1 and SE policyholders of plans in category 2. 17 Individuals are considered SE if they indicate being SE, in terms of the longest job held within the last year, and if their business was unincorporated. This is also consistent with the BLS’ definition of SE (Hipple 2004). As the longest job held corresponds to the prior year, it accords well with the health insurance measures.
The individual-level characteristics included in the analysis are age, its square, race (white, black, and other), ethnicity (Hispanic and other), and an indicator for whether an individual was born abroad. We include the following levels of completed schooling: high school graduate, some college, college degree, or advanced degree. Those with less than a high school degree are the omitted category. We also include an indicator for being married and the number of children under the age of eighteen. Finally, following the approach of Selden (2009), we explicitly control for an individual’s MTR. We estimate state and federal MTRs as well as FICA (Federal Insurance Contributions Act) tax rates using the National Bureau of Economic Research’s (NBER) TAXSIM program This program calculates individuals’ MTRs using information reported on their tax returns, including the tax year, state of residence, marital status, exemptions, various sources of income (such as WS, dividend, other property, social security, and pensions), and transfers (such as unemployment compensation and welfare). 18
Table 1 provides the descriptive statistics for men and women by employment status. To begin, SE persons are slightly older than their WS counterparts and a smaller fraction of the SE are black or Hispanic. Fewer of the SE report working the typical hours per week (thirty-six to fifty-five hours) compared with WS employees. While most men are full-time workers, there is a noticeably larger fraction of women who are part-time workers. As we focus on prime-age working individuals, the large majority of the sample reports their health status as excellent, very good, or good. The WS employees and the SE are very similar in terms of their self-reported health status. MTRs are slightly higher among the WS workers than the SE. The majority of our sample is married, and SE people are slightly more likely to be so compared with WS workers. This could simply be due to the small differences in age between the two groups. While there are no major differences in the number of children between WS and SE men, SE women seem to have more children.
Descriptive Statistics.

Note. Means and standard errors are based on weighted and clustered data. WS = wage/salary; SE = self-employed; HI = health insurance; MTR = marginal tax rate.
Means for spouse characteristics are conditional on being married.
For both sexes, a larger portion of the WS employees have some type of coverage than do the SE: 84.3 versus 66.7 percent for men and 87.7 versus 77.7 percent for women, respectively. This difference between the two groups is even more pronounced when one considers only the policyholders of private plans: 70.1 versus 21.4 percent for men and 57.7 versus 16.2 percent for women, respectively. Among the married persons, a larger percentage of men and women in WS employment are married to spouses who have some source of coverage but fewer of them report being married to spouses who are policyholders. In both the WS and the SE samples, it is more common for the women to be married to spouses with their own employer-provided plan than it is for men. For example, among the men in WS employment (SE), 36.6 percent (42.9 percent) are married to spouses who are policyholders of employer-provided private plans, whereas the corresponding figure for women is 64.1 percent (64.7 percent). In the next section, we present the estimation results of our DD and insurance demand models and discuss some robustness checks.
Results
Table 2 provides the simple sample means and the unadjusted DD estimates for men and women, respectively. Between 1995 and 2005, there are downward trends in the rate of health insurance coverage as a policyholder. For example, in 1995, 68.0 percent (55.6 percent) of all men (women) in our sample had coverage as a policyholder, whereas in 2005, this rate dropped to 63.0 percent (54.2 percent). Similarly for the WS men (women), the rates fell from 71.0 (57.5 percent) to 66.6 percent (56.4 percent). While the rate of coverage is always higher for WS employees than for SE workers, both groups experienced decreases over time. In 1995, 23.8 percent (19.5 percent) of the SE men (women) had coverage under their own name; this figure drops to 19.2 percent (13.7 percent) ten years later.
Proportion of Health Insurance Policyholders and Unadjusted DD Estimates.

Note. Means and standard errors (in parentheses) are based on weighted and clustered data. DD = difference-in-differences; WS = wage/salary; SE = self-employed.
Significance at 5%. **Significance at 1%.
The simple differences listed in columns 4 and 5 illustrate these year-to-year changes for each worker type. The unadjusted DD estimates reveal that the gap in coverage is growing over time between SE persons and WS workers. The DD estimates for men are statistically insignificant except in 2000 in which it is negative. For women, most of the estimates are statistically significant but all are negative indicating that the rate of decline in coverage has been greater for the SE. While crude, these simple means provide the first evidence that the TRA86 amendments did not help in eliminating, nor reducing, the gap in coverage for SE persons. Next, we estimate a series of DD specifications by controlling for a variety of other factors in a regression context.
The estimates of equation (1) can be found in Table 3. In addition to the individual characteristics described prior, each regression also includes year dummies and a set of state-specific effects to account for any year-specific or state-level differences. Column 1 (5) provides the estimates of equation (1) for all men (women) in our sample. Clearly, being SE lowers the likelihood that one has a health insurance plan in his or her name. The negative and statistically significant coefficient estimate on this indicator implies that the coverage rates are about 46.6 (34.5) percentage points lower for SE men (women) compared with those in WS employment. The DD technique is performed by comparing SE persons with WS workers relative to 1995—the year in which the TRA86 tax deduction was the least generous (25 percent) during the time period we analyze. The estimated coefficients on the interaction terms mostly lack statistical significance, but even those that are significant turn out to be all negative. If the TRA86 amendments did in fact encourage SE persons to obtain coverage, the
Difference-in-Differences Regression Results.

Note. All models include individual characteristics, a constant term, as well as year and state fixed effects. Excluded categories are year 1995 and its interaction with the self-employed indicator. Standard errors are in parentheses.
Significance at 5%. **Significance at 1%.
The middle two columns for both men and women restrict the sample by family structure. Column 2 (6) considers single men (women). This group is unique in that they should not have any other possible source of coverage from family members because we exclude full-time students and individuals under the age of twenty-five. Perhaps due to this lack of alternatives, the gap in health insurance coverage between WS employees and the SE is smaller for the singles than it was for the full sample. While smaller in magnitude, the estimated coefficient on
The TRA86 restricts eligibility to persons with positive net profits who do not have access to employer-provided plans. Unfortunately, the CPS data do not include information on SE profits earned. In columns 4 and 8 of Table 3, we use the same income restriction as in G&P94 and eliminate those persons who earn less than $2,000 per year in real terms. These columns also exclude anyone who is covered as a dependent under an employer-provided health insurance plan, although it is not clear to what extent this rule is being enforced. We refer to these individuals as “eligible,” but given the limitations of our data, we cannot determine with certainty if an individual has access to employer-provided health insurance. 20 Although our eligibility classification may not be exact, it provides us with an opportunity to investigate this group more closely. The incentives provided by the tax deductions are greater for these individuals, holding everything else constant. Restricting our sample in this manner produces some more statistical significance on a number of the individual interaction terms, especially for women, but all these coefficient estimates remain negative. In sum, redefining our sample according to eligibility rules leaves the results unchanged; the DD estimates show no effect of the TRA86 amendments.
Overall, the results presented in Table 3 are consistent with the unadjusted DD estimates provided in Table 2. The DD estimates are either statistically insignificant or negative in the regression context when we are able to include other controls in the analysis. Together these findings suggest that the gap between WS employees and the SE was not reduced during the period of our analysis. To confirm these findings, we performed two robustness checks. First, we expanded our sample to include those individuals who were not working (NW). An individual is classified as NW if he or she is unemployed, not part of the labor force, or working without pay. As before, we consider the longest job held within the last year for these classifications. Like the SE, NW individuals do not have access to employer-provided private insurance. While both groups purchase their health insurance in the private non-group market, the NW group was not eligible for the tax deductions. For this robustness check, we added a dummy variable for NW and its interactions with the year dummies. Second, we re-estimated our model using 1995–1997 as the omitted reference years instead of omitting a single year (i.e., 1995). Neither of these exercises alters the main conclusions presented above. Our results so far indicate that there has been no response to the tax deduction.
Specification with the Price of Health Insurance
While the DD analysis is illustrative, it does not account for individual variation in the after-tax price of health insurance. And so we investigate the degree of price sensitivity of demand for coverage as a policyholder using the TRA86 amendments as an identification strategy. This provides a finer measure of the policy change compared with the DD model because it explicitly accounts for the individual variation in the premiums. To obtain an estimate of the price elasticity of demand, we explicitly control for the differences over time in the after-tax health insurance premiums between the SE and WS employees. As discussed above, during the period we consider, the coverage rates have been decreasing for both groups. Cutler (2003) studies the reasons for the decline in coverage rates in the 1990s despite the economic boom the U.S. experienced. He finds that the entire decline among the WS employees can be explained by the increase in employees’ costs of insurance plans.
WS employees face lower premiums compared with the SE not only because their employers sponsor part of the premium but also because employer-provided insurance is based on group rates that are substantially below the rates for individually purchased plans. G&P94 state that while some of the SE might have access to group insurance coverage, most do not. The CPS lacks information about out-of-pocket spending on health insurance and health care services. For this reason, G&P94 impute the after-tax premium of health insurance, for a single year, using data on the distribution of expenditures on health care and insurance purchased in the non-group market from the 1977 National Medical Care Expenditure Survey (NMCES). Heim and Lurie (2009) and Selden (2009) not only follow G&P94’s approach to impute the “relative after-tax price” of coverage, but they also use an alternative price measure, which has the advantage of being imputed with less error, namely, the “tax price of coverage.”
Similarly, we begin with the tax price that simply reflects the marginal cost of the after-tax premium in terms of an additional dollar spent on health insurance:

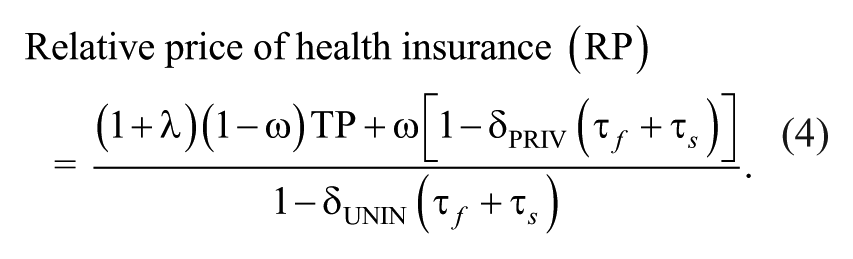
A more complete measure of the after-tax price is the relative price of coverage that is imputed based on Selden’s (2009) construction, akin to that of G&P94, using data from 1996 to 2004 MEPS. This measure reflects the cost of buying health care when insured, divided by the cost of buying health care when uninsured (i.e., self-insured):
G&P94 faced additional challenges in estimating the price elasticity of demand because during the period they analyzed, changes other than the partial deductibility of health insurance premiums by the SE occurred. To begin, the MTRs were substantially reduced; they note that the top MTR dropped from 50 to 28 percent with the passage of the TRA86. Second, during G&P94’s period of analysis, the amount of permissible medical expenses one could deduct from taxable income was raised from 5 to 7.5 percent of AGI. Third, the allowable deduction, for taxpayers who did not itemize, rose sharply from $3,760 to $5,000 within a two-year period. Over the entire period, we consider the Economic Growth and Tax Relief Reconciliation Act of 2001 and the Jobs and Growth Tax Relief Reconciliation Act of 2003 together reduced the top MTRs by 0.5–2 percentage points, while the lower MTRs were largely unaffected. These changes were scheduled to be phased in over a number of years and were much more limited in comparison with the changes associated with the tax acts of the 1980s (Saez, Slemrod, and Giertz 2009). Hence, it is easier in our case to form a price measure because our period of analysis is free from other confounding policy changes. 24
To begin, we estimated equation (2) omitting the price measures (not reported). As was the case with the DD model presented above, the estimated coefficient on
Estimates of Health Insurance Demand.

Note. All models include individual characteristics, a constant term, as well as year and state fixed effects. Standard errors are in parentheses. LPM = linear probability model.
Significance at 5%. **Significance at 1%.
Each regression also includes individual characteristics as listed above, year dummies, and a set of state-specific effects.
26
The first set of results in Table 4 (M1), corresponding to men, report the LPM estimates of equation (2) using the simple tax price as the measure of the price of health insurance.
Columns 2 and 3 divide the sample into single and married persons. The price semi-elasticity of demand for single men is much larger in magnitude (−1.525), thus revealing a greater degree of price sensitivity compared with those who are married (−0.378). This is consistent with the findings of G&P94, as well as Heim and Lurie (2009), because singles lack alternative sources of coverage and hence are more likely to respond to this particular change in policy. Column 4 corresponds to the set of eligible respondents where we see a slightly greater response to the TRA86 amendments (−0.882) compared with the overall sample. The results for the sample of women are also provided in Table 4 (W1). Again, the
As discussed above,
Alternatively, we estimated equation (2) with a probit model. The results from this exercise can be found in Table 4, sections (M3) and (W3). Provided here are the marginal effects associated with relative price, their standard errors, and the corresponding price semi-elasticity. 27 On the whole, these results indicate somewhat smaller estimates of the price semi-elasticity compared with the figures obtained using a LPM—sections (M2) and (W2)—but overall, the two sets of results are very similar. As an additional robustness check, we expanded our sample to include those individuals who were NW, for reasons mentioned previously. This exercise also yields similar results to those reported above. Next, rather than clustering our standard errors, we eliminated the duplicate observations corresponding to the persons in the ORG. For this purpose, we began by eliminating the first observation on each ORG respondent and then by dropping the second observation instead. Finally, we modified our definition of the dependent variable by replacing it with a value of “1” for those married SE whose spouses are policyholders of private non-group plans (unless those spouses’ private non-group plan does not cover the SE partner) to account for the possibility that their spouses may be benefiting from the TRA86 tax deductions. Our conclusions were not altered by any of these exercises. 28
As explained above, it is difficult to directly compare the estimates of price elasticity across various studies due to the differences in the unit of analysis, time frame, data, samples, price measure, and empirical methodology. Nevertheless, to put our results into perspective, we compare our semi-elasticity estimates with those of G&P94, Heim and Lurie (2009), and Selden (2009) because these are the most relevant studies for our purposes. In several instances, G&P94 obtain statistically insignificant responses to price changes. The semi-elasticities they report correspond to both men and women and vary from −0.334, for the entire sample, to −1.780, for the sample of singles. Our estimated semi-elasticities are generally larger than those of G&P94. This could be due to the fact that the original TRA86 offered a rather modest tax deduction of 25 percent, as opposed to the latter amendments that expanded it to full deductibility (i.e., 100 percent). In fact, our results are much closer to the findings of Selden who also studies the TRA86 amendments. Our figures fall exactly between the range of semi-elasticities implied by Selden, namely, −0.6 and −1.3. Our estimated semi-elasticities might differ from those estimated by G&P94 and Selden, at least partly because they both consider any health insurance coverage, rather than that obtained as policyholder.
In an effort to provide further insight into the differences between our findings and those of G&P94 and Selden (2009), we re-estimate equation (2), again using a LPM model, but instead used their definition of
Heim and Lurie’s (2009) definition of health insurance coverage differs from ours because they use a panel of tax returns and thus can identify those SE who purchased health insurance based on whether they claimed a deduction for the premiums or not. Another advantage of their study is that given the longitudinal nature of their data, they are able to include individual fixed effects. Heim and Lurie show that the exclusion of these individual fixed effects roughly doubles the estimated coefficient on both the tax price and the relative price, which could explain why they obtain substantially smaller elasticities compared with those reported by G&P94 and Selden (2009). Our estimated price semi-elasticity using the tax price is −0.764 (−0.808) for men (women), and the value implied by the Heim and Lurie’s estimates is about −0.8 when they exclude the individual fixed effects. Similarly, the estimated effect of Heim and Lurie’s relative price translates into a price semi-elasticity of about −0.3 while our corresponding figure is −0.764 (−1.144) for men (women). Based on the findings of Heim and Lurie, we suspect that our reported semi-elasticities could be overstated to the extent that the omission of individual fixed effects is problematic. Nevertheless, we believe our study offers several important advantages over these studies because we analyze the entire set of TRA86 amendments using a very large nationally representative sample from the CPS, which allows us to observe health insurance policyholder status.
Conclusion
In this article, we analyze how the tax deductions provided under the TRA86 amendments affected the rates of coverage among the SE. Using data from the CPS, corresponding to the period of 1995–2005, we obtain DD estimates comparing the SE with WS employees. We also estimate the price semi-elasticity of health insurance coverage by exploiting the TRA86 amendments. We uncover statistically significant but modest effects of the increasingly generous tax deductions. We conclude that even the full deductibility of insurance premiums was not enough to compensate the SE for the increasingly high costs associated with obtaining coverage in the private non-group market. Thus, these deductions do not seem to have eliminated the gap in coverage between the SE and WS workers. This conclusion is consistent with earlier findings that the provision of subsidies in the non-group market alone is unlikely to generate sizable reactions among the uninsured (e.g., Auerbach and Ohri 2006; CBO 2005; Long and Marquis 2002; Marquis et al. 2004; Marquis and Long 1995).
Our results suggest that such tax incentives directed at the SE are perhaps not sufficient and so additional policies may need to be taken at the employer, state, or national level, which in fact is the rationale behind the recent health care reform. In addition to extending tax credits to small businesses in an effort to help them afford health insurance, the ACA calls for state-based exchanges where individuals can purchase coverage and the expansion of Medicaid. Here, we analyze whether the TRA86 amendments were helpful in increasing the rates of health insurance coverage among the SE—a group that constitutes a rather large fraction of the working uninsured population in the United States. To the extent that the current health care reform reflects past attempts to address the uninsurance problem by altering tax policy, this article sheds light on specific efforts directed at the SE.
While our conclusions pertain only to the SE population, and may not generalize to other groups with high rates of uninsurance, studying the SE provides valuable insights because they do not have access to employer-sponsored insurance just like the majority of the uninsured in the United States (Krueger and Kuziemko 2013). Our results suggest that tax incentives, by themselves, may not provide adequate incentives for individuals purchasing health insurance in the private non-group market. Even when the tax deductions cover a substantial portion of the total premium, obtaining coverage in this market may still be difficult due to other costs involved (Blumberg and Nichols 2004; Pauly and Nichols 2002). These include, but are not limited to, search costs, potential denial, and exclusion restrictions on pre-existing conditions. Last but not the least, non-group policies are typically not as generous as the employer-provided plans in terms of their cost-sharing features (such as co-payments, co-insurance rates, deductibles) and the extent of coverage (Hill 2011). Quantifying these other costs is nearly impossible due to data limitations. And so it seems, as echoed by Marquis et al. (2004), that offering tax deductions alone, without adopting other policies, may not remedy the uninsurance problem.
Further questions need to be answered to address other relevant issues that are beyond the scope of the current analysis. For example, how has the non-group health insurance market been affected by these tax deductions? Were firms encouraged to enter the market as the tax credits became more generous? How would extending the tax deductions to other persons affect the rates of coverage? Would the tax deductions encourage individuals, who currently have employer-provided health insurance, to purchase their plans in the non-group market instead? Finally, what other regulations should be adopted in the non-group market to ensure that the tax deductions have the intended outcomes? Future research on all of these issues is critical in providing a more complete answer to the question of whether tax incentives are the solution to the problem of the uninsured.
Footnotes
Acknowledgements
We are grateful to Carlos Flores, Eric French, and Oscar Mitnik for their constructive suggestions on earlier versions. We also would like to thank participants at the Annual Meeting of the Society of Labor Economists, the Conference on Health Economics and the Pharmaceutical Industry, the Applied Microeconomics Workshop at the University of Miami, and the Department of Economics seminars at Florida International University and Florida Atlantic University for helpful discussions. We are grateful to Luca Bossi for technical assistance and Daniel Feenberg at the National Bureau of Economic Research for help with TAXSIM. We thank Thomas M. Selden for allowing us to use his imputation methodology for the price of health insurance coverage, providing us with state-level health insurance deduction rules for the self-employed, and sharing his insights about several technical issues. Finally, we would like to thank two anonymous referees as well as the Editor, Alan Monheit, for their constructive comments and suggestions.
Declaration of Conflicting Interests
The author(s) declared no potential conflicts of interest with respect to the research, authorship, and/or publication of this article.
Funding
The author(s) received no financial support for the research, authorship, and/or publication of this article.