
Abstract
Gentrification is increasingly common, yet the developmental implications of growing up in a gentrifying neighborhood are not well understood. Using longitudinal data from North Carolina (n = 231,346), this study found small positive associations between living in a gentrifying (vs. non-gentrifying) low-income neighborhood and high school GPA and intentions to pursue higher education. Effects were observed only among white youth and those who were not economically disadvantaged. For youth from economically disadvantaged and racially minoritized backgrounds, there was no relation between gentrification and 12th grade education outcomes. However, sub-group analyses revealed that for Black youth, gentrification was positively associated with plans to pursue higher education, but only when gentrification did not result in the whitening of historically Black neighborhoods. Findings expand understanding of how neighborhood socioeconomic and racial conditions affect youth, with implications for place-based poverty reduction strategies.
Introduction
The arrival of higher-socioeconomic status (SES) households to disinvested urban neighborhoods, termed gentrification, is an increasingly common phenomenon with implications for the unequal landscape of opportunity in the United States. By some accounts, higher SES households in gentrifying neighborhoods could bring increased resources to local schools, while also exposing youth to positive academic role models, leading to higher academic attainment and social mobility prospects. Others worry that gentrification will destroy neighborhood culture and community, displace long-term residents, and ultimately uphold the same unequal power structures that have contributed to decades of racialized economic segregation across the United States (Munn, 2019b). As the pace of gentrification accelerates (Ellen & Ding, 2016; Pearman, 2020), the urgency of this debate has intensified, yet surprisingly little is known about the individual-level developmental consequences of growing up in a gentrifying neighborhood.
Using longitudinal administrative records from five cohorts of students in North Carolina, this study investigated how living in a gentrifying (vs. non-gentrifying) low-SES neighborhood relates to 12th grade cumulative grade point average (GPA) and post-secondary plans, making two main contributions. First, this study expands research on neighborhood effects by examining how changes in the neighborhoods surrounding youth relate to educational outcomes. Second, this paper examines gentrification as a process that is both class-based and racialized (Rucks-Ahidiana, 2021), delineating how the relation between gentrification and youth outcomes depends on racial turnover. Findings challenge the assumption that neighborhood socioeconomic ascent will benefit lower-income and racially minoritized youth, with implications for place-based policies and community development strategies.
Developmental Systems Theory, Theories of Adolescent Development, and Intersectional Ecologies
Developmental systems theory (Lerner, 2007; Overton, 2013), theories of adolescent development (Erickson, 1968; Oyserman & James, 2011; Umaña-Taylor et al., 2014), and intersectional ecologies (Roy, 2018) highlight why adolescence is a key period to study gentrification and how the effects of gentrification will likely vary according to individual- and neighborhood-level social position.
Developmental systems theory emphasizes the interdependence of multiple dynamic systems in shaping developmental pathways (Lerner, 2007; Overton, 2013). This framework is useful for conceptualizing neighborhoods as dynamic, rather than static settings with shifting demographics, resources, opportunities, and risks. Developmental systems theory also makes clear that how gentrification influences education outcomes will depend on the interaction between neighborhoods and multiple embedded systems as well as temporal dynamics, such as developmental period.
In terms of developmental period, living in a gentrifying neighborhood is likely to be especially impactful in adolescence, a period when youth are uniquely attuned to the status hierarchy (Umaña-Taylor et al., 2014). Relatedly, a key developmental task during adolescence is identity exploration (Erickson, 1968), which includes both “who am I now?” and “who can I become?” (Oyserman & James, 2011). The arrival of higher-income, higher-educated residents to disinvested neighborhoods may therefore be especially influential at a time when youth are actively constructing their identity and educational goals.
Finally, intersectionality describes how people’s multiple social identities intersect with systemic inequality to produce disparate outcomes (Crenshaw, 1989). An intersectional ecologies perspective recognizes that places, like people, have multiple identities that intersect with overlapping systems of oppression to produce disparate outcomes (Roy, 2018). This perspective illuminates how both socioeconomic and racial dimensions of neighborhood identity shape how gentrification is experienced. Popular depictions of gentrification involve an influx of white, higher-SES households to historically Black, Hispanic/Latinx, or immigrant neighborhoods, but not all “gentrifiers” are white, and studies suggest that the effects of gentrification depends on the racial character of neighborhood change (Beck et al., 2022; Gibbons & Barton, 2016; Patillo, 2008; Pearman, 2020; Rucks-Ahidiana, 2021).
Pathways Linking Gentrification to Youth Educational Outcomes
The neighborhood effects literature highlights institutions, such as schools; and neighborhood social dynamics as two main pathways through which neighborhoods influence youth educational outcomes (Formoso et al., 2010; Leventhal & Dupéré, 2019; Pearman, 2019). Consistent with developmental systems theory (Overton, 2013), gentrification has the potential to affect both of these pathways in ways that could be either positive or negative for long-term residents (Formoso et al., 2010; Pearman, 2019).
In terms of schools, the arrival of more affluent households in gentrifying neighborhoods has the potential to bring additional educational resources. As property values rise, local governments receive more tax revenue, which could be directed towards schools. In addition, affluent parents may be well positioned to advocate for improvements such as better facilities or support to retain and hire more experienced teachers. These changes could result in improved learning opportunities, which could improve achievement.
However, past work suggests that gentrification may negatively affect marginalized students (Quarles & Butler, 2018). For instance, gentrification was associated with increased suspension rates among Black and Latinx students, potentially because teachers viewed Black and Latinx student behavior through a deficit lens in comparison to their new, more affluent, white peers (Pearman, 2021). During adolescence, when youth are uniquely affected by social exclusion, these experiences of classism and racism-related social stressors can lead to academic disengagement (Levy et al., 2016).
Outside of schools, gentrification may expose youth to a greater number of higher-SES neighbors, which could motivate educational aspirations among low-SES youth. This is in fact a key assumption underlying many place-based policies that aim to transition lower-SES neighborhoods into mixed income communities (Chaskin & Joseph, 2015). However, studies show that proximity alone is insufficient to facilitate supportive cross-class connections and academic motivation (Chaskin & Joseph, 2015; Khare et al., 2015; Leer et al., 2024). In former public housing developments that were turned into mixed-income communities, negative social class and racism-related stereotypes constrained the development of intergroup friendships (Chaskin & Joseph, 2015; Khare et al., 2015). Thus, to the extent that proximity to higher-SES peers facilitates educational aspirations, such effects may be primarily observed among youth whose family SES and racial backgrounds are closer to that of the incoming gentrifiers.
Gentrification could also result in increased exposure to social stressors, such as loss of culture and community (Cahill, 2007; Holt et al., 2020; Shmool et al., 2015) and feelings of relative deprivation (Odgers et al., 2015). In fact, recent evidence from New York City (Dragan et al., 2019) and North Carolina (Leer et al., 2024) shows heightened mental health problems among economically disadvantaged youth living in gentrifying (vs. non-gentrifying) low-income neighborhoods, which in the case of North Carolina was linked to decreased math achievement during middle school (Leer et al., 2024).
The Role of Neighborhood Racial Turnover
Consistent with an intersectional ecologies perspective (Roy, 2018), the effects of gentrification may depend on the racial composition of neighborhood change. Gentrification without racial turnover could be conducive to positive outcomes for incumbent youth. A study of a historically Black gentrifying neighborhood in Chicago found that Black professionals who relocated to the neighborhood were significantly invested in the preservation and improvement of neighborhood institutions, including schools, in a way that white newcomers may not be (Patillo, 2008). In contrast, white gentrification has been linked to declining enrollment at neighborhood schools (Pearman, 2020) and feelings of loss of community, erasure of cultural heritage, and experiences of discrimination among Black, Latinx, and Chinese adolescents (Cahill, 2007; Holt et al., 2020; Shmool et al., 2015). Such feelings of racism-related loss and discrimination may spill over to negatively influence youths’ school outcomes (Levy et al., 2016). Indeed, one prior paper found an adverse effect of gentrification on math test scores when gentrifiers were white (Pearman & Steyer, 2023), but effects on other education outcomes (GPA, college attendance) have yet to be examined.
Research Questions
This study explored three research questions: (1) How does living in a gentrifying (vs. non-gentrifying) low-SES neighborhood during adolescence relate to cumulative high school GPA and post-secondary plans? (2) How does the relation between gentrification and youth education outcomes vary according to family income and race/ethnicity? and (3) How does racial turnover moderate the relation between gentrification and youth education outcomes? Research Question 3 focused on Black youth living in majority-Black neighborhoods in 2010 (at the start of the study period, i.e., pre-gentrification). For these youth, an influx of white residents would have significantly altered the neighborhood social ecology, potentially contributing to feelings of loss and heightened discrimination or social exclusion. Based on the theoretical framework highlighting the role of multiple intersecting systems of privilege and disadvantage in shaping youths’ experiences in gentrifying neighborhoods, it was hypothesized that there would be a positive association between gentrification and education outcomes among youth from relatively privileged backgrounds (i.e., White youth, non-poor youth), with opposite effects for racially minoritized youth from economically disadvantaged backgrounds. Based on evidence that Black gentrification may help Black neighborhoods maintain their culture and community ties (Patillo, 2008), whereas the “whitening” of historically Black neighborhoods leads to loss of community and racialized exclusion (Cahill, 2007; Holt et al., 2020; Pearman, 2020, 2021; Shmool et al., 2015), it was hypothesized that for Black youth, the effects of gentrification would be positive in neighborhoods that remained majority-Black as they gentrified, and negative in neighborhoods that became increasingly white.
North Carolina Context
A focus on North Carolina expands the literature on gentrification and education outcomes, which is thus far largely concentrated in the same study contexts—Atlanta, Boston, Chicago, New York, and Philadelphia (Quarles & Butler, 2018). Like the rest of the United States, patterns of racialized economic segregation in North Carolina are directly attributed to structural racism, including discriminatory lending policies, urban renewal programs, and the deliberate targeting of marginalized communities for undesirable land uses (De Marco & Hunt, 2018; Faber, 2020). However, while past work focuses on gentrification occurring in major cities, gentrification in North Carolina is occurring across the state in cities large and small (De Marco & Hunt, 2018; Leer et al., 2024; Munn, 2019a). Less is known about the dynamics of gentrification in smaller cities. One recent study found that gentrification in North Carolina was associated with heightened psychological distress and decreased math scores among young adolescents with low subjective economic status (Leer et al., 2024), which warrants attention to how gentrification may affect later outcomes, such as cumulative high school GPA and post-secondary plans.
Methods
Data
Individual-level data came from the North Carolina Education Research Data Center (NCERDC), which houses administrative records on all public-school students in North Carolina from 1996 on. NCERDC data allow for the construction of longitudinal individual-level data from multiple cohorts with information on sociodemographic characteristics, academic performance, and geocoded addresses. Neighborhood data come from the Decennial Census and the American Community Survey (ACS; extracted from the IPUMS National Historical Geographic Information System database; Manson et al., 2021), matched to student data using census block group ID. Neighborhoods in this study were defined as census block groups, standardized to the 2010 boundaries using interpolation weights from the IPUMS National Historical Geographic Information System (Manson et al., 2021).
Sample
Individual-level, longitudinal data were compiled from 10 years of administrative data from the North Carolina Education Research Data Center spanning the 2009 to 2010 school year to the 2018 to 2019 school year (hereafter referred to using the spring calendar year, i.e., 2019 for the 2018–2019 school year). The sample includes 231,346 youth from five cohorts. Cohort 1 was in 7th grade in 2010, Cohort 2 was in 6th grade, Cohort 3 was in 5th grade, Cohort 4 was in 4th grade, and Cohort 5 was in 3rd grade. Conditional on-time grade progression, the youngest cohort would have been in 12th grade at the end of the study period (2019). The sample was constructed from the population of youth attending North Carolina public schools in grades 3 through 7 in 2010 (N = 564,048), excluding those from rural areas (n = 28,366) and those with missing data on address, 12th grade outcomes, or covariates (n = 210,343). Additionally, to facilitate a comparison between neighborhoods that gentrified with those that had similar SES characteristics in 2010 but did gentrify, youth who lived in upper-SES (i.e., “non-gentrifiable”) neighborhoods were excluded (n = 94,920). Critically, there was no evidence of differential attrition according to neighborhood type—the probability of being observed in 12th grade was 73% in both gentrifying and non-gentrifying neighborhoods. Thus, attrition effects on internal validity are likely minimal.
Measures
Dependent Variables
Achievement
Cumulative Grade Point Average (GPA) was used to measure achievement. GPA data come from student transcripts collected at the end of 12th grade. GPA is a widely used marker of academic performance that represents students’ ability to meet teachers’ expectations and the effort they exert to meet these expectations.
Post-Secondary Plans
At the end of 12th grade, students reported whether they planned to start working right after high school, enroll in the military, attend a junior college, trade, business, or nursing school, or attend a 4-year institution. Two binary indicators were created, one indicating intentions to pursue higher education of any type (0 = no, 1 = yes), and one indicating intentions to obtain a bachelor’s degree at a 4-year college or university, conditional on pursuing any type of higher education (0 = junior college, trade, business, or nursing school, 1 = 4-year college or university).
Independent Variable
Gentrification was measured using an approach from the sociology literature that captures rapid changes to the socioeconomic composition of neighborhood residents and housing costs relative to other neighborhoods within the MSA (Candipan, 2020; Owens, 2012). A composite indicator of SES was constructed for each neighborhood in 2000, 2010, and 2017 consisting of median household income, the proportion of the population age 25 and older with at least a bachelor’s degree, the proportion of the population working in managerial, professional, and technical occupations, and median home value. The composite score from 2000 was used as a covariate to account for prior trends in neighborhood socioeconomic and housing costs, and the scores from 2010 to 2017 were used to construct typologies of neighborhood change during the study period.
Neighborhood typologies were defined in two steps. First, to account for differences across metropolitan statistical areas (MSAs), neighborhoods were ranked within MSAs according to their composite SES score (using a percentile rank from 1 to 100). Then, each block groups’ SES rank in 2010 was subtracted from its rank in 2017. Neighborhoods that began in the bottom four SES rank quintiles and increased in relative socioeconomic rank by 10 % points from 2010 to 2017 were considered gentrifying. Neighborhoods that began in the upper quintile in terms of SES-rank were considered upper-SES (not-gentrifiable) and excluded from analysis. The remaining neighborhoods were classified as non-gentrifying low-SES neighborhoods. Findings were substantively consistent when using alternative measures (i.e., restricting the definition of “gentrifiable” to neighborhoods below the 50th percentile in terms of median household income, using a continuous measure of gentrification, or comparing outcomes across quartiles of change in neighborhood socioeconomic rank).
Moderators
Family Income and Race/Ethnicity
Family income was proxied using economic disadvantage, an indicator variable equal to one for students whose 2010 family income was less than 185% of the federal poverty level or who were enrolled in SNAP or TANF benefits, zero if not. Race/ethnicity included six mutually exclusive categories: American Indian or Alaskan Native (1%), Asian (2%), Black (30%), Hispanic/Latinx (13%), white (50%), and Multiracial (4%).
Neighborhood Racial Turnover
White population increase was equal to one if the neighborhood experienced an increase in the proportion of white residents from 2010 to 2017 that was greater than the metro average increase in proportion white, zero if not. Black population increase was equal to one if there was an increase in the percentage of Black residents from 2010 to 2017 that was greater than the metro average increase, zero if not.
Covariates
Individual-level covariates included gender (0 = male, 1 = female), cohort, and 2010 reading achievement based on end-of-grade test scores, standardized by grade and year. Neighborhood-level covariates included the initial neighborhood SES percentile ranking at the beginning of the study period (2010), percent poverty in 2010, percent Black in 2010, percent white in 2010, and the change in neighborhood SES z-score score from 2000 to 2010, in addition to fixed effects for MSAs.
Analytic Approach
Descriptive analyses examined neighborhood and student characteristics across neighborhood type and explored patterns of mobility between gentrifying and non-gentrifying neighborhoods. An analysis of mobility is important because one concern about gentrification is that it will lead to displacement (Formoso et al., 2010; Pearman, 2019).
Next, to examine how gentrification was related to 12th grade GPA and postsecondary plans (
Interaction terms were added to examine how the relation between gentrification and 12th grade outcomes differed according to family income and race /ethnicity (
Finally, to examine the moderating role of racial turnover (
All models included individual and neighborhood covariates to account for observable differences in individual and neighborhood characteristics between gentrifying- and non-gentrifying neighborhoods at the beginning of the study period, in addition to prior trends in neighborhood change. MSA fixed effects accounted for time-invariant differences across cities, such as housing markets. Standard errors were clustered at the neighborhood-level to account for non-independence of errors between youth within the same neighborhood. This approach does not provide causal estimates, but by comparing between youth who started out in observably similar neighborhoods, then some gentrified, and others did not, this method is a step above traditional observational methods that compare between individuals after they have selected into a particular type of neighborhood.
To further address selection bias, the main models described above were estimated using coarsened exact matching (Blackwell et al., 2009; Iacus et al., 2012). Coarsened exact matching (CEM) matches students based on neighborhood characteristics at baseline (2010) and pre-treatment trends in neighborhood conditions (2000 to 2010) and then only compares across individuals who lived in similar pre-treatment neighborhoods. To start, variables included in the matching algorithm are “coarsened” into bins. Matching variables included the change in neighborhood SES percentile rank from 2000 to 2010, the 2010 SES percentile ranking, 2010 percent poverty, 2010 racial composition, block group population, and urbanicity. Next, all observations were placed within strata based on the matching variables, matches were made within strata, and strata that did not include members of both treatment and control were excluded from analysis (Blackwell et al., 2009; Iacus et al., 2012).
Additionally, to assess whether effects were due to remaining versus being displaced from gentrifying neighborhoods, models were adjusted by adding a main effect of mobility (operationalized as moving to a different census block group at least once during the study period) and the interaction between gentrification and mobility.
Results
Neighborhood and Youth Descriptive Characteristics
Table 1 shows neighborhood-level descriptive statistics. Twenty-five percent of neighborhoods in the sample were classified as having gentrified. The changes presented in Table 1 reflect the key elements of gentrification described in prior work, which lends credence to the validity of the gentrification measure used here. For example, the proportion of residents with a BA and the proportion of residents who worked in managerial, professional, or technical jobs nearly doubled in gentrifying neighborhoods, but remained relatively unchanged in non-gentrifying low-SES neighborhoods. Median household income and home values rose by 47% and 30%, respectively, in gentrifying neighborhoods, compared to 11% and 9% in non-gentrifying neighborhoods.
Neighborhood Characteristics 2010–2017.
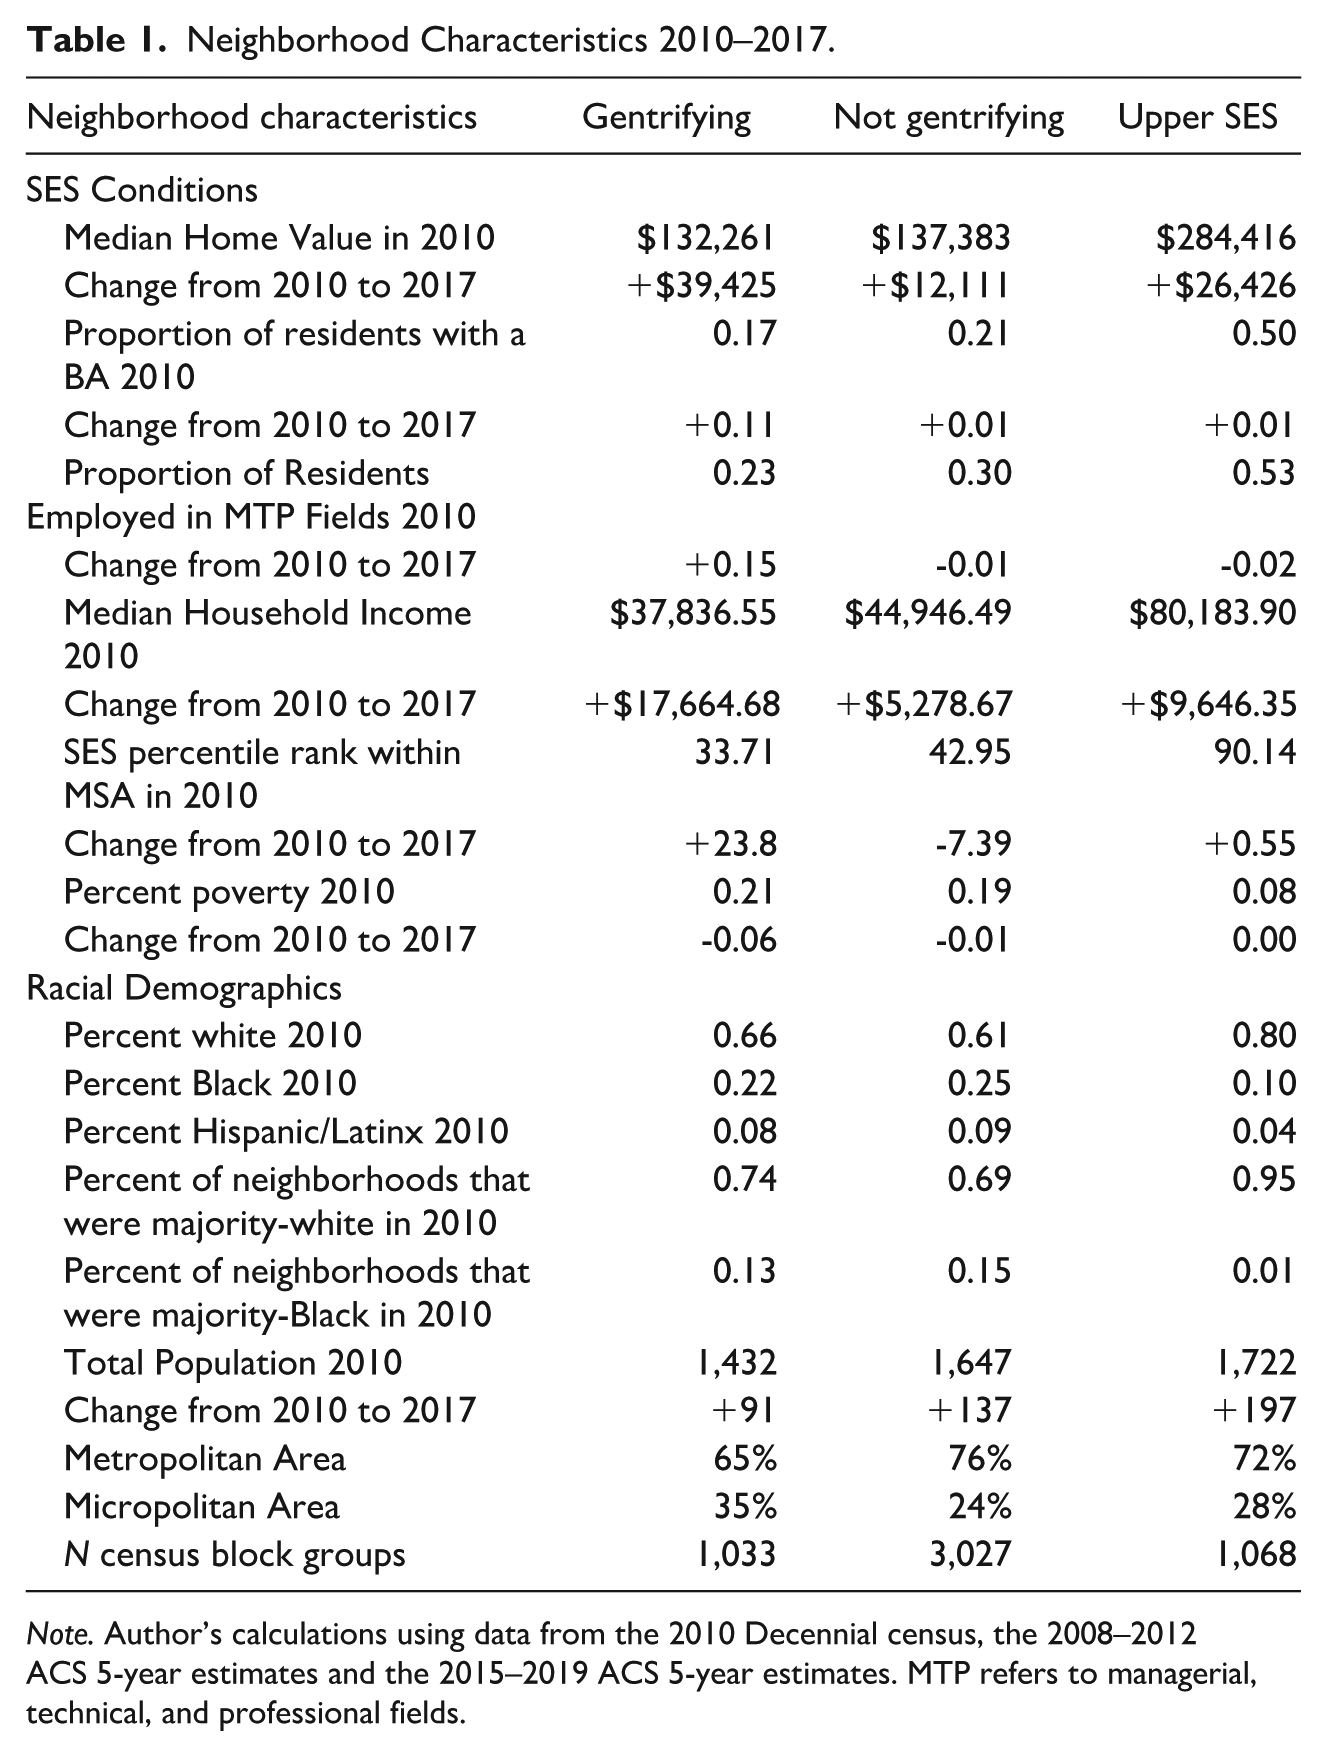
Note. Author’s calculations using data from the 2010 Decennial census, the 2008–2012 ACS 5-year estimates and the 2015–2019 ACS 5-year estimates. MTP refers to managerial, technical, and professional fields.
Youth demographics and achievement scores were similar in gentrifying and non-gentrifying neighborhoods, though white youth were disproportionately represented in gentrifying neighborhoods compared to Black and Hispanic/Latinx youth (Table 2). The likelihood of moving and the total number of moves made were similar in gentrifying and non-gentrifying neighborhoods (Table 2). Further, on average, youth moving from both types of neighborhoods landed in new neighborhoods that were slightly better off, as measured by the neighborhood poverty rate. This finding is consistent with numerous studies showing that mobility is not more likely in gentrifying versus non-gentrifying neighborhoods low-SES neighborhoods, and that those moving from gentrifying neighborhoods tend to move into similarly situated (or better) neighborhoods (e.g., Ding et al., 2016; Dragan et al., 2020; Hepburn et al., 2024; Freeman, 2005). Differential patterns of mobility are therefore unlikely to affect the estimated association between gentrification and education outcomes (though analyses did account for this possibility, see Table 3).
Youth and School Demographics, Overall and by Neighborhood Type.
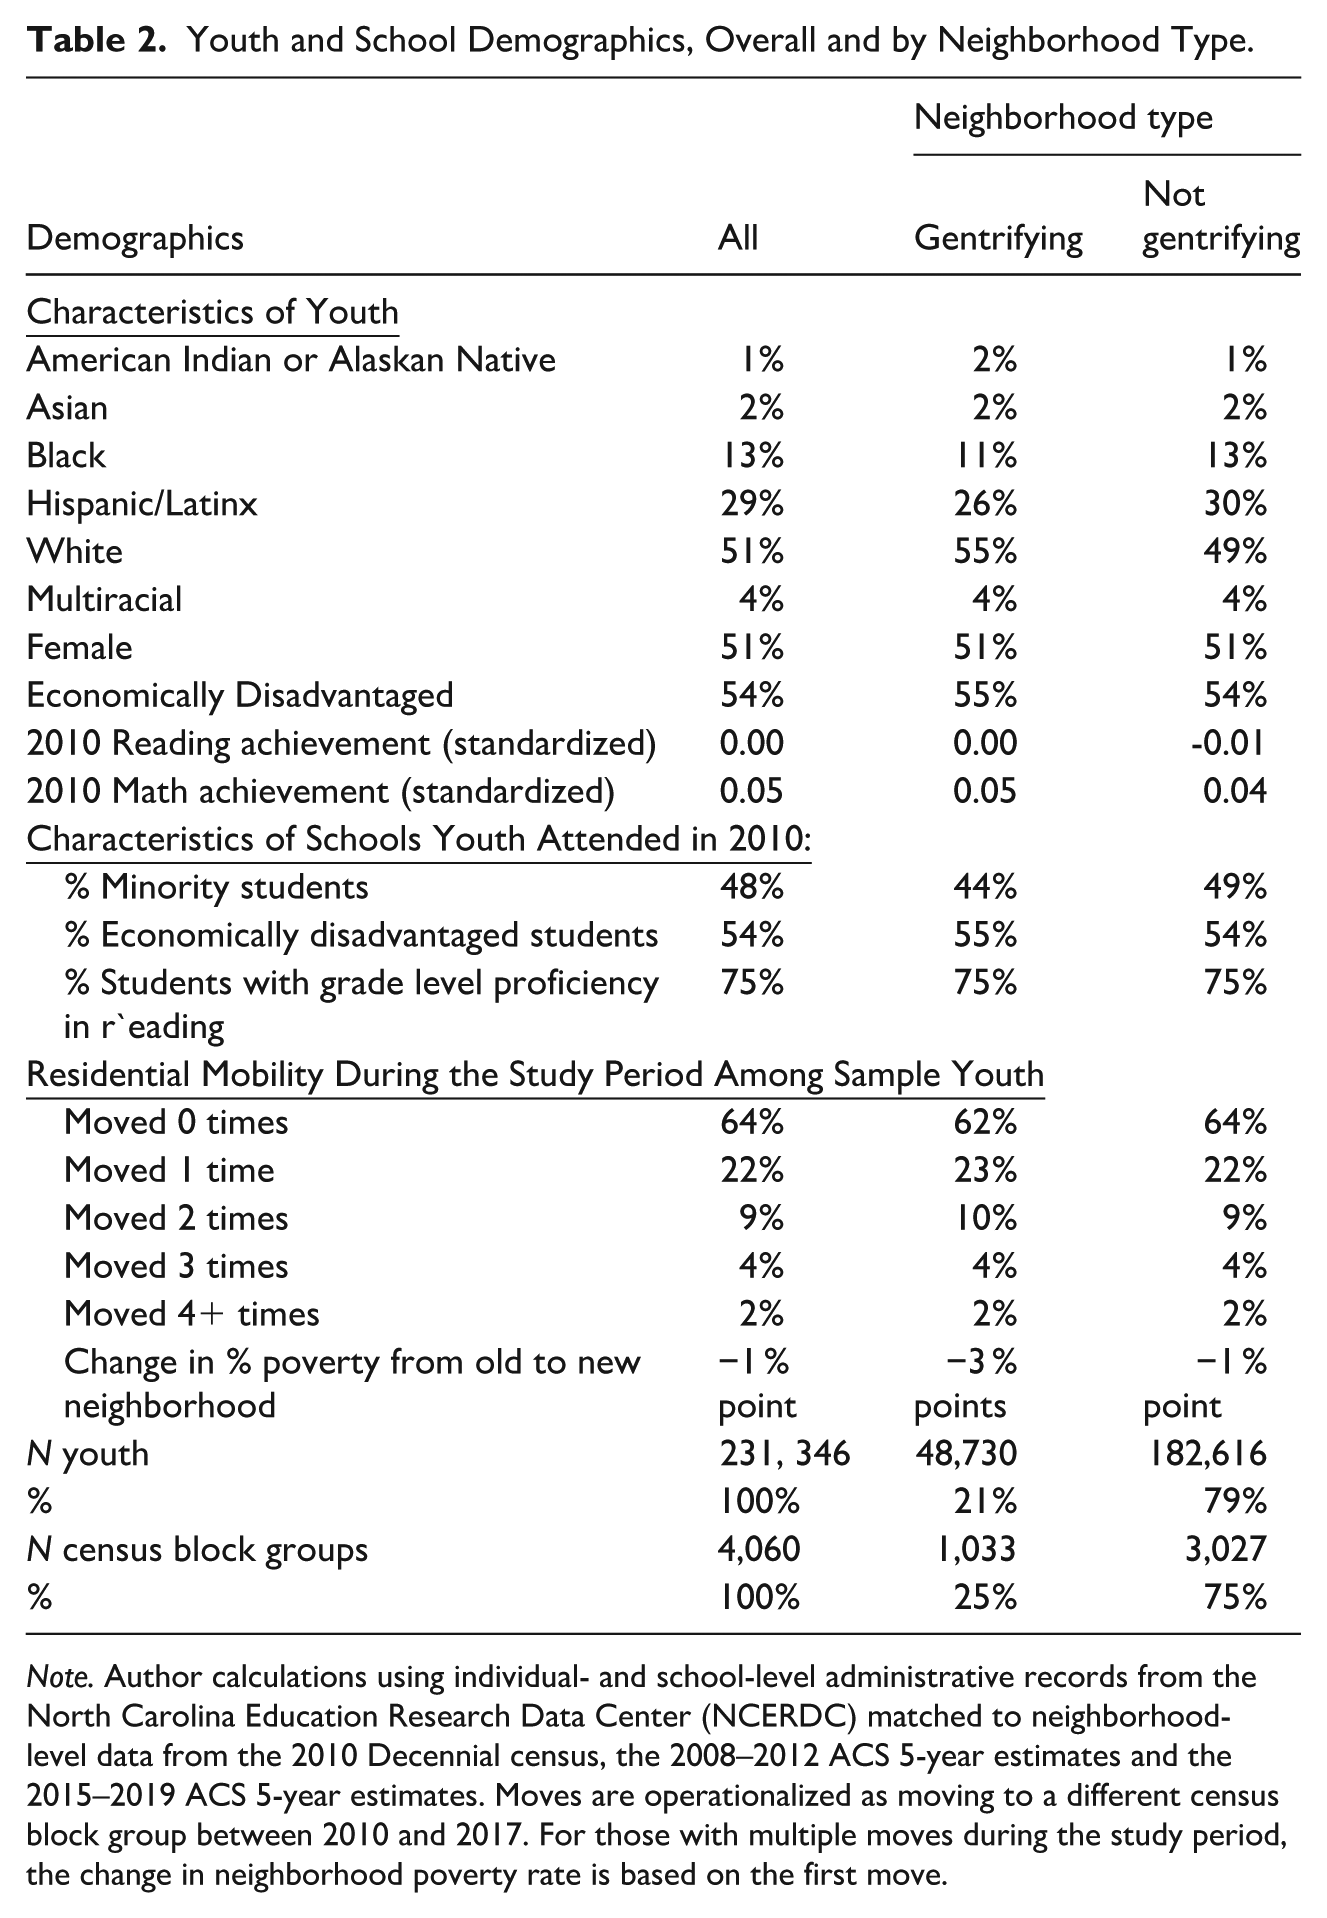
Note. Author calculations using individual- and school-level administrative records from the North Carolina Education Research Data Center (NCERDC) matched to neighborhood-level data from the 2010 Decennial census, the 2008–2012 ACS 5-year estimates and the 2015–2019 ACS 5-year estimates. Moves are operationalized as moving to a different census block group between 2010 and 2017. For those with multiple moves during the study period, the change in neighborhood poverty rate is based on the first move.
Relation Between Living in a Gentrifying Neighborhood and Youth Education Outcomes.
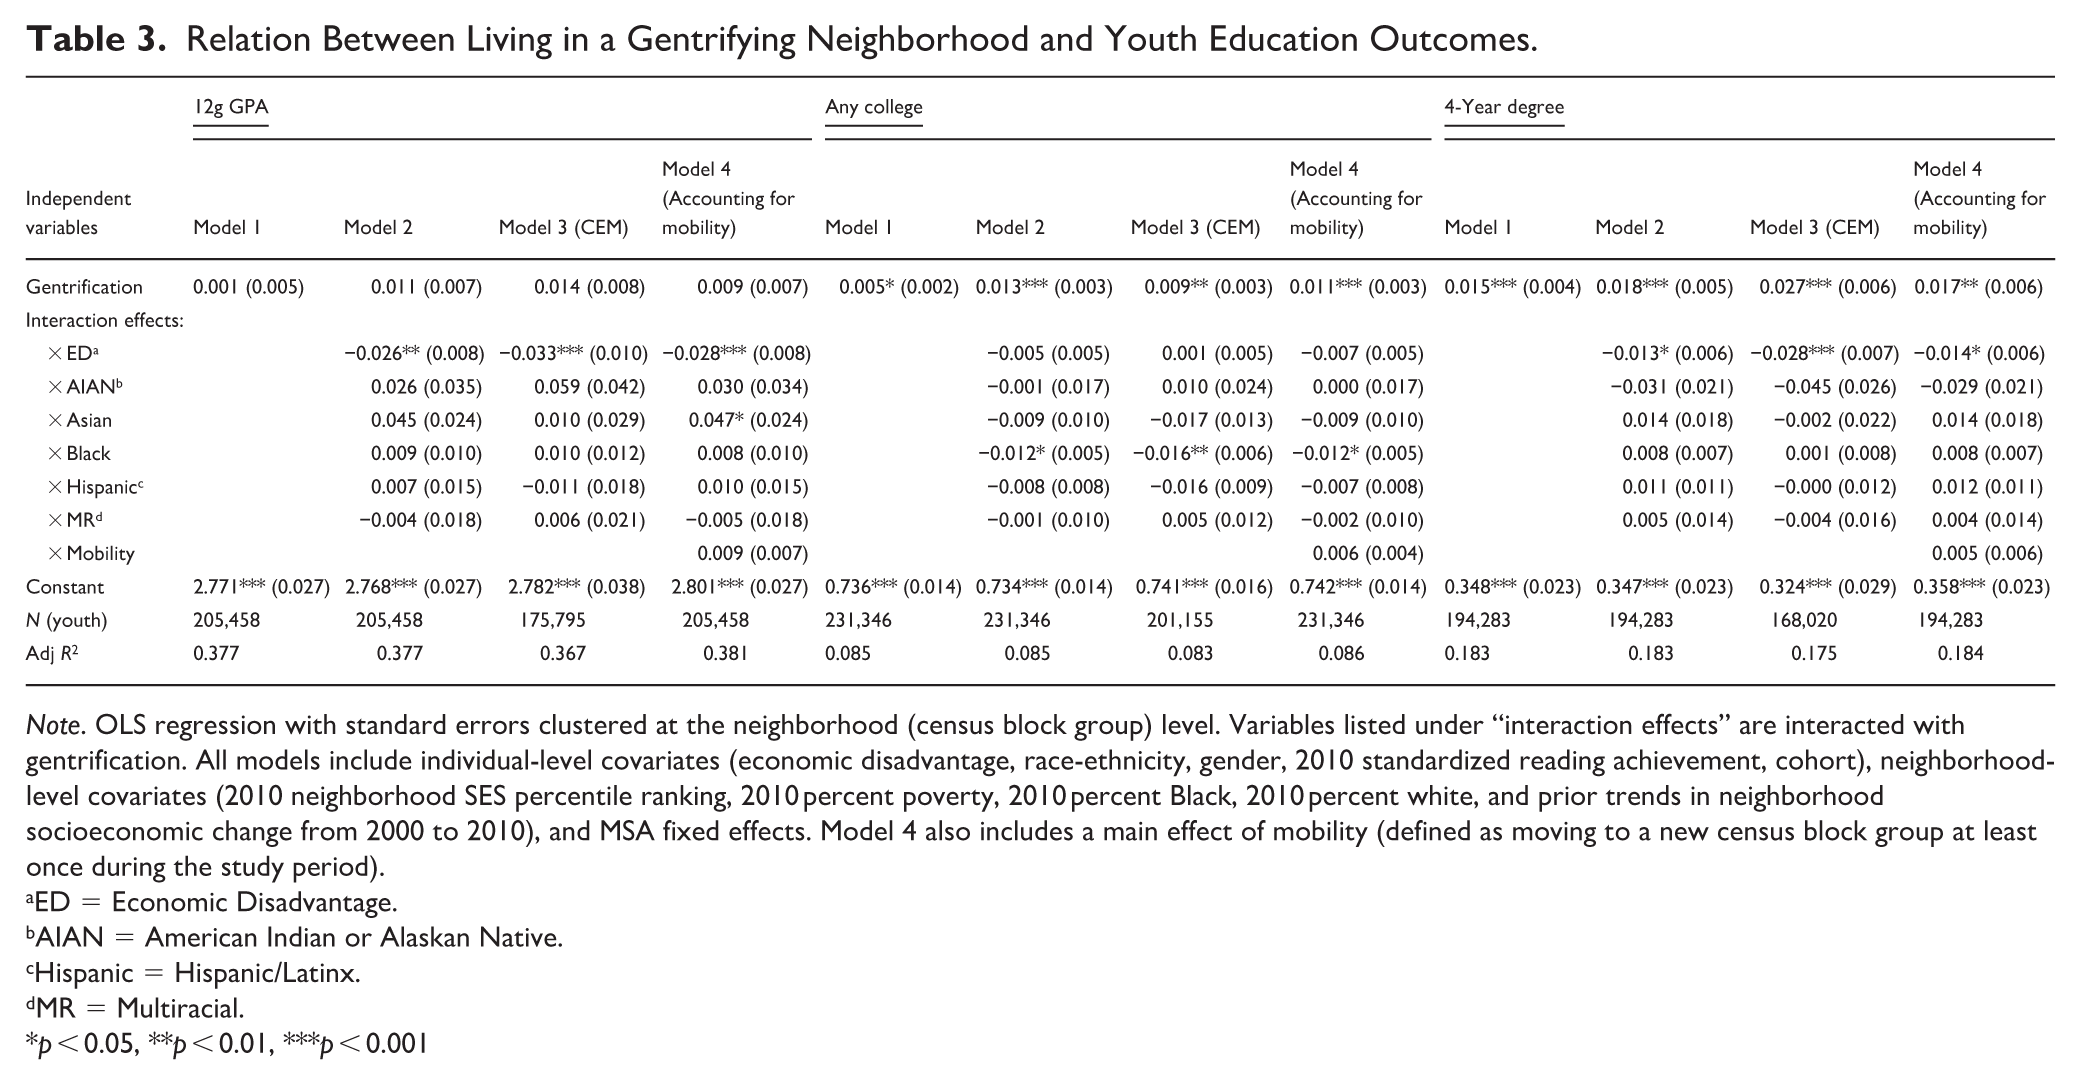
Note. OLS regression with standard errors clustered at the neighborhood (census block group) level. Variables listed under “interaction effects” are interacted with gentrification. All models include individual-level covariates (economic disadvantage, race-ethnicity, gender, 2010 standardized reading achievement, cohort), neighborhood-level covariates (2010 neighborhood SES percentile ranking, 2010 percent poverty, 2010 percent Black, 2010 percent white, and prior trends in neighborhood socioeconomic change from 2000 to 2010), and MSA fixed effects. Model 4 also includes a main effect of mobility (defined as moving to a new census block group at least once during the study period).
ED = Economic Disadvantage.
AIAN = American Indian or Alaskan Native.
Hispanic = Hispanic/Latinx.
MR = Multiracial.
p < 0.05, **p < 0.01, ***p < 0.001
Relation Between Gentrification and Youth Education Outcomes
Table 3 presents the estimated relation between living in a gentrifying neighborhood and youth education outcomes. Model 1 shows the main effect (
There was no main effect of gentrification on GPA, but the relation between gentrification and GPA varied according to family income. Marginal effects were used to probe this interaction, with results showing that gentrification was associated with a .02 increase in GPA among youth who were not economically disadvantaged (p = .02) while there were no effects for economically disadvantaged youth.
In terms of postsecondary plans, there was a small but significant association between gentrification and intentions to pursue any type of college that differed by race. Marginal effects models showed that gentrification was associated with a 1% point increase in intentions to pursue any type of college among white youth (p < .01). Holding constant student and neighborhood covariates, the predicted likelihood of pursuing college for white youth was 85.2% in non-gentrifying neighborhoods and 86.5% in gentrifying neighborhoods. For all other racial/ethnic groups, the association was not statistically significant.
Conditional on intentions to pursue any type of college, youth in gentrifying neighborhoods were more likely to pursue a 4-year degree, but this positive main effect differed by family income. Youth who were not economically disadvantaged were two percentage points more likely to pursue a 4-year degree if their neighborhood gentrified, rising from a predicted probability of 58% in non-gentrifying neighborhoods to 60% in gentrifying neighborhoods (p < .001), but there was no effect for economically disadvantaged youth.
Findings were largely consistent when applying CEM (Table 3, Model 3) and adjusting for mobility (Table 3, Model 4). The coefficients on the main effects and interaction terms were slightly larger with matching, suggesting that selection bias may underestimate the effects of gentrification on 12th grade GPA and post-secondary plans, though it is important to note that CEM only applies to the matched sample. The fact that adjusting for mobility did not meaningfully change the results is not surprising considering there were minimal differences in mobility between youth in gentrifying versus non-gentrifying neighborhoods (as shown in Table 2). However, accounting for mobility did reveal a significant interaction between gentrification and Asian identity for 12th grade GPA, which suggests that Asian youth were more likely than white youth to move from gentrifying neighborhoods, but for those who remained, the positive association between gentrification and 12th grade GPA was larger than it was for white youth. An alternative set of models adjusted for mobility in two different ways (results available upon request). First, models were estimated only on the sample of non-movers. Next, mobility was operationalized based on type of move, using an indicator variable equal to one for moves to a higher poverty neighborhood, zero for non-movers and for those who moved to a lower poverty neighborhood. In both cases, results were consistent with the main estimates. Thus, the observed results are likely explained by the social changes occurring within gentrifying neighborhoods, rather than differential patterns of displacement from gentrifying neighborhoods.
Racial Turnover in Gentrifying Neighborhoods and Black Youth’s Education Outcomes
Racial turnover was a significant moderator. For Black youth who lived in majority Black neighborhoods, the relation between gentrification and college intentions varied according to the racial composition of neighborhood change (as indicated by the statistically significant coefficient on the interaction term between gentrification and above averaged white population increase, Table 4). In neighborhoods where there was a below average increase in the percentage of white residents, gentrification was associated with a 3% point increase in intentions to pursue any college (p = .04), whereas in neighborhoods where there was an above average increase in the percentage of white residents, the association between gentrification and intentions to pursue college was not statistically significant. For context, in gentrifying neighborhoods with a below average increase in the percentage of white residents, the white population decreased from 23% to 16% over the study period. In neighborhoods with above average increases, the white population increased from 18% to 24%.
Relation Between Living in a Gentrifying Neighborhood and Black Youths’ 12th Grade Outcomes, by Racial Turnover.
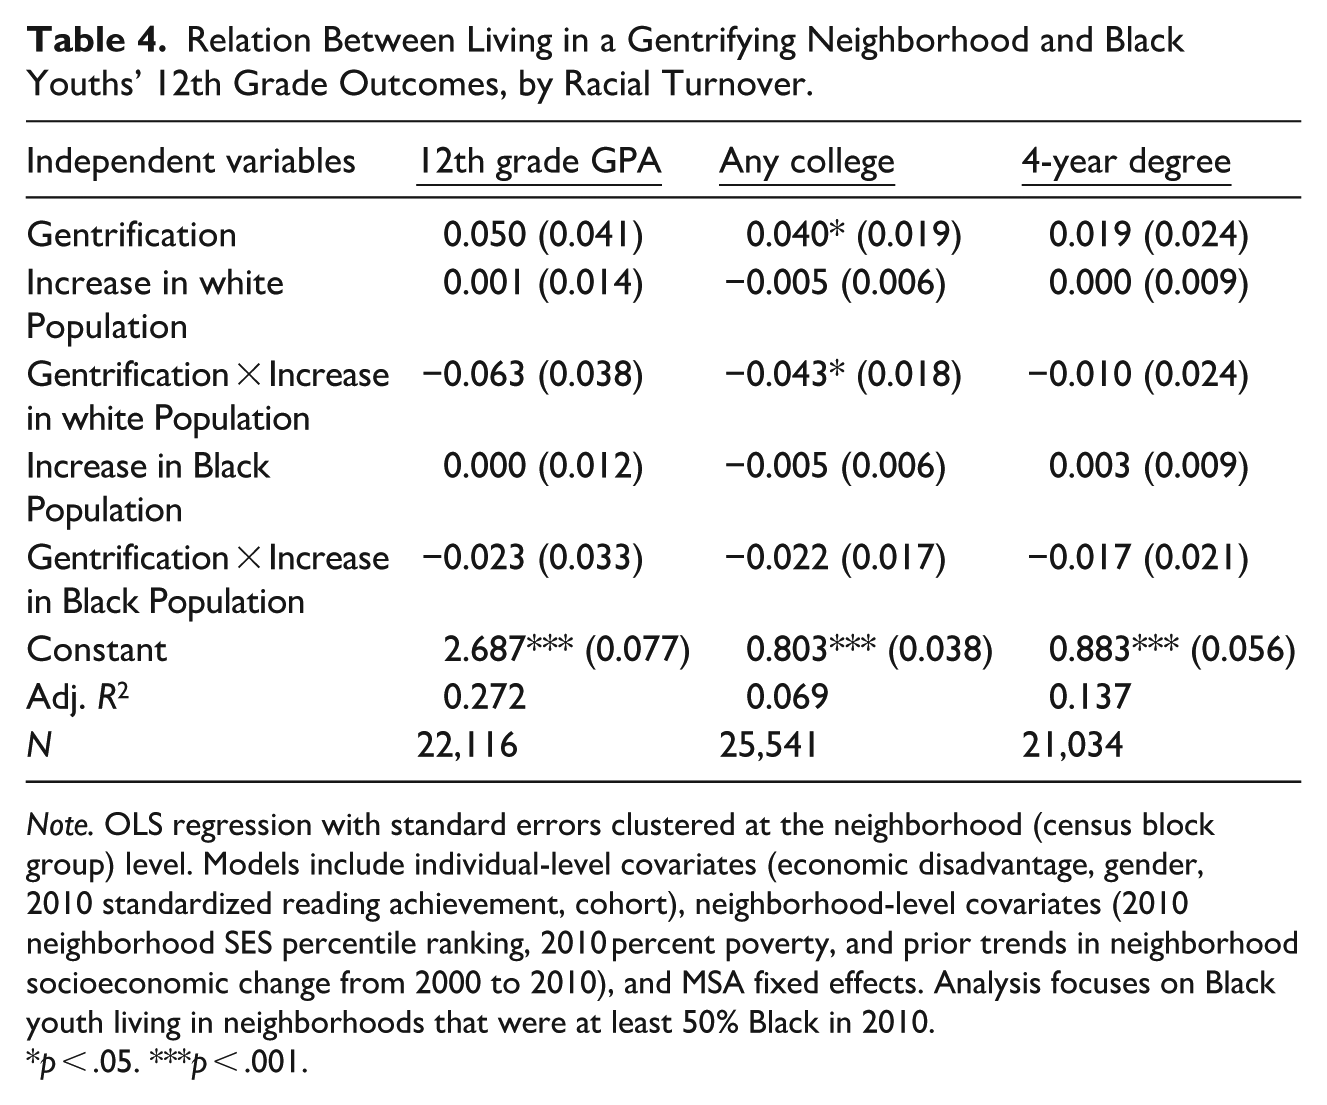
Note. OLS regression with standard errors clustered at the neighborhood (census block group) level. Models include individual-level covariates (economic disadvantage, gender, 2010 standardized reading achievement, cohort), neighborhood-level covariates (2010 neighborhood SES percentile ranking, 2010 percent poverty, and prior trends in neighborhood socioeconomic change from 2000 to 2010), and MSA fixed effects. Analysis focuses on Black youth living in neighborhoods that were at least 50% Black in 2010.
p < .05. ***p < .001.
Discussion
Neighborhoods matter for children’s future socioeconomic mobility prospects and wellbeing (Chetty et al., 2016, 2018; Leventhal et al., 2015). To the extent that neighborhood change has been incorporated in neighborhood research, the focus has been on examining how youth outcomes change when moving from one type of neighborhood to another (e.g., moving out of a high poverty neighborhood into a lower poverty neighborhood; cf. Dragan et al., 2019; Leer et al., 2024; Pearman & Steyer, 2023). Instead, this study grapples with the question of how changes in the neighborhood surrounding youth relate to youth educational outcomes—focusing on one increasingly common and widely debated type of neighborhood change: gentrification.
Results show small positive associations between living in gentrifying neighborhood and 12th grade GPA and plans to pursue higher education, but only among youth from relatively advantaged social positions: those who were not economically disadvantaged and white youth. Prior research from the same state shows a negative relation between gentrification and math achievement among economically disadvantaged young adolescents (Leer et al., 2024), the current study extends these findings to an older age group, assessing outcomes that are highly consequential for future social mobility prospects: post-secondary education plans. Together, these two studies show that gentrification occurring in both urban and suburban areas in a relatively understudied context—North Carolina—may have negative developmental implications. More generally, this work adds to a growing body of research showing that neighborhood socioeconomic ascent tends to disproportionately benefit relatively advantaged youth and may exacerbate classism- and racism-related disparities in educational opportunities (Quarles & Butler 2018; Pearman, 2020, 2021, Pearman & Swain 2017).
There are several mechanisms that could explain why there was a positive association between gentrification and education outcomes for advantaged but not disadvantaged youth. Social class stigma and racism may limit the formation of positive cross-class and cross-race connections in mixed-income, mixed-race residential contexts (Chaskin & Joseph, 2015; Underhill, 2021). Loss of community and culture could lead to heightened stress. Similarly, changes to school resources or culture may shift school culture in favor of white, higher-SES youth, leading to a deficit view of lower-income and racially minoritized youth (Quarles & Butler 2018; Pearman, 2021). Rising housing costs in gentrifying neighborhoods might also make it harder for lower-SES families to afford college, which could explain why the positive association between gentrification and intentions to pursue a 4-year degree was not statistically significant among economically disadvantaged youth.
Racial turnover was also an important moderator of the association between gentrification and youth educational outcomes. Among Black youth who lived in majority Black neighborhoods, there was a positive relation between gentrification and intentions to pursue college, but only in neighborhoods that did not become increasingly white as they gentrified. This finding highlights the value of examining multiple, intersecting facets of neighborhood identity (Pearman & Steyer, 2023; Roy, 2018; Rucks-Ahidiana, 2021). The data used here are unable to delineate whether Black gentrification occurred because long-term Black residents gained income and occupational prestige, because new, Black “gentrifiers” moved into the neighborhood, or some mix of both. Regardless, neighborhoods that maintain their racial composition as they gentrify might be more likely to invest in institutions and programs that support Black youths’ educational success (Patillo, 2008). Gentrification without racial turnover could also limit the disruption of social ties and loss of community that can occur in neighborhoods that become increasingly white as they gentrify (Holt et al., 2020; Patillo, 2008; Shmool et al., 2015). Future research is needed to examine these and other mechanisms.
Policy Implications
Gentrification is directly facilitated by federal, state, and local policies (Hwang & Lin, 2016). Examples include the conversion of public housing projects into mixed-income communities (Goetz, 2011), the provision of tax credits to attract housing developers to low-income neighborhoods (Davis, 2021), and the expansion of charter schools (Candipan, 2019; Pearman & Swain, 2017). This paper’s findings suggest that for the potential benefits of these policies to reach economically and racially marginalized youth, complementary strategies are needed to create an inclusive neighborhood environment.
Findings also demonstrate the need to prioritize racial equity in the design and delivery of place-based policies that aim to reduce the concentration of poverty (e.g., Choice Neighborhoods). This could include financial support for minority-led youth-serving organizations to help define the culture of the neighborhood as it changes and support for long-term Black and Brown residents who wish to stay in the neighborhood, for example through the preservation of existing affordable rental units and property tax protections for homeowners (as described in (Hickey et al., 2014; Lubell, 2016).
Limitations
One strength of this study is its use of administrative records to construct a large dataset that is broadly representative of the population of urban North Carolinian public-school students. However, as is common in administrative records, the data included few individual-level covariates. As a result, factors that may confound the relation between gentrification and youth educational outcomes were not accounted for, such as parental education, family income stability, housing security, and where youth lived prior to the start of the study period in 2010. Studies using more covariates coupled with exogeneous shocks to neighborhood conditions, such as the conversion of public housing to mixed income communities, will be better placed to isolate the causal relation between gentrification and youth educational outcomes. In addition, because the study included multiple cohorts who entered the study at different ages, findings cannot disentangle dosage effects from developmental effects. Future work should examine how the effects of gentrification vary across developmental periods and according to cumulative years spent in gentrifying neighborhoods. It is also important to note that the measure of gentrification used here reflects changes in the SES characteristics of residents and housing prices, which could occur because of new households moving in, or because of changes in income and occupational prestige among existing residents.
Despite these limitations, this study advances understanding of the role of neighborhoods as dynamic, rather than static contexts in youths’ lives. Results indicate that the social mixing that occurs in gentrifying neighborhoods may not benefit economically disadvantaged and racially minoritized youth, especially when gentrification results in the whitening of historically Black neighborhoods. Future work is needed to unpack the pathways through which exposure to rapidly changing, unequal neighborhoods affect youth.
Footnotes
Acknowledgements
The author would like to thank Anna Gassman-Pines, Sarah Gaither, Lisa Gennetian, Walker Swain, Sarah Cordes, and Rebekah Levine Coley for helpful comments on earlier versions of this manuscript.
Ethical Considerations
This research was approved by the Duke Institutional Review Board (2021-0555). The research uses secondary data analysis of school administrative records and does not involve human subjects data collection.
Funding
The authors disclosed receipt of the following financial support for the research, authorship, and/or publication of this article: This reserach was supported by a Dissertation Research Award from the American Psychological Association.
Declaration of Conflicting Interests
The authors declared no potential conflicts of interest with respect to the research, authorship, and/or publication of this article.
Data Availability Statement
Persuant to the Data Use Agreement with the North Carolina Educaiton Resarch Data Center, data for this project contain sensitive information and are not publicly available.