
Abstract
Immigrant youth represent a growing population in Canada, and ensuring their successful integration with schools is essential to promoting long-term equity. The present analysis contributes to our understanding of acculturation challenges experienced by immigrant youth examining how immigrant generation (first, second, and third), predicts school, anxiety, and peer-related risk and protective factors. A sample of 783 grade seven students across 31 schools completed self-report surveys; responses were analyzed using multilevel models to test for differences across generation. While few differences between groups were found at a conventional significance level, trends suggest increased risks for first-and second-generation youth compared with non-immigrant youth. Specifically, in comparison to non-immigrants, second-generation youth were significantly more likely to report having peers involved in delinquency. In addition, first-generation youth reported marginally lower levels of academic self-confidence and marginally higher levels of internalizing anxiety symptoms compared with non-immigrant youth. Implications and directions for future research are explored.
Introduction
Census data from 2021 indicates that Canada’s immigrant population continues to grow, and that nearly one in four Canadians are first-generation immigrants (Statistics Canada, 2024). Given the acculturation challenges that immigrant children may experience and the associated negative outcomes related to internalizing behavior, mental health struggles, and poor educational attainment (Murray et al., 2010; Tilley et al., 2021), socially and academically integrating immigrant youth is essential to promoting long-term equity. The current study builds on our understanding of the challenges immigrant youth experience by examining the relationship between immigrant generation (first, second, and third) and school, anxiety, and peer-related risk and protective factors for integration in seventh grade students.
Defining Immigrant Youth
Immigrant youth differ notably in their pre-, peri-, and post-migration experiences, and in the extent to which they encounter integration challenges in their host countries. As such, scholars have discussed immigrant youth dimensions such as refugee status, legal status of their parents, and the reasons for migration (Portes & Rumbaut, 2024). The current study focuses on immigrant generation, hypothesizing that the challenges faced by first- and second-generation youth differ from one another, and from those faced by non-immigrant youth. Immigrant generation is defined herein as: (1) first-generation: the youth was not born in Canada, (2) second-generation: the youth was born in Canada and at least one parent was not born in Canada, and (3) third-generation: both the youth and their parents were born in Canada (Statistics Canada, 2021).
Work by Perreira and Ornelas (2011) supports this distinction, suggesting that the stress and trauma associated with earlier stages of migration are more relevant to the integration of first-generation youth, whereas challenges associated with acculturation in the host country are more relevant to second-generation youth. Specifically, pre-migration experiences, such as differing cultural contexts or persecution in one’s home country, and peri-migration experiences, such as legal trouble or violent victimization during the migration journey, are pertinent to understanding the challenges of first-generation youth. Conversely, post-migration experiences, such as changes in socio-economic status, shifts in familial roles, and cultural gaps between youth and parents, are more relevant to understanding the difficulties faced by second-generation youth.
Challenges for Youth Immigrants
The present study examines six risk and protective factors associated with a range of long-term youth outcomes (such as educational attainment, mental health, and criminal behavior). These factors are organized into three domains: (1) school-related factors include perceptions of intellectual status and school satisfaction, (2) anxiety-related factors include fear of bullying at school and internalizing symptoms, while (3) peer-related factors include friend support and association with antisocial peers.
School-Related Integration Factors
Despite their challenges with acculturation, immigrant youth tend to academically outperform or do not differ significantly in performance from their native-born peers (Suárez-Orozco et al., 2009). Scholars have labeled this phenomenon the “immigrant paradox” and recent efforts have begun to disentangle its causes. Crosnoe and Turley (2011) note that immigrant children who are more academically successful are also more likely to be male, Asian or African, speak English, and come from a more supportive family with a higher socio-economic status. Recent work emphasizes the importance of family-related factors, such as parental investment, education level, and language proficiency (Gagné et al., 2020; Y. Kim et al., 2020). While immigrant youth often have higher levels of academic achievement, the prevalence of these protective factors may differ across geographic contexts and generations. For example, in some regions, first-generation youth may predominantly originate from countries lacking in access to public education (Adelman & Taylor, 2015). Moreover, second-generation children may be more likely to have an English-speaking parent. These differences may explain some of the observed heterogeneity in academic performance across immigrant generations.
Another relevant predictor of long-term educational attainment is academic and school engagement (Lawson & Lawson, 2013). While the achievement of a given youth may be satisfactory during their primary or early secondary school years, deterioration in school engagement and satisfaction can disrupt their later achievement levels. For immigrant youth, several risk and protective factors for engagement have been identified. For example, peer, parent, and teacher support are consistent predictors of engagement (Garcia-Reid et al., 2005, 2015; Suárez-Orozco et al., 2009), while low English language skills are associated with lower engagement, and in turn, achievement (Kim & Suárez-Orozco, 2015). There is a paucity of research examining school engagement across immigrant generations, although Smith et al. (2020) suggest that the high aspirations of migrant parents may promote high levels of educational engagement in their first and second-generation children. Conversely, Chiu et al. (2012) argue that given their comparatively high levels of cultural capital and access to educational resources, non-migrant youth may have higher levels of school engagement. Empirically, the limited research suggests that academic motivation is higher in first-generation youth compared to native-born youth, and that first and second-generation youth have higher levels of cognitive engagement, but non-migrant youth have higher levels of emotional engagement with schools (Fuligni, 2001).
Anxiety-Related Factors
Bully victimization is associated with increases in suicidal ideation, substance use, and psychological distress, as well as decreases in physical health, academic achievement, and self-esteem (Bhatta et al., 2014; Gini & Pozzoli, 2009; Hertz et al., 2015; Nakamoto & Schwartz, 2010; Sampasa-Kanyinga et al., 2018; Zacharia & Yablon, 2022). For immigrant youth, the consequences can be even greater. Discrimination against first- and second-generation youth has been shown to have harsher impacts on long-term outcomes, such as academic achievement, through the negative interaction with protective factors, such as social connectedness (Abu Bakar, 2021). For first-generation youth the risk is higher still, as being targeted by bullies may resurface trauma related to persecution experienced in their countries of origin, and they may lack established friendships that second-generation and native-born youth rely on for support (Adelman & Taylor, 2015). Compounding their heightened vulnerability, research largely suggests that immigrant youth are more likely to be the targets of bullying compared to their non-immigrant peers (Hong et al., 2021; Iannello et al., 2024; Maynard et al., 2016). As such, it is unsurprising that the limited extant literature on fear of bullying suggests that migrant youth are more likely to report feeling afraid (E. G. Grinshteyn et al., 2021; Peguero, 2009). Like actual victimization, fear of bullying is associated with anxiety and depression (E. G. Grinshteyn et al., 2021). Fear of racial discrimination can have similar yet more severe impacts, including psychological distress and suicidal ideation (E. Grinshteyn et al., 2022; Hwang et al., 2008).
High levels of general anxiety in adolescence are associated with poor life satisfaction, lower income, and challenges with social and academic functioning in adulthood (Essau et al., 2014; Mychailyszyn et al., 2010; Swan & Kendall, 2016). The prevalence of anxiety in immigrant youth appears to decrease with each generation, as first-generation youth experience the highest levels of anxiety, followed by second-generation, and then native-born youth (Ceri et al., 2017; Vazsonyi et al., 2006). This is consistent, even when controlling for socio-economic status. For first-generation migrants, research suggests that parent and child legal status, experiences of peri-migration victimization, host language proficiency, and satisfaction with the decision to move increase their risk of anxiety (Kremer & House, 2020; Potochnick & Perreira, 2010). Conversely, motivation to succeed, amount of time spent in their host country, and neighborhood immigrant density decrease their risk of anxiety (Emerson et al., 2023). Notably, many of these factors cannot transfer to the experiences of second-generation youth, as they relate to pre- and peri-migration experiences that they did not experience. Even so, second-generation youth do experience higher levels of anxiety than native-born youth, and some scholars have speculated that the mental health challenges experienced by their first-generation parents may transmit intergenerationally (e.g., Ceri et al., 2017).
Peer-Related Factors
Peer support and acceptance are associated with positive long-term outcomes for youth, such as increased physical health and life satisfaction, and decreased suicidal ideation (Borraccino et al., 2020; Czyz et al., 2012; Kidd et al., 2006). It can protect against more proximal threats to adolescent wellbeing as well, such as bully victimization (Bianchi et al., 2021). Some research suggests that the strength of the protective effect of peer support is stronger for first-generation immigrants compared to their second-generation and native-born peers (Wenzing et al., 2021). Importantly, peer support is a dynamic factor that can be negatively impacted by initial instances of bullying (Abu Bakar, 2021), wherein early experiences of victimization create the ideal conditions for further bullying to occur by decreasing a victim’s level of support. Despite its importance as a predictor of long-term success and a protective factor against bullying, first and second-generation youth are less likely to report experiencing peer support than their third-generation peers (Wahlström et al., 2021).
Peers may also have indirect effects on short or long-term outcomes by influencing behavior. For example, youth may become more likely to participate in criminal activities by engaging with delinquent peers. Despite being at equal if not lower risk for delinquency, some work suggests that immigrant youth differ in their experiences of risk and protective factors for delinquency. For example, DiPietro and McGloin (2012) find that immigrant youth are more susceptible to the influence of deviant peers, perhaps because they are more reliant on peers as sources of identification. More recent work corroborates this finding, with Jiang and Peguero (2017) showing that peer delinquency accounts for differences in youth delinquency across generations. With respect to prevalence, the limited extant literature has been mixed. The above-cited work suggests that peer delinquency either does not differ across generation, or that it is lowest for first-generation youth followed by second and third.
The Current Study
The current study expands on our understanding of the challenges faced by immigrant youth in a Canadian multicultural context by comparing outcomes for first-generation, second-generation, and non-immigrant youth. We examine academic integration through school-related factors including self-reported intellectual status and school satisfaction, anxiety-related factors through fear of bullying and experience of internalizing symptoms, and we examine social integration through measures of peer support and association with antisocial peers. Based on the literature, we expect that first-, followed by second-, and then third-generation youth will be more likely to hold high perceptions of their intellectual status, be more likely to feel satisfied with their school, more likely to fear bullying, have elevated rates of internalizing symptoms, report lower peer support, and have fewer delinquent peers.
Methods
Data Collection
Data for the current study were derived from data collected for an evaluation of an afterschool program targeting seventh grade students. The study was implemented in multiple schools across two school districts in metro Vancouver over four cohorts (Fall 2017, Spring 2018, Fall 2018, and Spring 2019). The study received ethics approval from Simon Fraser University approved the study protocol (study number 2017s0364) Office of Research Ethics, and research approval from the two participating school districts. The principal (or in some cases a vice principal) of each school participating in the afterschool program was approached with a request to take part in the research study. Parent information/active consent form packages were distributed to students in seventh classrooms in the participating schools; packages were available in English, Punjabi, Tagalog, and Chinese. The surveys were administered in hard copy and required approximately 30 min to complete; one or two graduate students managed each classroom and provided a standardized introduction to the survey and how to answer the questions (e.g., circling only one response and how to complete yes/no questions vs. Likert scale questions). Students were given free snacks during survey administration and were entered into a random draw to win one of two $20 gift cards per classroom.
Measures
Independent Variable
The independent variable was immigrant generation, defined as (1) first-generation: the youth was not born in Canada, (2) second-generation: the youth was born in Canada and at least one parent was not born in Canada, and (3) third-generation: both the youth and their parents were born in Canada. (This variable was created out of three survey items; one asked whether the youth was born in Canada (yes/no), the second asked whether their mother was born in Canada (yes/no), and the third asked whether their father was born in Canada (yes/no). No distinction/definition of biological versus adoptive or stepparents was provided.) We note that use of the term “immigrant” is unlikely to be legally/technically accurate for all youth in the sample, as they were not asked about their official immigration status, only whether they were born in Canada.
Demographic and Background Variables
Demographic/background variables included gender, race/ethnicity, primary language spoken at home, number of siblings/step-siblings, whether the youth’s mother and father (biological or adoptive) live in the same house, number of schools attended, number of nightly hours of homework, number of times per week in non-school extra-curricular activities, number of times per week left at home unsupervised for more than 1 hr, and number of hours per day of screen time (TV, YouTube, or video games). As ethnicity and language spoken at home were strongly related to immigrant generation, they were not included as control variables in the analytic models and are presented only descriptively. Table 1 describes variable coding; none of the correlations between variables used as controls was above 0.3.
Measures.
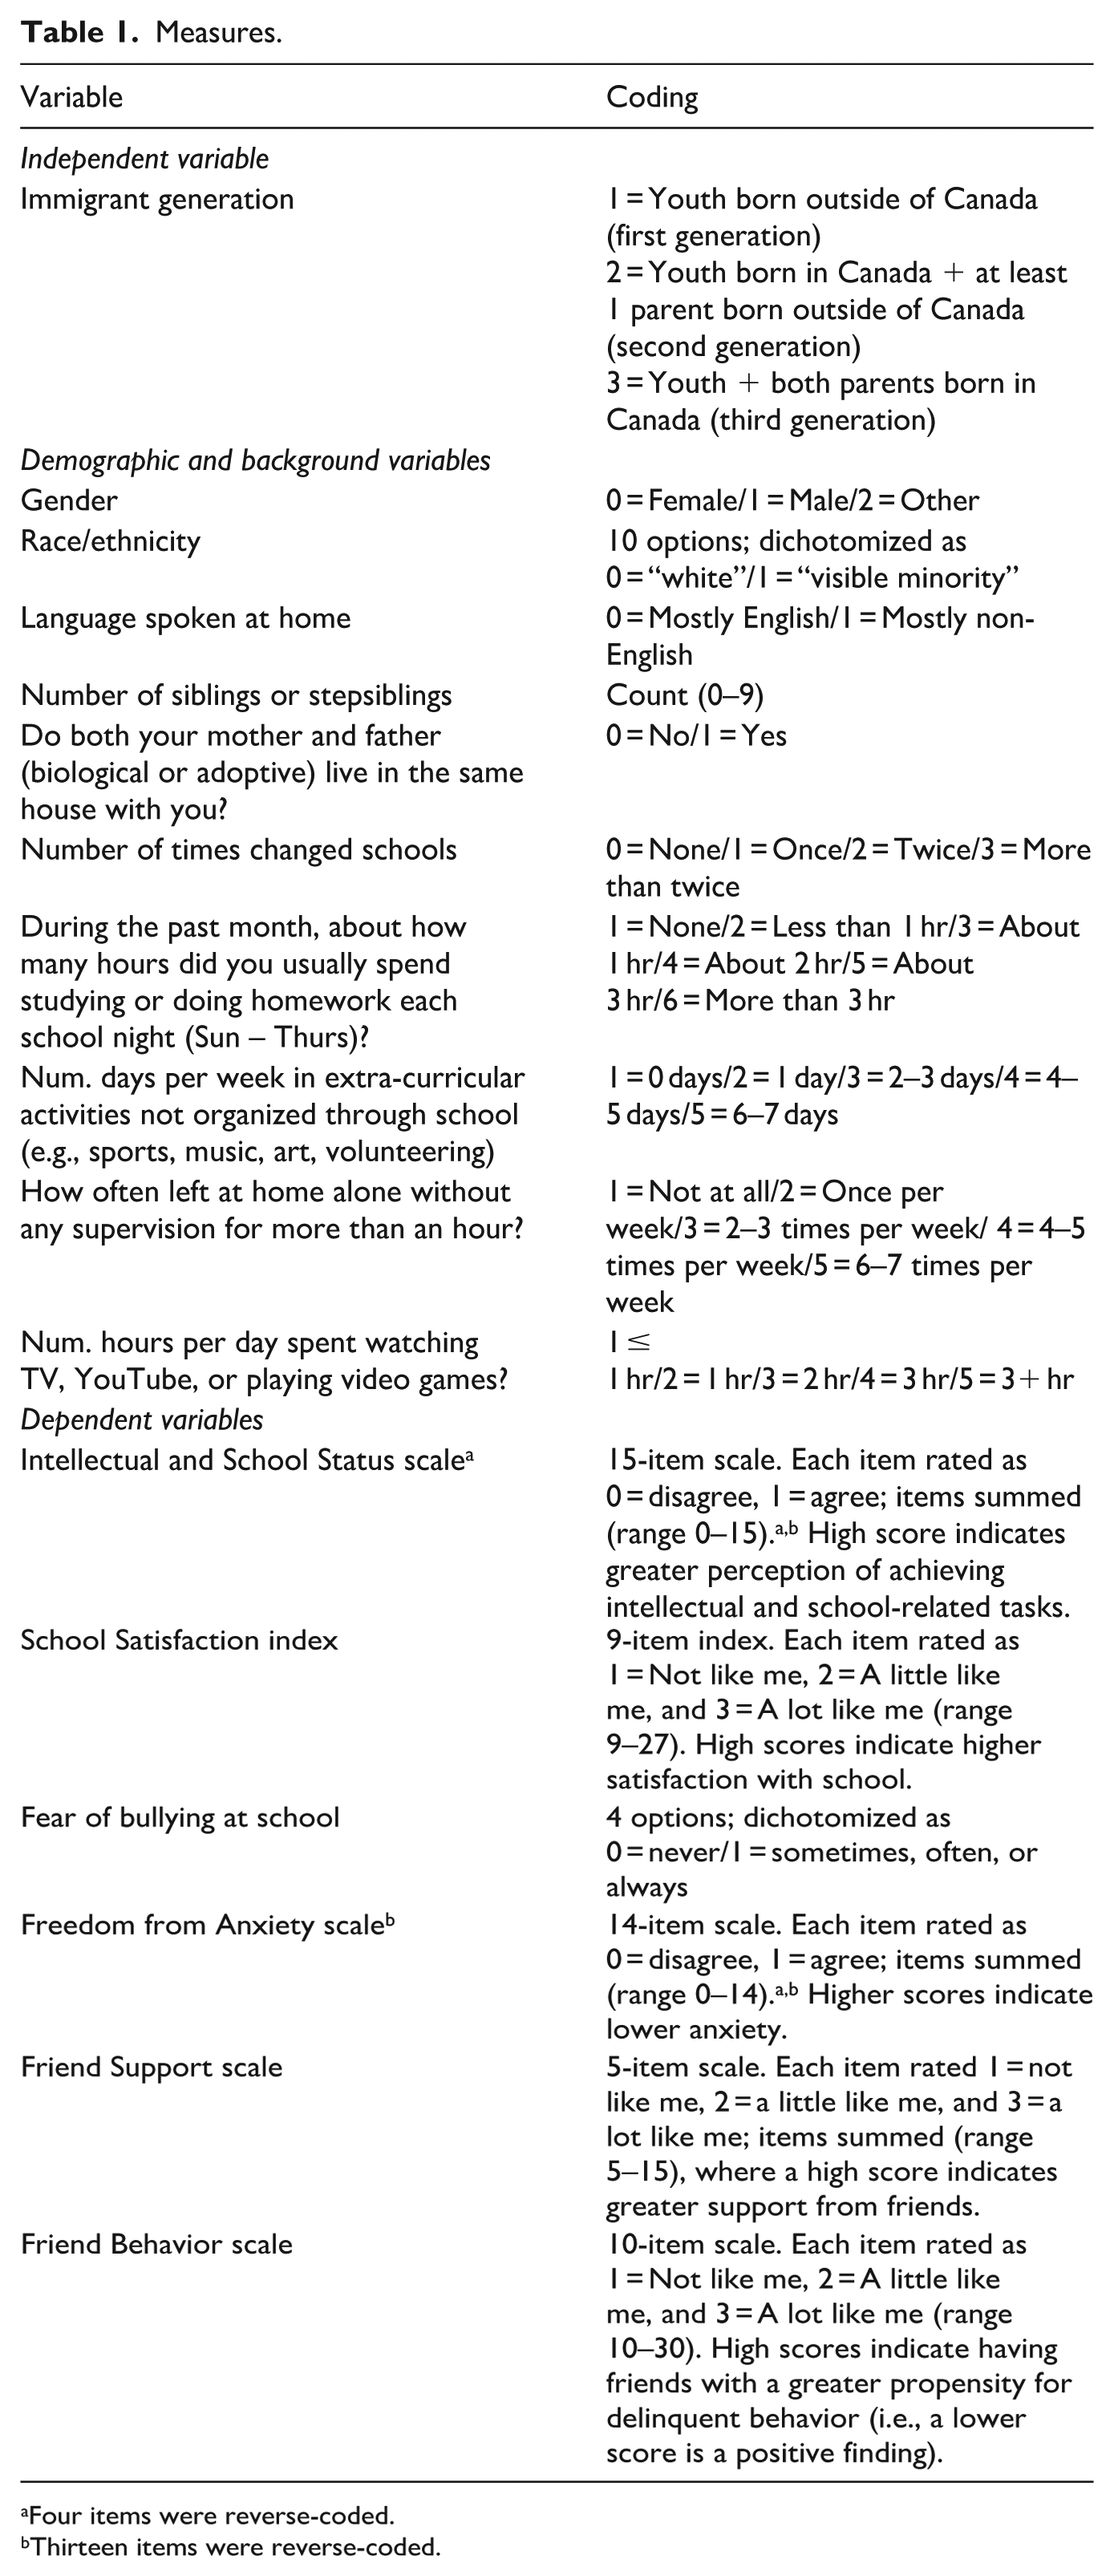
Four items were reverse-coded.
Thirteen items were reverse-coded.
Dependent Variables
The study included six dependent variables; see Table 1 for coding details:
Intellectual and School Status Scale
Originating from the Pier Harris Children’s Self Concept Scale II (Piers & Herzberg, 2002), this 15-item scale assesses student beliefs in their abilities to perform intellectual and academic tasks. While the original ISS scale contains 16 items, one item, “I am dumb about most things,” was dropped at the request of one of the school districts. Some example items include “I am smart,” “I am good in my schoolwork,” and “My classmates in school think I have good ideas.” High inter-item correlations were previously demonstrated by Piers and Herzberg (2002; α = .81) and Guerin and Tatlow-Golden (2019; α = .81). Cronbach’s alpha in the current study was .75.
School Satisfaction Scale
This 9-item scale was derived primarily from Bowen and Richman’s (2008) School Success Profile, a questionnaire targeting middle and high school students to assess attitudes and beliefs about their social environment. The scale includes items measuring school satisfaction and engagement such as “I feel close to students at this school,” “I feel like I belong at this school,” and “I get along well with teachers at this school.” Previous research reported a scale alpha of.78 (Buehler et al., 2015). In the current study, two additional items were added to form a modified version of the scale, including “Most mornings, I look forward to going to school,” and “When I’m in class, I participate in class activities” (α = .85).
Fear of Bullying
Respondents were asked a single item to capture their fear of being hurt, bothered, or bullied at school, with four response options including Never, Sometimes, Often, and Always. Given a low rate of “often” and “always” responses, the variable was dichotomized into “never” (0) versus ’sometimes/often/always’ (1).
Freedom From Anxiety Scale
This 14-item scale measures emotions such as worry, fear, and sadness (Piers-Harris Self-Concept Scale II (Piers & Herzberg, 2002)). Example items include “I am often sad,” “I get worried when we have tests in school,” and “I am nervous.” Prior research reports alpha statistics of .82 (Guerin & Tatlow-Golden, 2019; Piers & Herzberg, 2002); in the current study the alpha was .83.
Friend Support Scale
This 5-item scale is one dimension from Bowen and Richman’s (2008) School Success Profile; example items include “I can trust my friends,” “I am able to tell my problems to my friends,” and “I can count on my friends for support.” Scores across the five items are summed, with high scores indicating a greater perception of supportive friendships. Bowen and Richman (2008) report a Cronbach’s alpha of .84; in the current study the alpha was .80.
Friend Behavior Scale
This 10-item scale from the School Success Profile (Bowen & Richman, 2008) assesses student association with friends who are engaged in delinquent behaviors. Example items include: “I have friends who get in trouble with the police,” “I have friends who use drugs (e.g., marijuana),” and “I have friends who carry a weapon such as a knife, gun, or club.” In the current study the scale was modified to include an extra item about cigarette use (α = .82); prior research by Farmer and Hairston (2013) reports an alpha of .90.
Analytic Approach
Bivariate group comparisons for demographic and background data were examined using chi-squared tests, Fisher’s exact tests, Kruskal-Wallis tests, Wilcoxon Mann Whitney tests, or ANOVA as appropriate. Raw group mean comparisons were conducted using Kruskal-Wallis H tests with Dunn’s pairwise comparisons and Pearson chi-squared tests.
Multiple Imputation
We used multiple imputation to replace missing values with multiple sets of simulated values in each dataset (Austin et al., 2021; Azur et al., 2011; Newman, 2014). As discussed by Rubin (1996), this approach results in valid statistical inference as it exploits the variation between the imputed datasets. Multiple imputation was implemented using chained equations (MICE) in StataNow/SE 18.5 and was conducted separately for each of the six models using an item-level approach. The base sample size was 783 students but differed across models due to listwise deletion and nuances of the imputation models (resulting in convergence problems) that in some cases required dropping a handful of observations. The models were constructed using linear regression to impute continuous variables, logistic regression to impute binary variables, and ordinal logistic regression to impute ordered variables. We imputed 20 datasets for each model, imputed variables included missing dependent variable scale items (as long as the respondent had completed over 50% of the scale; see Graham, 2009), and demographic/background variables (e.g., gender, screen time hours) as long as the respondent had answered at least 50% of the eight demographic/background variables. A range of 7 to 22 variables were imputed for each model (at times convergence was a problem and as a result gender was not included); the model also included auxiliary demographic/background variables with complete data (i.e., variables with complete data were used as auxiliary variables). Details on the imputation models are available upon request.
Multivariate Models
We estimated treatment impacts using multilevel mixed effects models in StataNow/SE 18.5 to account for nesting within schools (see Raudenbush & Bryk, 2002; Ruíz et al., 2023). All models incorporated eight control variables including gender, number of siblings, parents living in same house, number of schools, daily hours of homework, days per week in extra-curricular activities, days per week left unsupervised at home, and daily hours of screen time. An independent residual structure was used, and standard errors were cluster-adjusted. Assumptions were checked, with no major concerns noted other than a small number of outliers. Sensitivity testing was conducted in three ways: (1) by implementing models with an exchangeable residual structure, (2) by implementing models without clustering for schools, and (3) by implementing models with noteworthy outliers dropped (i.e., residuals > 3.0).
Results
Sample
Over the four semesters of data collection, approximately 2,425 students from 93 classrooms in 31 schools were invited to participate in the study. Unfortunately, while the number of schools participating in the study is known, the number of classrooms in each school and the number of students in each classroom are not known. We estimated the total number of students invited to participate in the survey from the number of grade 7 classrooms listed in each participating school, with the assumption that each classroom contains 30 students. A total of 798 students completed the pretest survey; however, 14 youth did not complete the survey questions asking whether they (n = 5), their mother (n = 10), and/or their father (n = 17) were born in Canada and were dropped from the dataset. One additional youth was dropped as they were missing over 50% of the control variables. In total, 222 youth were first-generation immigrants (28%), 390 were second-generation (50%), and 171 were third-generation (non) immigrants (22%). Table 2 presents descriptives for the analytic sample of 783 students.
Sample Descriptives.
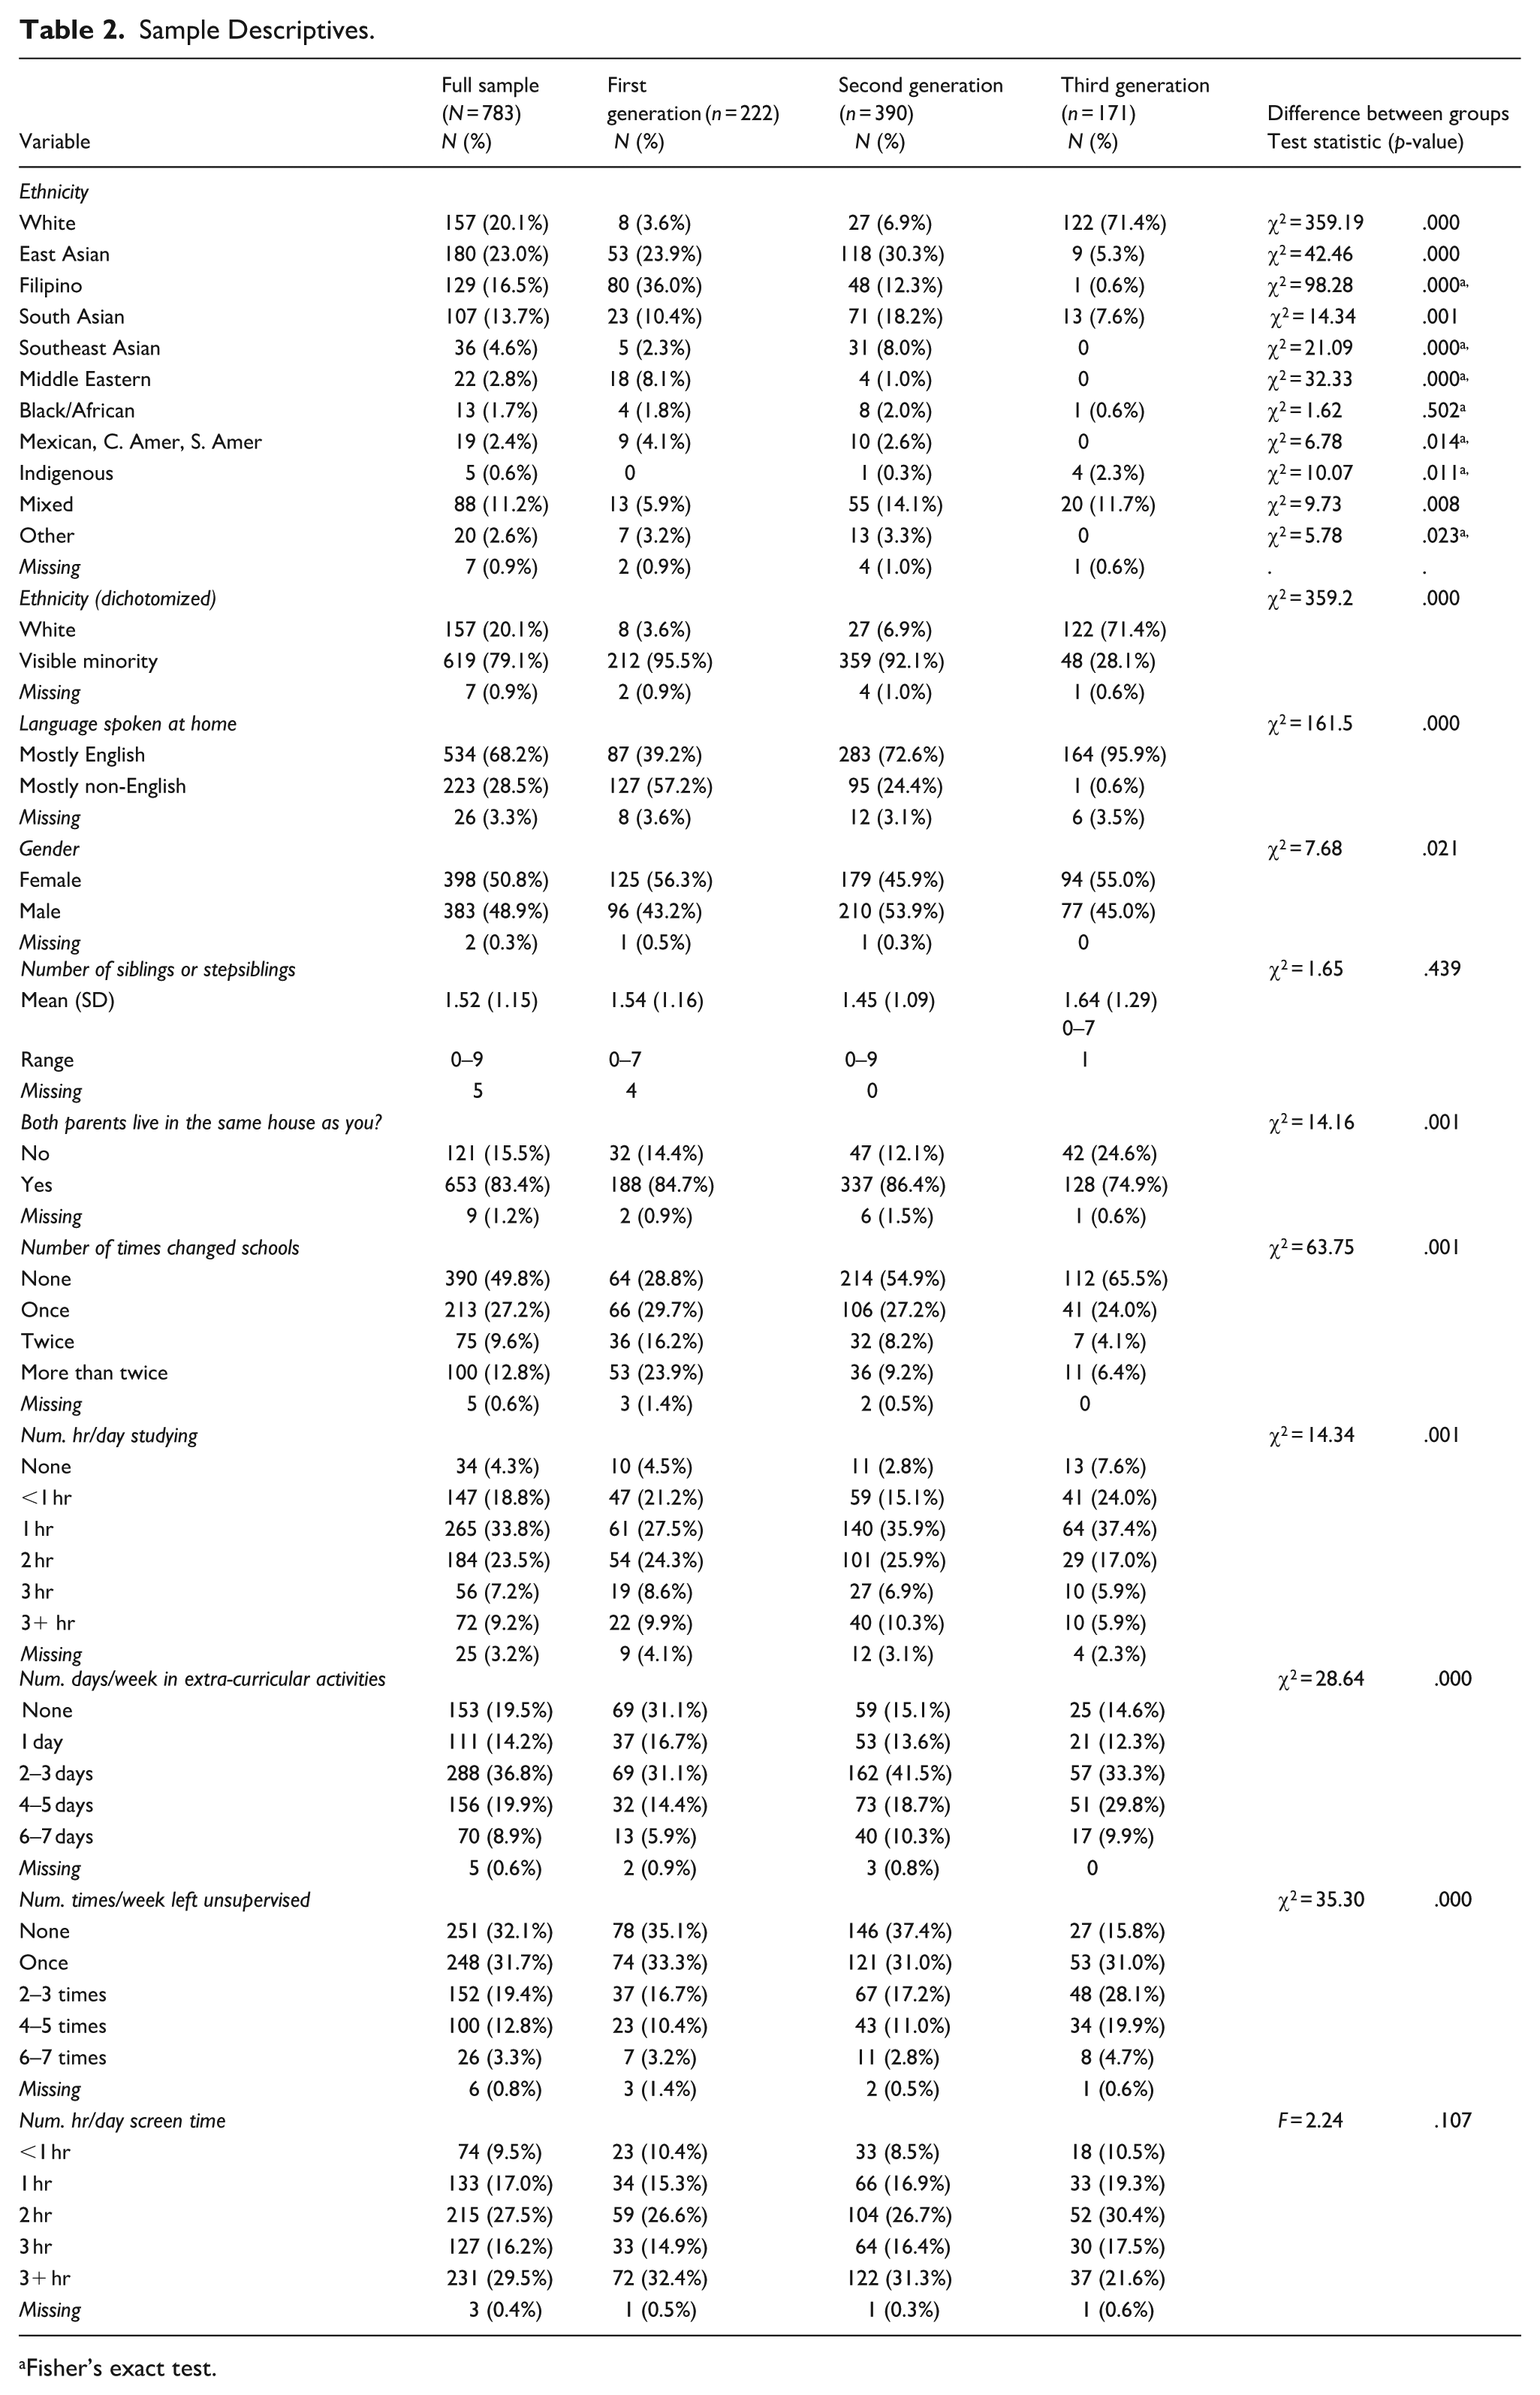
Fisher’s exact test.
As expected, the groups differed significantly with respect to ethnicity, with the group of third-generation Canadians being predominantly white (71%) versus 7% of the second-generation and 4% of the first-generation students. Similarly, more third-generation youth spoke predominantly English at home (96%), versus 73% for second-generation and 39% for first-generation. The full sample contained nearly equivalent numbers of girls (51%) and boys (49%), with significantly more males in the group of second-generation immigrants. Respondents had an average of 1.52 siblings; this did not differ across groups. In the full sample, 83% of youth reported living in the same house as both parents; this was significantly more likely for first-and second-generation immigrants (85% and 86%, respectively) compared to third-generation Canadians (75%).
First-generation immigrants were more likely to have changed schools at least once (70%) compared with second-generation (45%) and third-generation immigrants (35%). Most students reported spending 1 to 2 hr per night studying or doing homework (57%); a significantly higher rate was shown by second- and first-generation immigrants compared with third-generation. With respect to participation in non-school-based extra-curricular activities, rates were highest for third-generation students (mean = 3.08), followed by second-generation (mean = 2.95), and first-generation (mean = 2.47). Third-generation students were significantly more likely to be left at home unsupervised (mean = 2.66, vs. 2.10 for second-generation and 2.12 for first-generation). Finally, screen time (including TV, video games, YouTube) was common, with 26% of students reporting 1 hr per day or less, 28% noting 2 hr, 46% reporting three or more hours. These rates did not differ across groups.
Bivariate Findings
Table 3 presents bivariate mean scores for the six dependent variables using the raw, non-imputed, non-weighted data. With respect to self-perception of intellectual and school status, first-generation immigrants scored lower than second- and third-generation. Similarly, first-generation students were significantly more likely to report being afraid of bullying than were second- or third- generation students (χ2 = 7.783, p = .020*). Specifically, 59% of first-generation students reported ever being afraid, compared to 49% of both second- and third-generation students. First-generation immigrants also reported significantly more anxiety than the other groups.
Bivariate Findings (Raw Data, Non-Imputed).
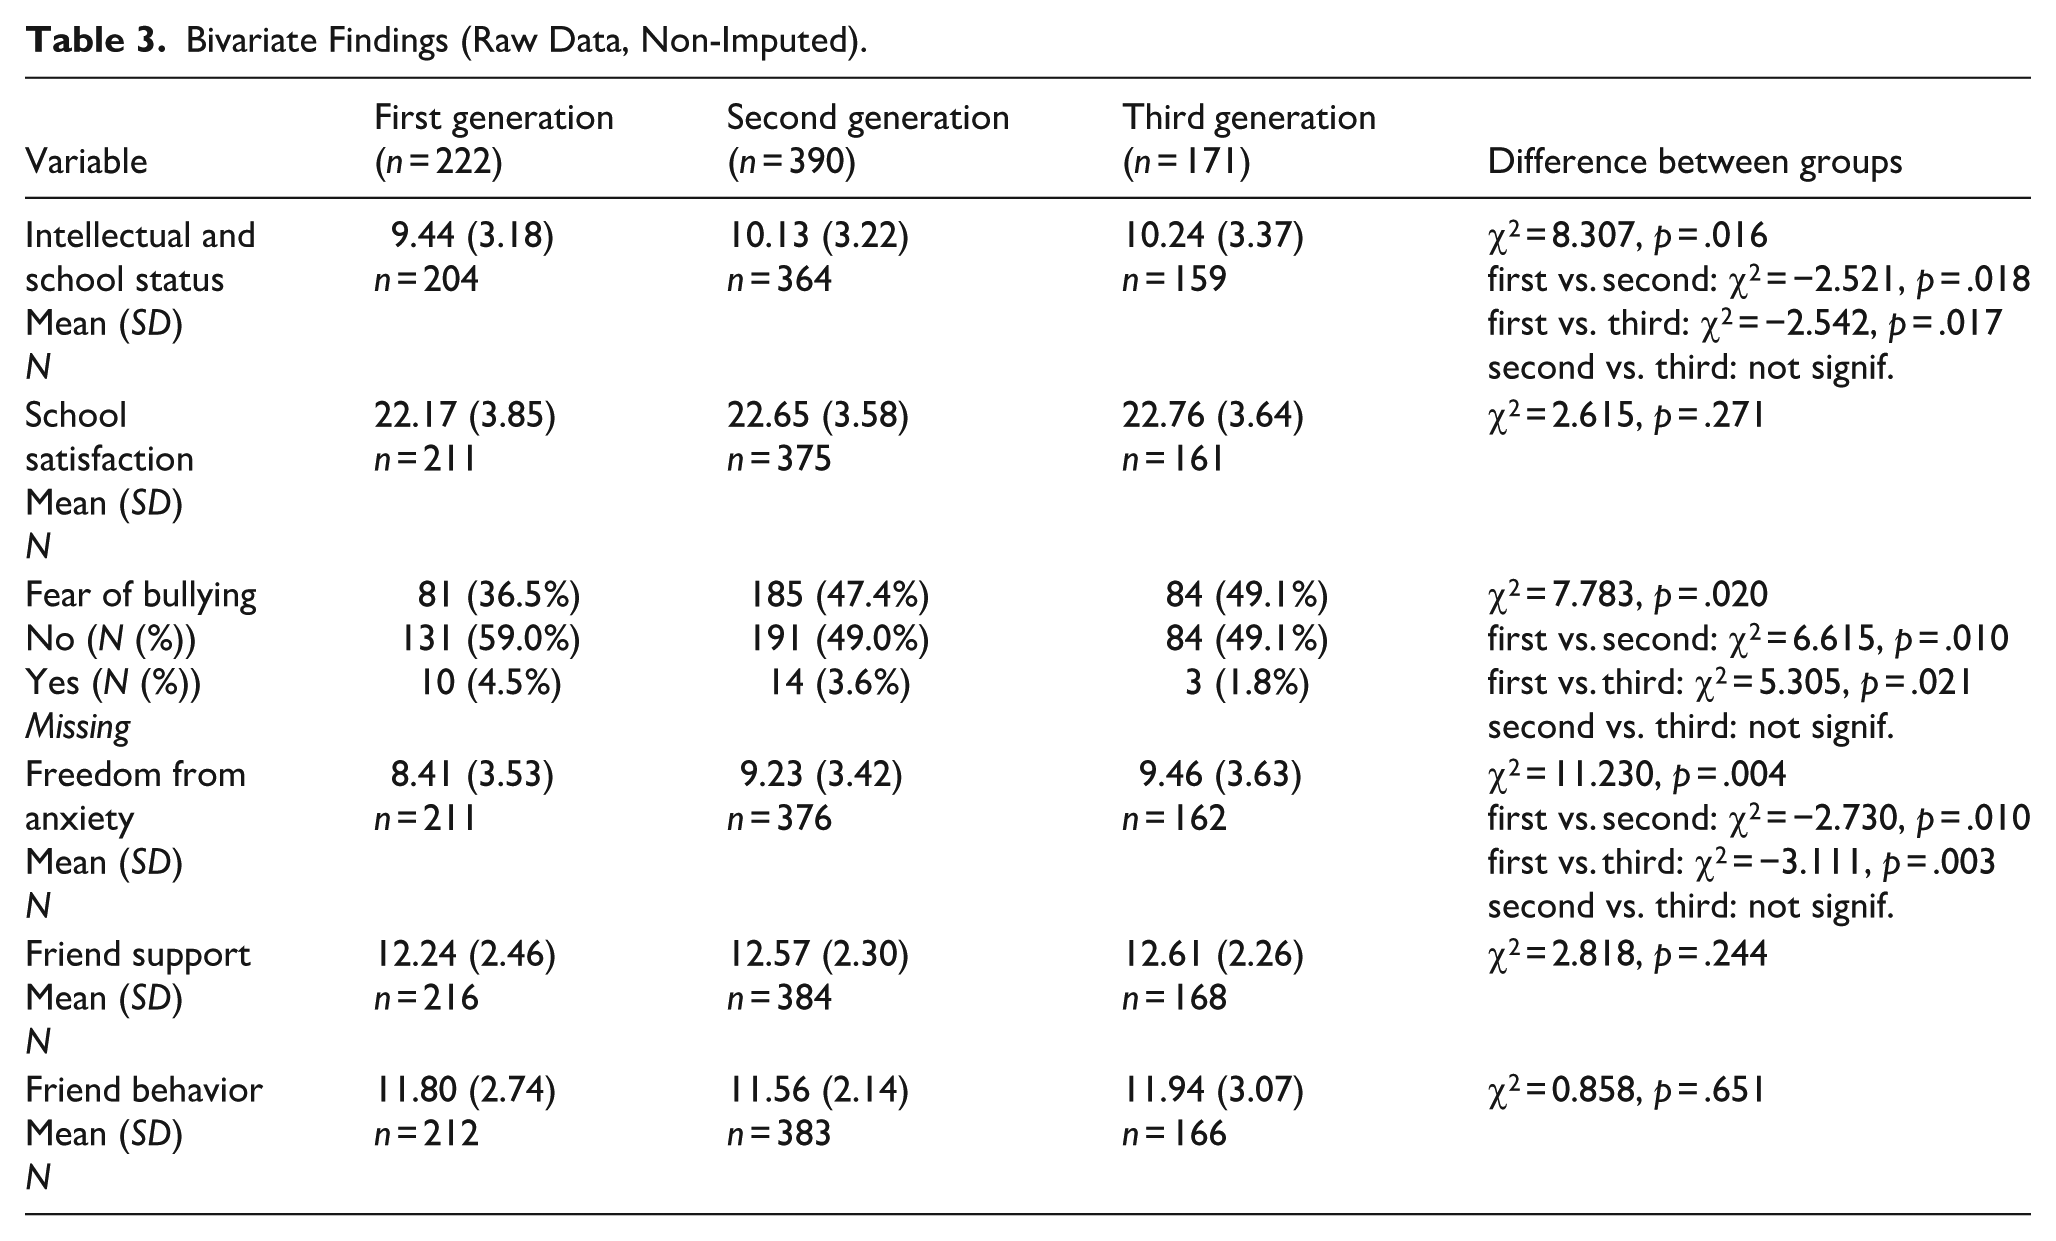
No significant differences were found among the three groups for school satisfaction, perceptions of friend support, or association with friends who engaged in delinquent behavior.
Multivariate Findings
School-Related Factors
Intellectual and School Status
There were no statistically significant differences across immigrant generation for student self-concept with respect to intellectual and school status at the p < .05 level. However, relative to third generation Canadians, first generation immigrants were marginally more likely to report lower scores with respect to intellectual/school self-concept (β = −.564, SE = 0.321, t = 1.76, p = .079). While sensitivity testing with different model specifications did not change these substantive findings, dropping the extreme outliers moved the coefficient for first generation immigrants to a traditional significance level (β = −.643, SE = 0.318, t = 2.02, p = .043), providing additional evidence for a difference between first and third generation students. In all models, students who lived in a two-parent household, who participated in more extra-curricular activities, and who had less daily screen time were more likely to demonstrate positive reflections with respect to their intellectual and school status.
School Satisfaction
No significant differences were found by immigrant generation with respect to school satisfaction. Students who spent more days per week in extra-curricular activities and those with less daily screen time were significantly more likely to report satisfaction with their school. Sensitivity testing did not change any of the substantive findings.
Anxiety-Related Factors
Fear of Bullying
As shown in Table 4, in the multilevel mixed effect logistic regression model there was no difference in fear of bullying for first- or second-generation immigrants relative to third-generation students. Specifically, while results in the raw group comparison suggested that first-generation immigrants were more fearful, in the multilevel model only gender and extra-curricular activities were significant predictors of fear of bullying. Girls were more likely to fear bullying than were boys, and those with lower participation in weekly extra-curricular activities were more likely to be afraid.
Multilevel Model Results.
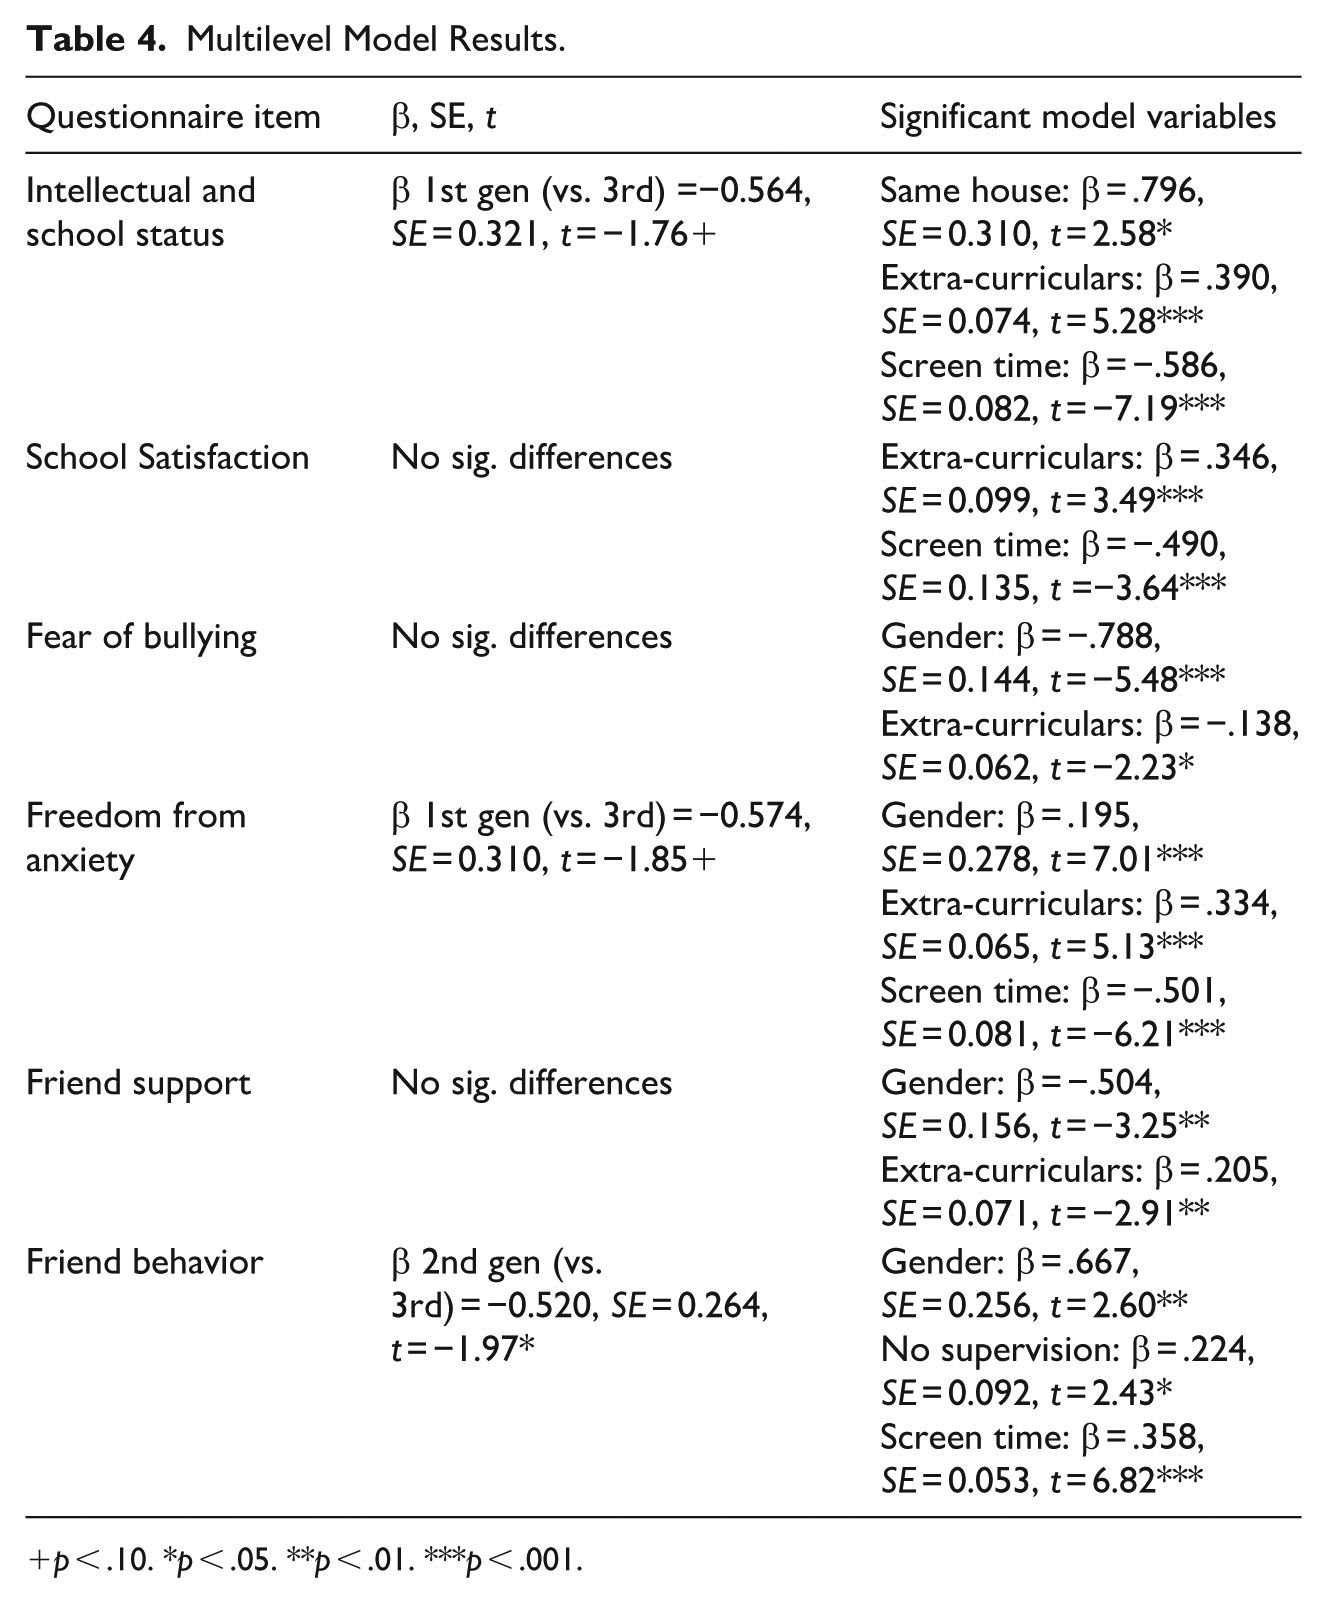
p < .10. *p < .05. **p < .01. ***p < .001.
Freedom From Anxiety
Marginally significant differences were found between first-generation students versus third-generation students with respect to anxiety and internalizing symptoms (β = −.574, SE = 0.310, t = 1.85, p = .064), with first-generation students showing higher levels of anxiety. Sensitivity testing did not impact these findings. Males, students who spent more days per week engaged in extra-curricular activities, and students who spent fewer hours per day on screens were more likely to demonstrate reduced anxiety.
Peer-Related Factors
Friend Support
First- and second-generation immigrants did not differ from third-generation Canadians with respect to feelings of friend support. Boys were less likely to note having supportive friends than were girls, as were students who reported lower participation in extra-curricular activities. No differences were found in additional models through sensitivity testing.
Friend Behavior
As shown in Table 4, multilevel analyses showed statistically significant differences by immigrant generation for the likelihood of students having friends who participate in delinquent activities. Second generation students were more likely to report delinquent friends than were third generation students (β = −.520, SE = 0.264, t = 1.97, p = .049). Other significant predictors include being male, having more time unsupervised at home, and spending more hours per day on screen time. After dropping notable outliers, the coefficient for second generation immigrants shrank to a marginally significant level (β = −.355, SE = 0.215, t = 1.65, p = .098).
Discussion
The current study finds that immigrant generation had a weak association with three of the six school, individual, and peer-related integration factors examined. While no consistent differences across immigrant generation have been previously established for some of the factors we examined (e.g., association with antisocial peers), other factors have been shown to differ significantly across immigrant generation. For example, work by Peguero (2009) examining American high school students found that the odds of first and second-generation youth experiencing a fear of bullying was over three times higher than the rate of fear for non-immigrant youth. More recent work corroborates this finding, suggesting that migrant youth are more vulnerable and likely to experience actual bully victimization (see Adelman & Taylor; Abu Bakar, 2021; Iannello et al., 2024). These findings were not replicated in the present analysis. Notably, in the current study we measured fear of bullying using a single dichotomized item – it is possible that this reductionism precluded the discovery of nuances in findings with respect to high versus lower levels of bullying fear.
The results regarding anxiety (internalizing symptoms) align with previous work but were less conclusive than expected. Whereas general anxiety is often found to be significantly higher in first- and second-generation immigrant youth (see Ceri et al., 2017), we found marginally significant effects for first-, but not for second-generation youth relative to non-immigrant youth. While the marginally significant findings do not warrant strong conclusions, these findings suggest the possibility that the acculturation challenges experienced by first-generation students may result in greater feelings of anxiety (e.g., “I worry I lot,” “I cry easily,” “I wish I were different”). As such, qualitative efforts in schools could be made to identify specific areas of heightened anxiety for migrant youth (such as differences in school expectations, struggles with language, or difficulties adjusting to cultural norms), and relevant programing and services offered to help offset anxiety in this population.
Overall, one potential explanation for the lack of strong differences among groups with respect to anxiety and bullying may be the “ethnic density effect,” which refers to the protective impact that residing in an ethnic minority-dense neighborhood has on the mental health of racial minorities. Recently, Emerson et al. (2023) found support for this effect with regard to anxiety experienced by immigrant youth. The site of the present analysis, Metro Vancouver, is highly multicultural and immigrant dense; in 2021, census data reported that over 40% of residents were first-generation immigrants (Statistics Canada, 2022). Moreover, the majority are visible minorities (80.5%) and come primarily from East and South Asian backgrounds (45.5% and 22.8% respectively). As such, it is possible that the elevated immigrant density of the area helped to protect first- and second-generation participants against fear of bullying and general anxiety. Our null findings for fear of bullying may also indicate that the prevalence of bully victimization in this region is lower than might be expected. It is possible that certain environmental risk and protective factors for bully victimization, such as level of parental supervision (Hong et al., 2021) are impacted by the ethnic density of neighborhoods as well. These suggested explanations, however, are not tested in the current research.
Intellectual/school self-concept was marginally lower for first-generation youth in the current sample compared to their non-immigrant peers, but not for second-generation youth. When extreme outliers were dropped from the model, the finding was statistically significant at p = .043, providing more support for a meaningful difference between first- and third-generation students. Notably, this effect remained after controlling for indicators of some of the known risk factors associated with low academic achievement, such as English language use and amount of unsupervised time at home (see Crosnoe & Turley, 2011; Gagné et al., 2020; Y. Kim et al., 2020). While preliminary, this finding suggests the possibility that acculturation challenges born of pre- and peri-migration experiences which are specific to first-generation youth disrupts confidence in their ability to pursue academic endeavors. Perhaps being judged by different expectations for school performance and success in their country-of-origin lead to feelings of inadequacy and alienation for youth in their host country. Alternatively, it is possible that first-generation youth are at higher risk of stigmatization causing low self-confidence due to their increased visibility as migrants. Overall, while the observed disparity in intellectual/school self-concept was small, it is worth considering whether it may promote long-term inequity by discouraging first-generation students from further academic pursuits. As such, schools may benefit from policies which specifically target migrant youth for participation in clubs, programs, and extra-curricular activities related to academic excellence, to help boost feelings of self-efficacy and ability.
School satisfaction and engagement, which are important predictors of long-term immigrant success (see Lawson & Lawson, 2013), did not differ between the groups. Notably, much of the academic engagement literature treats the construct of school engagement as multidimensional, with behavioral, cognitive, and emotional/relational dimensions. For example, cognitive engagement refers to youth interest in school materials, behavioral engagement refers to youth involvement in academic pursuits, and relational/emotional engagement refers to youth attachment to counselors and teachers (H. Y. Kim & Suárez-Orozco, 2015). However, school satisfaction/engagement was measured uni-dimensionally in the current study. One of few studies examining the impact of acculturation challenges on the academic engagement of migrant youth found that first and second-generation youth have significantly higher levels of cognitive engagement, but lower levels emotional engagement than their non-immigrant peers (Chiu et al., 2012). As such, it is possible that in the present sample the impact of immigrant generation on either of these subfactors cancelled the other out, resulting in null findings. Still, it is likely that neither significantly differed across immigrant generation. As Chiu et al. (2012) note, there are theoretical reasons to suspect that migrant youth may have both higher and lower levels of academic engagement than their peers; while immigrant youth lack the educational resources of their peers, their parents tend to be more optimistic about their potential for success. As such, efforts to promote school engagement for immigrant youth may be a worthwhile focus for schools seeking to cultivate youth emotional and academic success. These efforts might include, for example, promoting peer collaboration through larger school and cross-grade projects events, increasing student voice with respect to decision making for classroom or school initiatives, providing safe spaces where students feel included, and increasing efforts to celebrate diversity.
Feelings of peer support also did not differ across immigrant generation in the present analysis, contradicting results from Wahlström et al. (2021) who found a lower sense of belonging for first and second-generation youth compared to non-immigrant youth. Peer support is an important protective factor for migrant youth, as it not only promotes various mental health outcomes, but builds resilience against adverse experiences such as bully victimization (Bianchi et al., 2021). While acculturation did not appear to negatively impact feelings of peer support for migrant youth in the current study, it should not be disregarded as a predictor of their long-term success. As shown by Wenzing et al. (2021), peer support has a disproportionately high positive impact on first-generation youth, and as such schools may benefit from promoting friendship-building experiences among migrant youth.
Interestingly, second-generation youth had significantly higher rates of delinquency-associated peers compared with third-generation youth. A potential explanation could be that second-generation youth experience tension between the cultural expectations of their families and that of their host countries, resulting in identity conflict, stress, and attitudes conducive to antisocial peer associations. Segmented assimilation theory supports this proposed explanation, positing that second-generation migrants assimilate into either the middle class of the host country, its lower class, or a preserved local community of migrants (FitzGerald, 2025; Portes & Zhou, 1993). The second pathway, dissonant acculturation, may be overrepresented in this sample and is argued to be caused by racial discrimination, lack of prosocial opportunities, and interactions with counter-cultural subgroups that promote antisocial attitudes. However, given the non-significance of this finding for first-generation youth, these explanations seem less plausible. Instead, perhaps marginalization, an acculturation strategy described by Berry (2007) as the rejection of both the dominant culture of the host country and parent migrant culture is what produced higher levels of deviance association for second-generation youth. Overall, given migrant youth increased susceptibility to deviant peers (see DiPietro & McGloin, 2012), this result is concerning. Schools may benefit from embracing cultural diversity in ways that diffuse such tensions by celebrating cultural and ethnic differences. Further, programs that seek to promote prosocial peer association should consider the role that acculturation and self-identification challenges may play for students.
Limitations
Our analysis was subject to several methodological limitations which should be considered. First, the study was conducted in two culturally diverse urban school districts in a large metro Canadian region; the generalizability of findings to students in dissimilar regions should be undertaken cautiously. Second, with respect to measurement error, all of the data were self-report, and as such, social desirability bias may have impacted responses. In addition, the operationalization of certain dependent variables was limited. For example, while school engagement is often split into multiple dimensions such as behavioral, cognitive, and relational (see H. Y. Kim & Suárez-Orozco, 2015), the present analysis treated it as a unidimensional measure of school satisfaction. Similarly, fear of bullying was measured with a single dichotomous indicator, whereas it is often measured with a scale (e.g., Olweus, 1996). A different operationalization of these variables may have led to different findings.
Finally, the operational definition of immigrant generation was created using student’s self-reports of whether they and their parents were born in Canada. This measure assumes that youth are aware of the answers to these questions, and depends on the respondent’s interpretation of the terms “mother” and “father” as the survey item did not differentiate between biological or adoptive parents (or any other less traditional parent/guardian role). Further, some scholars advocate for distinguishing first-and second-generation youth into even smaller subcategories. For example, work by Ho and Kao (2021) advocates for the distinction between second generation children living in mixed-nativity households from those living in immigrant-only households. The authors found that the family dynamics of mixed-nativity households more closely resemble those of non-immigrant families than they do immigrant-only families. In addition, Zhou (1997) notes that the distinction between first-and second-generation immigrant has not been consistent across the literature. First-generation immigrants who migrate before adulthood are sometimes classified as second-generation if they arrived at an early age, while other authors label them “one and a half” generation. These differences may also limit the generalizability of the findings.
Conclusion
The current study uncovered few differences among first, second, and third generation immigrants with respect to school, anxiety, and peer-related risk and protective factors. One notable exception is that second-generation immigrant youth were more likely than third-generation youth to have friends involved in delinquent behaviors. Further, marginally significant trends suggest that first-generation youth struggled with higher levels of internalizing anxiety symptoms and lower levels of academic self-concept compared to their third-generation peers. Future work should explore multiple forms of reporting (such as interviews, teacher reports, and parent reports) and more comprehensive measures of youth integration risk and protective factors. Future work could also examine the differing ways that youth experience these factors over the course of their adolescence. Some of the outcomes included in this analysis are mutually predictive; for example, general anxiety is both predicted by bullying (E. G. Grinshteyn et al., 2021) and is a risk factor for bullying (Wilcox et al., 2018). As such, developmental trajectories for these factors may differ based on immigrant generation. With respect to policy implications, our findings suggest that school administrators concerned with immigrant student success should seek to alleviate migrant youth anxiety, create avenues to foster friendships and peer support, celebrate cultural diversity across the student body, and foster immigrant youth school engagement.
Footnotes
Acknowledgements
We gratefully acknowledge financial support from the Social Sciences and Humanities Research Council of Canada. We deeply appreciate the time and effort of all students who participated in the study, and the teachers and administrative staff who helped facilitate the surveys.
Ethical Considerations
The Office of Research Ethics at Simon Fraser University approved the study protocol (study number 2017s0364) on August 22, 2017.
Consent to Participate
Parents provided active consent for student participation. Respondents signed written consent forms before completing surveys.
Author Contributions
JSW: Conceptualization, Methodology, Formal analysis, Investigation, Writing – Original draft, Writing – Review & Editing, Visualization, Supervision, Project administration, Funding acquisition. JN: Writing – original draft, Writing – Review & editing, Visualization.
Funding
The authors disclosed receipt of the following financial support for the research, authorship, and/or publication of this article: This work was supported by a Social Sciences and Humanities Research Council of Canada grant.
Data Availability Statement
The participants in this study did not give consent for their data to be shared publicly, so due to the sensitive nature of the research supporting data is not available.