
Abstract
Over the past two decades, the World Health Organization has led the movement to transform cities into age-friendly environments, aiming to improve health, participation, and security for older adults. Despite these efforts, the measurement of age-friendliness at a global level remains a challenge. The Age-Friendly Cities and Communities Questionnaire (AFCCQ) is a significant tool in this regard, providing a quantitative approach to assess cities’ age-friendliness across different countries. In this study, researchers used the AFCCQ to conduct a multi-country analysis, identifying five distinct typologies of older adults based on their experiences in eight countries. Here we show that these typologies offer a nuanced understanding of age-friendliness that transcends national boundaries. These findings contribute to the global effort to create more inclusive urban environments, guiding policymakers to design targeted interventions to enhance the quality of life for older populations.
Introduction
The ever-increasing levels of population aging and urbanization (Plouffe and Kalache, 2010) have led to the emergence of urban aging as a domain of research and practice (Buffel and Phillipson, 2018; Van Hoof and Kazak, 2018), which is closely related to geographical and environmental gerontology, as well as urban planning, architecture, and transportation sciences. As the majority of older people now live in cities, these urban population centers must ensure their inclusion and full access to urban spaces, structures, and services (Plouffe and Kalache, 2010). Urban spaces, structures, and services are, therefore, to be designed bearing the needs of older people in mind. The urban design and architecture for longevity and old age has been a topic of research and innovation in urban planning and urban studies for decades (Ball, 2012; Buffel and Phillipson, 2024; Buffel et al., 2019; Caro and Fitzgerald, 2016; Chao, 2018; Davies and James, 2016; Drilling et al., 2025; Gardiner and O’Brien Webb, 2023; Kresl and Ietri, 2010; Lane, 2019; Moulaert and Garon, 2016; Pozo Menéndez and Higueras Garciá, 2022; Skinner et al., 2018; Stafford, 2020; Van Hoof and Kazak, 2018; Yarker, 2022) but has gained particular momentum since the publication of Global Age-Friendly Cities: A Guide by the World Health Organization (WHO, 2007). This publication is used by cities and communities around the world as a blueprint for creating a wide range of age-friendly environments, including in the topic areas of outdoor spaces and buildings, transportation, and housing (Van Hoof et al., 2021). Many scholars and practitioners have stressed the fundamental role of place in later life, including both its physical and social dimensions (Drilling et al., 2025), or have stressed the need for looking at urban planning for aging populations through a spatial justice lens (Buffel et al., 2024). There may still be many negative narratives about aging and older citizens alike, which reflects ageist stereotypes that limit urban policy changes and hamper an age-friendly design for all generations (Drilling et al., 2025; Van Hoof et al., 2020). In the light of urban planning and development, it is important to obtain a better understanding of the heterogeneous group of older people in our societies.
The WHO has been at the forefront of initiatives aimed at transforming cities and communities into “age-friendly” environments for nearly two decades (WHO, 2007). This concept, rooted in optimizing opportunities for health, participation, and security, seeks to enhance the quality of life for older adults through interventions in eight topics, namely Outdoor Spaces and Buildings, Transportation, Housing, Social Participa-tion, Respect and Social Inclusion, Civic Participation and Employment, Communi-cation and Information, and Community Support and Health Services. In December 2025, 1739 cities and communities in 57 countries committed to this goal by becoming a member of the WHO Global Network for Age-Friendly Cities and Communities which was established in 2010. This network facilitates the sharing of experiences and fosters mutual learning, providing access to a comprehensive database of age-friendly practices and a wealth of resources, including toolkits, publications, research updates, and videos (WHO, 2018, 2025).
Despite these efforts, the movement towards age-friendly cities faces significant challenges, particularly in the development of instruments and methodologies that can effectively provide global insights (Thiyagarajan et al., 2022). Although international efforts exist (Buckner et al., 2019; Diaz and Banerjee, 2023; Garner and Holland, 2020; Gibney and Ward, 2018; Gichu and Harwood, 2023; Kim et al., 2022; Menec and Nowicki, 2014; Orpana et al., 2016; Safa et al., 2024; Wong et al., 2015; Yu et al., 2019), none of these instruments have successfully measured the age-friendliness of cities and communities in a comprehensive way, which is a great hindrance to the ambitions of the United Nations Decade of Healthy Ageing. One exception is the Age-Friendly Cities and Communities Questionnaire (AFCCQ), developed by Dikken et al. (2020), which represents a significant step forward. This 23-item instrument provides a systematic, quantitative approach to evaluate and assess the age-friendliness of cities, enabling the monitoring of progress and offering valuable feedback on the impact of policies and social programs (Van Hoof et al., 2022). Moreover, the AFCCQ is the only instrument to demonstrate a high degree of measurement invariance across countries, allowing for meaningful comparisons of results between them.
Researchers from several countries previously used the AFCCQ to identify different typologies of older people living in cities (Ivan et al., 2024; Pavlovski et al., 2024; Perek-Białas et al., 2024; Van Hoof et al., 2024; Wasserman et al., 2025). With the confirmation of measurement invariance, the AFCCQ now offers a robust framework for identifying typologies that transcend national boundaries, which is crucial for understanding diverse needs and creating effective strategies for, and designs of, age-friendly environments at the global level. These typologies could hold significant implications for several institutions and organizations, including the WHO. As the directing and coordinating authority on international health within the United Nations’ system, the WHO could use the typologies to develop standardized frameworks and evidence-based age-friendly and health policies. While these global frameworks highlight common challenges across regions, they also provide a foundation for crafting tailored local interventions, ensuring that solutions meet the specific needs of communities while advancing broader goals, such as promoting age-friendly environments worldwide. Advancing our understanding of age-friendly cities and communities through these typologies ensures that cities are well equipped to meet the needs of their aging populations in the coming decades. This research not only addresses existing gaps in age-friendly research but also features diverse voices and viewpoints, particularly from traditionally understudied and underrepresented geographies, including the Global South (Buffel et al., 2019).
To this end, the present study aims to identify global age-friendly typologies, offering a deeper, more nuanced understanding of what constitutes an age-friendly city. We do this by leveraging a multi-site study from eight countries utilizing the AFCCQ (n = 4124). Through cluster analysis, we uncover typologies ultimately working towards the development of Artificial Intelligence (AI)-created personas inspired by Max Weber’s concept of the ideal type (Weber, 1904). These personas make it easier for researchers and policymakers to empathize with and understand the lived experiences of different identified groups and to highlight how different populations experience the age-friendliness of different cities, irrespective of their geographical location. Finding typologies that transcend countries and cultures could ultimately help advance the global age-friendly city movement, ensuring that urban environments are inclusive and supportive of older adults, thereby enhancing their quality of life.
Methods
The instrument
The AFCCQ is a self-assessment questionnaire designed to gauge how older adults perceive the age-friendliness of their cities. It consists of 23 items that span the eight domains of age-friendliness as defined by the WHO (2007, 2015), along with an additional domain focused on financial circumstances, which is recognized as a key indicator for age-friendly cities (Dikken et al., 2020; Van Hoof et al., 2024, 2026; WHO, 2015). Respondents provided their feedback using a 5-point Likert scale, ranging from “totally disagree” (−2) to “totally agree” (+2). Since the questionnaire seeks the views of older adults, negative scores are interpreted as dissatisfaction with certain aspects of their city’s age-friendliness, while positive scores reflect satisfaction. The AFCCQ demonstrated a high validity for a diverse group of countries (AboJabel et al., 2025; Ayalon et al., 2024; Barata et al., 2025; Bertani et al., 2025; Grenz et al., 2025; Ivan et al., 2024; Özer et al., 2023; Pavlovski et al., 2024; Perek-Białas et al., 2024; Piercy et al., 2025; Van Hoof et al., 2024; Wasserman et al., 2025; Yamada et al., 2023; Ziganshina et al., 2025). The cross-cultural validity of the AFCCQ now allows us to explore global age-friendly personas by pooling the data, enabling the identification of universal patterns and experiences across diverse contexts.
Population and data collection cross-cultural validation
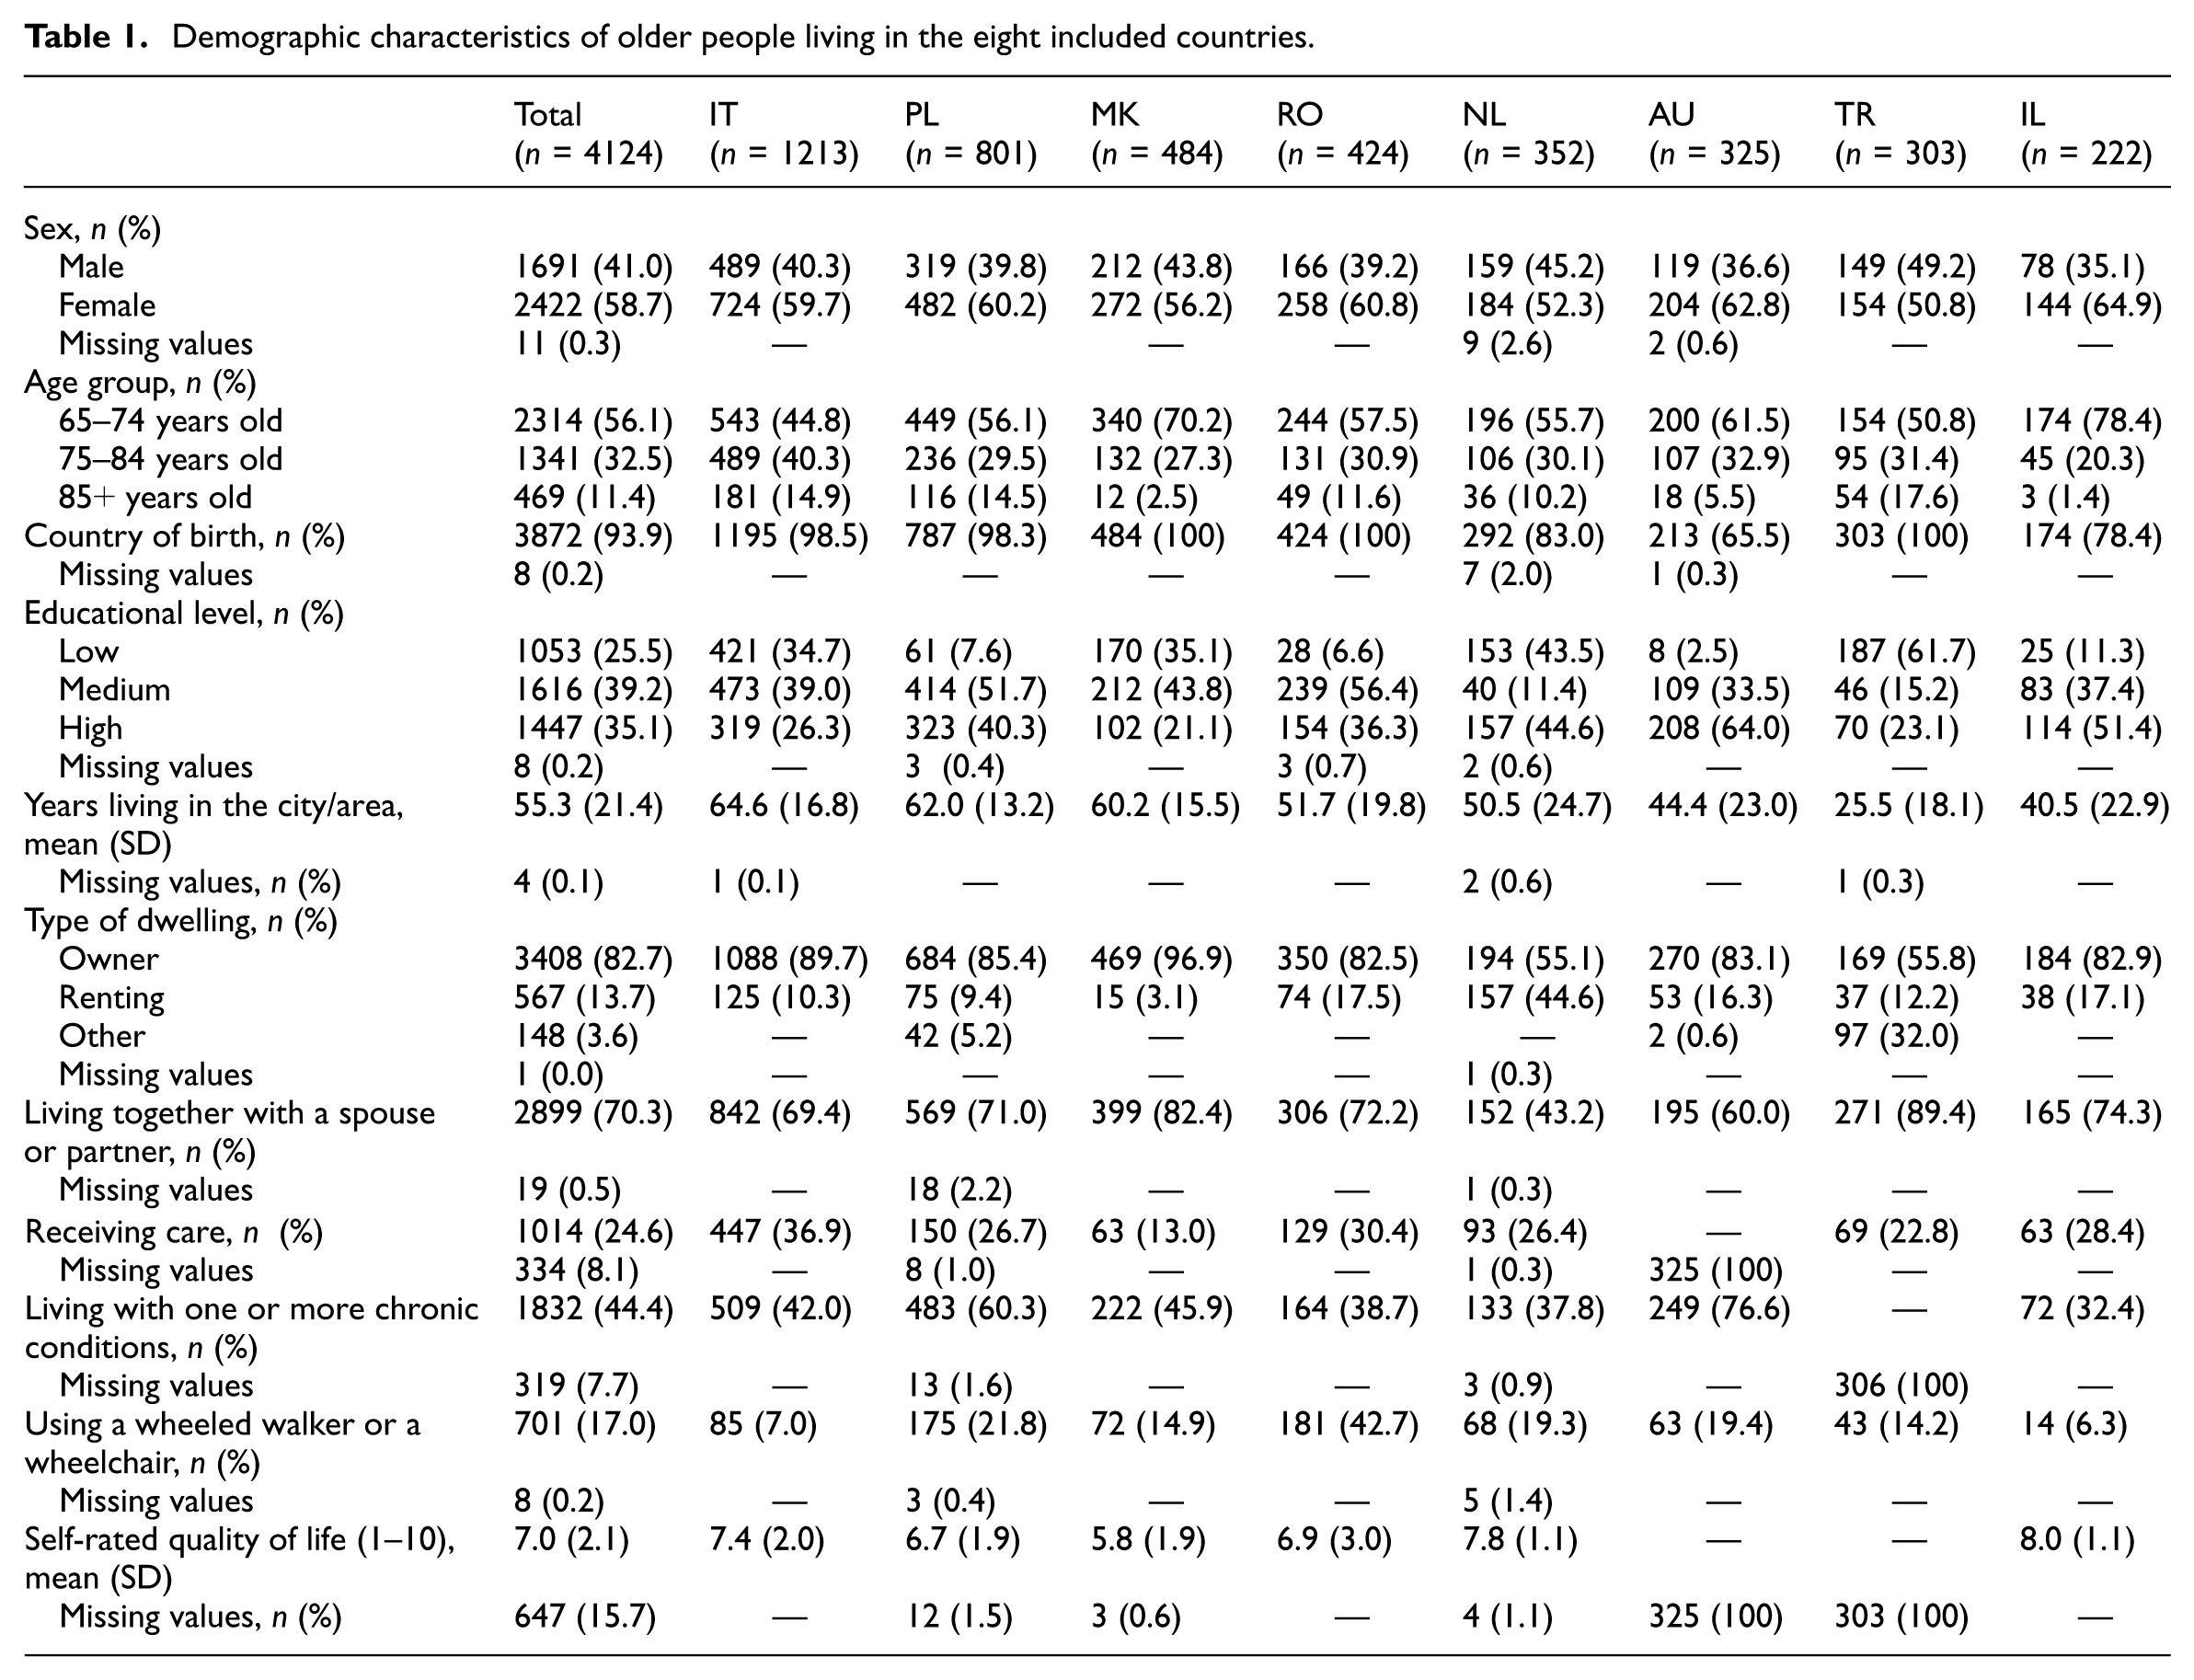
Data collection for the entire cross-cultural research project took place between September 2022 and December 2023. In total, 4124 participants residing in eight countries participated: the Netherlands (n = 352), Italy (n = 1213), Poland (n = 801), North Macedonia (n = 502), Romania (n = 424), Australia (n = 334), Turkey (n = 306), and Israel (n = 222; Table 1). The cross-cultural research project was approved by the Institutional Review Board of the authors’ institutions and was performed in line with the Declaration of Helsinki. Prior to data collection, a study protocol was shared ensuring that participant recruitment followed the same standardized procedures throughout the study. Participants were recruited by letter, online, telephone, or face to face, and informed about the goals of the study and the time needed to complete it (approximately 20 minutes). Informed consent was either obtained prior to study participation or assumed by filling out the survey forms.
Demographic characteristics of older people living in the eight included countries.
Clustering of the AFCCQ dataset
Cluster analysis was utilized to identify distinct global typologies among study participants. Two stages of cluster analysis were conducted following recommendations by Milligan and Sokol (1980). The normalized AFCCQ domains served as the basis for assessing similarity among participants. Agglomerative hierarchical cluster analysis was initially employed to determine the number of clusters using Ward’s (1963) method and squared Euclidean distance, being one of the better hierarchical methods (Blashfield, 1976; Hands and Everitt, 1987). Subsequently, the study sample was divided by country to validate the number of clusters and the Bonferroni test was conducted to assess the statistical significance of observed differences between clusters while controlling for Type I errors due to multiple testing (Holm, 1979).
Following the identification of stable clusters via hierarchical cluster analysis, k-means cluster analysis was performed for classification and interpretation based on AFCCQ domains. Demographic characteristics within each cluster were subsequently examined to develop comprehensive typologies. To ensure a robust and fair assessment of the demographic composition within each derived subgroup, a two-step normalization and correction process was applied. This method first calculates the ratio of representation (R):
Second, these ratios are re-normalized so that the ratios for all categories within a single variable (for instance, male versus female) sum up to 100%, generating the corrected percentage (CP). This eliminates the bias caused by the unequal distribution of categories in the total sample (N = 4124). The final corrected percentage is calculated using the following equation:

where total R is the sum of all R-values for the categories of that variable (i.e. total R =
For example, for sex in Cluster 1, 59.8% of respondents are female, whereas in the total sample 58.7% are female and 41.0% are male (40.2% male in Cluster 1). The corrected percentage for females in Cluster 1 is then calculated as:

The remaining 49.0% is attributed to males. Thus, although Cluster 1 is made up of 59.8% females in raw terms, the corrected percentage used for typology weighting is approximately 51.0%, which accounts for the baseline proportion of females (58.7%) in the total sample. All analyses were conducted using SPSS version 29.0 (IBM Corp, 2021).
Persona development using AI
The personas were generated using OpenAI’s GPT-4, an advanced natural language processing model (OpenAI, 2024). The process began with the preparation of input data, which included demographic information and domain-specific scores of each cluster. This data encompassed details such as age, sex, educational level, housing situation, living situation, health status, quality of life, and specific scores from the AFCCQ. The AI model then synthesized this input data to create semi-fictitious characters (personas) representing each cluster or typology. For each persona, the AI model generated detailed descriptions that included background, goals, challenges, behaviors, preferences, and quotes, accurately reflecting the experiences and perceptions of older adults in each cluster.
In addition to the textual data, images of the personas were also AI generated using the platform Imagine Art (Imagine Art, 2024). These images were created based on case information closest to the cluster center, ensuring visual representations that closely matched the demographic details of each persona. For example, the image for the North Macedonian male persona was generated using the prompt: portrait of a North Macedonian male of 84 years old. Very low education, living in Skopje for 70 years. He owns a home, has a wife, and does not receive care at home. However, he has chronic conditions. He scores his quality of life a low 5 (on a scale from 1 to 10).
Following the initial generation, the personas were reviewed and refined to ensure their accuracy and relevance. This refinement process included incorporating feedback from domain experts and stakeholders to enhance the authenticity and utility of the personas. For each persona, potential policy interventions were suggested based on the identified challenges and needs, aiming to improve the age-friendliness of urban environments and to enhance the quality of life for older adults in each cluster. A key strength of this approach is that AI can synthesize complex, multidimensional data into coherent and accessible narratives that support communication with policymakers and practitioners. At the same time, AI-generated personas are semi-fictitious and not statistically representative individuals; they may inadvertently reinforce stereotypes or reflect biases present in the underlying data and models, and therefore they require careful expert review and contextual interpretation. Ethical considerations, including transparency about the generative nature of the personas and caution in how realistically they are depicted and used, are essential to ensure that these tools support rather than distort the lived experiences of older adults.
The AI-generated personas, complete with visual representations, provide a detailed and nuanced understanding of the diverse experiences and needs of older adults in different clusters. By leveraging AI to synthesize large datasets, this method offers a robust framework for generating actionable personas that can guide policymakers in creating more age-friendly cities and communities.
Results
In total, 4124 participants above 65 years old residing in eight countries participated: Italy (n = 1213), Poland (n = 801), North Macedonia (n = 484), Romania (n = 424), the Netherlands (n = 352), Australia (n= 325), Turkey (n = 303), and Israel (n= 222; Table 1).
To identify the number of personas in the study sample, a cluster analysis was performed. A dendrogram generated from the clustering process suggested four or five meaningful clusters. To validate the solution, hierarchical cluster analysis was repeated for each country, showing possible cluster solutions between three and six clusters. The Bonferroni test revealed that all p-values were significant for the four-cluster solution, indicating significant differences between the clusters. For the five-cluster solution, only the domain of ‘Respect and social inclusion’ showed no significant difference between Clusters 1 and 2 (most negative clusters). Nonetheless, the five-cluster model was chosen because this solution provides more detailed and valuable information across the other eight domains, where distinctions were significant between all clusters. By opting for five clusters, we captured more nuanced variations and unique characteristics, enhancing the overall understanding and representation of the data. The additional cluster allows for a richer and more comprehensive analysis, outweighing the minor drawback of one non-significant domain between two specific clusters.
Figure 1 presents a heatmap with the scores for each cluster for the total AFCCQ score (ranging from -90 to +90) and across various domains of the AFCCQ (ranging from −10 to +10). Cluster 1, with the lowest AFCCQ total score of −31.79, indicates substantial challenges in age-friendliness across all domains, particularly in “Outdoor spaces and buildings” (−5.54), “Transportation” (−4.92), and “Financial situation” (−5.48), representing older adults who are significantly disadvantaged. Cluster 2, with an AFCCQ total score of −3.94, shows moderate challenges, especially in “Outdoor spaces and buildings” (−2.35) and “Financial situation” (−1.90), but with noticeable improvements in “Housing” (3.82), which is still only modestly positive. Cluster 3, with an AFCCQ total score of 18.40, indicates an overall neutral experience with a relatively strong score for “Housing” (5.19), but all other domains hover around neutrality and therefore require significant improvement. Cluster 4, with an AFCCQ total score of 39.00, shows positive experiences, particularly in “Housing” (6.63) and “Transportation” (5.24), though other domains still indicate room for further improvement. Cluster 5, with the highest AFCCQ total score of 64.80, represents the most favorable outcomes with positive scores across all domains, especially in “Housing” (9.16) and “Transportation” (8.54), exemplifying an ideal age-friendly city experience. These insights reveal a spectrum of age-friendliness experiences among older adults, from significant challenges to highly favorable conditions, underscoring the need for targeted interventions tailored to the specific needs of each cluster to enhance the overall age-friendliness of urban environments.
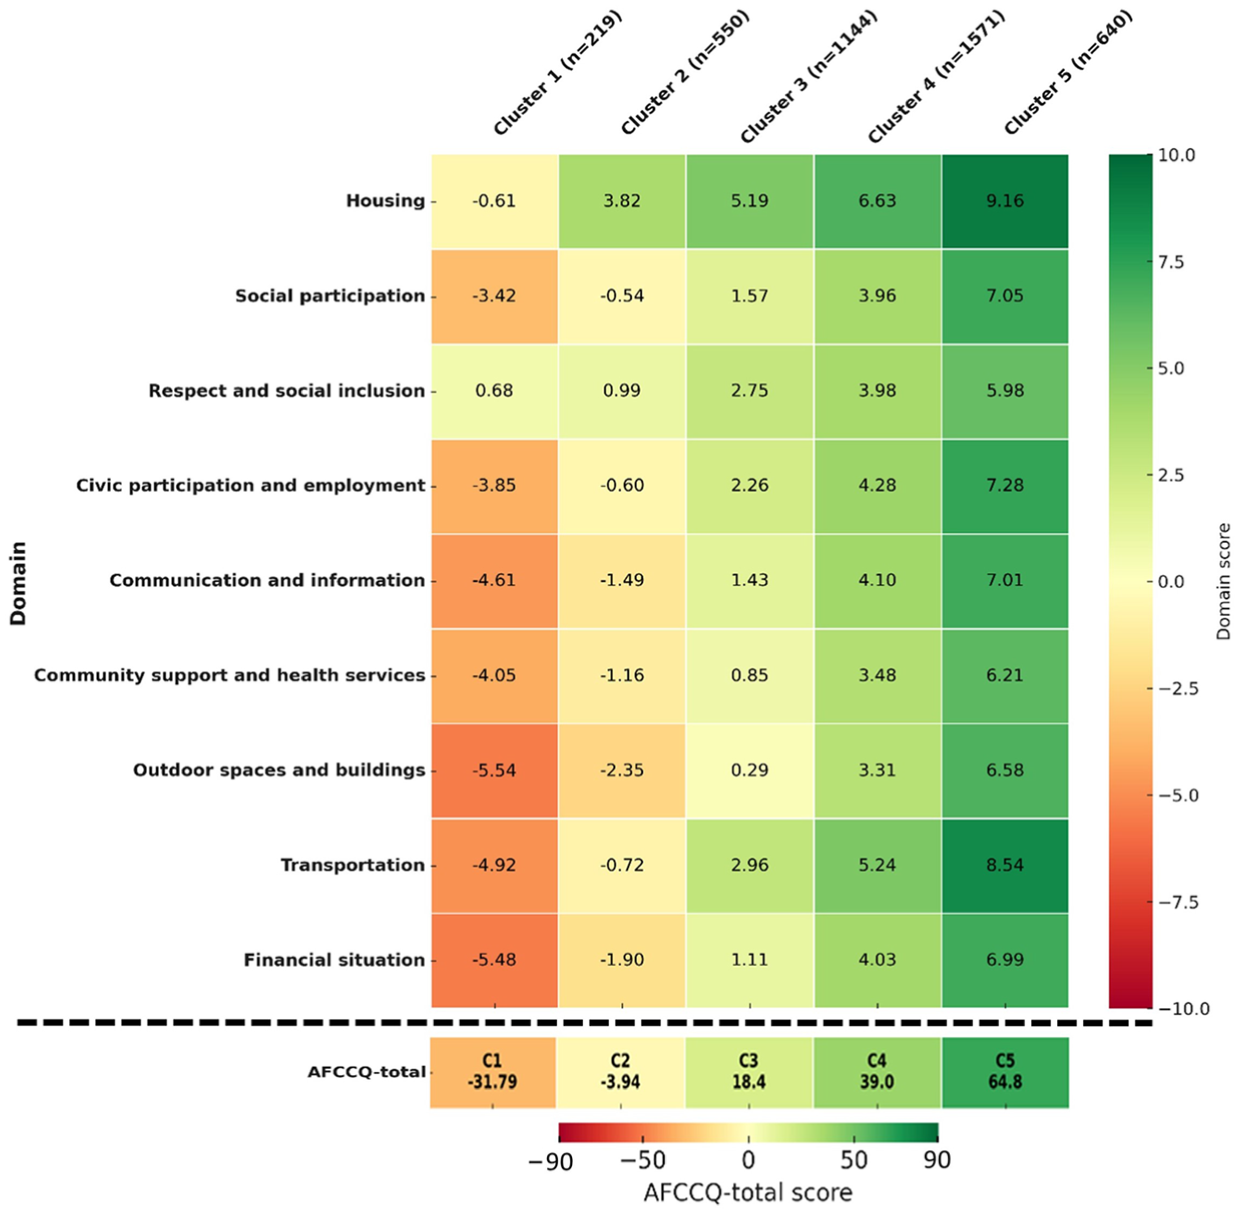
Heatmap of cluster scores across various domains of the Age-Friendly Cities and Communities Questionnaire (AFCCQ), ranging from dark red (negative) to dark green (positive).
Figure 2 presents the data in a different manner, highlighting different key insights. The overall trend indicates systematic differences in scores between clusters, with Clusters 4 and 5 generally scoring higher than Clusters 1–3, suggesting that certain consistent factors contribute to better scores across domains. Results show there is less variation in certain domains, such as “Respect and social inclusion” and “Housing.” This may imply these areas are more uniformly experienced across clusters and can, therefore, be addressed by policymakers with the same intervention, influencing the experiences of more than one cluster simultaneously. In contrast, domains like “Financial situation” and “Outdoor spaces and buildings” show larger differences between clusters, highlighting specific areas where targeted interventions might be necessary for distinctive clusters. This analysis underscores the significant disparities between clusters, which can guide resource allocation and interventions to support those most in need.
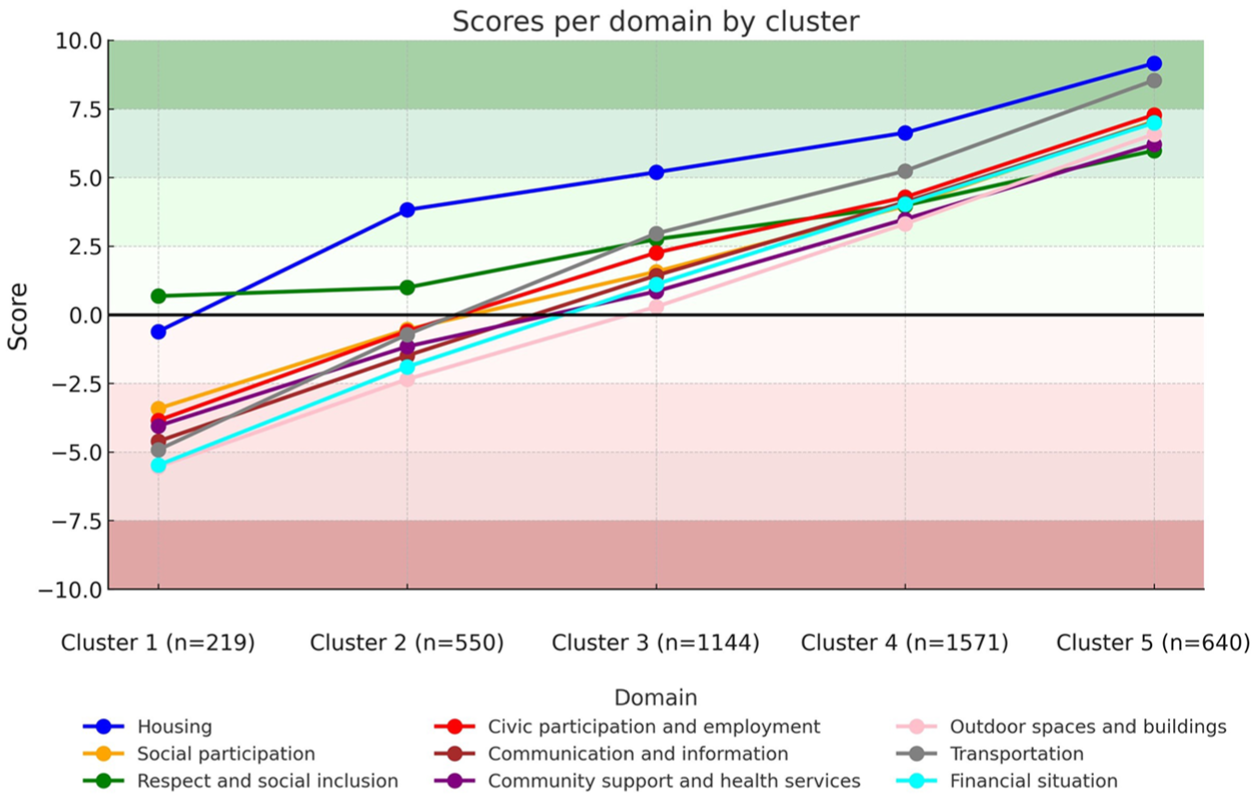
Scores per domain by cluster.
For further examination of cluster differences and similarities, demographic characteristics for each cluster were examined after normalizing the percentages of demographic variables. This approach allows for a fair assessment of the demographic composition within each cluster, accounting for the overall distribution of demographic variables across the dataset, and enables a fair comparison. When assessing differences between clusters on demographic characteristics, several trends can be observed (Table 2).
Proportion of characteristics within each cluster (% corrected for distribution in total sample).
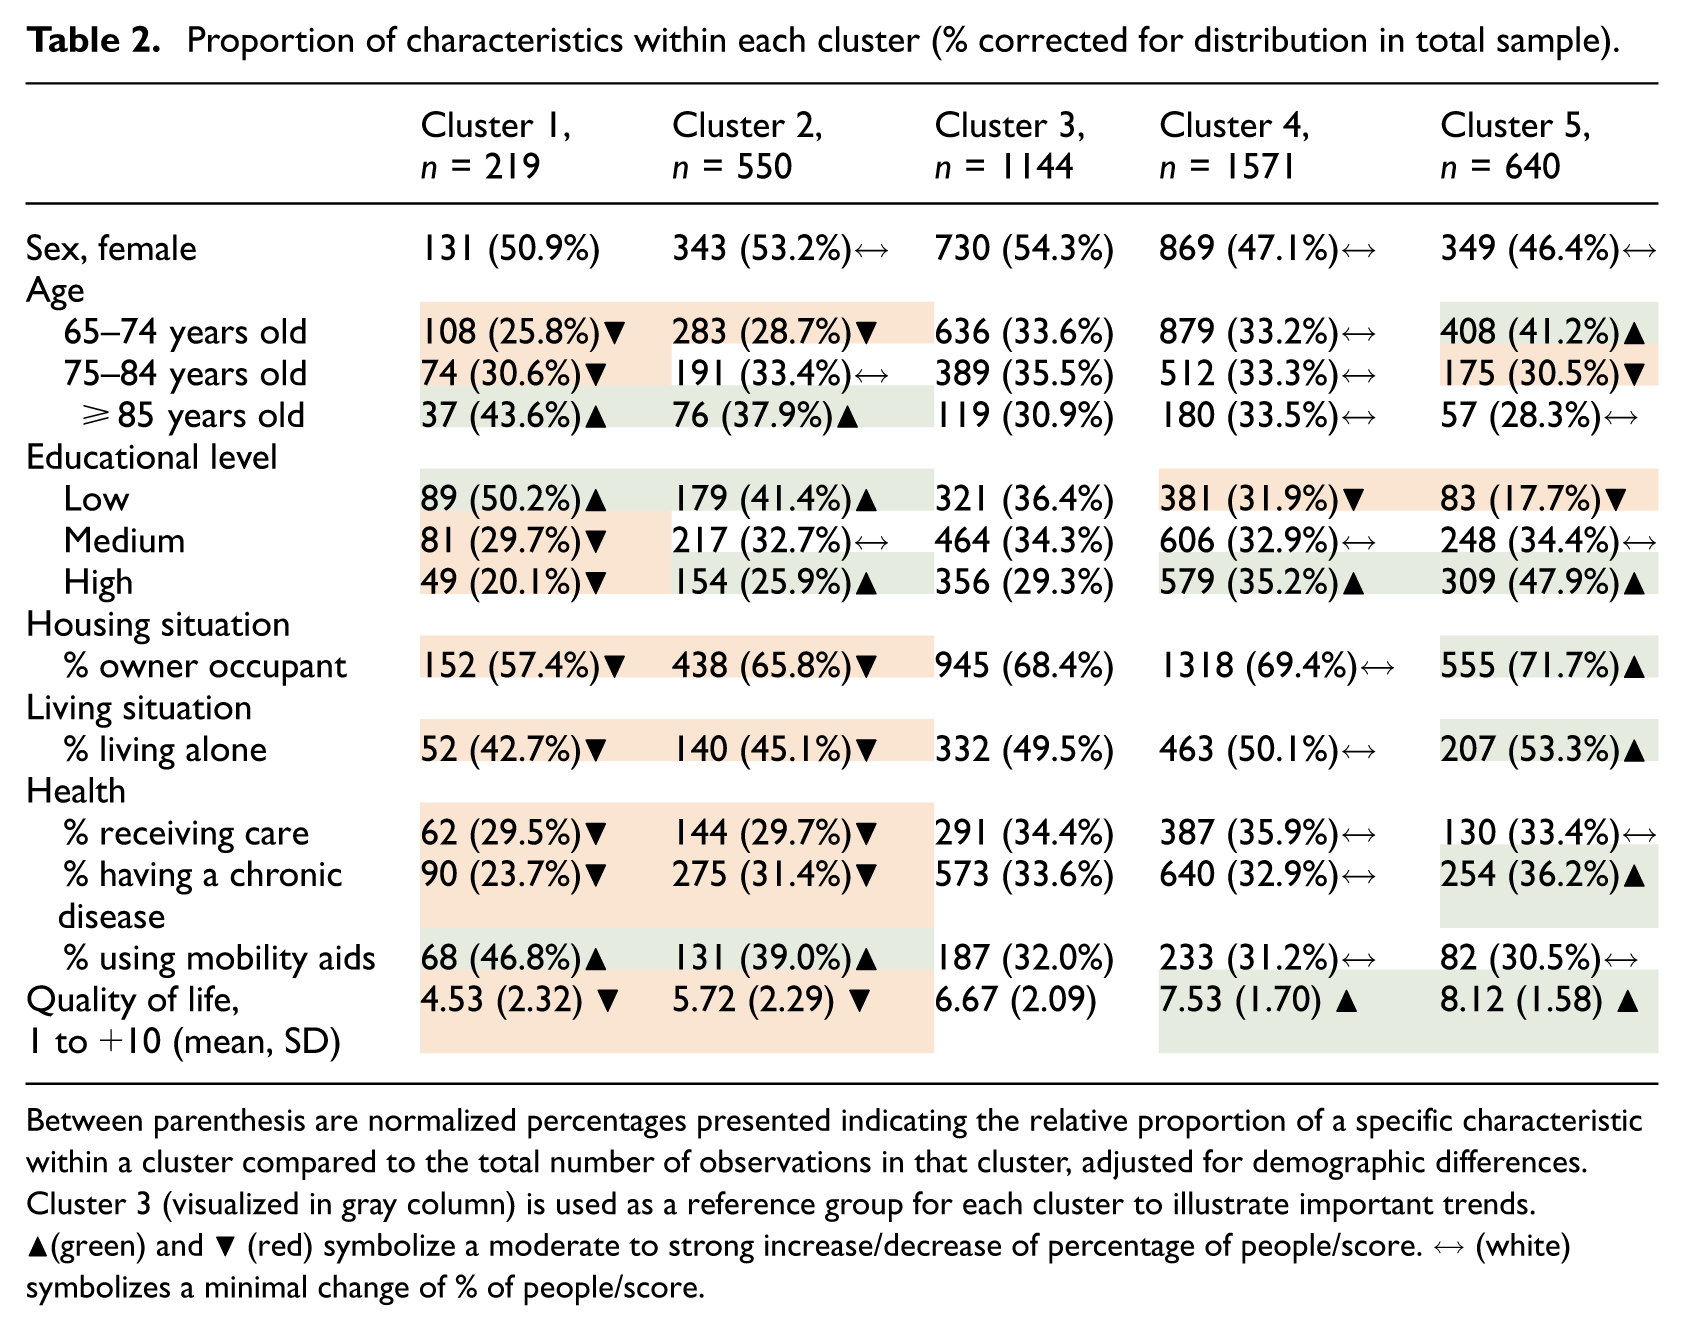
Between parenthesis are normalized percentages presented indicating the relative proportion of a specific characteristic within a cluster compared to the total number of observations in that cluster, adjusted for demographic differences. Cluster 3 (visualized in gray column) is used as a reference group for each cluster to illustrate important trends. ▲(green) and ▼ (red) symbolize a moderate to strong increase/decrease of percentage of people/score. ↔ (white) symbolizes a minimal change of % of people/score.
The proportion of individuals aged 65–74 years increases progressively from Cluster 1 (25.8%) to Cluster 5 (41.2%), indicating that clusters with positive views on the age-friendliness of their city consist of a relatively younger population. Educational levels also display significant trends. The percentage of individuals with lower educational levels decreases markedly from Cluster 1 (50.2%) to Cluster 5 (17.7%), while those with high educational levels increase from 20.1% in Cluster 1 to 47.9% in Cluster 5. This shift indicates that higher educational attainment is linked to more positive views on the age-friendliness of their city. Additionally, housing situations reflect a trend towards increased home ownership, with the percentage of owner-occupants rising steadily from 57.4% in Cluster 1 to 71.7% in Cluster 5, suggesting that stable and secure housing contributes to a more positive perception of age-friendliness. In terms of living situations, there is an upward trend in the proportion of individuals living alone, increasing from 42.7% in Cluster 1 to 53.3% in Cluster 5. Health metrics show mixed trends; the percentage of individuals receiving care remains relatively stable, while those with chronic diseases increase from 23.7% in Cluster 1 to 36.2% in Cluster 5, potentially explained by better access to healthcare, more health awareness, proactive health management, better healthcare utilization, and better insurance coverage. Interestingly, the use of mobility aids decreases from 46.8% in Cluster 1 to 30.5% in Cluster 5, suggesting better mobility and perhaps contributing to the more positive views on age-friendliness in Cluster 5. Finally, the self-rated quality-of-life scores demonstrate a significant improvement across the clusters, with the mean score rising from 4.53 (SD = 2.32) in Cluster 1 to 8.12 (SD = 1.58) in Cluster 5. This enhancement in self-rated quality of life aligns with the more positive perceptions of age-friendliness in later clusters. These findings highlight that the later clusters comprise a more educated, (financially) independent, and younger (healthier) population with higher self-rated quality of life and a more positive outlook on the age-friendliness of their environments.
Finally, Figure 3 demonstrates the actual distributions for each cluster, including the optimal threshold scores and standardized differences between clusters. Cluster 2 had significantly higher test scores than its reference group (Cluster 1); Cluster 3 had higher scores than Cluster 2; Cluster 4 had higher scores than Cluster 3; and Cluster 5 had significantly higher scores than Cluster 4 (all p < 0.001). The optimal threshold score between Clusters 1 and 2 was (−17.87), between Clusters 2 and 3 (7.23), between Clusters 3 and 4 (28.70), and between Clusters 4 and 5 (52.90), representing the score at which a shift occurs to a more (or less) favorably experienced age-friendly city cluster. The standardized differences between the five groups (Cohen’s d effect sizes) demonstrated large effect sizes for the AFCCQ between the different groups.
Actual distributions of AFCCQ total scores by cluster, threshold scores, and Cohen’s d.
From clusters to age-friendly personas
The study revealed five clusters, which can be described as personas and visualized using AI assistance, representing ideal types from different clusters, each reflecting distinct experiences and perceptions of age-friendliness. For Cluster 1, represented by relatively older Ivan Petrovski, the findings highlighted significant challenges, including low quality of life (4.53), limited mobility, and health issues. Policy interventions for this cluster should focus on improving outdoor spaces, enhancing transportation services, providing financial support, and boosting community support. Cluster 2, embodied by Hendrik de Vries, showed moderate challenges with a relatively moderate quality-of-life score of 5.72. Interventions here should enhance social participation, improve communication, upgrade outdoor spaces, and offer financial education programs. Fatma Yılmaz from Cluster 3 presents a mean quality-of-life score of 6.67, requiring strengthened community health services, promoted social inclusion, enhanced housing support, and improved transportation. Maria Rossi of Cluster 4 enjoys a relatively high quality of life (7.53) but still faces health issues and the need for balanced personal care. Policy recommendations for Maria include encouraging active aging, expanding health services, improving communication, and supporting civic participation. Finally, much younger and better educated Andrzej Kowalski from Cluster 5 represented the most favorable conditions, with a high self-rated quality-of-life score of 8.12. Best practices working for this cluster, including community programs and high-quality services, should be shared to improve age-friendliness in other population clusters. These personas, synthesized using AI, provide valuable insights into the diverse needs of older adults, guiding policymakers in creating more age-friendly urban environments (Table 3).
AI-generated personas reflecting the age-friendliness clusters.
Discussion and conclusions
By utilizing the AFCCQ, the first quantitative instrument capable of making cross-country comparisons on the experienced age-friendliness of cities, this research fosters international cooperation and highlights best practices to guide policymakers in developing and implementing effective policies in the field of urban planning and the creation of age-friendly environments (Chao, 2018; Drilling et al., 2025; Pozo Menéndez and Higueras Garciá, 2022). First and foremost, the findings show the heterogeneity among older citizens, and in their lived experiences in particular, which may have an impact on the way we design, build, and manage our cities and the wider built environment in which we live (Buitendijk et al., 2025). Additionally, findings provided valuable insights for scholars in fields such as gerontology, urbanism, geography, engineering, and social science, enhancing our understanding of local and universal urban dynamics and the socio-environmental factors that shape aging populations. The ways older people are able to navigate and enjoy outdoor spaces, building, and transportation are highly influenced by demographic and socio-economic realities (Buffel and Phillipson, 2024; Buffel et al., 2019; Gardiner and O’Brien Webb, 2023; Lane, 2019; Skinner et al., 2018; Yarker, 2022), and a better understanding of these underlying mechanisms may support policymakers, planners, and designers when developing more evidence-informed interventions (Van Hoof and Marston, 2025a). The results provide further corroboration that a “one-size-fits-all” approach when designing for older people may not be the way forward, whether it is age-friendly policies and action plans in the broadest sense of the word, or specific design features of outdoor spaces and urban planning. In this sense, the current study may help provide nuances for public debates concerning the design and planning for aging populations in cities, and change the overall narratives and discourse. Thereby, this research encourages interdisciplinary and transdisciplinary collaboration, transcending geographical and disciplinary boundaries to address the complexities of creating sustainable, age-friendly environments on a global scale (Appendix 1).
In this regard, it is worth noting that certain shared features appear across the sampled populations, with some typologies being more prevalent in some countries than in others. Results reveal that urban environments present a broad range of experienced age-friendliness by older adults, which is not strictly determined by geographical location. This is a strong indication that age-friendly policies and urban planning may require a more dedicated and nuanced approach, accounting for characteristics of the local populations of older citizens. On the one hand, there are older people who thrive and can navigate the urban landscape in relative ease, and on the other hand, there are older people who struggle to make ends meet, and appraise the experienced age-friendliness significantly lower in all its facets. And there are large groups in the middle who are managing, partly because of the quality of the urban landscape and the services provided. The five distinct clusters of older adults demonstrated significant differences in their experienced age-friendliness of cities and communities, ranging from having to cope with substantial challenges (Cluster 1) to living in highly favorable conditions in which people thrive (Cluster 5). Findings provide a comprehensive understanding of how different populations experience the age-friendliness of their cities, offering valuable insights for targeted interventions. For instance, some older people rely more on the use of public transportation or having access to shops and level access streets than others. Such findings provide necessary nuances for urban planners, including the realization that many older people can live a life in relative independence like younger generations. Taking a spatial justice lens (Buffel et al., 2024), planners and designers may come to the realization that equitable age-friendly communities may require design solutions that benefit people from all generations who require some form of support or assistance, regardless of chronological age (Marston et al., 2024).
The identification of the universal clusters is crucial as it allows for a more nuanced understanding of the challenges and advantages faced by older adults in different contexts. Notably, the positive correlation between higher educational levels, home ownership, and better quality of life with more favorable perceptions of age-friendliness suggests that socio-economic factors significantly influence how older adults interact with their urban environments. This correlation emphasizes the need for holistic approaches in policymaking that address these socio-economic disparities to improve the quality of life for older adults universally. In this context, financial security is particularly salient and may warrant a dual conceptualization in future research (Van Hoof and Marston, 2025b): both as a perceived domain of age-friendliness and as an external predictor or moderator of age-friendly outcomes (Van Hoof et al., 2026).
Further research could be conducted to provide deeper analyses at the individual level, focusing on subpopulations, both within and across countries, to better inform policymaking on national and global scales. Also, a further refinement of the typologies and personas could be made using data from countries which have recently validated the AFCCQ, including Germany (Grenz et al., 2025), Portugal (Barata et al., 2025), New Zealand (Piercy et al., 2025), and Arabic-speaking communities in Israel (AboJabel et al., 2025), to name a few. An important area, which was not fully captured in this study, is the role of social ties and relationships, such as family networks, which often provide critical support that public institutions may not offer (Douglas et al., 2016; Shankar et al., 2014). These informal support systems, particularly in regions where public services are limited, play a crucial role in shaping older adults’ experiences of age-friendliness. Incorporating data on social relationships and informal support structures in future research will provide a more holistic understanding of age-friendliness, ensuring that policies can better address both formal and informal support systems that impact the quality of life for older adults.
Moreover, addressing these gaps in understanding will not only improve policy outcomes but also help prevent broader social issues, such as the pauperization of urban spaces and the marginalization of older adults within them. Spatial and temporal diversification of poverty in cities means that selected parts of a city may be perceived by the residents as unfavorable places to live (Świąder et al. 2016). This is a crucial element of aging well, as growing impoverishment leads, in the long term, to social exclusion and social isolation (Liu et al., 2008) which impact the WHO’s domain of “Respect and social inclusion.” That is why a better understanding of social typologies can be an important metric, informing local authorities about potential challenges and actions that should be undertaken to prevent unfavorable long-term impacts. Fortunately, cities are not left to find their own solutions. As in this research, universal typologies of older people have been identified despite geographical location, and thus it is possible to transfer knowledge between cities so that they can exchange best practices (Bański, 2024), as seen in the WHO’s Global Network for Age-Friendly Cities and Communities. Members of this network could use the AFCCQ to better understand the distribution of typologies across their cities, regions, or nations, and to help target gaps in policy and practice. In regards to this network, it is again important to note that older people are not a homogeneous group, not within a given (member) city, within a given (member) country, and even when comparing older people across borders. This may also be taken as a stark warning for the WHO and the Global Network for Age-Friendly Cities and Communities alike that it is important to consider these significant differences in needs and conditions among older people when interpreting the notions laid out in the document Global Age-Friendly Cities: A Guide (WHO, 2007) and its accompanying checklist. The current findings may even offer compelling evidence that warrants an overhaul of the eight topic areas and their operationalization in the WHO’s checklist (Van Hoof and Marston, 2025b).
The methodology employed, particularly the use of hierarchical cluster analysis and the AFCCQ as an instrument, proved effective in uncovering meaningful typologies of age-friendliness across diverse geographical contexts. The choice of the five-cluster solution, despite one non-significant domain between two clusters, enhanced the granularity and richness of the data, providing deeper insights into the various dimensions of age-friendliness. Additionally, normalizing demographic variables ensured a fair comparison across the clusters. This is the first study making comparisons between countries on a global level, and now future research should consider longitudinal designs to monitor the developments in age-friendliness over time. Moreover, such research should gather and combine more qualitative data to capture the lived experiences of older adults in greater depth. In line with the WHO’s five-year evaluation cycle for age-friendly cities and communities, future studies could benefit from aligning with this framework, allowing for periodic assessments and adaptations to better monitor progress and address emerging challenges within cities over time.
One of the key strengths of this study lies in the establishment of an international collaboration, which enabled consistent data collection across multiple countries. This consortium-based approach, while being challenging due to the time and effort required to build these networks, ensured that data were gathered in a harmonized and systematic way, contributing to the methodological rigor of this cross-cultural research. Such efforts are rarely undertaken, as they require extensive coordination and agreement on variables, which makes this study particularly valuable (Davidov et al., 2018). Moreover, the creation of this network and the collaborative process itself is a direct contribution to the age-friendly movement, aligning with the WHO’s vision of fostering shared learning and mutual support across cities and communities. While the study presents significant strengths, including a large, diverse sample and robust analytical methods, there are also limitations to consider. The cross-sectional nature of the study limits the ability to infer causality (Spector, 2019). Additionally, the reliance on self-reported data could introduce bias. A further limitation concerns the typologies and personas. These are primarily based on demographic characteristics (for instance, education, sex/gender, care needs, self-rated quality of life, living alone, etc.) and self-reported domain scores, and may, therefore, underestimate the moderating role of informal support in how these domains are experienced. However, the study’s strengths, such as the comprehensive and systematic approach to identifying global typologies and the innovative use of personas, outweigh these limitations. Findings provide a solid foundation for future research and policy development, highlighting the importance of considering the diverse and nuanced experiences of older adults in the pursuit of more age-friendly cities globally. Moreover, findings from this study can be instrumental for policymakers aiming to enhance age-friendliness in urban settings. By identifying specific clusters with distinct needs and challenges, policymakers can tailor interventions more effectively. For instance, cities with a higher proportion of Cluster 1 individuals might focus on improving transportation and financial support, whereas those with more individuals in Cluster 5 can aim to sustain and share their best practices. Also, domains demonstrating smaller differences (such as Respect and social inclusion) ask for uniform interventions, which all clusters will benefit from.
Personas are widely used in fields like marketing and user experience design, but their application in science and public policy is relatively new and potentially transformative (De Heredia et al., 2018; Hsu et al., 2024; Salminen et al., 2018). These semi-fictitious characters, based on real data, encapsulate the experiences, needs, and behaviors of specific population groups. Personas derived from clustered data offer a powerful way to communicate complex information in an accessible and relatable format, fostering empathy and understanding among stakeholders, and supporting the design of more targeted, impactful policies. This study shows how presenting data through personas help to humanize complex statistics and by doing so help researchers and policymakers better empathize with and understand the lived experiences of various demographic groups. In the context of aging populations, for example, personas can vividly illustrate the daily challenges and aspirations of older adults, providing a nuanced perspective that might be missed in purely numerical analyses. By offering visualization of clusters, designing and implementing interventions can be more effective and tailored. Policymakers can identify specific needs and preferences at the short (direct action) or longer term (preventive) within different segments of the population, ensuring resources are allocated efficiently and interventions are more impactful. Moreover, clusters and derived personas foster interdisciplinary collaboration by providing a common framework easily understood across various fields, integrating insights from public health, urban planning, social services, and other disciplines to create holistic strategies. Presenting data this way enhances communication of research findings and policy recommendations, making abstract data more tangible and accessible to a broader audience. As the use of personas becomes more integrated into scientific research and policymaking, it could potentially transform how complex social issues are addressed, encouraging a more nuanced and empathetic understanding of diverse populations and leading to more inclusive and effective outcomes.
Ultimately, the future of age-friendly cities depends not just on innovative tools like the AFCCQ but also on our collective willingness to transform insights into action. By embracing both the data-driven personas and the lived experiences of older adults, we can build urban environments that truly reflect their needs—ensuring that no one is left behind as we shape more inclusive and resilient cities and communities for all generations (regardless of age) to come.
Footnotes
Appendix
Normalized AFCCQ scores per domain per country (ranging from −10 to +10), mean (SD).
| Netherlands | Italy | Poland | North Macedonia | Romania | Australia | Turkey | Israel | |
|---|---|---|---|---|---|---|---|---|
| Housing | 6.8 (3.9) | 5.7 (3.0) | 6.8 (3.6) | 6.2 (3.9) | 4.7 (3.8) | 7.4 (3.3) | 1.5 (4.8) | 6.5 (4.1) |
| (+) | (+++) | (+++) | (+++) | (++) | (+++) | (+) | (+++) | |
| Social participation | 2.5 (4.0) | 2.5 (3.8) | 3.6 (3.8) | 1.7 (3.7) | 3.6 (3.8) | 3.4 (4.0) | 0.3 (4.5) | 4.5 (3.8) |
| (++) | (++) | (++) | (+) | (++) | (++) | (+) | (++) | |
| Respect and social inclusion | 6.2 (4.0) | 5.9 (3.5) | 5.2 (4.9) | 1.4 (5.7) | −1.6 (5.3) | 0.9 (5.2) | 0.3 (4.7) | −0.1 (4.4) |
| (+++) | (+++) | (+++) | (+) | (−) | (+) | (+) | (−) | |
| Civic participation and employment | 3.7 (3.8) | 3.6 (3.4) | 4.1 (4.1) | 1.9 (4.5) | 2.0 (4.7) | 2.2 (4.5) | 0.7 (4.4) | 4.3 (3.7) |
| (++) | (++) | (++) | (+) | (+) | (+) | (+) | (++) | |
| Communication and information | 3.8 (3.8) | 1.9 (4.4) | 3.6 (4.6) | 0.5 (5.1) | 1.9 (5.3) | 4.5 (3.9) | 1.1 (5.0) | 5.1 (4.2) |
| (++) | (+) | (++) | (+) | (+) | (++) | (+) | (+++) | |
| Community support and health services | 2.6 (3.2) | 1.0 (4.0) | 3.6 (3.6) | 0.9 (3.9) | 3.2 (4.7) | 2.3 (3.8) | 1.8 (4.8) | 2.4 (3.6) |
| (++) | (+) | (++) | (+) | (++) | (+) | (+) | (+) | |
| Outdoor spaces and buildings | 2.0 (4.3) | 1.4 (4.7) | 3.5 (4.4) | −1.2 (5.6) | 3.0 (4.7) | 1.8 (4.6) | 1.0 (5.1) | 1.5 (4.8) |
| (+) | (+) | (++) | (−) | (++) | (+) | (+) | (+) | |
| Transportation | 4.3 (4.5) | 3.9 (4.4) | 5.6 (4.1) | 2.3 (5.6) | 2.6 (5.2) | 3.6 (5.2) | 0.9 (5.2) | 4.3 (4.9) |
| (++) | (++) | (+++) | (+) | (++) | (++) | (+) | (++) | |
| Financial situation | 3.9 (4.8) | 2.8 (4.5) | 2.0 (5.4) | 1.3 (5.6) | 0.9 (6.6) | 3.2 (5.2) | 1.5 (4.9) | 3.8 (4.9) |
| (++) | (++) | (+) | (+) | (+) | (++) | (+) | (++) |
The colored zones represent how dissatisfied or satisfied older people are regarding the city in general or regarding a specific domain. Colors are based on the method presented by Dikken et al. (2020).
Acknowledgements
The older people and experts of the face and content validity and the respondents of the surveys in all participating countries are thanked for their contribution. Lilian Bosten and Fabian van Schetsen of Dimensus, and Ingrid Meijering of GetOud, are thanked for their role in data collection in The Hague. Ceronne Kastelein of the municipality of The Hague is thanked for her role in the data processing agreement. Elena Zenga of the municipality of Verona, Dario Zoli of the municipality of Venice, and Girolamo D’Anneo of the municipality of Palermo are thanked for their precious help in data collection for the Italian sample. Elisabeta Bajrami Ollogu is thanked for her role in data collection for the Albanian sample in Skopje. From Bucharest, we thank George Tudorie for the help in the dissemination of information. From Kraków, Paulina Skórska, Milena Maj, Natalia Krygowska-Nowak, and Aleksandra Trybalska are thanked, as well as Anna Okońska-Walkowicz and Bożena Opach of gmina Kraków. Kamila Polańska, Robert Pawliszko, and Jarosław Bałuka of gmina Wrocław are thanked too. The Polish research company Realizacja, Romanian research company Cult Market Research, and Israeli research company iPanel are thanked for their role in the data collection. The Office for Ageing Well at the South Australian Department for Health and Wellbeing, Romy Wasserman, and Veronica Soebarto are thanked for their role in supporting data collection in Australia. Gülcan Bahcecioğlu Turan and Neslihan Teke are thanked for their role in the collection and analysis of the Turkish data.
ORCID iDs
Funding
The authors disclosed receipt of the following financial support for the research, authorship, and/or publication of this article: This research is a deliverable of the project City&Co: Older Adults Co-Creating a Sustainable Age-friendly City (JPI project number 99950200). This project was funded by the Taskforce for Applied Research (UTC.01.1), the National Science Centre (UMO-2021/03/Y/HS6/00213), and the Executive Agency for Higher Education, Research, Development and Innovation Funding (UEFISCDI; Contract no: 298/2022), as part of ERA-NET Cofund Urban Transformation Capacities (ENUTC), co-funded by the European Union’s Horizon 2020 research and innovation program under grant agreement no. 101003758. The collaboration with North Macedonia was initiated through the COST Action CA1936 “International Interdisciplinary Network on Smart Healthy Age-friendly Environments (NET4Age Friendly),” which is supported by COST (European Cooperation in Science and Technology). This COST Action supported Prof. Daniel Pavlovski with an STSM grant E-COST-GRANT-CA19136-16362332. The data collection in Israel was funded by the Research Group of Ageing of The Hague University of Applied Sciences. The data collection in Italy was funded by the project Next Generation EU—“Age-It—Ageing Well in an Ageing Society” project (PE0000015) of the National Recovery and Resilience Plan (NRRP)—PE8-Mission 4, C2, Intervention 1.3. The data collection in Australia was funded by the University of South Australia with support from the South Australian Office for Ageing Well.
Declaration of conflicting interests
The authors declared no potential conflicts of interest with respect to the research, authorship, and/or publication of this article.
Data availability statement
The data and supporting files are available upon request.