
Abstract
The large-scale transformation of the housing stock towards net-zero energy has already mobilised substantial public and private investment and is set to accelerate in the coming decades. While many studies examine the effects of decarbonisation on rents and prices, less is known about cost-reducing benefits for households, how these gains are distributed across tenures and whether they ultimately improve affordability. These distributional questions are particularly salient in Western Europe where persistent unaffordability cleavages between homeowners and renters exist. This article investigates the impact of decarbonisation on housing costs across tenures. The analysis draws on registry data from Dutch households between 2018 and 2023, employing heating degree day-adjusted gas consumption as a proxy for decarbonisation. To estimate the impact of decarbonisation on costs, the article combines a matching procedure with a staggered diff-in-diffs design, followed by a series of distributional measures. Across these indicators, outright owners exhibit the largest relative reductions in housing costs, mortgagors the largest absolute reductions, private renters the smallest reductions, and social renters are in an intermediate position. These findings, when understood within the context of current decarbonisation policies, comprising subsidies for homeowners and cost-neutrality measures for tenants, point to the entrenchment of current unaffordability cleavages.
Introduction
Across Europe, the large-scale transformation of the housing stock to reduce energy demand and achieve net-zero has become central to various policy arenas. The push for higher energy efficiency has been directly driven by the Energy Efficiency (EU/2023/1791) and Energy Performance of Buildings Directives (EU/2024/1275) but also indirectly through disclosure requirements for financial institutions and investors through the Taxonomy Regulation 2019/2088 and the Sustainability-Related Disclosure Regulation 2022/1288. As a result, decarbonisation is reshaping European property markets. On the one hand, higher energy efficiency is well documented to both increase property values and command a rental premium (Aydin et al., 2020; Fuerst et al., 2020). On the other hand, properties lagging behind in quality, such as those non-compliant with minimum energy performance standards, have seen a decline in value (Ferentinos et al., 2021).
However, less is known about how energy efficiency may impact the distribution of housing costs and housing inequalities across tenures. This is a pressing question given the existing cleavages in costs between owners and renters (Arundel and Ronald, 2021). Furthermore, the effects of other environmental policies aiming to reduce energy consumption have often proven regressive. For example, the Dutch carbon pricing scheme has disproportionately impacted lower-income groups (Maier and Ricci, 2024). Similarly, the planned expansion of the European Union (EU) Emissions Trading Scheme to include buildings is anticipated to have regressive consequences (Maier et al., 2024). This regressive impact is especially pronounced because lower-income households allocate a larger share of their income to consumption, and much of this expenditure is concentrated in carbon-intensive goods such as residential energy.
When it comes to housing renovation, researchers have often focused on energy savings as the main component of housing costs affected by changes in energy efficiency. For example, in a recent study of renovation in the Netherlands, Kattenberg et al. (2024) find that increased housing insulation reduces gas consumption by about 20%, on average, both for owner-occupied and rental homes. A different study by Van Den Brom et al. (2019), also in the Netherlands, finds that in social housing, household composition and income play a role in the reduction of energy consumption post-renovation. In short, the literature has primarily examined the determinants of energy savings, while the distributional consequences for housing affordability across tenure have been less explored.
Conversely, the role of the housing market in shaping social and economic inequalities is well documented. For instance, the private rental sector has been characterised as a vehicle for wealth accumulation for landlords, typically high-income households, while putting a strain on private renters (Hochstenbach, 2024). It is this marked division between renters and owners that justifies the study of the distributional impacts of housing renovation as they have the potential to entrench or alleviate systemic housing unaffordability.
Traditional measures of housing affordability typically use a static ratio of housing costs to income (Haffner and Hulse, 2021). Although variations of this ratio exist, incorporating factors such as transport costs and energy (Haffner and Boumeester, 2015), these metrics remain point-in-time statistics and offer limited control options on variations regarding housing and energy consumption. Consequently, they fall short in assessing the impact of decarbonisation on housing costs across households with heterogeneous and evolving characteristics. In response, researchers have drawn from longitudinal and household-level micro datasets to introduce more nuanced measures of the relation between housing consumption and income. Ben-Shahar et al. (2019) proposed a new affordability measure that draws from microdata to adjust housing consumption by minimum standards. Longitudinal data has also been used to explore the drivers of housing costs, revealing socio-economic differences between households with temporary versus persistent affordability issues (Baker et al., 2015). In contrast to static ratio-based indicators, longitudinal approaches reveal how housing cost trajectories differ across households, particularly when it comes to the influence of income on tenure outcomes (Kim and Kang, 2024).
Building on longitudinal studies of housing affordability and the policy evaluation literature, this article employs a staggered diff-in-diffs approach to analyse changes in housing costs related to decarbonisation across tenures. This approach builds on the comparison of housing costs from decarbonised households before and after decarbonisation against a control group. In this study, decarbonisation is operationalised through a consistent reduction in gas consumption adjusted by heating degree days, which serves as a proxy for energy-efficiency improvements. A key limitation of this approach is the absence of information about the exact interventions undertaken by households. However, the aim of this article is not to identify the effects of specific interventions on gas consumption but rather to examine how decarbonisation, broadly understood as a reduction in gas use, affects housing costs and affordability across tenures. By adopting this perspective, this article provides a longitudinal and comparative account of how the energy transition interacts with housing costs.
The central question guiding the analysis is how decarbonisation influences housing costs across tenures. The Dutch case provides a particularly relevant setting for this investigation: unaffordability is persistent, tenure divides are pronounced and the reduction of domestic gas consumption is a priority in the national decarbonisation strategy (Rijksoverheid, 2019). In addition, the availability of comprehensive registry data, covering all households and including a wide range of social and economic variables, makes it possible to construct robust comparisons between decarbonised households through suitable control groups. This setting provides the basis to assess how decarbonisation shapes housing costs over time. In doing so, the article contributes new evidence on the distributional consequences of the energy transition for housing affordability.
In the next section, this article delves into different approaches to measuring housing costs and posits the need to identify and assess changes in housing costs as decarbonisation progresses. The third section presents the methodology which draws from quasi-experimental designs as well as introducing the dataset and preprocessing approach. The fourth section presents the main research results, while the fifth focuses on the distributional effects across households and discusses policy relevance and limitations. The sixth section concludes.
Measuring housing costs
The measuring of housing affordability has long been central to debates on housing costs and consumption. A common approach is the ratio of housing costs to income (Haffner and Boumeester, 2015; Quigley and Raphael, 2004), often operationalised with a 0.4 threshold to identify those overburdened by housing costs. Albeit widely adopted, this indicator has been criticised for its arbitrariness and inability to capture broader financial dimensions of housing. For instance, this ratio does not account for changes in housing’s underlying value as an asset, which are central to the real costs of homeownership. To address this, Poterba (1984) introduced the concept of user costs to the field of housing, which shifts the focus from immediate cash outflows to the long-term financial implications of owning an asset. This framework has since informed studies on housing inequality, asset accumulation and homeownership taxation (Fatica and Prammer, 2018).
Another critique highlights that the cost-to-income ratio implicitly accepts the existing income distribution and ignores households’ ability to purchase non-housing goods (Whitehead, 1991). In response, Stone (2006) proposes the residual income approach, which defines affordability in terms of whether households retain sufficient income for other essentials after paying for housing. The issue is further complicated by differences in housing consumption across income groups: lower-income households tend to under-consume, while higher-income households may over-consume. Thalmann (1999) argues that this raises important questions about whether affordability problems are primarily caused by low incomes or by high housing costs. Building on this line of inquiry, Ben-Shahar et al. (2019) propose a consumption-adjusted approach that imputes expected housing consumption across households, showing how hidden inequalities in costs emerge once differences in consumption are taken into account. Further work (Ben-Shahar and Warszawski, 2016) extends this framework defining housing consumption through the number of rooms, showing how households with similar incomes may nevertheless face very different cost burdens depending on their housing consumption choices.
Historical perspectives also reinforce the relevance of adjusting for consumption and housing quality. Eichholtz et al. (2022) demonstrate that improvements in housing quality and size were often accompanied by widening disparities in affordability, a trend that persisted until the introduction of rent controls and social housing provision in the 20th century. This suggests that policy design has historically shaped not only the level but also the distribution of housing consumption and costs. Similarly, Whitehead (1991) highlights how building standards, one of the first forms of state intervention in housing, indirectly influence costs by setting minimum quality thresholds. In the current context of climate change and energy crises, energy efficiency standards represent the new frontier of state-led intervention. Empirical evidence shows that such standards affect property values, reducing those of non-compliant dwellings (Ferentinos et al., 2021) and increasing those of compliant ones (Aydin et al., 2020). More recently, simulation studies also suggest that decarbonisation policies such as taxation and subsidisation of housing renovation may have different distributional impacts on housing costs as homeowners benefit from property appreciation (Fernández et al., 2024). Together, these contributions highlight how both measurement approaches and regulatory standards shape our understanding of housing consumption, costs and their distribution.
Empirical studies on the impact of housing renovation have tended to focus on the reduction of energy costs. Metcalf and Hassett (1999) investigate the return of insulation measures through energy bills data and point to a performance gap between expected and actual energy consumption deterring household investment. Allcott and Greenstone (2024) also use energy savings data and the mismatch between predictions and actual savings to argue for the introduction of energy taxation instead of subsidisation to achieve social optimums. Similar studies disentangle the impact that different strategies may have on final energy consumption (Hong et al., 2006; Liang et al., 2018). In the Netherlands, Kattenberg et al. (2024) find that improving housing insulation leads to an average reduction in gas usage of approximately 20% for both owner-occupied and rental properties. Also in the Netherlands, Van Den Brom et al. (2019) draw from a large panel dataset to investigate the drivers of heterogeneous reductions in energy savings among social housing tenants, pointing out that income and household composition play an important role in energy savings. Finally, Roberdel et al. (2024) evaluate a large Dutch insulation programme and show that while retrofits reduce gas, poorer households realise significantly lower savings due to improvements in comfort.
These studies of housing renovation tend to draw conclusions from datasets about particular policies or renovation projects. As a result, the identification of the impact of specific interventions is especially robust, however, the broader impact that decarbonisation may be having on housing cost inequalities remains underexplored. Burlinson et al. (2018) make an important contribution with regards to this by explicitly linking housing costs and energy costs in the measurement of fuel poverty and energy underconsumption. Their framework shows that housing-induced poverty and fuel-induced poverty interact to shape household vulnerability, highlighting that affordability outcomes cannot be understood through energy efficiency alone but must also account for the broader housing cost burden.
In contrast to studies focused on energy consumption, research on housing costs and affordability tends to rely on large survey or registry datasets that comprise or are representative of state-wide populations. These micro datasets have opened up questions regarding the drivers of housing cost and affordability. Baker et al. (2015) leverage this type of data to investigate the socioeconomic differences between households experiencing occasional versus persistent housing affordability issues. They argue that longitudinal data offers more insight about housing unaffordability patterns than point-in-time measures which do not account for evolving patterns among those experiencing housing unaffordability. Also, Coulter and Kuleszo (2024) draw on panel data to study entrance into homeownership and find that younger cohorts are delayed compared to older ones. In turn, using US panel data, Kang (2023) finds that the severity of a household’s housing instability, characterised by frequent, involuntary moves or living in unaffordable or substandard conditions, extends instability over time. Kim and Kang (2024) have also drawn from longitudinal data to show how the interlock of household income and tenure choices heightens the probability of experiencing housing unaffordability. These articles emphasise the importance of understanding how housing costs are unequally distributed, with lower-income households often spending a significantly higher proportion of their income on housing.
This article addresses the gap between energy consumption studies, which provide precise intervention-level evidence, and affordability ones, which reveal broader population-wide trends. While small-scale data can assess the efficacy of physical interventions, these studies do not address the uneven impacts of decarbonisation on housing costs across tenures. To bridge this gap, the article analyses the distributional effects of decarbonisation using micro-level registry data and a diff-in-diffs design drawing from programme evaluation research. By applying a longitudinal analysis to track the evolution of housing costs, this article connects the intervention-focused insights of energy efficiency research with the inequality-oriented findings of affordability studies. In doing so, it offers new evidence on the distributional implications of decarbonisation for housing costs.
Data and approach
Data and treatment
This study uses the Woonbase, a comprehensive registry dataset compiled from tax records and other official sources, covering social and economic information on all Dutch households between 2018 and 2023 from the Centraal Bureau Voor de Statistiek (CBS, 2023). Woonbase’s main advantage is that it links households to dwellings with detailed socioeconomic and housing data. This article draws from three of its components: prosperity, covering wealth and income variables; housing costs, including rent, mortgage, utilities and taxes; and energy, comprising energy use and efficiency. These three datasets share common identifiers that are used for inter-linking. The final panel dataset was created by linking household and housing unit identifiers across years, incorporating financial and energy data. While the data rely on imputation for completeness to cover the whole Dutch population, to ensure robust analysis, households with modelled energy consumption data or costs were excluded.
Decarbonisation is proxied by a sustained reduction in heating-degree-days-adjusted gas consumption per square metre. Following research on housing decarbonisation by the European Commission et al. (2019), renovation depth is benchmarked against baseline energy use: medium renovation corresponds to a 30%–60% reduction, while deep renovation exceeds 60%. In line with this classification, treatment is defined as a reduction of more than 30% relative to the previous two-year average, sustained at no less than 25% in the subsequent year; see equation (1). To ensure robustness, additional specifications (reported in the supplemental material) distinguish between medium (30%–60%) and deep (>60%) reductions. To prove the common trend requirement in the diff-in-diffs approach, the data incorporate one pre-treatment year. As a result, three treatment waves can be consistently defined with the available data: 2018–2021, 2019–2022 and 2020–2023.
Treatment, equation (1):
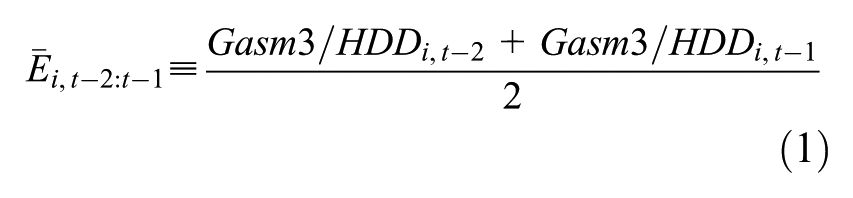
Treatment:
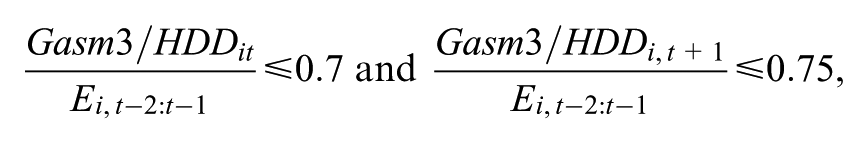
with
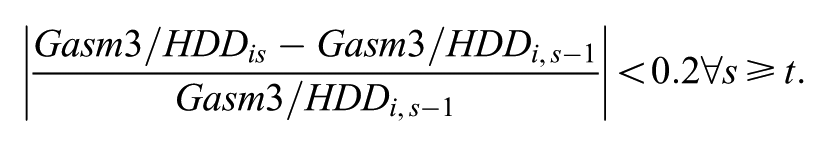
The treatment definition was further refined using changes in Energy Performance Certificates (EPCs). Units are excluded if their EPC rating is below C, or if they have not improved by at least two bands following treatment. This additional filter accounts for the way that EPCs are recorded: many dwellings lack certificates altogether, and when they exist, the year of issuance is not documented. As a result, older EPCs, based on different standards, may appear alongside more recent ones in the same field. In such cases, efficiency improvements may not be captured as a visible band change but rather as the preservation of an already high efficiency rating.
This treatment definition process identified a total of 150,000 households as having undergone housing decarbonisation measures. This is between 0.5% and 2.5% of the dataset depending on the wave after excluding households with imputed variables. This percentage is consistent with national estimates of 1%–2% of households undergoing renovations (Sandberg et al., 2016). The primary variable of interest, total housing costs, is constructed by CBS and encompasses energy expenses, mortgage or rental costs and a flat maintenance rate for homeowners; it is included in the pre-treatment descriptives in the text and also in the supplemental material. Total costs as well as all the other costs variables were deflated to 2018 values using the usual consumer price index. This comprehensive measure of total costs ensures comparability between homeowners and renters, making it suitable for analysing housing cost dynamics across tenure groups.
Finally, the tenure field is constructed using Woonbase information on rent-setting criteria, which allows distinguishing between social and private rental sectors. The Dutch rental market is divided into regulated (social) and liberalised (private) segments. In the regulated sector, dwelling quality is determined through the Woningwaarderingsstelsel (points system), and annual rent increase is determined by Parliament. In the liberalised sector, defined in 2024 as contracts with an initial rent above €879.66 per month, rents are set by market conditions. In the private case, despite this greater flexibility, intra-tenancy rent increases remain subject to statutory limits, and tenants can contest disputes before the Huurcommissie (Rent Tribunal; Government of the Netherlands, 2024). In the case of homeowners, outright owners were identified as those not making mortgage payments.
Staggered diff-in-diffs
Diff-in-diffs methods, as defined by Angrist and Pischke (2009), estimate policy impacts using a treated group and a control group. This approach relies on the parallel trends assumption to estimate the Average Treatment Effect on the Treated (ATT). This assumption asserts that, in the absence of treatment, both groups would have followed the same outcome trajectory over time. In its simplest form, diff-in-diffs compares two groups across two periods. In practice, however, treatment can be adopted over time across different groups. This setting, known as a staggered diff-in-diffs, extends the traditional setup, allowing adoption at different times. In practice, it is implemented through a regression with year fixed effects to absorb common shocks across all groups and event-time indicators for periods relative to treatment. This specification pools information across groups and treatment timings, while preserving the core parallel trends assumption and controlling for common shocks (De Chaisemartin and D’Haultfoeuille, 2022).
A significant challenge in diff-in-diffs studies is identifying a control group resembling the treated group. To address this, matching techniques are often employed alongside diff-in-diffs (Imbens and Wooldridge, 2009). Matching selects control observations with covariates similar to the treated group, using measures like Mahalanobis distance or propensity scores (Lechner, 2010). Mahalanobis distance considers covariate values directly, whereas propensity scores rely on the probability of treatment given covariates (King et al., 2011). Despite limitations, combining diff-in-diffs with matching enhances robustness by controlling for observed and unobserved confounders. Quasi-experiments and diff-in-diffs have previously been used to study housing costs and energy transitions (Ferentinos et al., 2021; Kattenberg et al., 2023; Pollack et al., 2010). This study applies this approach to the analysis of housing costs, pairing decarbonised households with similar non-decarbonised ones to evaluate cost differences while accounting for household consumption patterns.
Descriptive statistics in Table 1 indicate disparities between treated and untreated households, particularly in total housing costs and wealth percentiles. These imbalances motivate the use of matching to balance covariates and reduce selection bias, thereby ensuring comparability between groups and enabling a robust estimation of treatment effects.
Pre-matching descriptive statistics (2018–2021), other periods are included in the supplemental materials.
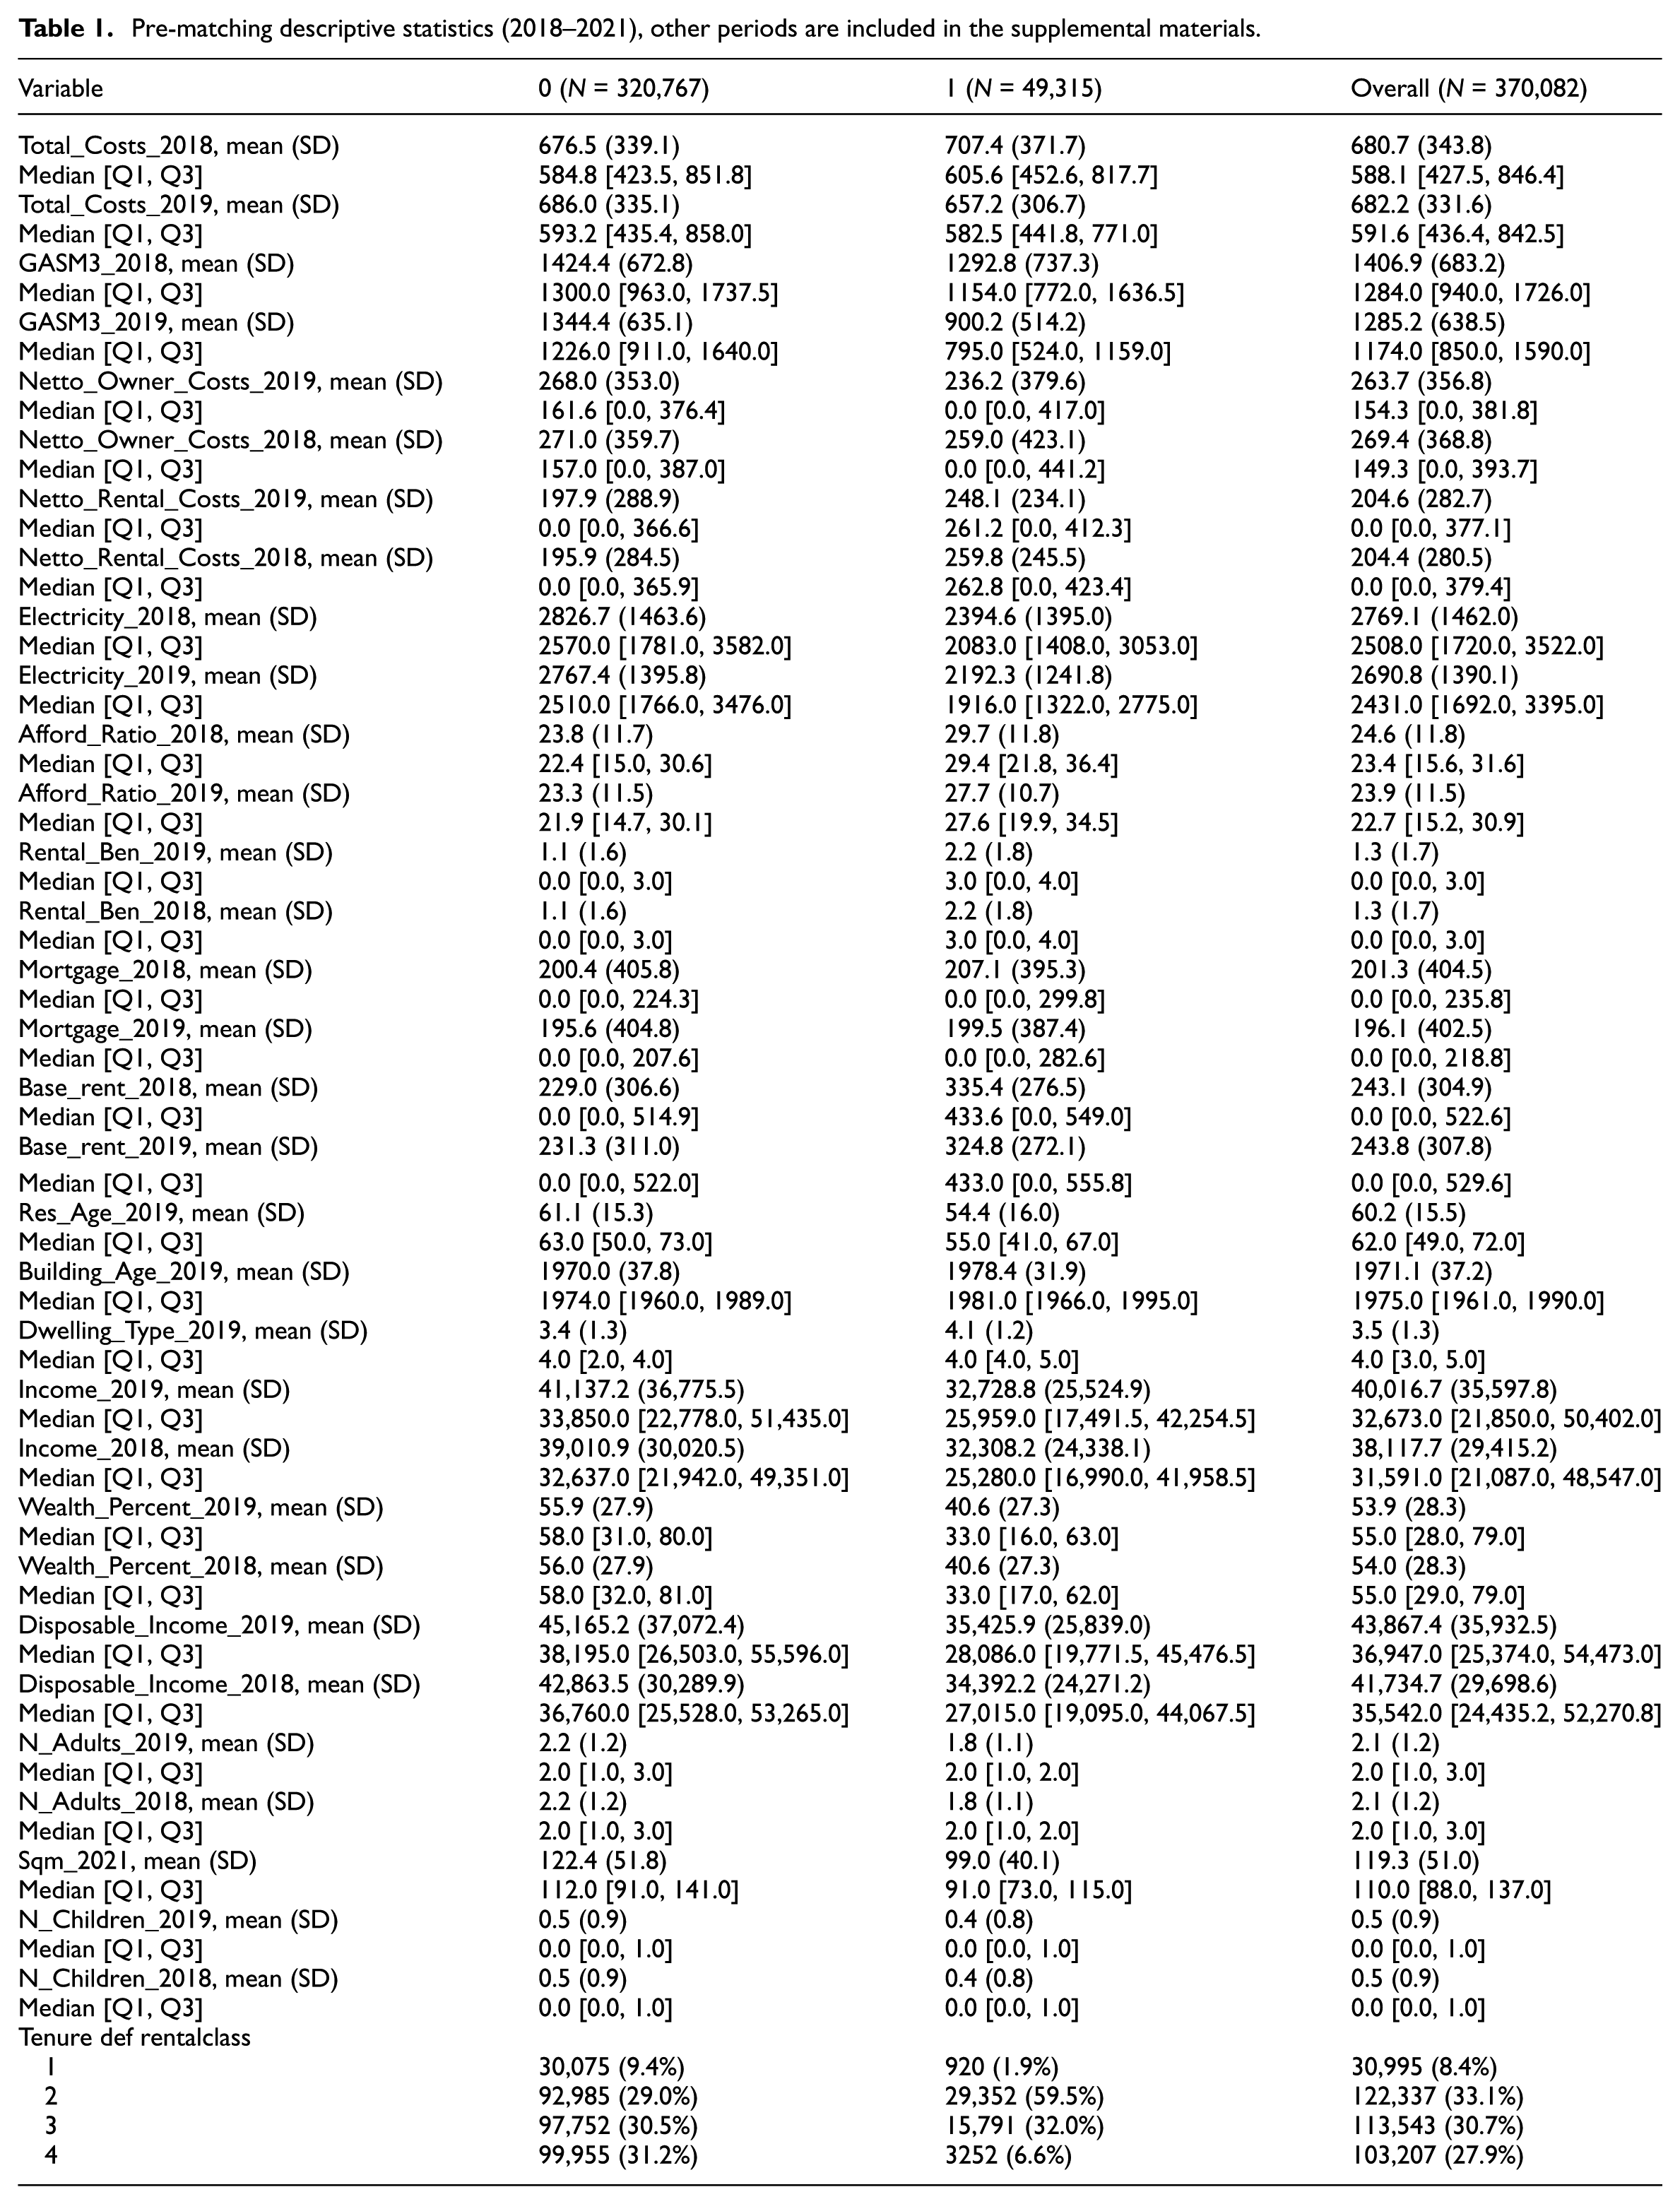
The matching procedure was implemented by wave, that is 2018–2021, 2019–2022 and 2020–2023, using the MatchIt package (Ho et al., 2011). To manage computational demands from the large control group, a random sample of 100,000 households was selected by tenure group, except for private renters, where the control group included all the non-treated households due to the lower prevalence of private renting in the Netherlands. Mahalanobis distance matching with a 0.2 propensity score caliper was applied to discard treated households without a suitable match. This approach reduced absolute standardised mean differences across key variables, as illustrated in Figure 1, showing improved covariate balance. By addressing pre-treatment biases, the procedure ensured that socioeconomic differences were controlled before estimating treatment effects.
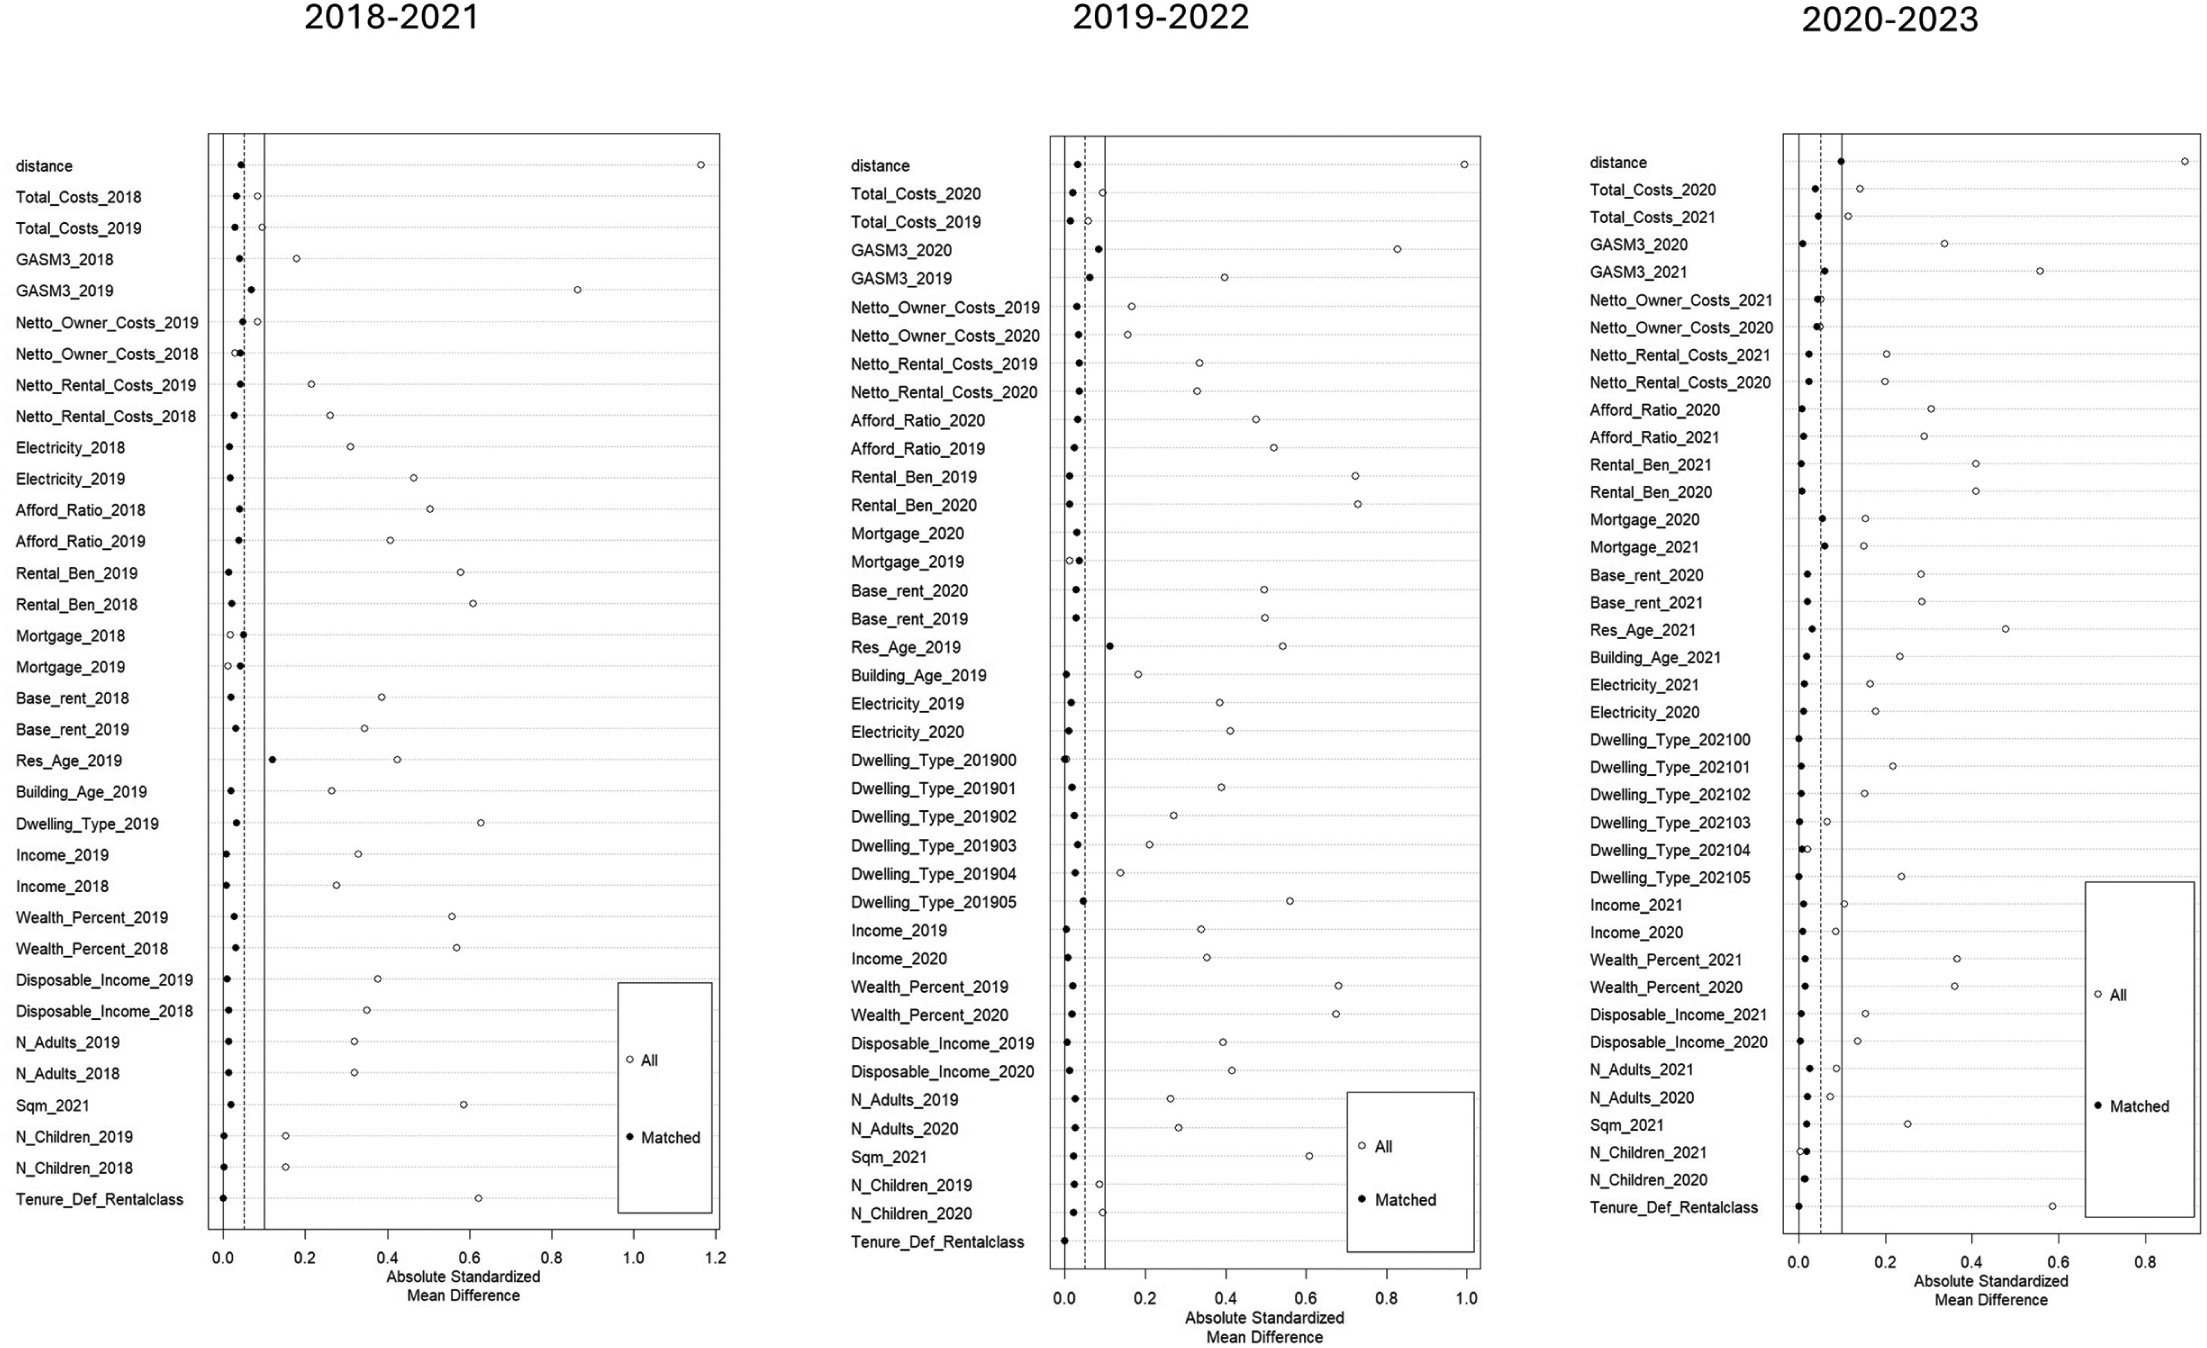
Love plots.
Following matching, the analysis proceeds with a staggered diff-in-diffs regression. The baseline model includes an interaction term between treatment and treatment period, along with controls for household composition and income. Household and year fixed effects are included to account for unobserved heterogeneity and common shocks. The regression can be expressed as equations (1) and (2).
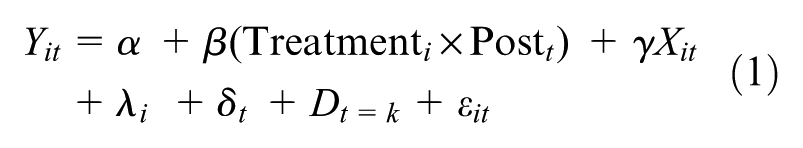
Yit denotes total housing costs for household i at time t, Xit represents covariates (income and housing benefits and composition), λ i are household fixed effects and δ t are year fixed effects (2018–2023) and Dt are the period fixed effects (k = −2 to k = 1) from the staggered model.
Equation (2) replaces the single post-treatment indicator with event-time dummies to trace dynamic treatment effects across periods.
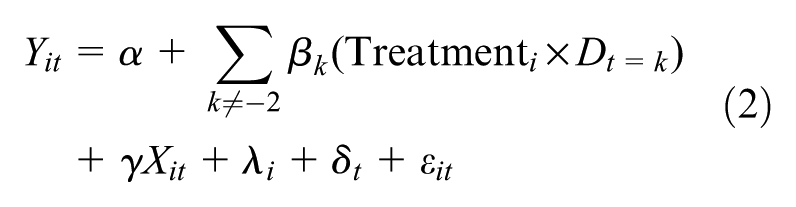
Dt = k denotes relative time dummies, k periods before or after treatment, taking −2 as reference. This specification captures the trajectory of treatment effects over time. In the next section, regressions on total housing costs follow specifications one and two. The regressions with Brutto rental costs and electricity follow equation (2).
Regression results
Table 2 presents the estimated coefficients from equation (1). In Model 0, including all households, the treatment led to an 8.7% reduction in total housing costs. This represents the baseline effect of decarbonisation, both statistically significant and economically meaningful. For private renters (Model 1), the treatment effect is smaller, producing only a 3.9% reduction in costs. For social renters (Model 2), the treatment effect reaches 8.9%, very close to the overall household average. This suggests that decarbonisation programmes deliver particularly consistent benefits in the social rental sector, likely thanks to the Dutch rent-setting point system discussed in the next section. For mortgagors (Model 3), the treatment effect is somewhat smaller, at 7.5%. While this is below the overall average, it remains economically meaningful. The relatively muted effect likely arises because mortgage payments dominate their total housing costs, reducing the proportional impact of efficiency-driven savings. Nevertheless, given their higher baseline costs, mortgagors still realise substantial absolute reductions. The largest percentage reduction is observed among outright homeowners (Model 4), who experience a striking 13.9% decline in total housing costs. Free from mortgage obligations, outright owners are more exposed to energy-related expenditures, meaning efficiency improvements translate directly into proportional cost relief.
Regression coefficients equation (1). Diff-in-diffs regression results.
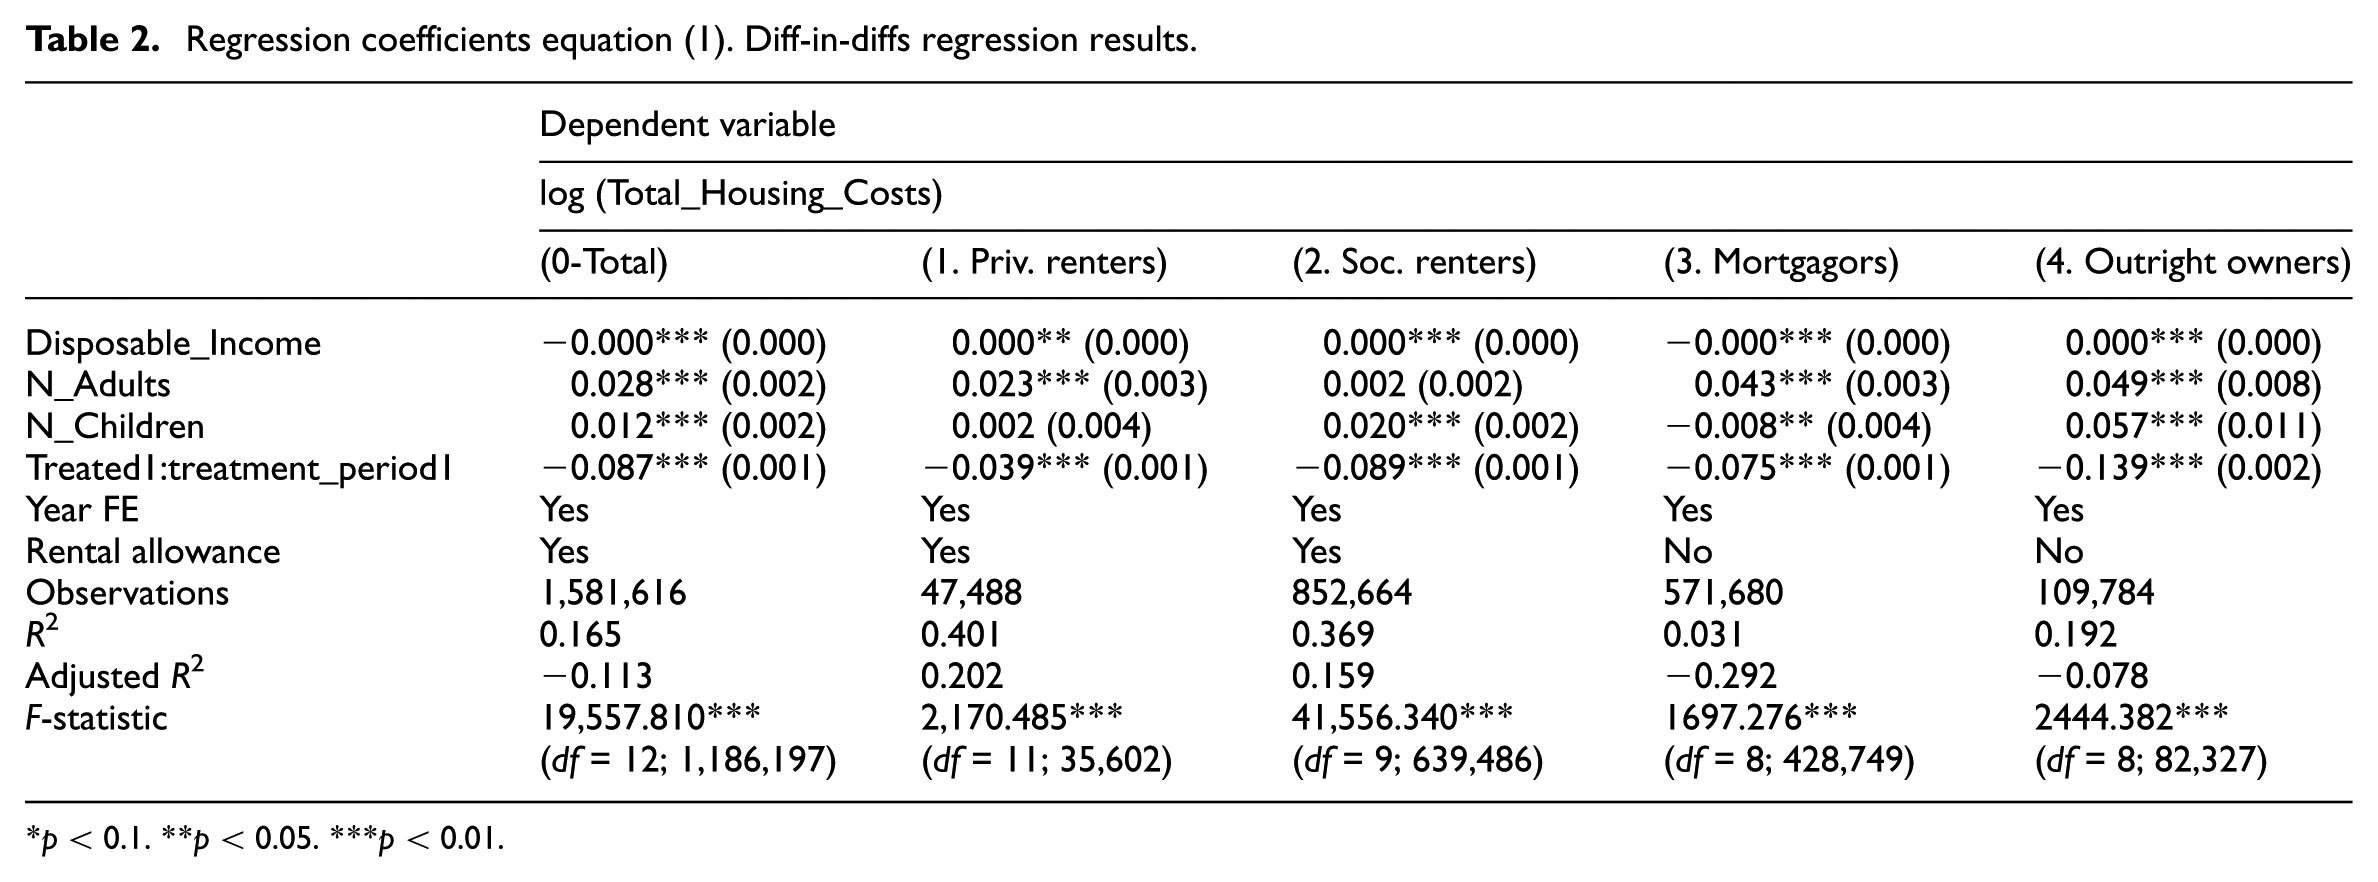
p < 0.1. **p < 0.05. ***p < 0.01.
Table 3 presents the estimates from equation (2), which interacts treatment with time. By using period −2 as the reference, the analysis incorporates a placebo test for pre-trends visible in the estimate for period −1. In Model 0, including all households, the coefficient for period −1 is negligible (−0.4%), supporting the parallel trends assumption. At treatment, total housing costs fell by 8.3% for treated households, deepening to 9.5% one period later, in line with the equation (1) results. For private renters (Model 1), no pre-trend is observed; housing costs declined by 3.6% at treatment and strengthened modestly to 4.3% thereafter. For social renters (Model 2), no pre-trend is detected, with costs falling by 8.6% at treatment and stabilising at 9.5% in the following period, indicating consistent benefits. For mortgagors (Model 3), a minimal pre-treatment decline of 0.6% is observed, but post-treatment costs fell by 7.0%, increasing to 8.5% one period later, suggesting gradual materialisation of savings despite mortgage-dominated expenditure. Finally, outright homeowners (Model 4) show no meaningful pre-trend, with housing costs falling sharply by 13.6% at treatment and expanding to 14.8% thereafter, confirming that they are the most responsive group. Although all costs are deflated to 2018 prices, the fact that energy prices rose faster than general inflation explains why the rewards to decarbonisation increase progressively over time, as treated households are shielded from rising energy costs.
Regression coefficients equation (2). Diff-in-diffs regression results.
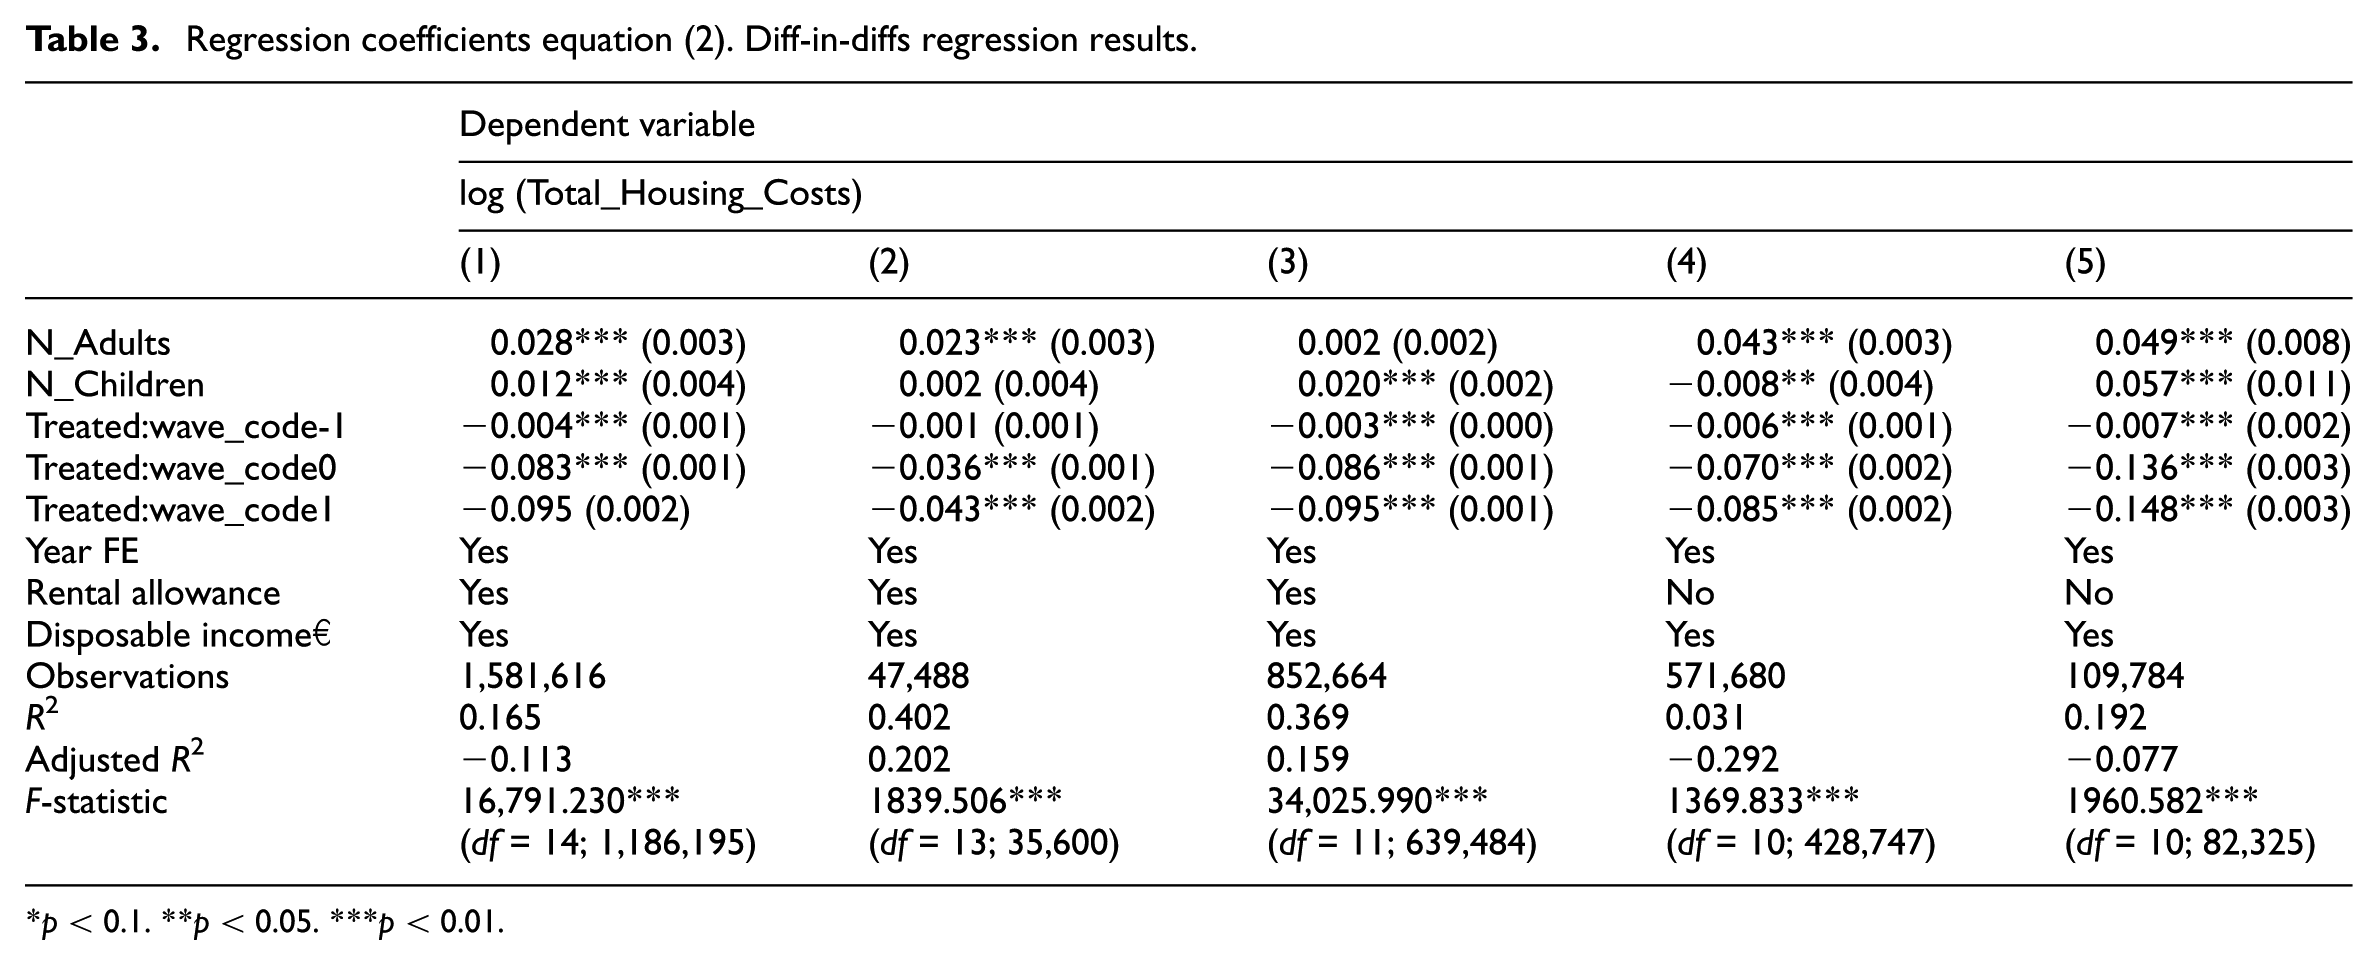
p < 0.1. **p < 0.05. ***p < 0.01.
Figure 2 shows estimates for a setup following regression 2 but targeting electricity, rental costs and the total costs estimates from Table 2. For mortgagors and outright homeowners, electricity consumption rises after treatment (modest at k = 0, positive by k = 1). This is consistent with a shift from gas to electric heating technologies. Despite these increases, total monthly costs fall sharply (around −7% to −9% for mortgagors and −14 to −15% for outright owners), indicating that the reduction in gas consumption more than offsets higher electricity use. For social renters, electricity expenditure declines noticeably after treatment, while rents increase only slightly, continuing a pre-trend prior to gas reduction. The average treatment effect is very small (less than 1%), pointing to a non-systematic application of rent increases. Even with these modest rent increases, social renters still record meaningful total cost reductions of around 9%. For private renters, the pattern is similar but more muted: electricity spending falls after treatment, while rents tick up only marginally. The result is a smaller reduction in total costs (about −3% to −4%), pointing to heterogeneous treatment effects in the private rental sector, where landlords may capture part of the efficiency gains and rental costs overshadow energy ones.
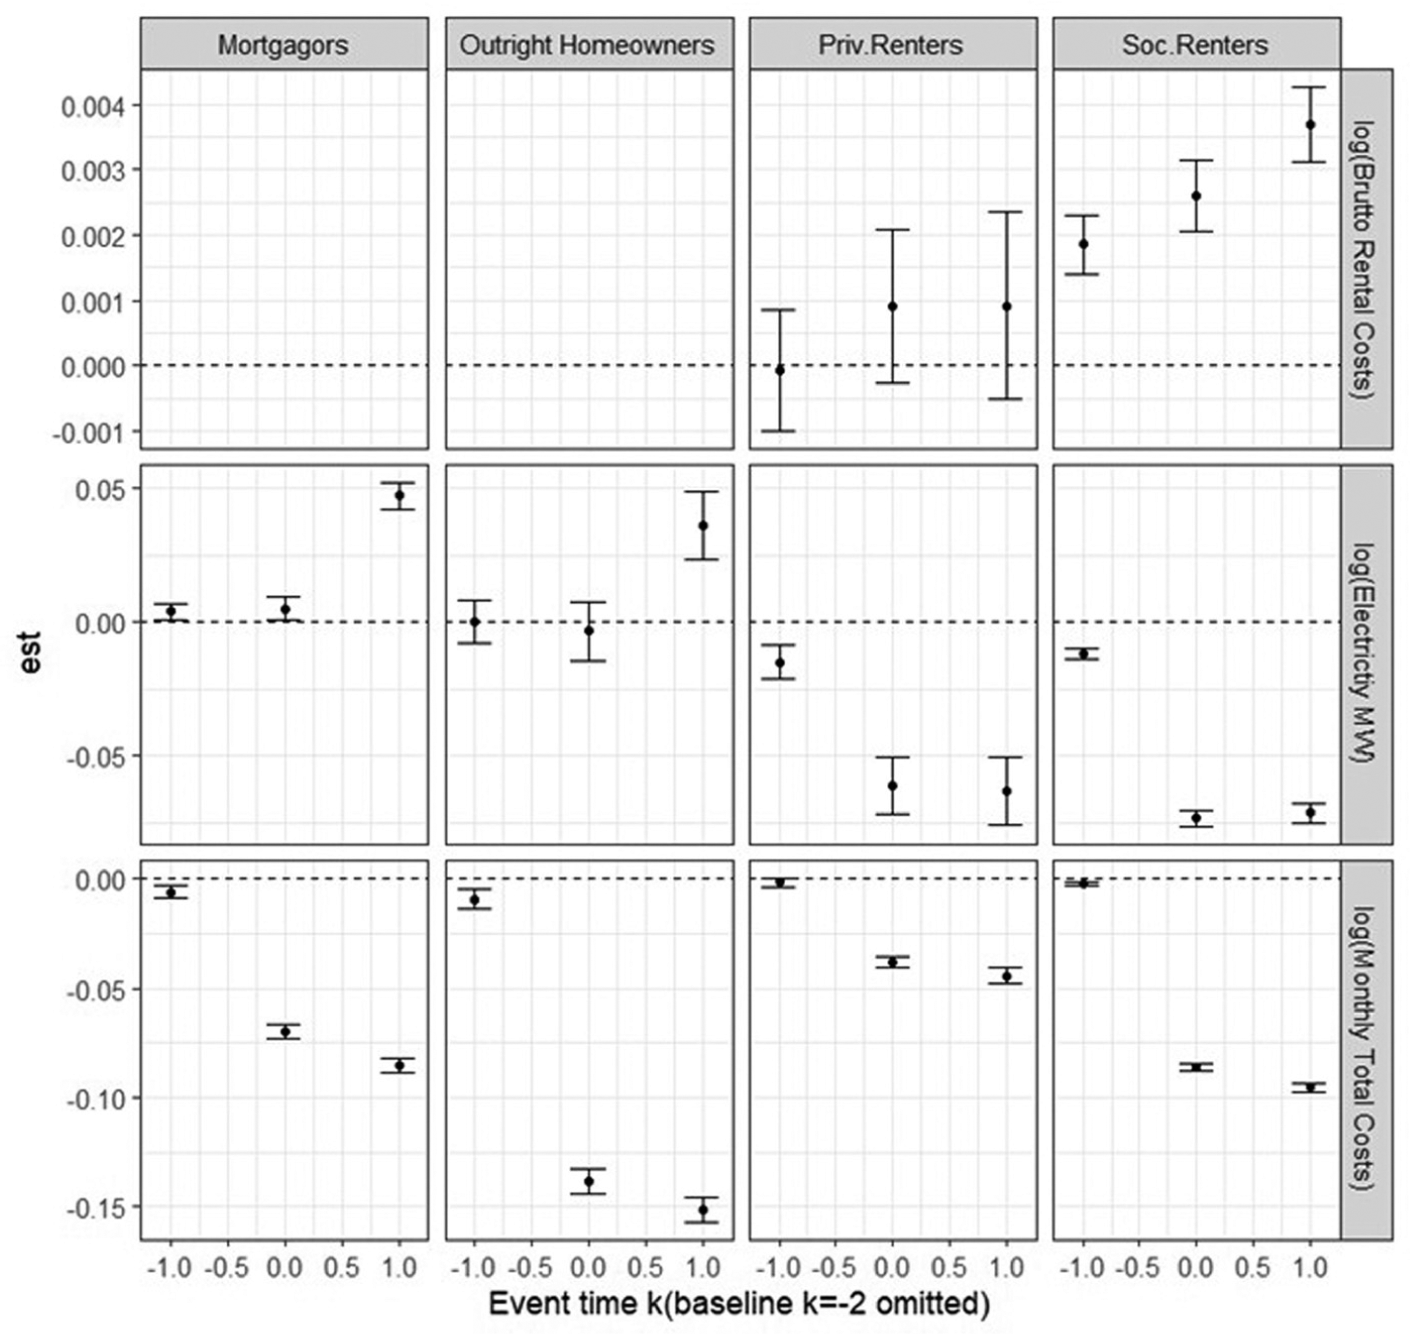
Equation (2) estimates of Brutto rental costs, electricity and total costs.
Overall, Figure 2 highlights fuel switching among homeowners and efficiency savings among renters with tenure-specific pass-through rates: highest for outright owners, somewhat attenuated for mortgagors and weakest for private renters. Importantly, with the available data we cannot determine whether households participated in renovation schemes such as Energiesprong, where renovation charges are used to recoup investment. 1 In such cases, energy consumption falls but out-of-pocket housing costs may not decline.
The estimated pass-through rates in Figure 3 cluster around €0.09–€0.11 per m3 of gas saved. Mortgagors and outright homeowners show the most precise estimates, with tight confidence intervals and stable pass-through rates of roughly €0.10–€0.11/m3. This indicates that for owner-occupiers, savings from reduced gas consumption translate consistently into lower housing expenditures, reinforcing the earlier evidence of strong benefits. For private renters, the estimated savings are also close to €0.09–€0.10/m3, but with much wider confidence intervals, reflecting greater heterogeneity in outcomes. This aligns with the earlier observation that landlords may capture part of the gains through rent increases, although this is not consistent, leading to an inconclusive average treatment of decarbonisation on rent. Social renters show slightly lower savings, around €0.09/m3, again with relatively narrow confidence intervals. This is consistent with the rent-setting system; while efficiency improvements reduce gas consumption, some of the benefits may be partially absorbed in regulated rent adjustments. Ultimately, owner-occupiers enjoy the most direct and predictable pass-through, while renters, especially in the private sector, face more variable outcomes.
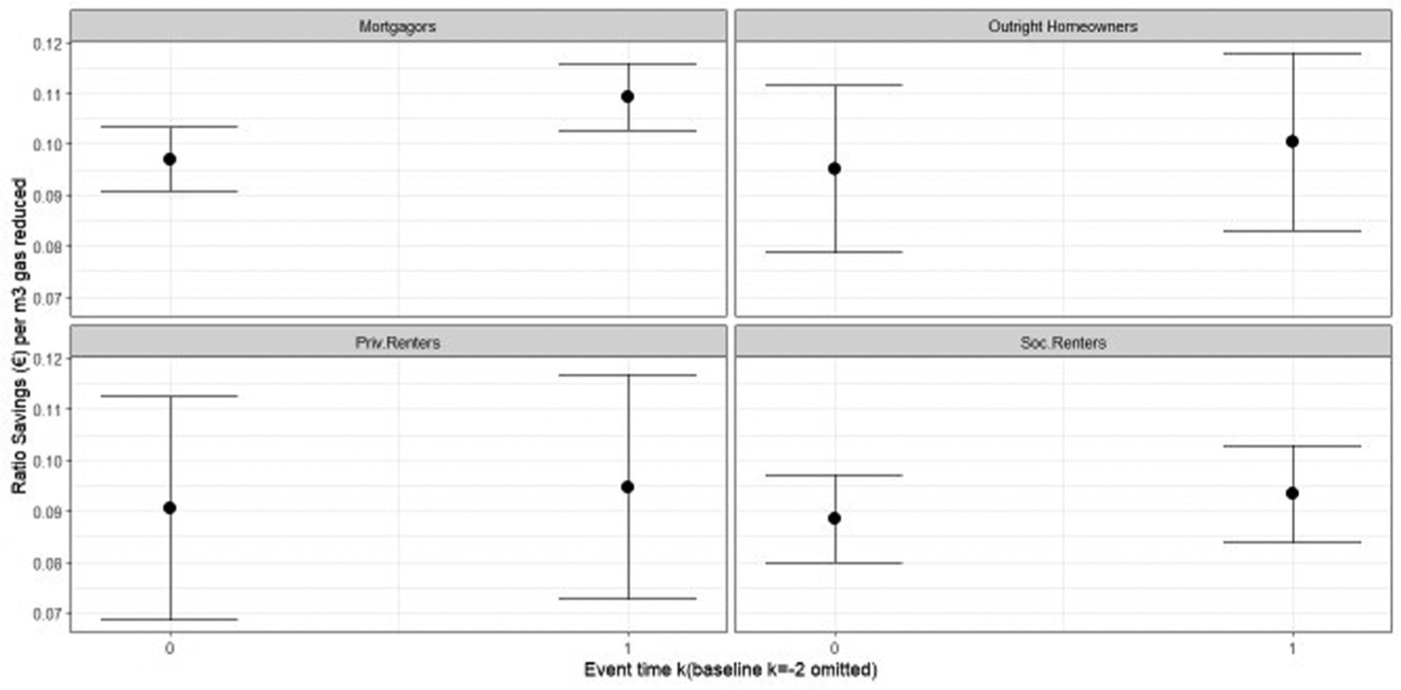
Rate of monthly savings per gas m3 reduced.
Rate of housing cost monthly savings per cubic metre of gas reduced, by tenure and event time (baseline period k = −2 and −1 omitted; 95% confidence intervals).
Distributional impacts, policy implications and limitations
This article began by asking whether housing decarbonisation produces unequal outcomes across tenures and income groups. The results demonstrate that while decarbonisation generally improves affordability, the magnitude and distribution of these gains vary systematically across tenure types. Figure 4 shows changes in affordability, measured as the difference in housing cost-to-income ratios between treated and control households. Affordability improves for all tenures except private renters. For mortgagors and outright homeowners, cost burdens fall after renovation, with outright owners gaining the most given their higher exposure to energy bills rather than mortgages. Social renters also experience clear affordability improvements once treatment takes effect, reflecting meaningful pass-through of energy savings into lower housing costs. By contrast, private renters see no significant gains in affordability. While there is no systematic evidence of higher rents capturing the benefits of renovation, their pass-through rates are inconsistent and the absolute reductions in costs are small relative to their already higher housing costs, leaving their affordability ratio unchanged.
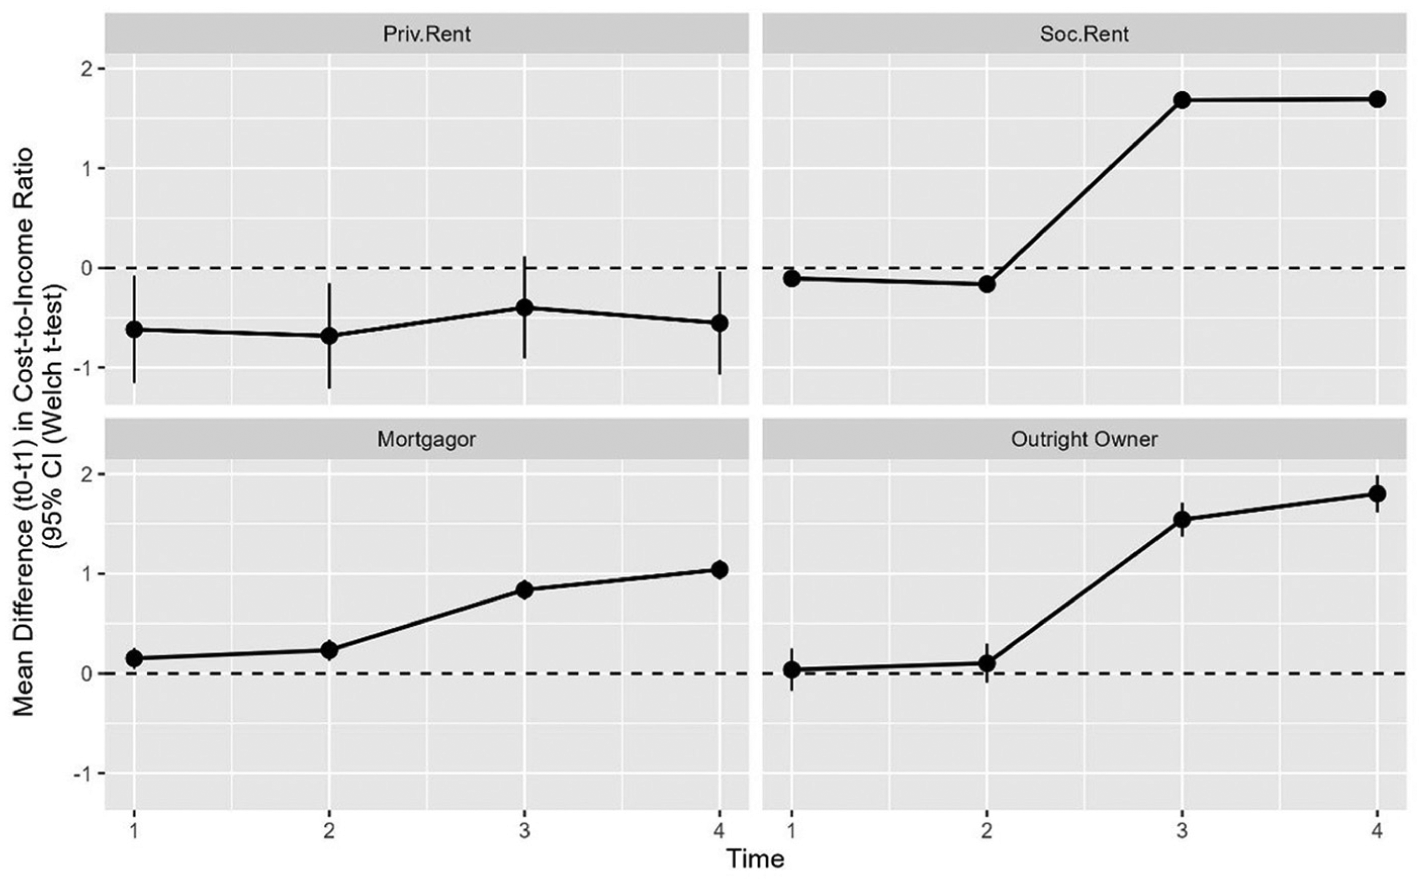
Affordability changes.
Differences in cost-to-income ratios between treated and control households, disaggregated by tenure and treatment wave, with 95% confidence intervals.
Figure 5 differentiates these outcomes by prosperity quantiles, ranking households by income and wealth using a CBS-provided measure, 2 and includes the capitalisation of energy savings into property values for mortgagors and outright owners. Capitalisation is calculated assuming a 5% gross rental yield. 3 The figure shows that absolute savings are largest for homeowners, particularly in higher deciles, where households benefit from both lower energy expenditures and increased property values. In contrast, private and social renters see much smaller absolute savings. The pattern also diverges across income groups. Social renters record larger energy savings in the lower deciles, while mortgagors and outright homeowners benefit more in the upper deciles, amplifying existing inequalities in housing costs and wealth.
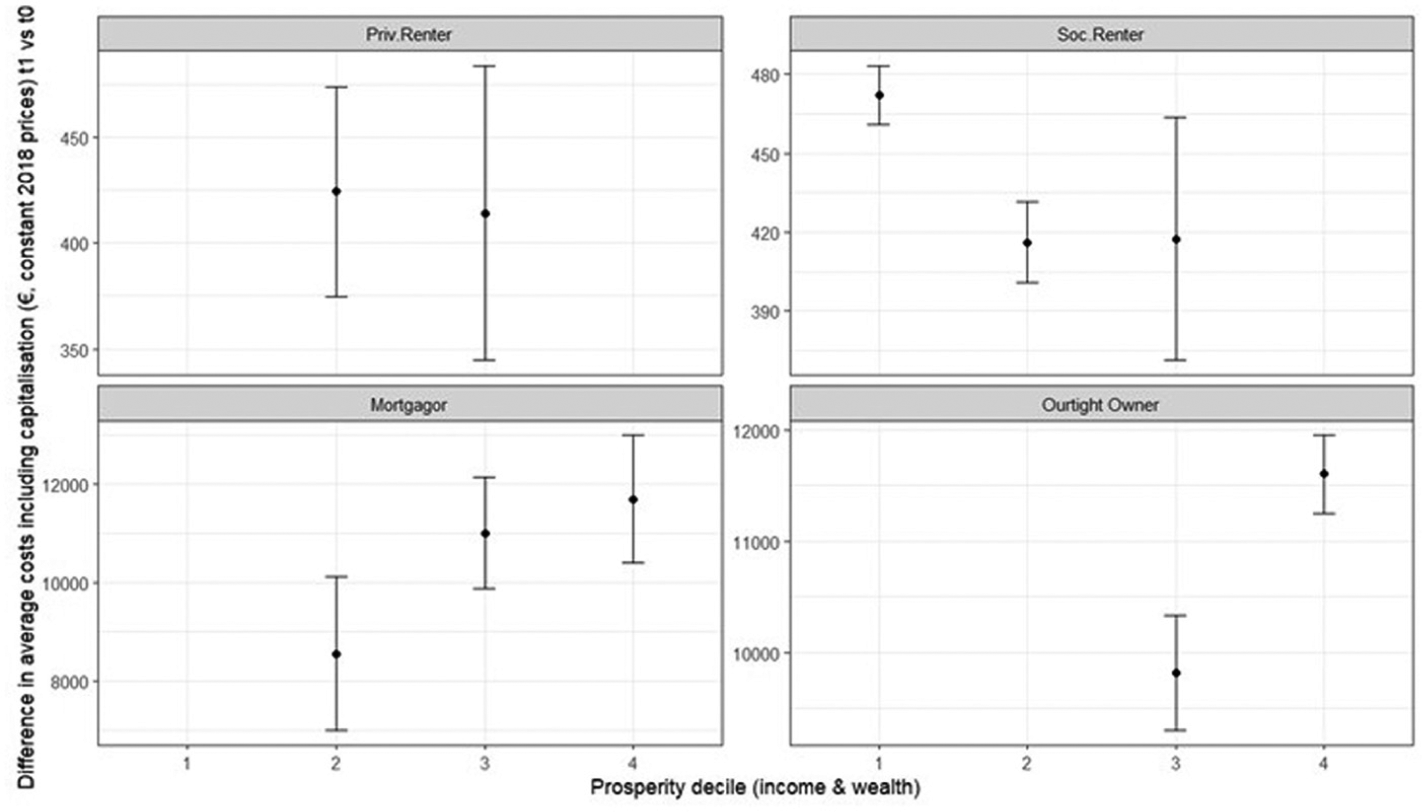
Distributional analysis with capitalisation.
Difference in average total cost change (treated – control) by prosperity quantile and tenure; ‘total cost’ combines annualised energy-bill savings and, for owners, capitalised value gains (5% gross yield). Points show means with 95% confidence intervals; cells with <1000 treated observations are omitted; amounts in 2018 euros.
These findings fit into the broader Dutch housing renovation policy landscape which further shapes how benefits from decarbonisation are distributed. On the homeowner side, the Netherlands offers the Investeringssubsidie Duurzame Energie en Energiebesparing (ISDE) subsidy, which covers part of the investment costs for measures such as heat pumps, solar boilers, insulation and connection to heating networks. The budget for the ISDE has been increased recently to meet demand, including an increase by tens of millions of euros in 2022 (IEA, 2025). As noted in Fernández et al. (2024), renovation subsidies reinforce advantages for homeowners, who already benefit from favourable tax treatment and face the lowest housing costs. Furthermore, because the ISDE reduces renovation costs for those homeowners able to cover half of the renovation expenses, renovations seem to be concentrated in the higher prosperity quartile. On the rental side, the analysis shows that the Dutch rental market regulation does work in limiting rent increases post-renovation. These institutional features help explain some of what we observe in Figures 4 and 5. Social renting is partially protected by rent regulation and oversight by the Huurcommissie, meaning that tenants in the social rental sector often benefit from affordability improvements once renovations happen. Private renters are also protected by the Huurcommissie and, despite a less clear pass-through rate, post-renovation rent increases do not overtake energy efficiency gains.
These findings point to a structural policy misalignment. According to Figure 5, the largest redistributive affordability improvements are observed in the social rental sector, yet this is the segment where public subsidies are least accessible and housing associations must largely finance renovations from their own resources (VRO, 2024). By contrast, homeowners, particularly outright owners, capture a higher dividend in the form of both lower energy costs and higher property values, amplified by subsidy schemes such as the ISDE and the under-taxation of housing wealth. This asymmetry raises concerns about the regressive distribution of renovation benefits. To achieve more equitable outcomes, policy priorities should shift towards directing greater financial support to social housing decarbonisation, where the potential for affordability gains is both significant and progressive. At the same time, stricter renovation requirements for homeowners are warranted, supported by mechanisms such as equity release or borrowing facilities to mobilise the property wealth that benefits from both housing appreciation and energy savings. For the private rental sector, extending tenancy durations and tight rules on cost pass-through after renovation does mean that a proportion of efficiency gains are retained by tenants rather than absorbed into higher rents; however, this does not improve affordability and may be insufficient for widespread renovation. Ultimately, this article argues for a more direct incorporation of redistributive mechanisms into housing decarbonisation policy to address housing unaffordability and avoid entrenching regressive housing market dynamics.
Finally, several limitations should be acknowledged. First, while using registry data ensures comprehensive coverage, Woonbase relies on imputation for country-wide coverage. By excluding observations with imputed values, the results possess improved internal validity but limited external one, as treatment effects among excluded cases could differ from those observed. Second, treatment is proxied by sustained reductions in heating degree day-adjusted gas use, complemented by EPC improvements; although this dual approach mitigates misclassification, it does not identify the exact renovation measures which could mediate cost outcomes. Third, we lack administrative data on renovation subsidies, landlord cost-recovery mechanisms and renovation charges, constraining our ability to disentangle direct household savings from policy-driven pass-through. Fourth, the outcome analysis focuses on sitting tenants and does not observe lease turnover, where landlords may reprice at higher rates; as a result, our estimates do not cover the impact of decarbonisation on mobile private tenants, if they are subject to displacement pressures after renovation.
Conclusion
This article has examined the distributional and affordability implications of housing decarbonisation in the Netherlands through a combination of matching and staggered diff-in-diffs approaches. The analysis shows that while decarbonisation reduces housing costs overall, the extent of these reductions varies systematically across tenure types. Outright owners experience the largest relative savings, mortgagors the greatest absolute reductions and renters, particularly in the private sector, the smallest and most uncertain benefits. These patterns suggest that the impact of decarbonisation on overall housing affordability is filtered through the institutional structures of tenure, mortgages and rent regulation, with implications for how the energy transition reshapes longstanding affordability divides. More broadly, the findings contribute to debates on the distributional consequences of sustainability transitions. They show that the material benefits of decarbonisation are not distributed evenly but mediated through existing housing institutions, potentially reinforcing rather than alleviating inequalities in the affordability of housing costs.
Supplemental Material
sj-docx-1-usj-10.1177_00420980251412620 – Supplemental material for Unequal rewards to decarbonisation: A diff-in-diffs approach to measuring housing costs across tenures
Supplemental material, sj-docx-1-usj-10.1177_00420980251412620 for Unequal rewards to decarbonisation: A diff-in-diffs approach to measuring housing costs across tenures by Alex Fernandez, Marietta Haffner and Marja Elsinga in Urban Studies
Footnotes
Author contributions
Alex Fernandez: Conceptualisation, Methodology, Software, Formal Analysis, Investigation, Writing – Original Draft, Visualisation. Marietta Haffner: Validation, Writing – Review & Editing, Supervision, Project Administration, Funding Acquisition. Marja Elsinga: Writing – Review & Editing, Supervision, Project Administration, Funding Acquisition.
Funding
The authors disclosed receipt of the following financial support for the research, authorship, and/or publication of this article: This project has received Funding from the European Union’s Horizon 2020 research and innovation programme under the Marie Skłodowska-Curie grant agreement No. 956082.
Declaration of conflicting interests
The authors declared no potential conflicts of interest with respect to the research, authorship, and/or publication of this article.
Supplemental material
Supplemental material for this article is available online.
Notes
References
Supplementary Material
Please find the following supplemental material available below.
For Open Access articles published under a Creative Commons License, all supplemental material carries the same license as the article it is associated with.
For non-Open Access articles published, all supplemental material carries a non-exclusive license, and permission requests for re-use of supplemental material or any part of supplemental material shall be sent directly to the copyright owner as specified in the copyright notice associated with the article.