
Abstract
This study examines Waze’s role in Santiago de Chile’s traffic management, emphasising its use in control rooms. Using ethnographic methods, including observations and interviews, the research demonstrates how analysts employ formal and informal data, with Waze playing a central role, in their operational decision-making. The findings illustrate the dual role of Waze: as a tool for enhancing on-the-spot traffic management and as a digital mapping platform that potentially blurs the lines between public interests and private digital platforms. This study contributes to the discussion on smart and platform urbanism by illustrating the dynamic use of digital mapping platforms. It calls for a critical examination of third-party platform partnerships, including Google and Waze, to interrogate the dynamics of digital mapping platforms in urban traffic management and the broader implications in urban governance.
Introduction
As cities strive for more efficient urban management, Santiago’s control rooms exemplify an effort towards real-time data integration into operational decision-making. In Santiago’s public transport system (Transantiago), control rooms increasingly rely on digital platforms like Waze. In what ways do public governance and private platforms overlap, and what unintended consequences emerge from these blurred boundaries? This study explores these dynamics in Santiago’s transport system, positioning them within broader debates on smart and platform urbanism and their implications for public interest.
The movement towards smart urbanism, characterised by integrating data-driven technologies, aims to improve urban services and urban management whilst critically analysing its implications (Barns et al., 2017; Batty, 2016; Kitchin, 2015; Leszczynski, 2016; Madsen, 2018; Marvin et al., 2016; McFarlane and Söderström, 2017; Offenhuber and Ratti, 2014). This shift is significant in Latin America, where cities, including Santiago de Chile, face challenges such as inequality and unmanaged urban expansion (Garreton, 2017; Klaufus and Jaffe, 2015). In the region, the adoption of smart urbanism often reflects an effort to catch up with global urban standards and craft localised, often grassroots, solutions (Irazábal and Jirón, 2021).
Integrating Waze into Santiago’s control room reflects a broader trend in urban governance, where digital platforms play a crucial role in traffic management. Similar initiatives have been observed globally, such as Rio de Janeiro, Chicago, where Waze partnered with local governments through the Connected Citizens Programme (CCP), now Waze for Cities, to facilitate data exchange (Frost, 2019). Google’s acquisition of Waze in 2013 further positioned it as a central player in urban mobility governance, expanding its data collection and management tools ecosystem. Santiago’s 2019 partnership between the Chilean Ministry of Transport and Google/Waze exemplifies how private digital platforms are integrated into public governance, aligning local efforts with a broader global trend towards platform urbanism (Barns, 2020; Courmont, 2018). Santiago, which faces significant traffic management challenges (Muñoz and Gschwender, 2008), became an ideal testing ground for Waze’s integration into public transport systems. While these collaborations enhance traffic management, they raise important questions about the implications for urban governance and public interest as digital platforms increasingly blend local specificities with global technological shifts (Sadowski, 2019).
Transantiago serves as a case study in the context of smart cities, even preceding the global emphasis on such initiatives. Transantiago distinguished itself as a pioneer by integrating digital data infrastructure in Latin America through the early adoption of smart card transactions and embedding GPS systems in the public bus network, which started in 2008 (Munizaga and Palma, 2012). A notable innovation of Transantiago was the development of a new fleet management system, which brought with it the establishment of a control room as a physical entity for real-time system oversight (Gschwender et al., 2016). The system integrates city management with public transportation by developing a decentralised network of control rooms. This contrasts with the centralised control room models typically discussed in smart city literature and aims to enhance the flow and circulation of information across different control rooms (Barns et al., 2017; Caprotti, 2019; Luque-Ayala and Marvin, 2020; McNeill, 2015; Wigley and Rose, 2020).
This paper addresses a crucial question: How are diverse data sources, including specialised software and ‘unofficial’ sources such as Waze, integrated into Santiago’s Traffic Control Unit Control Room (UOCT)’s routine decision-making processes? Furthermore, what are the implications of this integration for urban governance and the balance between public and private interests in smart city initiatives?
The research, conducted over nine months in 2019, involved extensive participant observation in the UOCT control room and in-depth interviews with key stakeholders, including control room analysts, management staff and representatives from the Ministry of Transport. This approach enabled a rich, contextual understanding of how Waze is integrated into Santiago’s traffic management, offering insights into the broader implications of platform integration in urban transport management.
This article first situates control rooms within the broader smart urbanism literature, presenting ideas on digital mapping apps in the context of platform urbanism (Barns, 2020; Courmont, 2018) and concepts of ‘data bricolage’ (Luque-Ayala and Marvin, 2020; Offenhuber, 2019) and ‘oligopticon’ (Latour, 2005; Latour and Hermant, 1998). It then focuses on the UOCT control room, examining how data circulates through a bricolage of multiple sources, with particular attention to Waze’s role. The discussion explores Waze as an essential component of this data bricolage, consolidating its presence in public transport as a platform morphing into an urban infrastructure (Plantin, 2018). Finally, it reflects on the practical relevance of digital mapping apps in traffic management and the challenges for democratic governance when digital platforms become infrastructural components of the city.
Smart urbanism, control rooms and the oligopticon
Control rooms have a long history, dating back to the 20th century, primarily associated with the ambition of monitoring data, such as Key Performance Indicators, alongside historical trends, all centralised within one space. Western culture offers iconic examples of control rooms, from NASA mission control centres managing space launches to financial trading rooms where brokers rely on real-time data to inform stock transactions (Mattern, 2015). Academic discussions have primarily focused on security and surveillance, particularly questioning the effectiveness of centralised CCTV management, where on-the-spot individual and collective decisions are required based on specific contexts (Keval and Sasse, 2006; Rankin et al., 2012). Efforts to standardise control room operations include management that addresses architecture, design and organisational dynamics (Luff et al., 2000).
In recent studies on smart urbanism, control rooms have been depicted as critical infrastructural elements that utilise real-time computational data to shape urban governance (Kitchin, 2017). These spaces have evolved to streamline city operations, integrating diverse data sources through advanced tools like dashboards and visualisations (Barns, 2017; Marvin and Luque-Ayala, 2017; Mattern, 2015). The conceptualisation of control rooms has evolved from focusing solely on CCTV surveillance to encompassing broader ‘urban intelligence’ approaches, leveraging extensive datasets and digital tools for urban governance.
Control rooms, therefore, symbolise spaces where smart cities become visible and manageable, embodying governance mechanisms rooted in monadic and videological perspectives (Caprotti, 2019: 2468). They are often compared to the panopticon for its centralised view and minimal resource use to maximise control (Foucault, 1991). Unlike the panoptic model that implies centralised oversight, control rooms may form part of a decentralised ‘oligoptic’ (Latour, 2005; Latour and Hermant, 1998) network. In an oligoptic network, each component offers limited but precise views, functioning cohesively only when connections among various ‘oligoptica’ are maintained. As Latour and Hermant (1998: 49) describe, observing Paris through such a system reveals that ‘every panopticon is an oligopticon: it sees little, but what it does see, it sees well’. This shift highlights the move from total surveillance to focused, decentralised management.
Urban OS, digital mapping apps and the data bricolage
Urban Operating Systems (Urban OS) and digital mapping apps, integral to the dynamics of smart urbanism, reflect a shift in urban governance through their roles in control rooms. Originating from corporate tools like Enterprise Resource Planning (ERP) systems, Urban OS translates data analytics into practical applications in urban management (Luque-Ayala and Marvin, 2020; Marvin and Luque-Ayala, 2017). These systems symbolise smart city ideals – real-time efficiency, optimisation, and surveillance – and are reshaping how cities are governed by promoting new urban rationalities (Barns et al., 2017; Luque-Ayala and Marvin, 2016; Mattern, 2014, 2015). However, broader critiques emphasise concerns over simplifying urban life into technocratic metrics by Urban OS, which can obscure the social complexities inherent in cities (Datta and Odendaal, 2019).
The concept of ‘platform urbanism’ has expanded alongside the proliferation of social media and digital mapping apps (Barns, 2017, 2020; Caprotti et al., 2022; Hodson, 2021; Hodson et al., 2024; Offenhuber, 2019; Rose et al., 2021), impacting how control rooms operate and contribute to urban mobility. Services facilitated by these platforms, such as journey planning and social navigation tools, have become integral to and increasingly unavoidable in modern city life. Operating as ‘elements of infrastructures’ (Raetzsch et al., 2019) that negotiate between different urban stakeholders, they illustrate how platforms like Waze act as crucial intermediaries in the complex ecosystem of urban mobility. This intermediary role is producing a shift towards datafication, modularity and standardisation of urban services (Barns, 2020; Gekker and Hind, 2020; Hodson, 2021; Plantin, 2018). Nevertheless, this integration prompts discussions around democratic governance, privacy, and equity, with digital mapping apps like Google Maps and Waze at the forefront of this transformation (Courmont, 2018; Odendaal, 2022; Sadowski, 2019; Söderström and Mermet, 2020).
These digital platforms result in complex sociotechnical assemblages marked by dependencies across different applications and create a multifaceted apparatus. The transformation of Google Maps from a participatory platform to an infrastructural entity, as Plantin (2018) described, exemplifies this shift. The Google Maps Application Programming Interface (API), acting as a de facto standard for online maps, underscores the platform’s unavoidable role in the sociotechnical assemblage of urban navigation and information dissemination. Furthermore, Barns (2019) discusses the broader implications of platform urbanism, highlighting how digital platforms influence urban development beyond traditional transportation systems, fostering new forms of urban interaction and engagement. By integrating various data sources and leveraging their position as essential infrastructural elements, platforms like Google Maps not only dictate the flow of information but also mediate the relationships between different urban stakeholders.
Digital mapping apps transform from mere navigational tools into ‘knowledge infrastructures’ that fundamentally alter urban governance and spatial knowledge (Plantin, 2018). This transformation signifies that platforms like Google Maps transcend their initial roles, embedding themselves deeply into the urban and contributing to a dynamic interplay between database maintenance and societal functionality, thus becoming indispensable in contemporary urban development and decision-making processes. Tavmen (2020) describes this phenomenon as ‘infrastructural power’, where digital platforms gain authority in urban spaces through their ability to collect and process vast amounts of user data, as well as to interpret and shape specific urban patterns out of this data.
Concurrently, Luque-Ayala and Neves Maia (2019) examine the socio-political impacts of these platforms, particularly in marginalised areas like Rio’s favelas, where digital mapping apps serve dual roles in economic integration and surveillance, underscoring the tension between empowerment and exploitation. Expanding this point, Courmont (2018) employs Boltanski’s (2011) concepts of ‘realité’ and ‘monde’, proposing that digital platforms not only reflect reality (‘réalité’) but also actively construct a new world (‘monde’), thereby participating in the definition and regulation of cities. The latter aligns with Plantin’s assertion that when platforms morph into infrastructures, they no longer merely support data exchange but become deeply embedded in everyday practices, becoming unavoidable as part of the urban apparatus.
The relationship between control rooms, platforms and digital mapping apps is further shaped by improvisation and bricolage (Offenhuber, 2019). Improvisation refers to the confluence of planning and doing, often required in urgent situations (Offenhuber, 2019: 1569). It is tightly connected to bricolage, which involves addressing these situations that happen with whatever is at hand. In this context, improvisation is like a conversation among actors, while bricolage is a dialogue with the material world (Offenhuber, 2019: 1570). This relationship is crucial in understanding how control rooms configure tools and manage data circulation, where diverse resources come together through a trial-and-error collective process that can be extended to an institutional setting, blending formal and informal practices for urban management.
From that perspective, control rooms entail a collective operational practice involving not only a material–technical infrastructure but also complex social relations, hierarchies, and workplace cultures, all of which are essential for analysing how a wide variety of data and informational inputs (incl. CCTV footage, software, social media, and digital mapping apps) are interpreted – to the point that what happens in the street could be collectively re-performed using metaphors, colloquial talk and non-official means (Heebels and Van Aalst, 2020). Ultimately, the control rooms work through collective problem-solving dynamics sustained on improvisation and experimentation to define what to do at a determined moment.
Assembling the oligopticon: Control rooms in Santiago’s public transport
Transantiago is a multimodal public transportation system serving Santiago, Chile, designed to streamline urban mobility by combining bus services with the metro network (Muñoz and Gschwender, 2008; Ureta, 2015). Initiated in 2007, Transantiago organises transport into two main integrated components: multiple bus lines provided by six private companies and Santiago’s Metro. This public company runs seven different lines across the city. The integration allows transfers between buses and metros, facilitated by a unified electronic fare system using a smart card called the Bip! Card (smart RFID card). Transantiago faced operational challenges, including overcrowding and insufficient services, leading to public dissatisfaction. However, subsequent improvements have been made, such as increasing bus fleets, enhancing route coverage, and improving fare collection mechanisms.
The control rooms network is relevant in Transantiago as infrastructures that oversee the fleet management system. This network is comprehended by a total of 11 control rooms managed by four types of organisation (see Table 1) segmented into five supervisory tasks: route speed inspection; fleet management for private bus operators; a public fleet management inspection unit within the Ministry of Transport (MTT) that monitors the actions of private operators; traffic light management (managed by UOCT); and the control room for Santiago’s Metro. The primary and most apparent data sources in each control room are (i) CCTV and (ii) operational data generated by users entering the system using smart cards and GPS devices installed on buses. In all instances, software and internal protocols facilitate the management of observational or operational data.
Control rooms network in Transantiago.
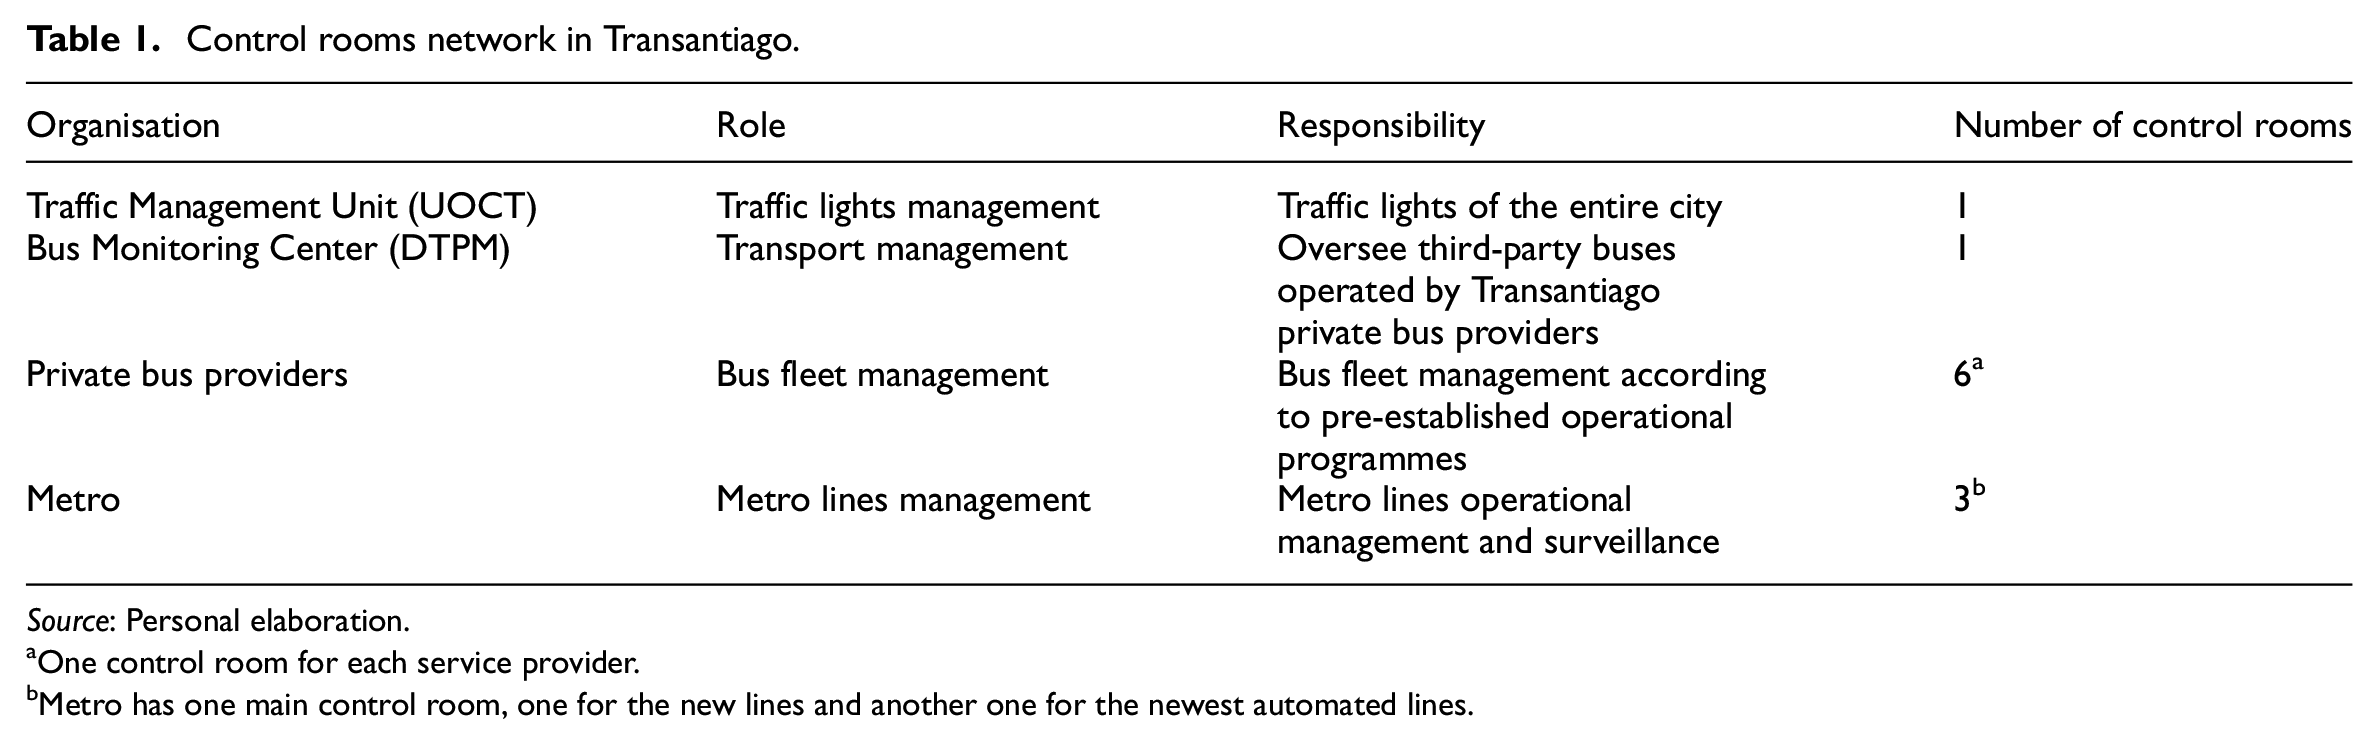
Source: Personal elaboration.
One control room for each service provider.
Metro has one main control room, one for the new lines and another one for the newest automated lines.
The Traffic Control Unit (UOCT)
The most iconic control room in Santiago’s public transport was created in the mid-90s, long before Transantiago, known locally as the UOCT, which integrates the coordination of the city’s traffic light network into a single operational management. 1
The central technology of the UOCT is a CCTV network of nearly 300 cameras installed in traffic hotspots of the city. The cameras work 24/7, and control room analysts are monitoring these at every hour – yet the UOCT control room works at total capacity only during rush hours. The CCTV network extends and enables the control room’s vision over the city’s critical corners, where more significant traffic congestion is generated. The primary role of CCTV is to provide images for processing by the analysts who adjust the traffic lights based on what they see.
Internally, the UOCT control room is divided into three operational registers, each managing a different group of traffic lights. The first group operates under what is internally called ‘dynamic control’, a semi-automated system managed by the SCOOT 2 software. SCOOT processes traffic flow data from sensors embedded in the pavement, automatically adjusting the traffic lights’ timings. In 2010, 400 traffic lights were included in the SCOOT system. However, this number has declined as many sensors were damaged by roadworks and never replaced. Today, most SCOOT-managed traffic lights are in areas of high traffic congestion in the highest-income districts of the city, simply because these municipalities can afford their maintenance and replacement.
The second group of traffic lights is controlled by semi-automated software using pre-programmed schedules that adjust to weekday and weekend traffic patterns. These constitute the majority of Santiago’s traffic lights and operate through pre-defined operational programmes based on historical data modelling. Analysts intervene manually when necessary, a practice known as ‘fine-tuning’, where real-time traffic conditions dictate impromptu adjustments. The third group of traffic lights follows a fixed schedule regardless of the day or time. Described by one UOCT analyst as a ‘less sophisticated’ system, these lights rely entirely on manual programming, with adjustments made only when analysts observe anomalies during specific time frames.
No matter how precise and complex the CCTV coverage gets, how images and additional data are processed depends on individual and collective ways of seeing. In other words, the traffic’s organisational management is sustained by the analysts’ ability to improvise by integrating multiple data sources (official and non-official) to fine-tune traffic lights adequately. Improvisation in these terms is sustained on experienced individual and collective experimental problem-solving practices in the control room as one of the research participants at the UOCT management highlighted, ‘who has been there before and, therefore, knows what to do’, making his way of seeing almost incontestable.
A significant skill of UOCT analysts is to work with ‘whatever tools are at hand’, as one of the control room analysts mentioned in one of my visits, and digital mappings apps play a central role in that sense. It is expected to see Waze alongside SCOOT and CCTV images at control room analysts’ setups. At one of my field observations, displayed full screen at one of the analyst’s working stations, the digital mapping app Waze notably indicated significant and unforeseen congestion along a critical highway exit. The hazard indicated in the desktop Waze app catalysed a series of discussions among the control room analysts, who swiftly validated the congestion depicted on Waze with real-time images from CCTV screens. The unfolding situation, initially detected by Waze and subsequently confirmed through various channels, including direct communication from a counterpart in another control room through WhatsApp, exemplifies the instrumental role of digital mapping and social media apps in control rooms as a tool providing updated information ‘from the ground’. Despite the immediate adjustments made to traffic light timings, the analysts recognised the limitations of their interventions in resolving the full spectrum of the congestion caused by a significant accident. This acknowledgement reflects a realistic understanding of the control room’s operational boundaries, where the solution for such extensive traffic disruptions transcends the remit of traffic light management, demanding police involvement for direct traffic control. This collaborative verification process, facilitated by integrating Waze alerts with existing traffic management systems like SCOOT, exemplifies the symbiotic relationship between third-party digital platforms and traditional urban traffic control tools existing in place.
Traditionally, a traffic hazard would be identified through malfunctioning alerts in SCOOT (which, as we know, represent a minimal portion of the entire traffic light management), by the exploratory use of CCTV, or by external communication about the hazard. Waze represents an alternative channel to represent hazards, building on the analyst’s experiences and the improvisation dynamics in the control room to fine-tune traffic lights according to what is happening in the street. Waze provides a general cartographic vision of traffic in the city and, more importantly, an additional source of information, the user-generated data, which is by nature how the digital platform feeds its content. This is not the only way by which the UOCT control room integrates users’ information; in fact, they do have a specified group of people focusing on tracking live information on social media, answering a hotline where users can call to report an incident, as well as their channels to communicate actions against hazards through their social media channels. However, Waze introduces a significant difference: it brings all that user-generated data to the cartographic dynamic platform in real time and enacts a general vision of the city.
Waze information is not taken as final or as granted by control analysts. However, it is always present and well valued by analysts, as it quickly indicates where exactly to look to triangulate with official sources such as CCTV and software like SCOOT.
This is an example of how analysts can improvise and integrate multiple data sources depending on the specific need. At the same time, it shows how alternative forms of data, most notably Waze and WhatsApp, are present in everyday practices to observe real-time unexpected hazards in traffic and communicate quickly and efficiently with other actors to confirm what is happening in the streets. In the UOCT control room, Waze and social media platforms such as WhatsApp and Twitter/X have become essential tools. These applications help analysts monitor emerging traffic situations, facilitate adjustments to traffic lights and communicate with colleagues in other control rooms and the users.
Formalising the Waze–Transantiago relationship
During my observation period at the UOCT in 2019, the role of Waze (now Google/Alphabet) was meant to change – Waze approached the UOCT to generate a data exchange partnership. This partnership involved a Memo of Understanding (MoU), which established that the UOCT, through the MTT and Waze, through Google Chile, would generate a mutually beneficial agreement. The MoU was straightforward: Waze wanted access to the operational programme data of the UOCT’s traffic lights to improve its app. In exchange, they offered the UOCT a ‘free’ dashboard based on real-time Waze data to identify 240 traffic bottlenecks in the city, and real-time average route speeds called ‘Wazeometro’ (Figures 1 and 2; Wazeometro). The agreement is part of the ‘Waze for Cities Programme’, 3 which is the ‘Waze way of free data exchange, yielding actionable insights and improved mobility on a local and global scale’ for public institutions worldwide to ‘take part in the smart solution’ on its firm-hosted platform (Graaf, 2018: 158).
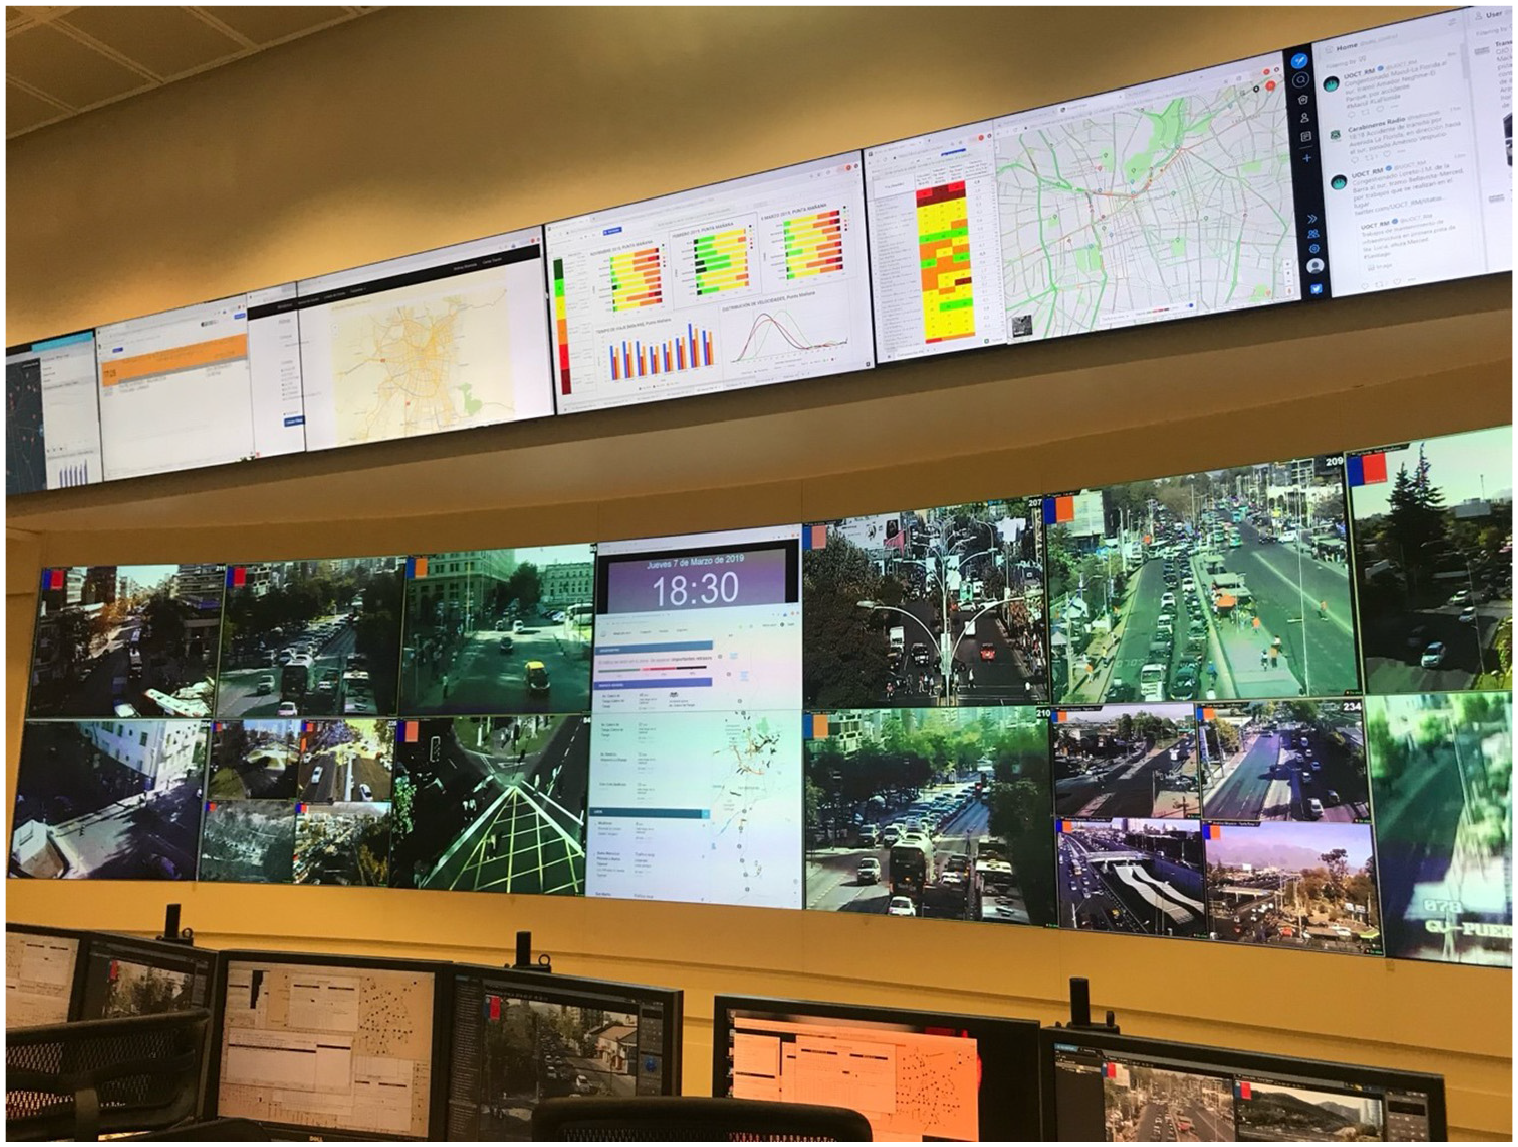
View of the central screens at the UOCT control room.
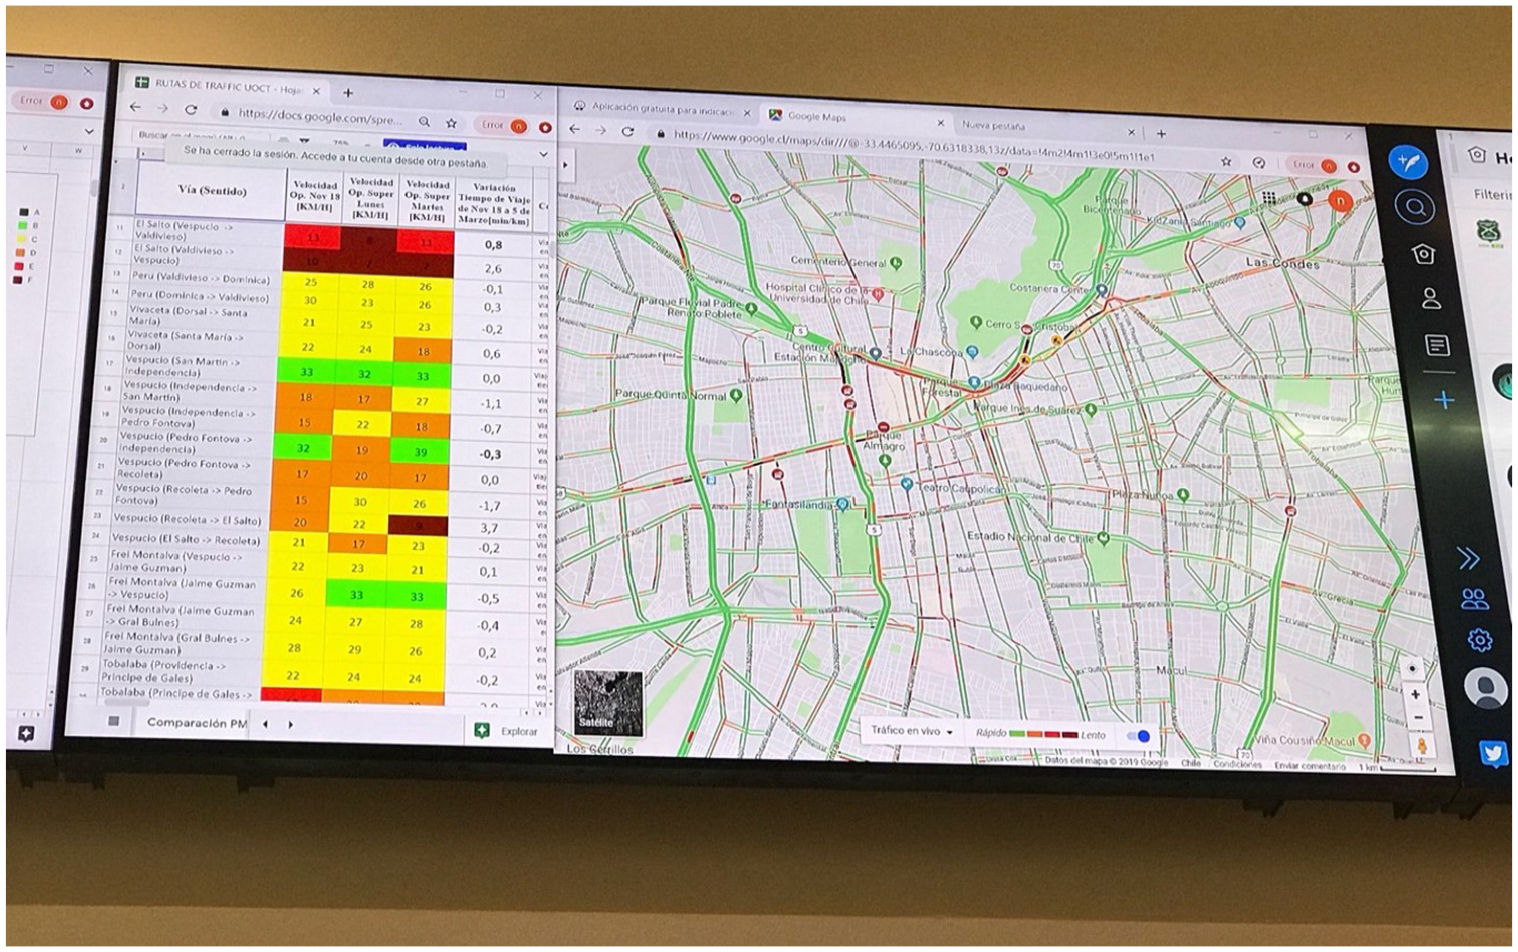
Figure shows a view of Wazeometro displayed on the central screens at the UOCT control room. The left part of the image shows the current average speed traffic heatmap calculated with Waze data, while the right shows the traffic situation using the traditional Waze map platform.
In Chile, the relationship between Waze and the government started before the partnership was formalised in 2019. There are records of meetings between MTT authorities and Waze, including its founder, Uri Levine, since 2013. 4 During that visit, both parties enthusiastically discussed their potential collaborations. The MTT proudly mentioned that the partnership would make Chile the first country to receive a ‘technological donation’ from Waze. In the same way, Levine was clear in their intentions: ‘We see Chile as a global social case study due to its capacity to adopt new technologies early on, especially those based on social networks. We want to make Chile our laboratory of the world’ (El Mercurio, 2013). However, in 2019, that relationship was established as part of Waze’s (now Google) strategy to generate multiple partnerships with key local institutions for data exchange. 5 During the launch event of the partnership between Google and the MTT, the narrative was framed towards the benefits for the government by accessing new user-generated data visualisations through Google Cloud services and improving users’ experience of the Google platform’s real-time mapping services. The MTT saw this partnership as excellent news because it came to formalise the ‘already important role of Waze as a source of data regarding the management of traffic in cities. This partnership will be essential to improve our traffic lights programming and the real-time response to transportation’ (FayerWayer, 2019).
At the UOCT, the IT team primarily managed the partnership, which was responsible for the control room’s technological needs. However, on the part of Waze, it was unclear who was in charge and in what capacity the collaboration was held. In fact, at the UOCT, different names were mentioned as counterparts from Waze, sometimes coming from the Google Chile team and sometimes people from the Waze team located in San Francisco, California. These contact points were usually sales executives from the marketing team not directly involved in developing ‘Wazeometro’. Therefore, the relationship between UOCT and Waze was not familiar or collaborative beyond the data exchange.
In practical terms, the new tool was integrated into the control as a new group of screens above the main CCTV screens. Despite its name, the product was a dashboard made in a different platform, Google Sheets and Maps, integrating the Waze data into the broader data ecosystem of Google platforms. Some indicators are shown, apart from a ‘green, yellow and red’ heatmap of the status of the 240 bottlenecks, graphs indicating average speeds in the city, and speed distributions filtered by time of the day and by date.
In the control room, the ‘Wazeometro’ was not a significant tool for the analysts’ everyday work, but neither was it seen as a problem. ‘It makes no problem to have the Wazeometro available, but I do not use it much. It has not changed things much at the control room since we already had access to the standard app, which is much more useful’, was mentioned by an analyst during one of my observation sessions at the UOCT. The ‘Wazeometro’ was mainly an additional data resource for the analysts but less relevant than Waze in its traditional form. It could be that the uses of ‘Wazeometro’ were still to be explored and discovered since its implementation in the control room was relatively new during my last observations. However, nothing indicated that it would replace the traditional form of the app, which was already widely present amongst analysts, with which they already felt familiar since they used it in their lives beyond their work at the UOCT, and that was already resolving the transport user’s data in the general cartographic vision of the city.
Once Waze’s presence in the control room was formalised, the services provided by Waze as part of the agreement did not significantly enhance the traffic analysts’ operational capabilities or the overall efficiency of traffic management at the UOCT. The data from Waze, while accessible in a more structured format through the ‘Wazeometro’, did not provide additional insights beyond what the analysts were already obtaining through the app’s standard interface, generating doubts about the partnership’s tangible benefits.
Other authorities in Transantiago and the MTT shared this influence of the standard Waze platform interphase as a benchmark for traffic management and decision-making. Their vision regarding how data needs to circulate from the different transport services to their users is reflected in their vision: ‘We need to provide users with a platform just like Waze that can provide multiple real-time data and that can help us to interact with them more effectively’ (Secretary of Transport, author interview 2019).
Discussion: Waze, improvisation and bricolage
In previous sections, I examined the UOCT control room case, focusing on how Waze is integrated into the control room’s improvisational dynamics, enabling internal data bricolage for effective traffic management. I highlighted the role of control room analysts in configuring this system by managing various data sources, particularly the widespread use of Waze, and the broader influence this integration has at the MTT.
Establishing stable connections in this system is challenging due to their inherent contingency and susceptibility to change. If one element is altered, the entire oligopticon evolves (Latour, 2005). In Transantiago, control rooms function as distinct units with specific responsibilities, yet they must coordinate seamlessly for successful traffic management. This coordination often exceeds the limits of established protocols and formal institutional governance, and the multiple actors must be enrolled, aligned and maintained in alignment as a heterogeneous yet consistent ‘machination of forces’ (Latour, 1987: 128). Sustaining these associations often depends on routine practices, such as using the same software or mobile apps, as well as foundational regulatory conditions, shared performance indicators or enforcement mechanisms. This vision is inevitably transformed when technology fails, or when new components are introduced or altered.
The introduction of Waze at the UOCT can be analysed in two ways. The first is as a non-official source of data building up across a broader ecology of tools and data registers, reshaping the data bricolage through improvisation and problem-solving. This reconfiguration shifts the internal dynamics of the UOCT while maintaining enough stability for the oligoptic network to function. Second, Waze becomes an indispensable operational tool, not just for managing traffic lights within the UOCT, but as a broader digital mapping platform that increasingly functions as infrastructure – becoming a standardised, persistent, and essential component of urban mobility (Gekker and Hind, 2020; Plantin, 2018).
Improvisation and data bricolage in traffic management
The data bricolage in traffic management is a product of heterogeneous components, including analysts’ improvisational capacities and the integration of official and non-official data sources. This ‘breadth of formal and informal digital urban applications currently constitut[es] a novel bricolage of hybrid informational ecologies’ (Marvin and Luque-Ayala, 2017: 86) that is enriched by digital platforms like Waze, which Raetzsch et al. (2019) describe as ‘elements of infrastructures’ acting as crucial intermediaries in the urban mobility ecosystem. Waze’s contribution is particularly significant, delivering real-time, user-generated data in a dynamic cartographic form. This immediacy and crowd-sourced information enable agile problem-solving in daily traffic management, which is especially vital when dealing with fragmented data or unexpected disruptions to standard traffic patterns.
Starting the on-site observations at the UOCT, my perception was that analysts functioned as technical bureaucrats, moulded by rigid organisational protocols and guidelines. However, closer observation revealed they are dynamic problem-solvers, often drawing on past experiences and improvisation. They engage in individual and collective problem-solving, frequently seeking input from colleagues and any tool seen as valuable. This shift mirrors the concept of improvisation described by Offenhuber (2019: 1569), who defines it as ‘the confluence of planning and doing, which often takes place when a solution is required in the face of an urgent challenge or need’. Furthermore, improvisation is ‘inherently social and relational’– actions are contextual, their significance shaped by their practical effects in a network of governance where actors’ mutual responses are aligned with each other’s actions.
The implementation of Waze within the UOCT highlights this improvisational ethos. The contrast between the conventional use of Waze’s app interface and the subsequent ‘Wazeometro’ tool – born from a formalised collaboration with MTT and Google – is eloquent to this iterative process. These tools have become integral to the ‘making do’ aspect of data bricolage, wherein the optimal solution is less a focus than ensuring the job is done by utilising whatever is at hand (Offenhuber, 2019). Analysts’ reliance on tools like Waze reflects not just habitual trust in familiar tools but an adaptability to innovate when facing emergent challenges. Their ability to repurpose varied data sources – from official tools to emergent digital mapping platforms – is critical in problem-solving in traffic management, enacting the strategic function of data bricolage. Through their practices, analysts exemplify the ‘embodied, acquired, thought-imbued sensitivity’ to practical urban contingencies, marking a delicate balance between routine operations and creative adaptability in the urban traffic management (Barnett and Bridge, 2016).
The UOCT case reflects what Stengers (2013: 195) describes as ‘experimental togetherness’, where the analysts’ individual and collective problem-solving is enriched by shared knowledge and experiences, both within and beyond the confines of the control room. The incorporation of Waze plays a pivotal role in this collaborative process, bringing a collective user experience into a familiar cartographic form that extends the control room’s dynamics into the wider Waze user community. This integration is a testament to the bricolage at the core of urban traffic management – analysts routinely utilise digital platforms like Waze and Google Maps, which are flexibly applied to navigate unexpected urban mobility issues. By leveraging the real-time data these platforms provide, analysts are equipped to surpass conventional methodologies, innovatively adapting their strategies to address the complexities of real-world situations.
Waze as urban knowledge infrastructure
The extensive and central uses of Waze at the UOCT control room reflect additional dynamics related to how urban platforms work by increasingly becoming urban knowledge infrastructures – an unavoidable tool for navigating the city (Plantin, 2018).
A first approach to how Waze becomes such an entrenched and unavoidable tool is the UOCT and public transport in general, primarily due to its familiarity. In its traditional form, Waze operates in a register standard for everyone at the UOCT: the control room analysts, the management, their executives, and, more importantly, the public. This also includes the incumbent staff at the UOCT as users of public transport and urban dwellers, and the extended use of the app beyond their working space reinforces its subsequent unavoidability. Such widespread use also influences how higher-level authorities conceive future services, becoming the standard and the role model of the service delivery for data sharing to Transantiago users. Therefore, as a digital mapping platform, Waze fosters ‘ontological security’ (Kitchin and Dodge, 2007) since the knowledge supporting cartography and map utilisation is regularly acquired and reinforced.
In the context of an ongoing formalisation of the relationship between the MTT and Waze (via Google/Alphabet), reflecting on the shared benefits and their consequences is essential. As seen, the agreement is framed under a narrative of collaboration and mutual benefit, consistent with the entrepreneurial, Sillicon Valley-esque ways by which platform companies aim to enrol their external partners. While the UOCT case does not reveal the full scope of this partnership’s reciprocity, initial observations suggest that the advantages may disproportionately benefit Waze and Google. Initiatives like ‘Wazeometro’ reflect this asymmetry: despite meeting the agreement’s terms, the practical advantages within the control room remain unclear. Furthermore, the service’s unilateral delivery and the company’s limited engagement in follow-up suggest that their primary interest lies in data extraction to enhance their platforms, including both Waze and Google Maps, rather than contributing to the control room’s operations. This asymmetry is particularly evident in the data exchange: while Waze gains access to valuable traffic light operational data to enhance their routeing algorithms, the UOCT receives only a visualisation tool with limited practical value beyond the standard interface.
This process aligns with how digital mapping apps become ‘knowledge infrastructures’ (Gekker and Hind, 2020; Plantin, 2018). These platforms become authoritative by aggregating multiple data sources through exchange partnerships or multimodal app integration. Then, thanks to the concentration and effectiveness of its aggregated data, digital mapping platforms can set standards as new infrastructural rules and regulations (Hind and Gekker, 2019: 146). Also, digital mapping platforms operate by practices of decentralisation of their data collection, and the recentralisation of their data flows (Plantin, 2018). This is evident in Waze’s reliance on user-generated content and partnerships for data collection, while the aggregation and processing remain opaque within the platform’s structure. This duality affects how cartographical knowledge is produced and mobilised, driven by corporate interests of market penetration and user adoption. Plantin (2018: 501) identifies a resulting paradox: while digital mapping platforms are more accessible and accurate than ever, they increasingly serve private rather than public interests, becoming unavoidable urban infrastructures. In this process, Waze gains ‘infrastructural power’ (Tavmen, 2020), acquiring significant authority in urban traffic management, even within state institutions like the UOCT. This shift demands attention to democratic governance, as it could reinforce tech companies’ power over governments and society.
Conclusion
This work presents empirical and theoretical contributions, particularly the demonstration of how Waze, originally a crowd-sourced social navigation platform, has transcended its initial purpose to become tightly ingrained both in traffic management and in the everyday urban mobilities, morphing into a ‘knowledge infrastructure’(Plantin, 2018). This process of becoming an urban infrastructure is multifaceted and consistent with how this type of platform has become unavoidable in urban infrastructure elsewhere (Courmont, 2018; Gekker and Hind, 2020; Plantin, 2018), starting by its increasing relevance as the non-official data source in the control room, responding to internal cartographical and user-generated data needs based on user familiarity. To become a pivotal element of the system, it is vital to extend its depth and reach across the oligopticon, including other control rooms and Transantiago’s users.
In conjunction with the empirical observations, the theoretical underpinnings of data bricolage have been expanded upon, particularly concerning improvisation as the confluence of planning and on-the-spot collaborative problem-solving processes that characterise urban control rooms (Offenhuber, 2019). The analysts’ engagement in ‘experimental togetherness’, as termed by Stengers (2013), emphasises a collective approach to resolving traffic contingencies that balance individual expertise and collaborative innovation.
While still in its initial stages, the partnership between Google/Waze and the MTT provides an example of the complexities of public–private collaborations in the era of platform urbanism. The asymmetries in the benefits derived from such partnerships raise questions about the reciprocity and equity inherent in agreements between governmental bodies and technology companies. ‘Wazeometro’ acts as a case in point, demonstrating how the terms of collaboration may favour corporate development over practical utility for urban governance.
Further research is needed to assess the long-term impacts of such partnerships on democratic governance and the balance of power between public institutions and tech companies. As digital mapping platforms become ever more ingrained as urban infrastructures, a growing need exists to examine the interests that drive their development and deployment critically. The UOCT’s integration of Waze raises broader questions about the influence of private interests on public resources and the potential for these platforms to override public control in favour of corporate objectives.
This highlights the need for comparative research on how control rooms in different urban settings integrate multiple data sources for transport management. Such studies could reveal diverse strategies and models that enhance efficiency and responsiveness in urban mobility. Additionally, exploring the implications of using non-official digital mapping apps and other data platforms in public transport systems is critical. This includes examining how adopting these tools impacts safeguarding the public interest, particularly concerning privacy rights and data ownership. Understanding these dimensions will provide valuable insights into how non-traditional data sources can be harnessed responsibly, ensuring their use aligns with public values and governance standards while enhancing urban transport management.
Footnotes
Acknowledgements
I would like to express sincere gratitude to Professor Simon Joss, Dr Burcu Baykurt and Dr Antoine Courmont for their valuable insights and thorough revisions of earlier versions of this paper.
Declaration of conflicting interests
The author declared no potential conflicts of interest with respect to the research, authorship, and/or publication of this article.
Funding
The author received no financial support for the research, authorship, and/or publication of this article.