
Abstract
Numerous studies emphasise that crime hot spots are antisocial activity nodes where disorder and crime are prevalent. However, researchers to date have not considered prosocial activities at crime hot spots, and how such activities compare to those at other streets in a city. We examine both antisocial and prosocial activities at crime hot spots and non-hot spots using unique quantitative and qualitative data collected in Baltimore City, Maryland, USA. We find, not surprisingly, that crime hot spots are places where antisocial activities such as adults loitering, people smoking tobacco, signs of drug activities and loud noise are much more common than on non-hot spot streets. However, we also find that crime hot spots evidence much higher levels of prosocial activities, including children playing outside, adults out on the street with their children or groups of adults socialising outside. These outcomes remain after taking into account a series of possible confounding factors. In concluding, we argue that scholars and practitioners need to reconsider how they imagine life at crime hot spots if they are to fully understand and prevent crime in urban areas. While crime and other antisocial activities tell part of the story at crime hot spots, it is not the whole story, and failing to recognise this hinders our ability to understand crime hot spots, as well as our efforts to improve them.
Introduction
Hot spots of crime have been defined as negative activity nodes, where offenders come into contact with victims, and where guardianship is lacking (Brantingham and Brantingham, 1993; Eck et al., 2023; Roncek and Maier, 1991; Sherman et al., 1989). This is in some sense the key idea of hot spots of crime, since they are generally defined by the amount of criminal activity measured in terms of official crime statistics (Weisburd, 2015; Weisburd et al., 2024c). But what if we consider hot spots of crime simply as activity nodes and ask what types of activities are found there, as contrasted with streets that are not defined as crime hot spots? It seems obvious to state that there are likely to be more antisocial activities occurring in such places. Crime and disorder are antisocial activities, and at least in terms of official crime, hot spots have more of these activities than non-hot spots (Weisburd et al., 2012, 2023). 1 But what about prosocial activities? Are hot spots of crime likely to have less prosocial activity than streets with little crime? We suspect that most lay people and researchers would answer in the affirmative.
This question is important both for providing a balanced understanding of hot spots of crime, as well as for developing interventions to reduce crime at crime hot spots. For example, if crime hot spots are places not only of high levels of antisocial activity but also of high levels of prosocial activities, this would alter underlying assumptions about the nature of crime hot spots and the people who live in these places. Our portrait of crime hot spots to date is driven by images of crime and disorder; but what if there is another story about the world of crime hot spots that suggests strong social ties between neighbours and high levels of prosocial activities? In a provocative article on ‘Black advantage’, Pattillo (2021) shows that social scientists have generally ignored evidence that in many social, educational and health outcomes, Black individuals evidence advantages over White individuals. She argues that this has reinforced negative stereotypes of Black communities and failed to recognise their vibrance and potential. Have we done the same with crime hot spots? Similarly, stereotypes of crime hot spots to date reinforce the idea that residents of these places are not able to play a key role in improving their streets. Such stereotypes often see residents of high crime communities as having little social capital and being too fearful to exercise informal social control on their streets (e.g. see Wilson and Kelling, 1982).
In this article, we take advantage of a large National Institutes of Health-supported study on crime at place that examines 449 streets in Baltimore City, Maryland, USA to shed light on prosocial as well as antisocial activities at crime hot spots as compared with non-hot spot streets. We have the advantage of having collected official data (from which we defined the status of the streets), systematic social observations conducted on the streets, survey data of people living on the streets and observations by researchers of the physical characteristics of the streets. This wide array of data allows us to develop detailed information on hot spots as activity nodes, and how prosocial and antisocial activities compare between hot spots and non-hot spots. We also collected qualitative data on many of these streets, and therefore can bring the voices of people who live on the streets or frequent the streets as part of their daily activities.
Utilising these data, our observations reinforce the idea that hot spots of crime are places where antisocial behaviour is common. This is true regarding not only crime but also adults loitering, people smoking tobacco, signs of drug activities and loud noise. Hot spots of crime in this sense live up to their definition as places with many negative behavioural and environmental elements. However, we also find that prosocial activities are more common on hot spot streets than non-hot spot streets, and that these differences remain even when considering a series of alternative explanations for our findings. Such activities as children playing outside, adults out on the street with their children or groups of adults socialising outside are significantly more likely to be observed on hot spot streets. This contradicts the everyday image that researchers often present about hot spots of crime as places defined by social and physical disorder. In concluding, we argue that this complexity is important to recognise if we are to fully understand crime hot spots, and address the problems found there.
Understanding activities at crime hot spots
Activity spaces are generally defined as a ‘set of places which an individual routinely frequents as part of daily activities’ (Corcoran et al., 2024: 1). These represent the spatial and temporal patterns of activities (Cagney et al., 2020). Neighbourhoods (or communities) have traditionally served as an important unit of analysis to understand individuals’ social activities (see Browning et al., 2017; Sampson, 2012). However, advancements in spatially located data collection and the analysis of geotagged digital trace data have enabled researchers to examine people’s activities across a much broader range of areas (Corcoran et al., 2024).
While current research on activity spaces focuses on the multiple places that individuals visit in their daily routines (Corcoran et al., 2024), our study focuses on a single micro-geographic place: the street segment (both block faces between intersections) that constitutes the immediate surroundings of a person’s residence. Although the street segment represents only one of a large set of places that individuals frequent regularly, it is arguably the place they encounter most frequently as part of their routines. In this context, the street segment can be conceptualised as a node within broader activity spaces, as conceptualised by Brantingham and Brantingham (1993). Nodes are specific locations where individuals spend significant time, and street segments – being integral to residents’ daily lives – are inherently tied to their routines and behaviours. This perspective highlights that nodes are critical points within an individual’s activity space.
Despite the increasing importance of urban mobility over neighbourhoods or communities in understanding individuals’ activities in their daily routines, micro-geographic approaches – focusing on specific micro-places within neighbourhoods – remain essential for studying individual behaviour and interactions. Wikström (2006: 87) describes micro-places as settings individuals can ‘access with their senses’, which often do not extend much beyond their immediate streets. The street segment, which is the most commonly used micro-geographic unit examined by researchers (Weisburd et al., 2024c), can be described as a ‘behaviour setting’ (see Weisburd et al., 2012; Wicker, 1987: 614). People are most familiar with life on their streets, which makes street segments crucial units of analysis for understanding individuals’ social activities and interactions (Taylor, 1997).
In the field of criminology, studies have consistently found that about half of all crime in a city is concentrated at approximately 5% of micro-places (e.g. addresses or street segments), generally referred to as crime hot spots (Sherman et al., 1989; Weisburd, 2015; Weisburd et al., 2024c). This makes street segments an important unit of analysis for study of crime in urban areas. Moreover, research has demonstrated enormous street-to-street variation in crime and disorder, which is masked when using larger geographic units of analysis (Schnell et al., 2017; Weisburd et al., 2012). This suggests the importance of examining crime hot spots at a micro-geographic level, rather than broader areas like neighbourhoods, in understanding crime and delinquent behaviours. At the same time, research consistently finds that focusing crime prevention efforts on micro-geographic crime hot spots is effective in reducing crime and disorder (Braga and Weisburd, 2022; Braga et al., 2019, 2024; MacDonald, 2024).
While examining hot spots of crime has been shown to be important both for understanding and preventing crime, there have been limited efforts to collect primary data at the micro-geographic level (as opposed to the broader neighbourhood level), and this has restricted insights into the behaviours of individuals residing in or frequenting these micro-geographic high-crime locations (White and Weisburd, 2023). While several studies have investigated residents’ attitudes and perceptions at crime hot spots, such as their perceptions of the police, through community surveys (Haberman et al., 2016; Weisburd et al., 2023; Wheeler et al., 2020), there has been relatively limited research examining the specific activities or behaviours of individuals in these micro-places.
Antisocial and prosocial activities at crime hot spots
Research focusing on micro-level crime hot spots demonstrates that disorderly behaviours, such as drug use, drug dealing and public drinking, are likely to be present in these high-crime places (Weisburd and Mazerolle, 2000; Weisburd et al., 2023). Accordingly, addressing antisocial behaviours, not just crimes, in these places has long been a key interest of criminologists and police practitioners (Wilson and Kelling, 1982; see also Braga et al., 2024). Not surprisingly, as Weisburd et al. (2024a: 3) note, these areas are often depicted as ‘chaotic, hopeless, and disordered’, which has led many policymakers and criminal justice practitioners to be sceptical about the efficacy of residents in such communities to participate in crime prevention.
On the other hand, there has been limited attention to the extent of prosocial activities in high-crime hot spots. Consequently, little research has delved into this issue, and it remains unclear whether prosocial activities also take place in crime hot spots. Although studies have examined residents’ social cohesion and informal social control (measured as collective efficacy) at crime hot spots (e.g. Weisburd et al., 2020, 2023, 2024a), they have primarily focused on residents’ perceptions or attitudes, rather than on people’s actual prosocial behaviours. Some urban research has examined behaviours like physical activity and urban gardening, particularly in disadvantaged neighbourhoods. For instance, physical disorder in neighbourhoods has been found to be related to the walkability of sidewalks, the use of parks for recreation and physical activity among urban residents (Douglas et al., 2018; Kelly et al., 2007; Mooney et al., 2017).
Additionally, specific features of micro-geographic places that facilitate social interactions and provide opportunities for crime, such as liquor stores, bars or public transit stops, are often the focus of study (Eck et al., 2023; Roncek and Maier, 1991; Weisburd et al., 2012), but again these are examined in the context of antisocial behaviours with little attention to potential prosocial activities that may occur alongside antisocial activities. For example, a bar is often viewed as an opportunistic feature for criminal behaviour due to people drinking, but at the same time, residents may come together to watch a sports game and socialise – antisocial and prosocial behaviours can co-exist in the same place.
This theme is also notable in urban ethnographic research of Black communities that highlights the various roles and multi-faceted behaviours of residents living in disadvantaged neighbourhoods to include both normative and antisocial behaviours (see Jankowski, 1991; Pattillo, 1998, 2021; Venkatesh, 1997; Wilson, 1987). While there may be higher crime rates due to the prevalence of gangs and drug markets in disadvantaged communities, there are sometimes close ties between residents and strong connections to organisations and institutions, even among individuals involved in crime, that can benefit residents. Still, this perspective is less developed and is largely focused on the close social networks that shared disadvantage and gangs can provide at the broader community level, rather than on the activities occurring on the street.
Given that antisocial behaviours are more likely to occur in crime hot spots, one might assume that prosocial activities are less likely to occur in crime hot spots. However, a recent study in Baltimore City, Maryland, found that there was no significant difference in social ties and social networks between residents at crime hot spots as compared to other streets in the urban context, with residents at the crime hot spots exhibiting quite high levels of social ties and networks (Weisburd et al., 2024a). This suggests the possibility that many prosocial activities could be occurring at crime hot spots. In this study, by taking advantage of systematic social observations, surveys and qualitative interview data from both crime hot spots and non-hot spots in Baltimore City, Maryland, we examine prosocial behaviours as well as antisocial behaviours at these places.
Current study
Data collection
Data for our study are drawn from a large longitudinal project that began in 2012 (the Baltimore Longitudinal Study of Community Health and Anti-Social Behaviour at Crime Hot Spots), funded by the National Institutes of Health. Baltimore has a population of over 600,000 people living within 92.1 square miles. The city has a large minority population, with 64% identifying as Black, and a poverty rate of 24%, which is much higher than the US national average rate of 15% (US Census Bureau, 2015). The violent crime rate in Baltimore at the beginning of the project was about four times higher than the US national average. Also, drug crime has been considered a serious problem in Baltimore.
The data include systematic social observations, physical observations, residential surveys and official crime data on 449 street segments (i.e. both block faces on a street between two intersections). A multistage clustered sampling approach based on street segments began with a population of 25,045 street segments in Baltimore City, Maryland. Using calls for service (CFS) data for 2012 from the Baltimore City Police Department that excluded all administrative calls, streets were categorised as combined drug/violent crime hot spots, violent crime hot spots, drug crime hot spots, streets with little or no crime (which were termed ‘cold spots’) and a category between cold and hot spots we termed ‘cool spots’.
We chose to study only streets with 20 or more occupied dwellings so that we were likely to gain sufficient numbers of residents on every street to study attitudes on the streets themselves. 2 This criterion decreased the sampling frame to 4630 street segments. Hot spot streets (violent, drug or combined) were randomly sampled from the top 3% of street segments in terms of either violent or drug crime CFS. 3 The non-hot spot streets were randomly drawn from the remaining population of streets, with cold spots defined as street segments with three or fewer calls for drug or violent crime, and the rest of the non-hot spot streets defined as cool spots. The final sample of street segments consisted of 449 street segments: 47 cold spots, 100 cool spots, 121 drug hot spots, 126 violent hot spots and 55 combined drug and violent hot spots.
Descriptive data on CFS for violent and disorder crimes for the sample street segments are presented in Table 1. It is apparent that the cold spot and cool spot streets differ markedly from hot spot streets in terms of the levels of official crime problems. Figure 1 illustrates the distribution of the sampled street segments across segment types within Baltimore City. As can be seen in Figure 1, there is a considerable mix of segment types within areas, although crime hot spots are more likely to be found in the city’s central areas.
Crime calls for service (2012) in sampled street segments.
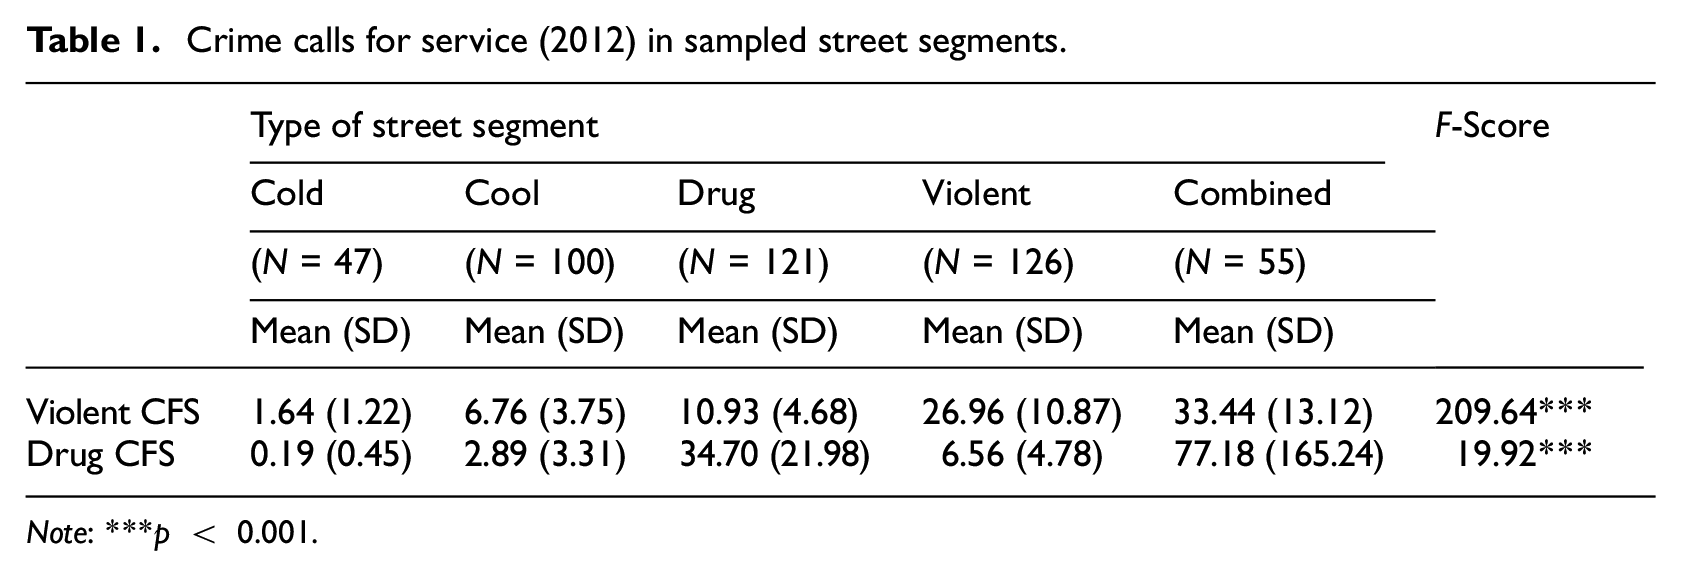
Note: ***p < 0.001.
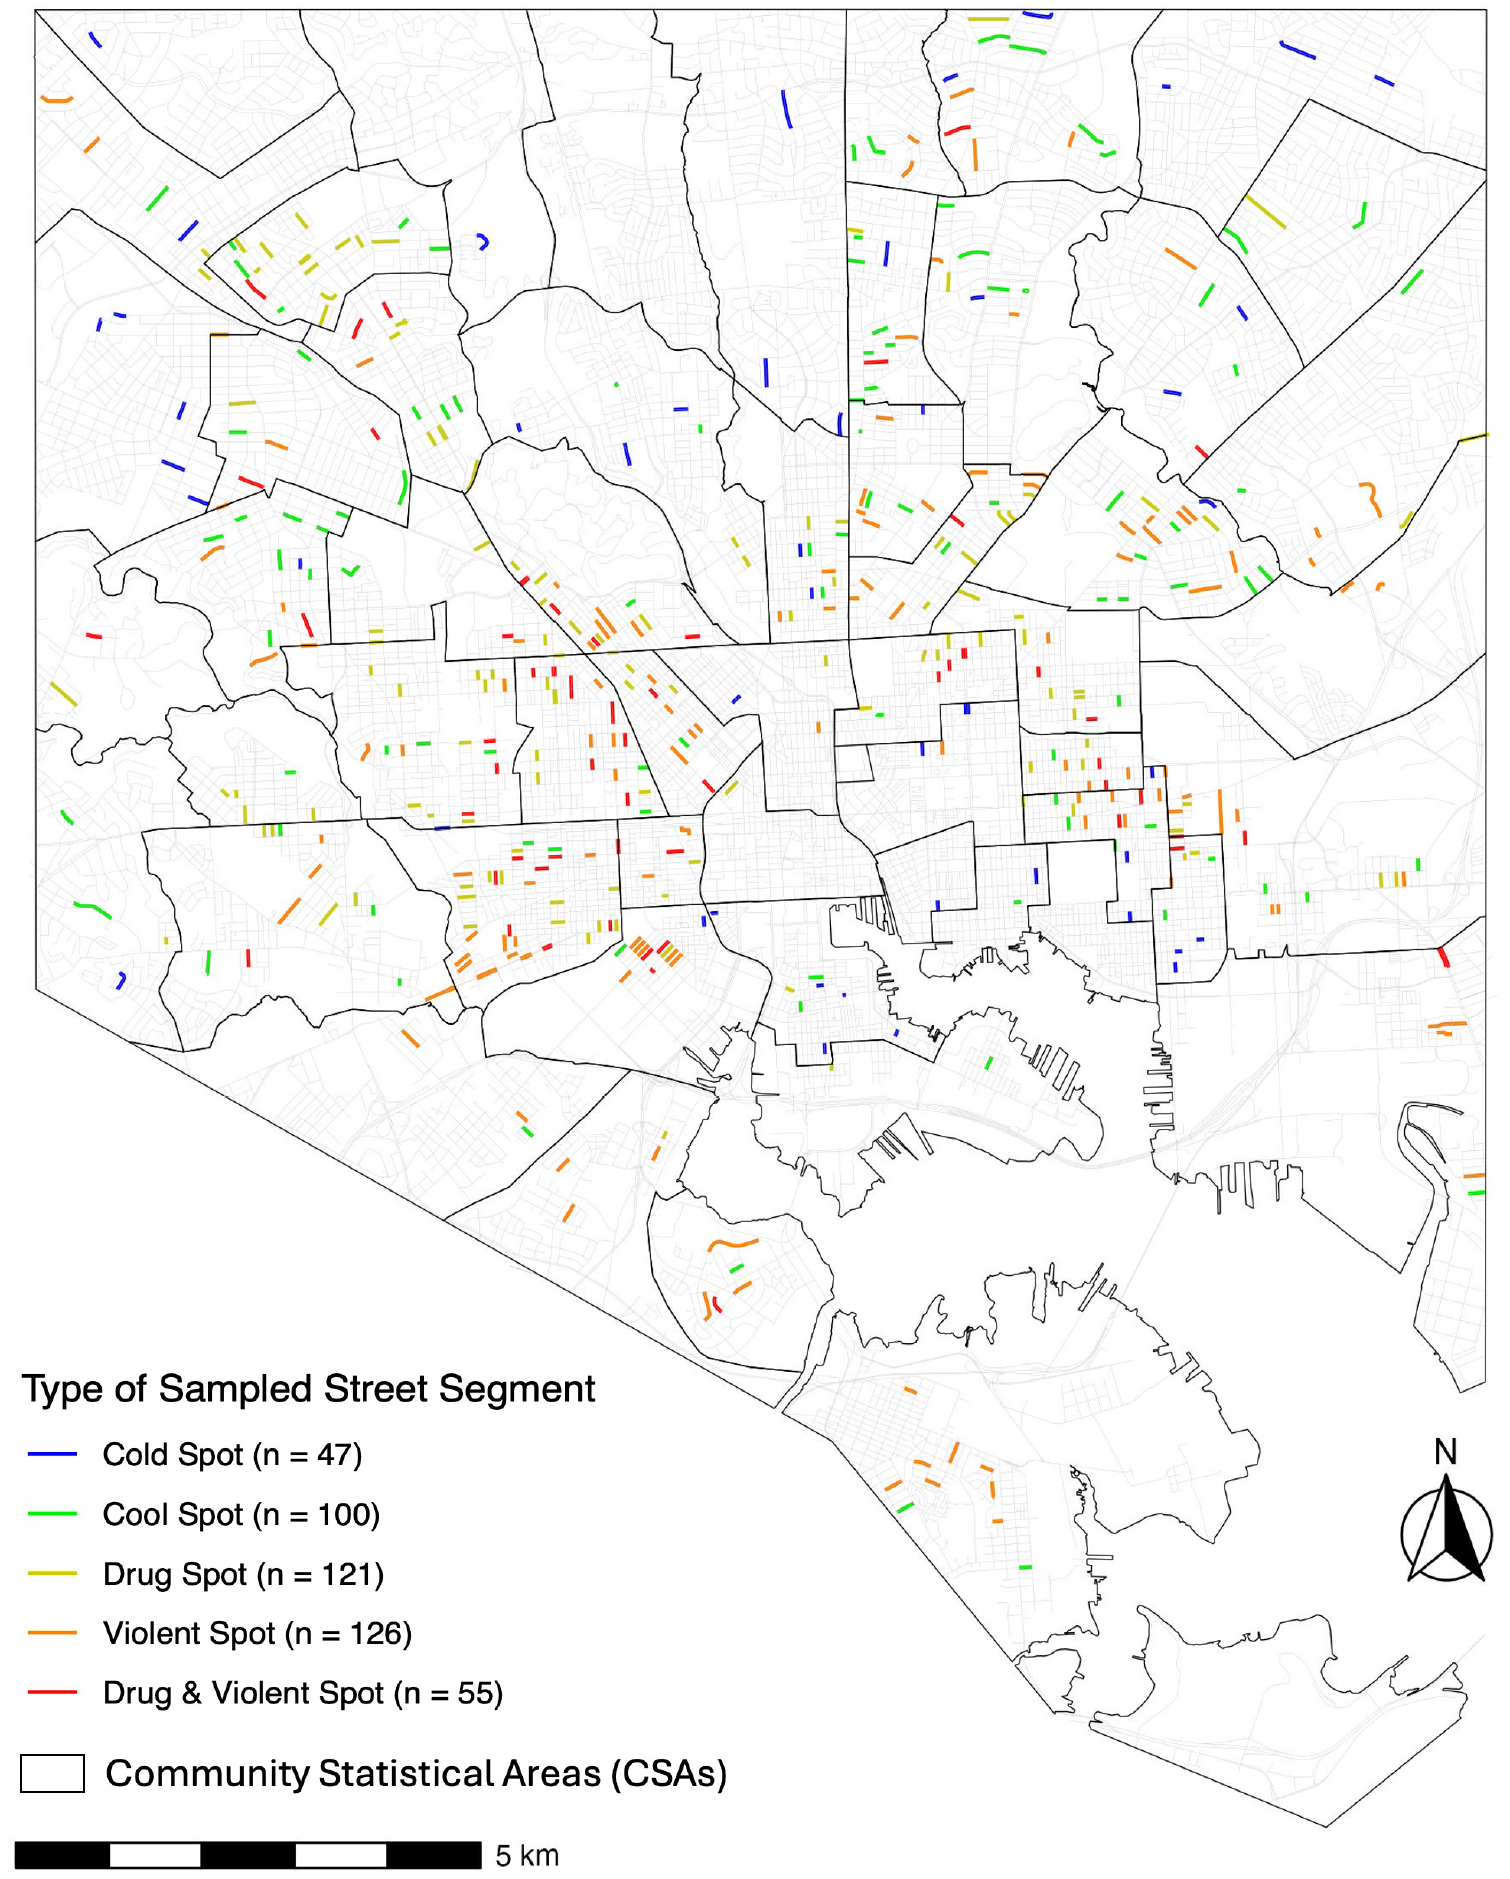
Study sample of street segments by crime type.
Field researchers conducted three systematic social observations at every sampled street segment, each lasting for 20 minutes between April and June 2014. To observe the streets at different times of day and on different days of the week, we conducted one observation during weekday hours (10 am to 4 pm), another observation during weeknight hours (4 pm to 8 pm) and another observation on the weekends (10 am to 8 pm), resulting in a total 1350 systematic social observations. The data provide a snapshot of diverse activity patterns on the street.
Door-to-door residential surveys and physical observations were conducted from August 2013 to June 2014. Residential dwelling units for the survey were randomly sampled, and well-trained field researchers interviewed the first adult resident contacted (21 years old or older) who had lived at the place for at least three months. The contact rate was 71.2% and the cooperation rate was 60.5%, which are above-average results for door-to-door surveying (Babbie, 2020). A total of 3738 residential surveys were conducted, with an average of eight surveys completed on each street.
Using an instrument and protocols for physical observation, field researchers coded a variety of physical characteristics of the streets (i.e. land use, physical structures on the street) and indictors of physical disorder (i.e. buildings with broken windows, litter, broken glasses and bottles on the street) during the summer of 2013 between the hours of 11 am and 8 pm. Two field researchers independently walked both sides of each street segment at the same time to document the characteristics of the street segment, which took approximately 20–25 minutes to complete.
We also benefitted from qualitative ethnographic field research conducted in a subsample of 67 streets. Field researchers visited a random sample of cold/cool streets (n = 24), drug hot spots (n = 21) and violent hot spots (n = 22) to engage with people on the streets and conduct semi-structured interviews. During fieldwork, researchers spent about one hour on each street segment in the subsample gathering qualitative observational and interview data. Field researchers engaged participants in conversation to delve for information using Snow and Anderson’s (1987)‘interviewing by comment’ procedure for eliciting information by making a statement that sparks a response. The specific goal of the direct observation and interviews was to illuminate how residents and participants within each street segment view, use and perceive the segment. All typed fieldnotes were then coded based on our guiding questions/themes as well as an inductive approach using open coding (Corbin and Strauss, 2014), allowing for themes to emerge in the data.
Measures of prosocial and antisocial activity
We collected a series of measures to capture antisocial and prosocial activities on the street segments. As previously mentioned, systematic social observations were conducted three times on each street segment, so we first calculated the mean for the indicators across the three observations. We used exploratory factor analyses (i.e. principal components analysis) to uncover empirically supported underlying structures within measurements of constructs related to antisocial and prosocial activities. For antisocial and prosocial activities, eight items loaded onto two constructs, with four items representing prosocial activities and four representing antisocial activities (eigenvalue = 3.08; factor loadings > 0.58 for prosocial activities; eigenvalue = 1.39; factor loadings > 0.57 for antisocial activities).
Antisocial activities included: (1) adults loitering in public for no clear reason, (2) people smoking tobacco, (3) signs of drug activity and (4) amount of noise on the block. The first two indicators were measured with a four-point scale from none to 7 or more (0 = none; 1 = 1–3 times, 2 = 4–6 times; 3 = 7+ times), the third item as yes or no (0 = no, 1 = yes) and the fourth with a four-point scale from no noise to heavy, very loud noise (0 = no noise; 1 = light, fairly quiet; 2 = moderate, fairly loud; 3 = heavy, very loud).
Prosocial activities included: (1) adults supervising or playing with children, (2) children playing games or engaging in recreation, (3) observed social activity occurring in groups (of at least three people) and (4) people eating a meal outside, such as having lunch. All were measured on a four-point scale based on the number of times the activity was observed (0 = none; 1 = 1–3 times; 2 = 4–6 times; 3 = 7+ times). For both antisocial and prosocial activities, we used factor scores derived from these items for our analyses instead of mean or sum scales, as the variables were measured on different scales.
Analytic strategy
We first conducted analysis of variance (ANOVA) to determine whether there are significant differences in antisocial and prosocial activities across the street types we examine. We then performed a series of chi-square tests to examine whether individual measures of antisocial and prosocial activities differ across the street types. Given that the relationship between street segment type by crime and antisocial and prosocial behaviours can be confounded by a third factor, we examined the levels of antisocial and prosocial activities between the street segment types across potential confounders, including population level, street size, residents’ mean age and the presence of minors, using a series of ANOVAs. As sensitivity analyses, we conducted ordinary least squares (OLS) linear regression models in which the confounding factors are included alongside our key independent variable, street segment type. Lastly, we used qualitative observations and interview data to further illustrate antisocial and prosocial activities as interpreted by residents and visitors on the streets.
Findings
Table 2 presents the factor scores for antisocial and prosocial activities by type of street segment. The differences in antisocial activities were large and significant between the street types (F-score = 22.98, p < 0.001). As expected, the level of antisocial activities was much lower at cold and cool spots compared to crime hot spots.
ANOVAs for antisocial and prosocial activities factor scores.
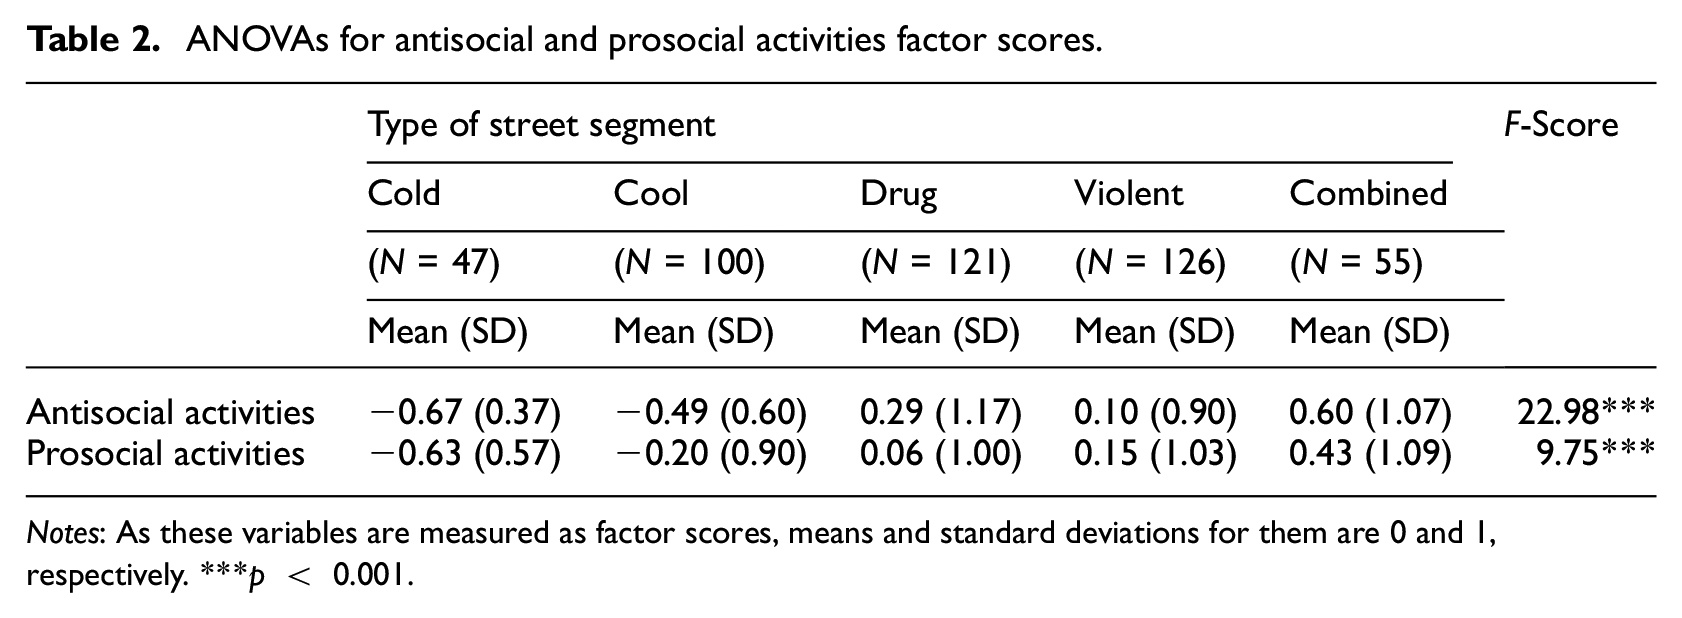
Notes: As these variables are measured as factor scores, means and standard deviations for them are 0 and 1, respectively. ***p < 0.001.
The general evidence that antisocial behaviours are common at crime hot spots as opposed to non-hot spots is reinforced when examining the specific items in our scale (see Table 3). As is apparent, across all four individual measures, the level of antisocial activities – such as adults loitering in a public space for no clear reason, people smoking tobacco, any signs of drug activities and the amount of noise – was higher at crime hot spots (i.e. drug spots, violent spots, combined drug/violent spots) than cold and cool spots. According to the chi-square tests, the differences between the segment types on all four individual measures were statistically different at the 0.001 significance level.
Individual measures of antisocial and prosocial activities by street segment types.
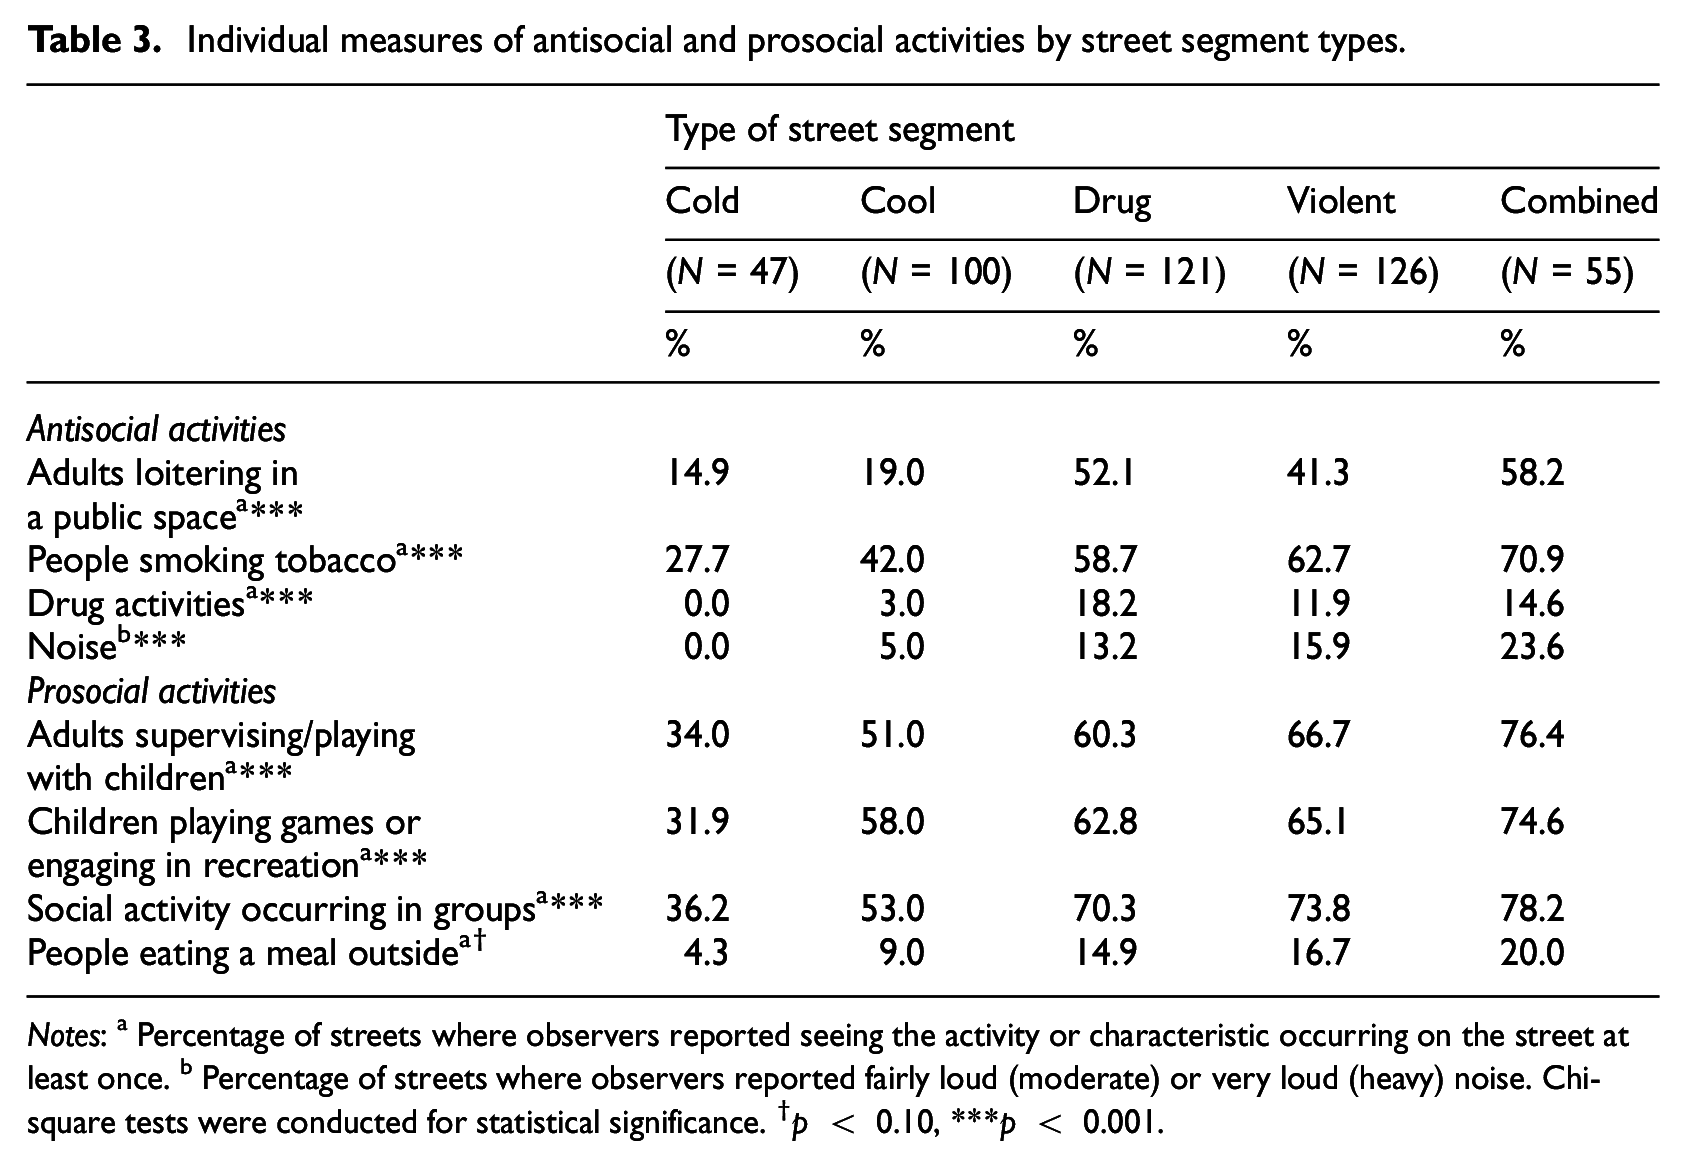
Notes: a Percentage of streets where observers reported seeing the activity or characteristic occurring on the street at least once. b Percentage of streets where observers reported fairly loud (moderate) or very loud (heavy) noise. Chi-square tests were conducted for statistical significance. †p < 0.10, ***p < 0.001.
Notably, these differences were very large in magnitude. While adults loitering in a public space were observed in only 15% or 19% of the cold or cool streets, this was observed in more than 41% of the hot spot streets (and almost 60% of the streets in the case of the combined hot spots). While the range in the non-hot spot streets for people smoking on the street was between 28% and 42% of streets, in the case of hot spots it was between 59% and 71%. For drug activities or noise, no observations were made on cold streets, and only 3% and 5% respectively on the cool streets. But such antisocial activities were observed on 12% or more of the hot spot streets. Our findings regarding antisocial activities closely align with the prior literature on crime hot spots and reinforce previous findings that hot spots of crime are not simply hot spots of official crime but evidence higher rates of other social problems (Weisburd and White, 2019; Weisburd et al., 2023, 2024a).
What runs counter to common assumptions is our findings regarding prosocial activities. Prosocial activities were much more likely to occur on hot spot streets than cool or cold streets (see Table 2). The overall differences between the street types were again strongly statistically significant (F-score = 9.75, p < 0.001).
Our finding that prosocial activities were more common at crime hot spots compared to non-hot spots is confirmed when we examine the specific measures in our scale (see Table 3). Three of the measures – adults supervising or playing with children, children playing games or engaging in recreation and social activity occuring among groups of adults – were statistically significant at the 0.001 level, with hot spot streets evidencing higher levels of prosocial activities. The differences were large in magnitude, especially when comparing the combined hot spots with cold spots. For all three measures, these activities were more than twice as likely to be observed on combined violent and drug hot spots as on cold spots. For one measure, people eating a meal outside, the difference between street types, while in the same direction as the other measures, was not statistically significant (p = 0.078).
Ruling out alternative explanations
While these findings are strong, we wanted to consider possible confounding factors that would explain our results, especially regarding prosocial activities. With this in mind, we first considered whether the level of social activities observed was simply a function of the population of the streets examined. Cold streets in our sample were often less populated streets, in which single- or two-family homes dominated. Accordingly, it could be that there were more antisocial and prosocial activities on hot spot streets because those streets also tended to have larger populations housed within multiple dwelling units and apartment buildings.
Figures 2(a) and 3(a) divided the street segments into three groups based on the population of the streets, which varies between 39 and 734 in our study. 4 What is apparent from Figure 2(a) is that whether the streets were in the low, medium or high population categories, the general findings hold regarding the relationship between type of street and antisocial activities. Street type was statistically significant (p < 0.001) and crime hot spots had higher levels of antisocial activities for each of the three groupings.
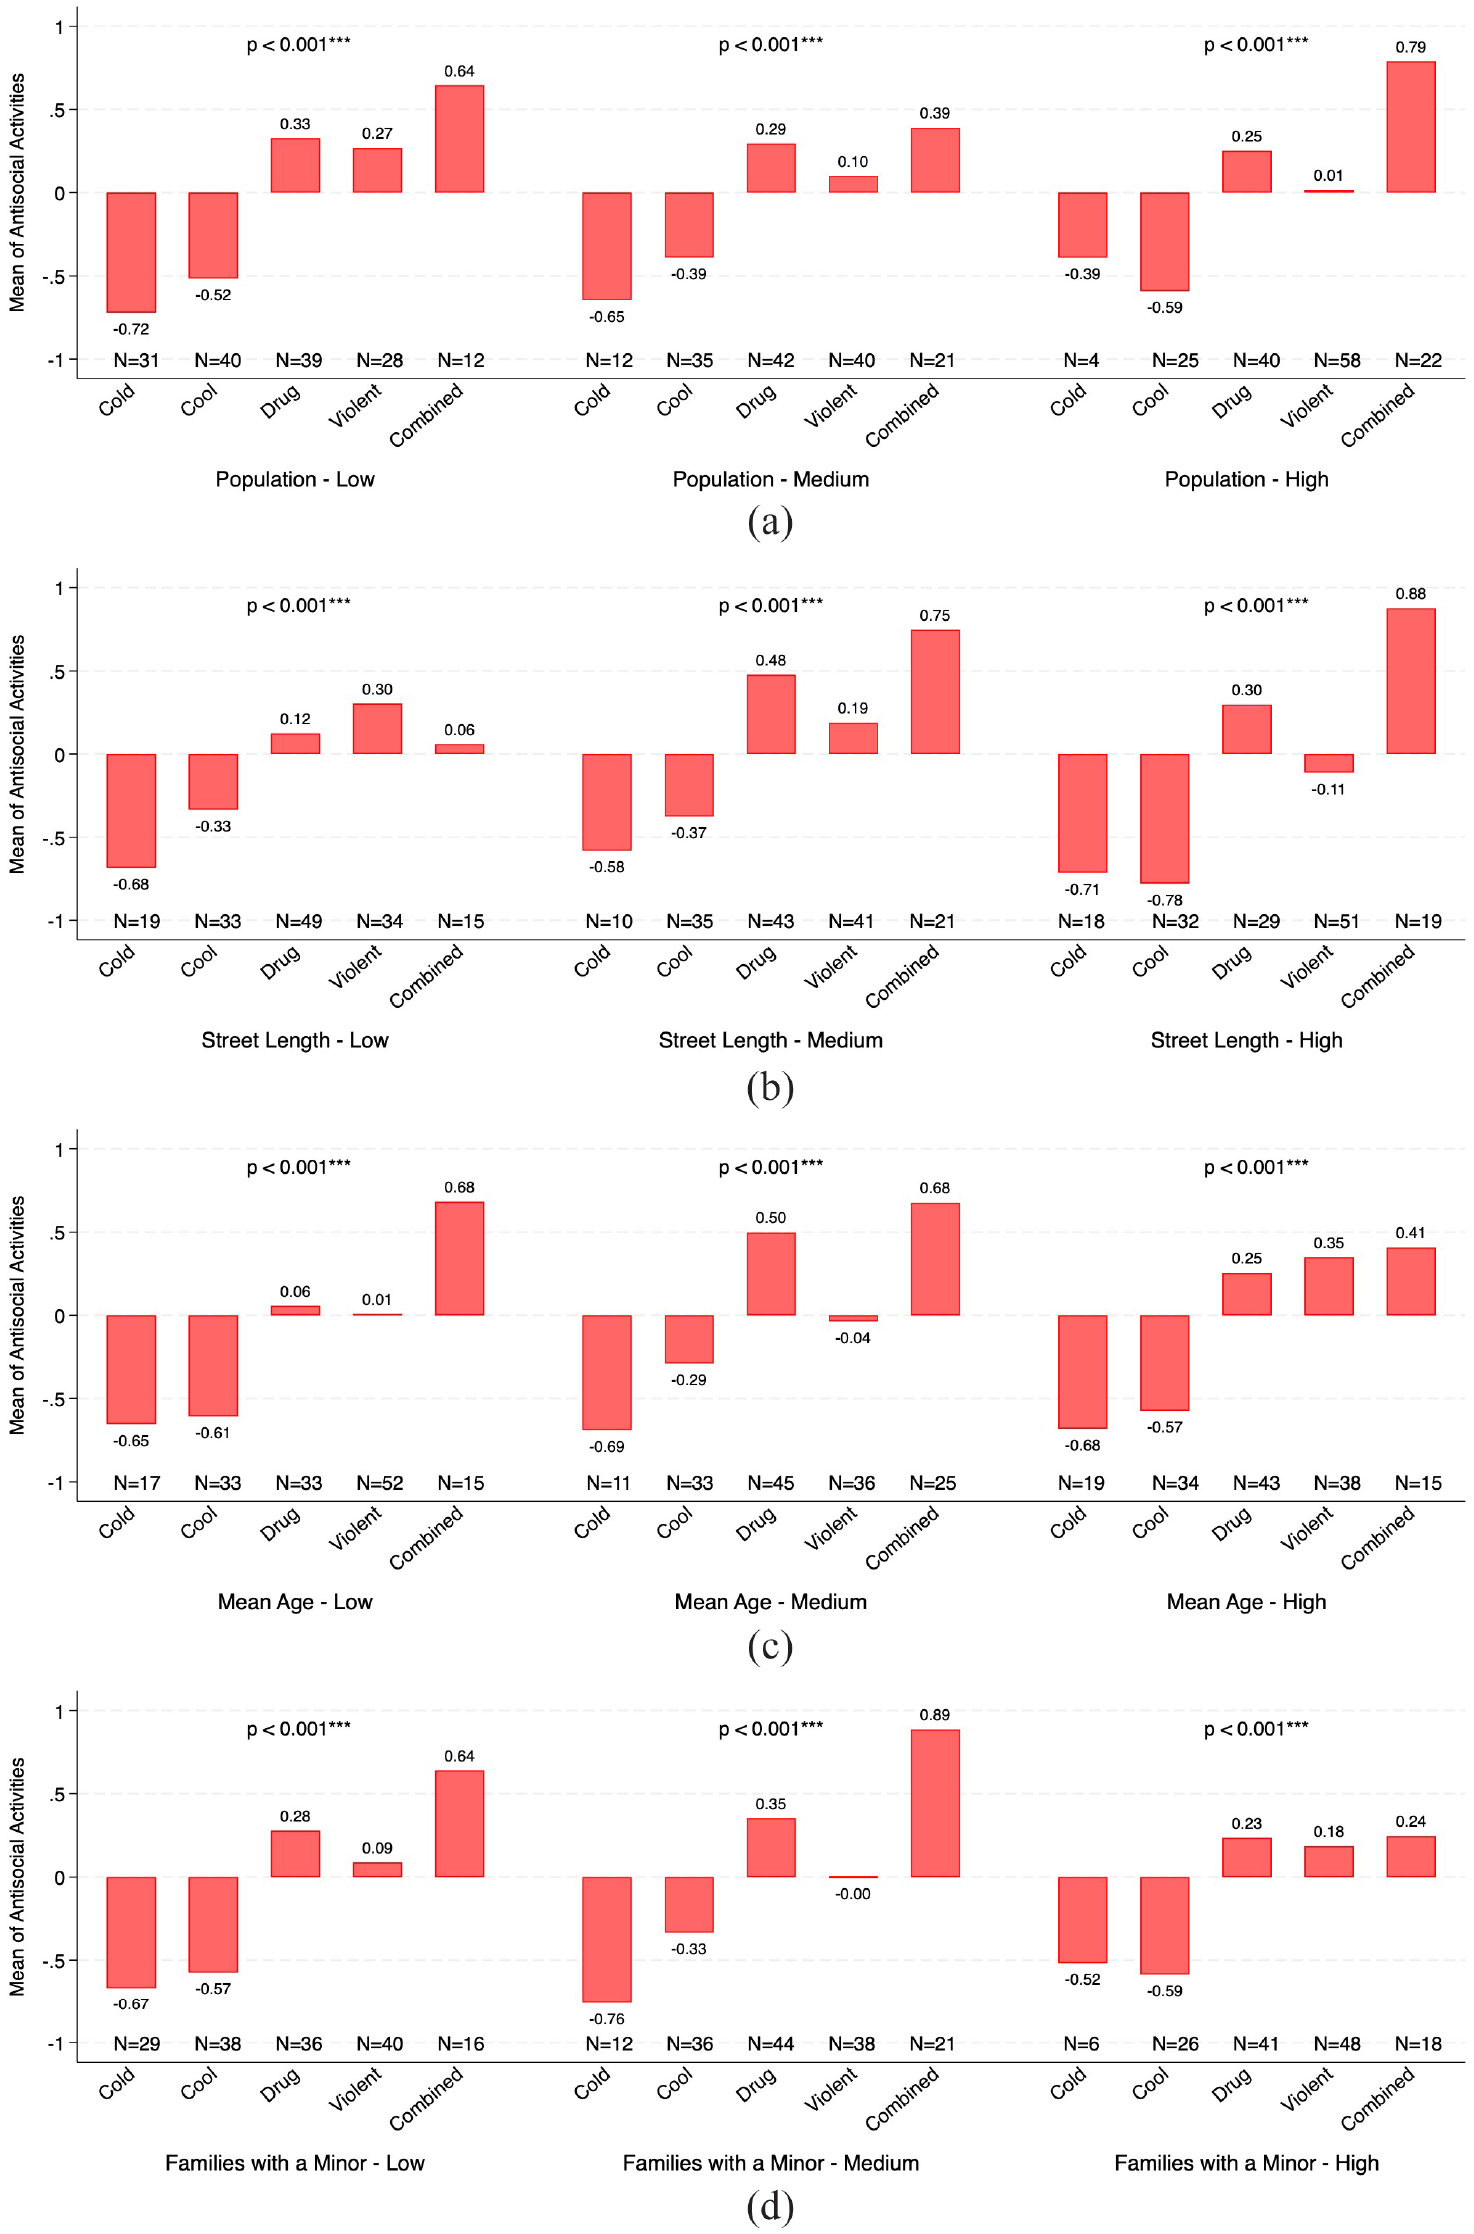
Antisocial activities by street types by potential confounders. (a) By street population level. (b) By street length level. (c) By residents’ mean age level. (d) By families with a minor level.
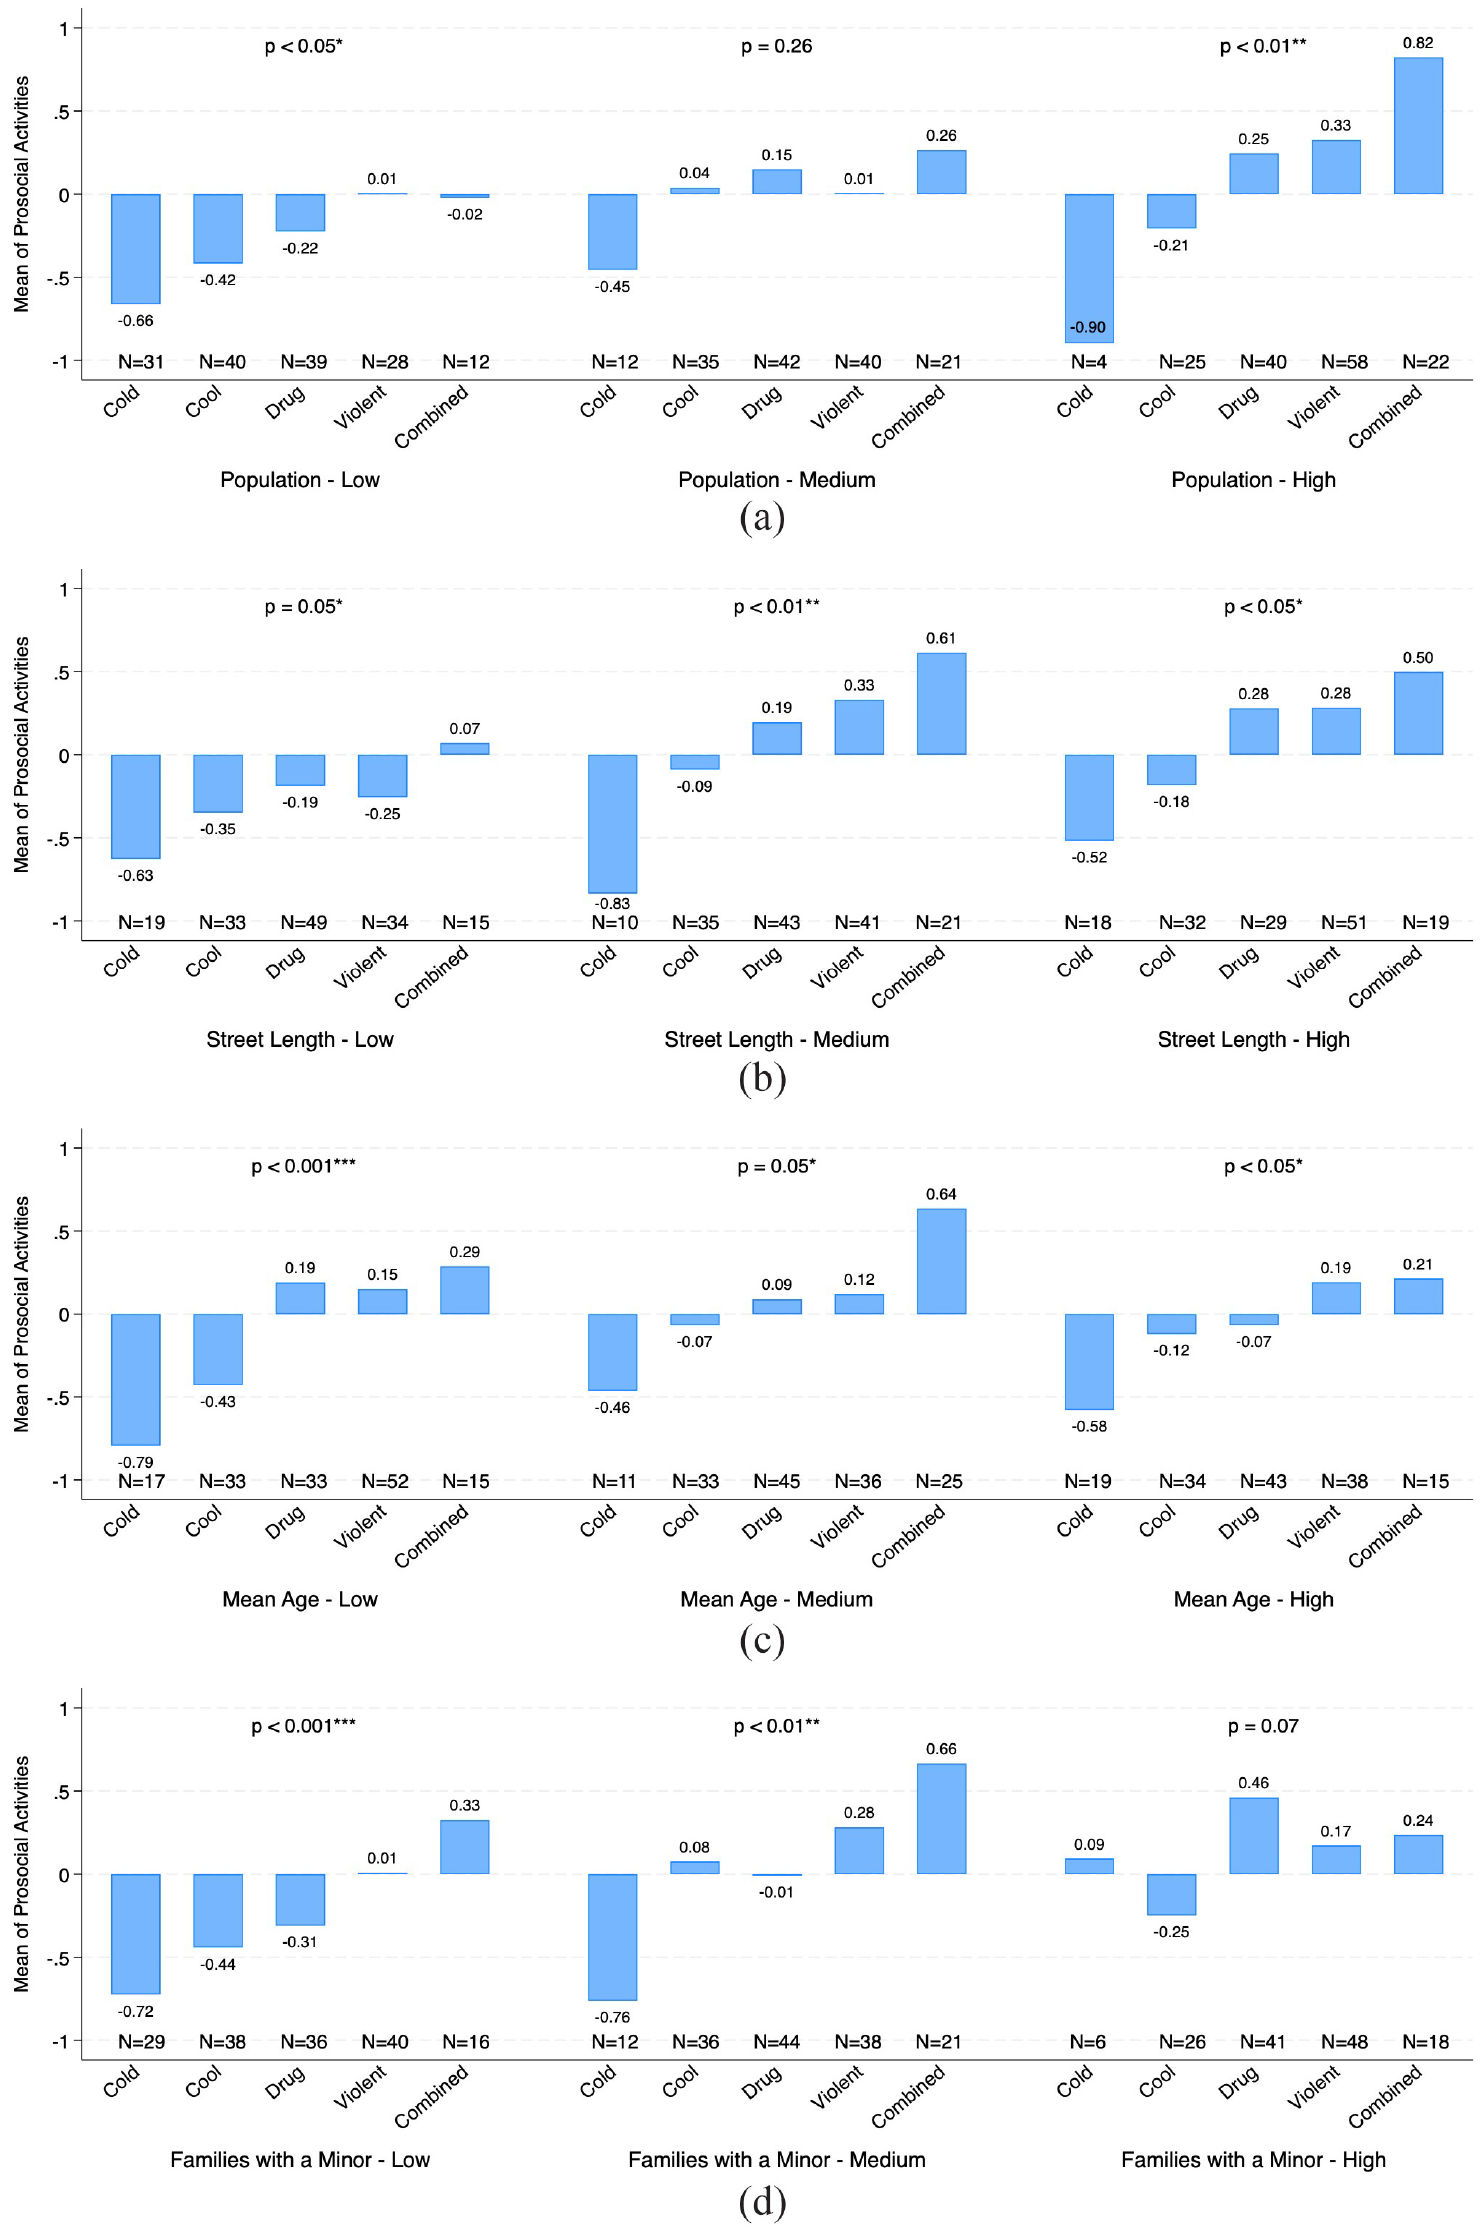
Prosocial activities by street types by potential confounders. (a) By street population level. (b) By street length level. (c) By residents’ mean age level. (d) By families with a minor level.
In the case of prosocial activities, street type was significant for both low (p < 0.05) and high (p < 0.01) population streets, and the hot spots had the highest levels of prosocial activity and cold spots the lowest levels (see Figure 3(a)). While the level of prosocial activities was not significantly different across street types with medium population levels, combined hot spots had the highest levels of prosocial activities and cold spots the lowest in that sample.
Another possible explanation for our findings is simply that on longer streets there is more likely to be more antisocial and prosocial activities. Our streets ranged in length from 125 to 2001 feet. However, the length of the street does not seem to alter the overall trends that we observe. Type of street was statistically significant for antisocial activities (p < 0.001) across all street length categories (see Figure 2(b)). The cold and cool spot streets had less antisocial behaviour in each of three categories – short, medium and long streets. 5 For each street length category, there was significant variation in prosocial activities across the street segment types, with hot spots showing more positive outcomes on our factor score measure (see Figure 3(b)). The cold spots clearly stood out with the lowest levels of prosocial activities.
Another possible explanation for our findings is that hot spot streets tend to have younger populations who are more likely to be on the street and frequent these micro-geographic activity nodes. 6 But again, for the three categories we created, the findings hold overall for antisocial activities. Street type was significant for each of the three age categories (p < 0.001), and hot spot streets in each of the average age groupings were much more likely to evidence antisocial activities than non-hot spot streets (see Figure 2(c)). In terms of prosocial activities, the findings again hold overall, with street type differing significantly for each grouping, and hot spots having higher levels of prosocial activities (see Figure 3(c)).
Finally, another possible explanation for our findings, especially in regard to prosocial activities, is that when there are families with children, there is likely to be more activity on the street. 7 This does not appear to affect our overall findings in regard to antisocial activities. Once again, street type was statistically significant across the three groupings (p < 0.001), and hot spots had overall higher outcomes than the non-hot spots (see Figure 2(d)). Regarding the relationship between having more families with children and prosocial activity, the findings follow the general pattern. The differences between the street segment types are significant for both the smaller (p < 0.001) and middle categories (p < 0.01). Combined hot spots anchor the high point of this comparison, and cold spots the low point. In the case of high family streets, the findings are not statistically significant (p = 0.07), but the crime hot spot groupings are again higher on the prosocial measure than the non-hot spots.
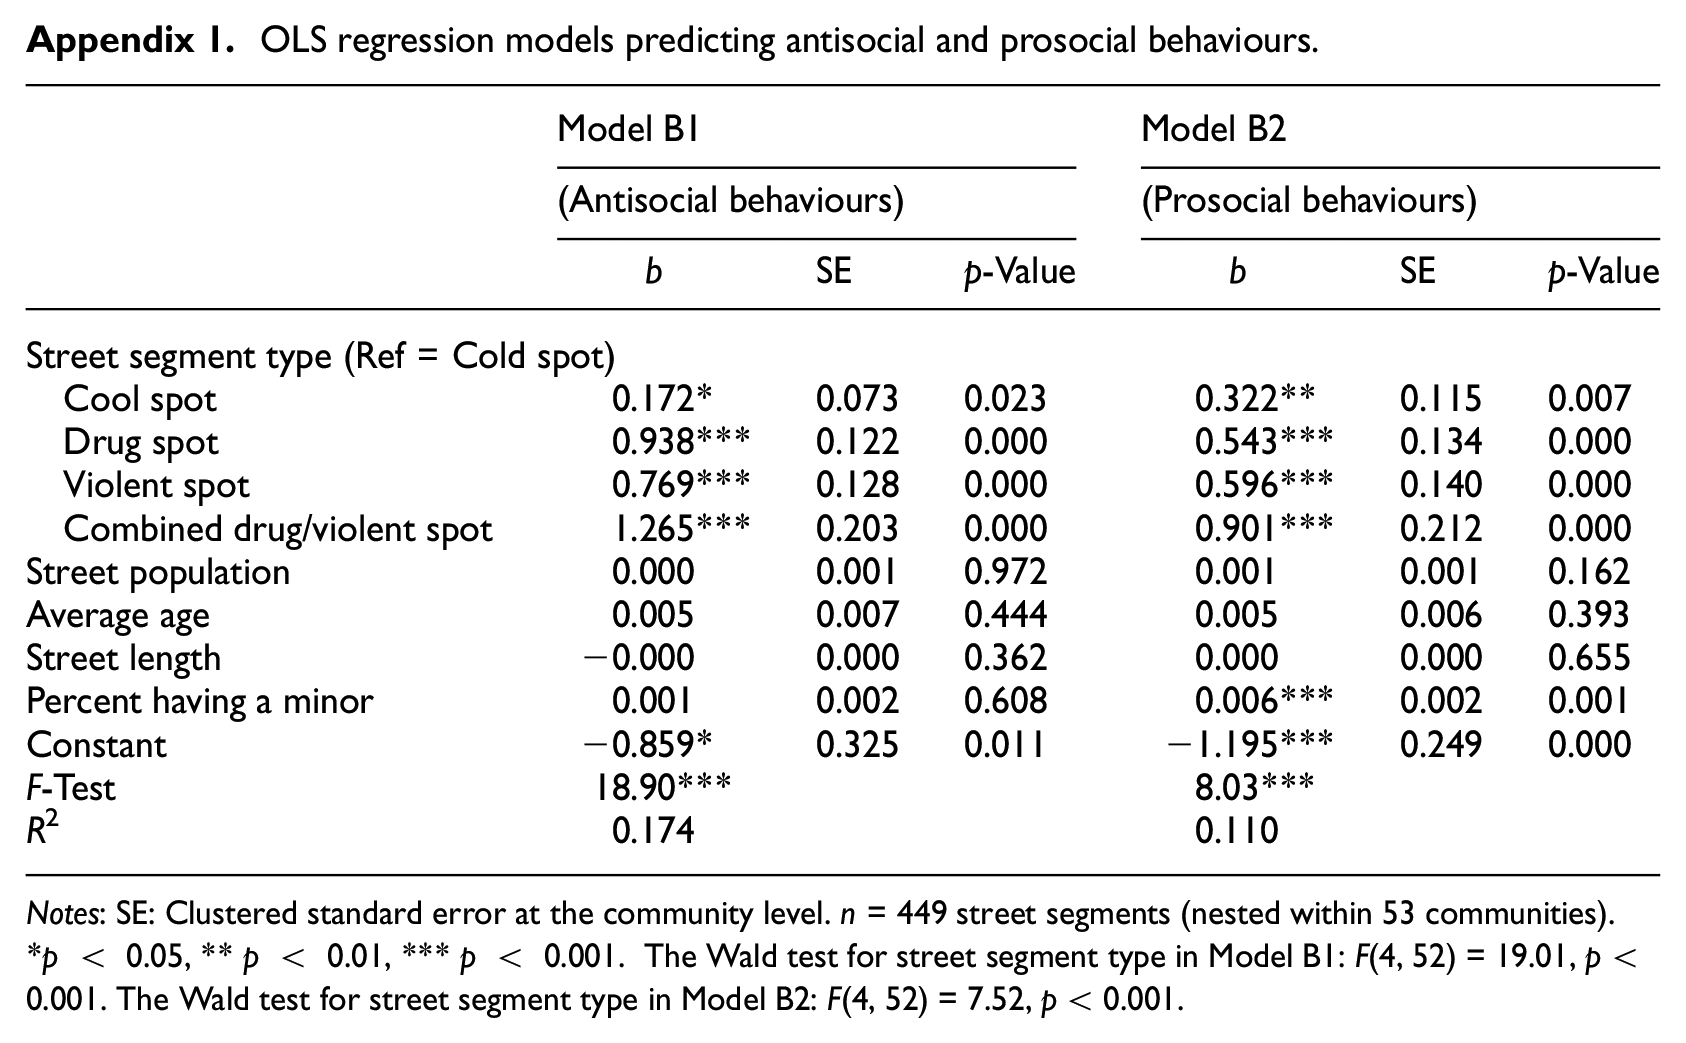
As a sensitivity analysis, we performed OLS regression models with clustered standard errors, including the possible confounding measures noted above alongside with our key independent variable, street segment type. According to the Wald tests using the testparm command in Stata 18, the street segment variable continues to be statistically significant at the 0.001 level in both the antisocial and prosocial activities models after controlling for confounders (see Appendix 1).
Qualitative research findings
Qualitative field observations and informal interviews with residents reinforce our quantitative findings. While qualitative researchers in our study observed more physical and social disorder on the crime hot spots, they also made note of residents sitting outside visiting with neighbours or people getting together, kids playing and adults supervising or playing with kids. In contrast, field researchers often noted the cleanliness of the cold and cool street segments with well-maintained homes, but also commented on how little street activity occurred on some of the cold streets –‘No one came onto the segment in the 40 minutes I was there, with the exception of a mailman on foot’ (SID 17864 8 ).
Field notes from one combined hot spot in particular (SID 5989) that had 40 calls for drugs and 23 violent CFS in 2012 (when the study began) highlight the complexity of the social environment of the hot spot streets and that prosocial and antisocial behaviour can coexist together. The field researchers noticed immediately that the street was very lively and busy, with several people on the street sitting on their porches, including two older men playing a game of chess. While observing from the car, the field researchers saw a man, roughly in his 30s, with headphones in his ears, singing and dancing, while another older man across the street was picking up trash and weeding. The field researchers approached this man to ask about crime and recreational activities for children on the street. The man pointed to a park, ‘but that’s it … there is no YMCA or anything … kids play on the street right here’ as he pointed down. After speaking with the man and about to leave, the field researcher noticed that the man had a green bag with marijuana in it, and observed a black bag in front of him that may have contained other drugs. The field researcher noted: ‘We were shocked that he was dealing/handling drugs right in front of us and a small child … we also found it odd that he and the woman were drinking in front of the child in the middle of the day. They were very friendly, though’.
On a violent street segment (SID 20720), there was a large park on one side of the street with a baseball field, a track and a large green area where some people were doing exercises, others were walking dogs and some were running. The sidewalk on the side of the street where the park was located had almost no trash and was clean, with a sidewalk that looked well maintained. The sidewalk on the side of the street with the homes was broken in many places, with parts of the concrete missing and in need of repair. It had more trash on it, mostly household items, chip bags and soda cans. The field researchers also made note of a ‘No Loitering’ sign, residents visiting outside on the steps of a home and two young boys running on the sidewalk. Here we see indicators of physical disorder along with prosocial behaviours. A resident commented on the activities that neighbours engaged in – the neighbours all knew one another and did things together. Her son ran into the neighbour’s house and she said that she ‘never worried about them on the block’.
On one of the drug spots that had nearly 100 calls for drugs, 16 calls for violence and 91 calls for other issues in 2012 (SID 21149), the field researchers made note of a few homes that had barbeques left out; one with a barbeque also had a table and chairs with coffee cups and utensils still out. This yard had toys all over the front yard and other household trash/yard items like paper plates and rakes as well. It appeared that there had been some type of gathering that no one had yet cleaned up. Many of the yards had plastic outdoor furniture on them, mostly chairs, and many had toys out front too. The field researchers spoke with two older female residents who were visiting together on one of their porches.
These observations from different hot spot street segments reinforce our quantitative findings and demonstrate that the social environment at crime hot spots can include both prosocial and antisocial activities. While crime is high, buildings may be boarded up, yards not maintained and antisocial activities exist, residents of hot spots also spend time outside, including children playing, and they engage in socialising with neighbours and look out for one another.
Discussion
Our findings are highly consistent with the image of crime hot spots as activity nodes with high levels of antisocial activity (Weisburd and Mazerolle, 2000; Weisburd et al., 2023). As we noted at the outset, this is not surprising, given that we define crime hot spots by levels of officially recorded crime (Sherman et al., 1989; Weisburd, 2015; Weisburd et al., 2024c). Many crime calls to the police are for social and physical disorder, as well as drug crime. And indeed, two of our hot spot categories were defined at least in part by high levels of drug crime. However, our findings suggest that these hot spots are also places where other antisocial activities are common, such as adults loitering in a public place without a purpose, people smoking tobacco and loud noise.
What is perhaps surprising from our data is that the crime hot spots are not simply places where antisocial behaviour is common, but also places where prosocial activity is common, at least as compared to streets with little crime. Importantly, we found that these findings are not attributable to confounders such as population size, street length, age demographics or the number of families with minors. Instead, our data suggest simply that both antisocial and prosocial activities are more common on crime hot spot streets.
This requires a change in our view of hot spot streets in the urban context which sees them only in terms of negative activities, to one which presents a more balanced portrait of street life in these places. This is consistent with our more general findings regarding life on these streets. A recent study demonstrates that, despite frighteningly high levels of crime, residents of crime hot spot streets have similar levels of social ties and social networks as residents of non-hot spot streets (Weisburd et al., 2024a). Although residents of hot spot streets exhibit lower levels of informal social control than streets with little crime (see also Weisburd et al., 2020), that study finds that the presence of lower informal social control does not mean that it is entirely absent (Weisburd et al., 2024a). These are not places of chaos and hopelessness; they possess meaningful levels of informal social control and guardianship (Weisburd et al., 2024a).
According to Wilson’s (1987) work on urban poverty and the underclass, the need for illegitimate activities, such as drug dealing, is a result of the systemic disadvantage and the associated problems, like social isolation, gangs and drugs, embedded in inner-city minority communities. However, it does not necessarily translate to acceptance of crime and violence; rather, residents still subscribe to mainstream values and norms of family, hard work and law abidance; these are just more difficult to obtain in the underclass (Wilson, 1987). Our findings are consistent with this idea and also align with Pattillo’s (1998) ethnographic study of disadvantaged neighbourhoods in Chicago, which demonstrates that dense networks in those areas enable both legitimate and illegitimate activities to coexist (e.g. gangs alongside community organisations). In a recent article, Pattillo (2021) argues that social scientists have further stigmatised disadvantaged Black communities by ignoring evidence of Black advantages in areas related to family networks, education and health. She notes that recognising advantages in the Black community can both empower Black communities and facilitate different approaches to improvement that capitalise on Black advantage.
We think our data tell a similar story about people who live in crime hot spots. To date, scholars have focused on the disadvantages found in these places and have seldom considered the advantages of people in crime hot spots. This is not an unimportant story. Recognising the problems in crime hot spots can help to bring much-needed resources to dealing with crime in those places, including policing, but also other resources such as sanitation improvements, parks and community centres (Weisburd et al., 2021). And recent research showing health disadvantages at crime hot spots can alert cities to the special public health needs of hot spots of crime (Uding et al., 2024; Weisburd and White, 2019). However, a view of crime hot spots that does not recognise the specific advantages of these places can impede our efforts to reduce crime rates and related problems at hot spots.
Policymakers and criminal justice practitioners, particularly the police, should reconsider the traditional view of crime hot spots as purely negative environments. While these are the streets in the urban context which contribute most to the crime problem, they are also places where prosocial activities are common. The key question in this regard is whether we can capitalise on prosocial activities to improve crime hot spots. One might argue that the fact that there are higher levels of prosocial activities at crime hot spots suggests that there is little connection between such activities and efforts to reduce crime and disorder. If there were such a connection, why do these places have such high levels of crime and other antisocial activities?
We think this is the wrong frame with which to look at prosocial activities. There is no evidence that simply having prosocial activities on a street will reduce crime, although some scholars have argued that informal social controls will be heightened when there are ‘eyes on the street’ (Jacobs, 1961; see also Eck et al., 2023; Linning and Eck, 2021). Residents of such places cannot solve serious crime problems on their own. Drug dealers and other violent people are commonplace in crime hot spots (Weisburd and Mazerolle, 2000). Our researchers often had to leave streets when there were signs of danger from guns, knives or gangs. In a couple of instances, field researchers were present on streets when gunshots were fired. For residents, intervention can be risky. Similarly, residents on their own cannot solve sanitation problems and improve health services. What we are suggesting is that the police and other city agencies must recognise that they have partners on these streets who can work with them to ameliorate problems (Weisburd et al., 2024a). Our evidence regarding prosocial activities is an indication of the capabilities of residents of hot spot streets to become partners in such efforts. Recognising ‘hot spot advantage’ can play a key role in advancing partnerships between city agencies and residents of crime hot spots.
In turn, a growing body of research suggests that improving informal social control is key to reducing crime at hot spots (Weisburd et al., 2012, 2020, 2021, 2024a). In this context, finding ways to enhance community social control by leveraging the high levels of prosocial activities at crime hot spots could be beneficial. By fostering and supporting the positive social dynamics observed in these places, such as community gatherings, neighbourly interactions and recreational activities for children, strategies aimed at reducing crime can be more holistic and effective. This approach may not only reduce crime and disorder but also enhance the overall quality of life on these streets, making them safer and more vibrant places for all residents. Subsequently, these improvements will contribute to the overall amelioration of urban areas in which crime hot spots are found.
This study is not without limitations. First, the data were collected in Baltimore City, Maryland, a city characterised by very high levels of crime, disorder and drug-related issues compared to many other cities in the USA and other countries. While the high levels of crime and disorder made it an ideal site for studying the dynamics of antisocial and prosocial behaviours, we need additional studies of cities with relatively lower levels of crime to gain a more general understanding of these issues. Second, although we conducted systematic social observations three times across different time periods, along with qualitative ethnography and interviews on our sample streets to comprehensively capture people’s lives and activities, these observations are still only ‘snapshots’ of behaviour at particular moments (see Sampson and Raudenbush, 1999). State-of-the-art digital trace data, which can capture peoples’ activities across diverse time and places comprehensively, may offer a new opportunity to observe these behaviours with greater temporal and spatial granularity in future research (see Corcoran et al., 2024). Lastly, our measures of prosocial and antisocial behaviours may not fully capture diverse aspects of these activities. We hope future research can measure a broader range of antisocial and prosocial activities at crime hot spots.
Conclusions
Our examination of prosocial and antisocial activities suggests that scholars and practitioners need to reconsider how they imagine life at crime hot spots if they are to better understand crime in the urban context. While these places with high crime evidence very high levels of antisocial activities as compared with non-hot spots, reinforcing conventional wisdom, they also evidence relatively higher levels of prosocial activities. This fact demands a more balanced approach to understanding and intervening in crime hot spots, a perspective that is also reinforced in prior study of social ties, social networks and collective efficacy at these places (Weisburd et al., 2024a). Simply stated, as one of our interviewees on a crime hot spot told us, ‘it’s not as bad as people think the place is’.
When we seek to intervene at crime hot spots, we need to take a view that recognises not only the very significant problems faced at these places but also the potential for residents to cooperate in developing solutions to those problems. The fact that prosocial activities are common on crime hot spots suggests possibilities for collaboration with police and other city agencies in developing interventions. It also suggests that such interventions should build upon existing positive social activities at crime hot spots. While crime tells part of the story of these places, it is not the whole story, and failing to recognise this hinders our ability to accurately describe crime hot spots in the urban context, as well as our efforts to improve them.
Footnotes
Appendix
OLS regression models predicting antisocial and prosocial behaviours.
| Model B1 | Model B2 | |||||
|---|---|---|---|---|---|---|
| (Antisocial behaviours) | (Prosocial behaviours) | |||||
| b | SE | p-Value | b | SE | p-Value | |
| Street segment type (Ref = Cold spot) | ||||||
| Cool spot | 0.172* | 0.073 | 0.023 | 0.322** | 0.115 | 0.007 |
| Drug spot | 0.938*** | 0.122 | 0.000 | 0.543*** | 0.134 | 0.000 |
| Violent spot | 0.769*** | 0.128 | 0.000 | 0.596*** | 0.140 | 0.000 |
| Combined drug/violent spot | 1.265*** | 0.203 | 0.000 | 0.901*** | 0.212 | 0.000 |
| Street population | 0.000 | 0.001 | 0.972 | 0.001 | 0.001 | 0.162 |
| Average age | 0.005 | 0.007 | 0.444 | 0.005 | 0.006 | 0.393 |
| Street length | −0.000 | 0.000 | 0.362 | 0.000 | 0.000 | 0.655 |
| Percent having a minor | 0.001 | 0.002 | 0.608 | 0.006*** | 0.002 | 0.001 |
| Constant | −0.859* | 0.325 | 0.011 | −1.195*** | 0.249 | 0.000 |
| F-Test | 18.90*** | 8.03*** | ||||
| R 2 | 0.174 | 0.110 | ||||
Notes: SE: Clustered standard error at the community level. n = 449 street segments (nested within 53 communities). *p < 0.05, **p < 0.01, ***p < 0.001. The Wald test for street segment type in Model B1: F(4, 52) = 19.01, p < 0.001. The Wald test for street segment type in Model B2: F(4, 52) = 7.52, p < 0.001.
Acknowledgements
We would like to thank Brian Lawton, Amelia Haviland, and Kathy Sikkema for their help in conceptualising the project, and Breanne Cave, Matthew Nelson, Sean Wire and Victoria Goldberg for their work in supporting data collection.
Declaration of conflicting interests
The author(s) declared no potential conflicts of interest with respect to the research, authorship, and/or publication of this article.
Funding
The author(s) disclosed receipt of the following financial support for the research, authorship, and/or publication of this article: This work was supported by the National Institutes of Health (grant number 5R01DA032639-03, 2012).