
Abstract
This study empirically examines the adequacy of sidewalk widths in Auckland’s Central Business District in light of increasing active mobility and sustainable urban planning trends. Recognising the need to retrofit street spaces to prioritise pedestrians, we aim to determine whether current sidewalk dimensions meet the diverse requirements of users. We analysed average sidewalk widths and developed four mobility metrics – inflow and outflow travel distance, and density of visitors and locals – using a large-scale mobile location dataset comprising 113 million data points from 1.4 million users. These metrics, reflecting urban vibrancy and sidewalk use, were correlated with sidewalk widths to assess their adequacy. Furthermore, we applied cluster analysis to these mobility metrics, along with the diversity of Points of Interest, to categorise sidewalk segments, uncovering intricate usage patterns. Our findings indicate that sidewalks typically range from 2 to 5 m, catering to varied urban needs. Notably, we observed no direct correlation between sidewalk width and mobility patterns, but significant differences in inflow and outflow travel distances were evident, especially between key urban hubs and quiet residential neighbourhoods. Moreover, we identified seven distinct sidewalk categories, each reflecting unique qualities, suggesting that uniform widths do not define sidewalk utility or character. This highlights the need to rethink current capacity-focused sidewalk design, advocating for a nuanced approach that addresses the intricate demands of urban spaces. Our methodology offers flexibility and can be tailored to suit different urban contexts, providing a versatile tool for urban analysis and planning.
Introduction
At the heart of the complex dynamics of urban spaces lies the infrastructure that shapes urban life, particularly streets used by both automobiles and pedestrians. Streets, traditionally viewed as conduits for movement, are increasingly recognised as dynamic, multi-dimensional spaces integral to the urban fabric (Gehl and Rogers, 2010). Contemporary urban planning and design discourse views streets as pivotal within sustainable urban development frameworks (Puchol-Salort et al., 2021; Wang et al., 2023), aligning their design with broader goals such as reducing environmental impact and encouraging environmentally friendly transportation modes like walking and cycling (Fields and Renne, 2021).
In this evolving urban landscape, sidewalks serve not just as pedestrian passages but as spaces that host activities like outdoor dining, street vending, and cultural expression (Kim, 2012; Lanza et al., 2022; Whyte, 1980). This multifunctionality enhances the quality of urban spaces for residents (Mehta and Bosson, 2021), supports commercial activities (Sevtsuk, 2020), mitigates the negative health and environmental impacts of motorised vehicles (Nieuwenhuijsen, 2020), and fosters inclusive and sustainable urban communities (Fields and Renne, 2021).
Amidst this backdrop, it is crucial to assess whether the existing sidewalk widths are sufficient, using Auckland’s Central Business District (CBD) as the case study – an area marked by rapid urbanisation and diverse user needs, presenting a unique opportunity to delve into the complexities of sidewalk provision. Our objective is twofold: first, to evaluate the adequacy of existing sidewalk widths in relation to pedestrian vibrancy; and second, to understand the broader implications of sidewalk dimensions on urban life.
The prevailing view suggests that well-designed, safe, and accessible sidewalks will naturally facilitate efficient movement patterns (Global Designing Cities Initiative, n.d.). However, this perspective, while valid, tends to oversimplify the complex relationship between the physical layout of urban spaces and human behaviour, not fully acknowledging that sidewalks not only facilitate but also influence and are influenced by pedestrian movements (Hillier, 1996). Addressing this gap requires establishing a comprehensive baseline of current sidewalk functionality and usage, which is imperative for future improvements to be effectively aligned with the evolving needs of urban communities.
Research on sidewalk performance has traditionally applied methods like observation surveys or interviews. While valuable, these methods are often limited in scale and are labour-intensive, making it difficult to gather data on a large scale (Lee et al., 2009; Mehta and Bosson, 2021; Suminski et al., 2008). Additionally, these methods can be subjective and prone to human error, further complicating the reliability of the data collected. The scarcity of reliable and cost-effective methods for collecting comprehensive sidewalk data limits our capacity to broaden the scope of research insights into pedestrian infrastructure networks.
Although sidewalk length can be easily measured through GIS mapping, measuring sidewalk width presents more significant challenges. Building setbacks, which can become extensions of the sidewalk space, add to the complexity of accurately measuring sidewalk width. This variability complicates the task of collecting consistent and reliable data on sidewalk dimensions. Consequently, the lack of scalable and efficient methods to measure sidewalk width hinders researchers’ ability to analyse and understand the intricate interactions between sidewalk design, pedestrian behaviour, and urban mobility patterns.
Due to these challenges, many researchers have prioritised the development and application of innovative data collection methods. Techniques such as image sensing and AI detection, utilising aerial photos and Street View images from platforms like Google Street View (Psyllidis et al., 2023), offer promising solutions by enabling large-scale, objective, and efficient data collection and analysis (Hara et al., 2013; Salazar Miranda et al., 2021). These advanced methods can significantly enhance the thorough understanding of pedestrian infrastructure networks, providing a more accurate and holistic view of urban pedestrian environments.
Similarly, our study employs advanced technological approaches to assess pedestrian infrastructure. Specifically, we leverage geolocation data and GIS topographical information to explore the relationship between sidewalk width and its vibrancy by analysing human mobility patterns. This approach provides a nuanced understanding of pedestrian behaviour that challenges the conventional focus on width and capacity.
Ultimately, this research aims to provide a foundational empirical evaluation of current sidewalk performance in relation to its physical dimensions. By shedding light on the complex interplay between urban infrastructure and pedestrian dynamics, it will foster the ongoing development of sustainable, human-centred urban environments and the creation of resilient and inclusive urban communities.
Sidewalks as urban catalysts: Their evolution and influence on city life
This study acknowledges sidewalks as critical urban catalysts. The lively pedestrian traffic on sidewalks symbolises thriving urban spaces, showcasing their intricate and multifaceted nature (Amato, 2004; Brown-May, 1998). Traditionally, sidewalk design adhered to prescriptive standards set by governmental regulations or design guidelines, focusing on minimum dimensions based on anticipated pedestrian flow and adjacent land use (Blomley, 2010). These standards, developed by urban engineers in cities like Paris and London in the late 19th and early 20th centuries, sought to regulate sidewalks as discrete spaces under municipal control, sometimes compromising their multifunctional nature (Ben-Joseph and Szold, 2004; Fairfield, 1994).
The introduction of the Level of Service (LOS) concept, originally a traffic management metric, into pedestrian planning signified a pivotal shift towards comprehensive evaluation of sidewalk functionality (Polus et al., 1983). Documented in Fruin’s ‘Pedestrian Planning and Design’ (Fruin, 1970) and the United States Highway Capacity Manual (HCM, 1950), this transition marked a move away from a purely regulatory focus towards a more human-centric planning approach (Campisi et al., 2023; Raad and Burke, 2018). This newer perspective embraced both quantitative measures and qualitative factors such as accessibility, safety, connectivity, aesthetic quality, and the availability of amenities (Lee et al., 2009; Vallejo-Borda et al., 2020), signalling a holistic reimagining of pedestrian spaces.
For quantitative measures, sidewalk research has predominantly employed network analysis. Features such as street connectivity, land use diversity, and physical attributes like width, street furniture, green spaces, and walking surface quality directly impact a pedestrian’s comfort and overall experience (Forsyth et al., 2007; Im and Choi, 2019). These factors are widely recognised as key indicators for evaluating and improving pedestrian networks (Chuang et al., 2023b; Gaglione et al., 2021; Pearce et al., 2021).
High connectivity and centrality in pedestrian networks enhance walkability by offering multiple route choices and accessible major destinations, respectively (Carpio-Pinedo et al., 2014; Lindelöw et al., 2017; Lundberg and Weber, 2014). Betweenness centrality indicates critical nodes for maintaining network connectivity, while closeness centrality reflects efficient access, both of which contribute to increased pedestrian activity (Jiang and Claramunt, 2004; Sabidussi, 1966). Visual analysis techniques like space syntax and GIS provide comprehensive evaluations of urban spaces, aiding in the prediction and enhancement of pedestrian movement patterns (Batty, 2022; Yang and Qian, 2023). These methodologies underscore the importance of well-designed and connected pedestrian networks in promoting walkability and sustainable urban development. However, this research often does not include a reflective assessment of sidewalk utilisation. Many studies do not capture real-time sidewalk usage.
It is also increasingly acknowledged that perceived qualities deeply shape walking behaviours (Vallejo-Borda et al., 2020). These subjective experiences, influenced by aspects such as safety, comfort, and aesthetics, are intimately linked to the physical features of sidewalks (Lee et al., 2009). Recognising the intricate interplay between perceived (qualitative) and measurable (quantitative) sidewalk qualities (Gao et al., 2022), contemporary urban planning discourse advocates for a design approach attuned to distinct needs and characteristics of various urban contexts. This approach emphasises the need for context-specific methodologies that resonate with different neighbourhoods’ unique rhythms and nuances (Gebel et al., 2011).
The more current discourse on sidewalks has evolved to encompass dynamic variables and the multifaceted nature of urban streets, adding layers of complexity to the understanding and management of these spaces (Gao et al., 2022; Salazar Miranda et al., 2021). The growing popularity of active transportation modes, such as cycling and walking, has prompted discussions about the design of shared street spaces within urban environments. While shared spaces foster benefits like enhanced social interaction and improved pedestrian safety, they also bring challenges. Potential conflicts may arise due to the coexistence of pedestrians with other users moving at different speeds, affecting perceived comfort and safety within these shared spaces (Gkekas et al., 2020; Ruiz-Apilánez et al., 2017).
In response to these evolving dynamics, our research delves into the complex nature of sidewalk spaces, leveraging mobile phone data to provide a more detailed and granular perspective of pedestrian behaviour. Utilising mobile phone data can reveal real-time pedestrian movement and behaviour, offering a more realistic picture. However, it is important to acknowledge the significant ethical and representational issues associated with mobile phone data, such as privacy concerns and potential biases in the data sample. These limitations are crucial, and methodological strategies need to be applied to ensure privacy, ethics, and the mitigation of biases, such as anonymising data and employing robust sampling techniques to ensure representativeness.
Our study seeks to bridge the gap between theoretical insights and practical applications, advocating for a nuanced, context-sensitive approach to sidewalk design. By thoroughly analysing pedestrian movement patterns, urban context and the diversity of Points of Interest (POIs), we aim to refine sidewalk categorisation, achieving a more harmonious physical, social, and functional balance. This research aims to provide valuable insights into the urban streetscape, contributing to a more informed enhancement of a unique and pedestrian-friendly urban environment.
Methodology
In this study, we concentrate on the sidewalks of Auckland’s CBD, New Zealand, a region noted for its significant pedestrian traffic. We utilise an extensive mobile location dataset comprising approximately 113 million data points collected from 1.4 million users between 2021 and 2022 within the Auckland region (Quadrant|Data Dictionary, 2024). Data were provided by the third-party data provider Quadrant.io, which gathers location data through app-based GPS signals. GPS data were collected with users’ permission from their mobile phones, either when the phone was actively in use or when applications were running in the background. Each data point includes the user’s GPS location, a timestamp, and a unique device ID, recorded as individual entries in the dataset.
The dataset is updated at varying frequencies depending on the user’s phone activity. Typically, the frequency of updates ranges from every few seconds to several minutes. Given that data is only captured during phone usage, the representativeness of the dataset is uncertain, and this limitation must be considered when interpreting our analysis results. This dataset forms the basis of our analysis of movement patterns from a socio-spatial perspective, aiming to empirically examine sidewalk adequacy in light of increasing active mobility and sustainable urban planning trends. We first describe data preprocessing steps, introduce various mobility metrics derived from individual trajectories, and measure sidewalk widths to examine their correlation with these metrics. Figure 1 outlines our research methodology in detail.
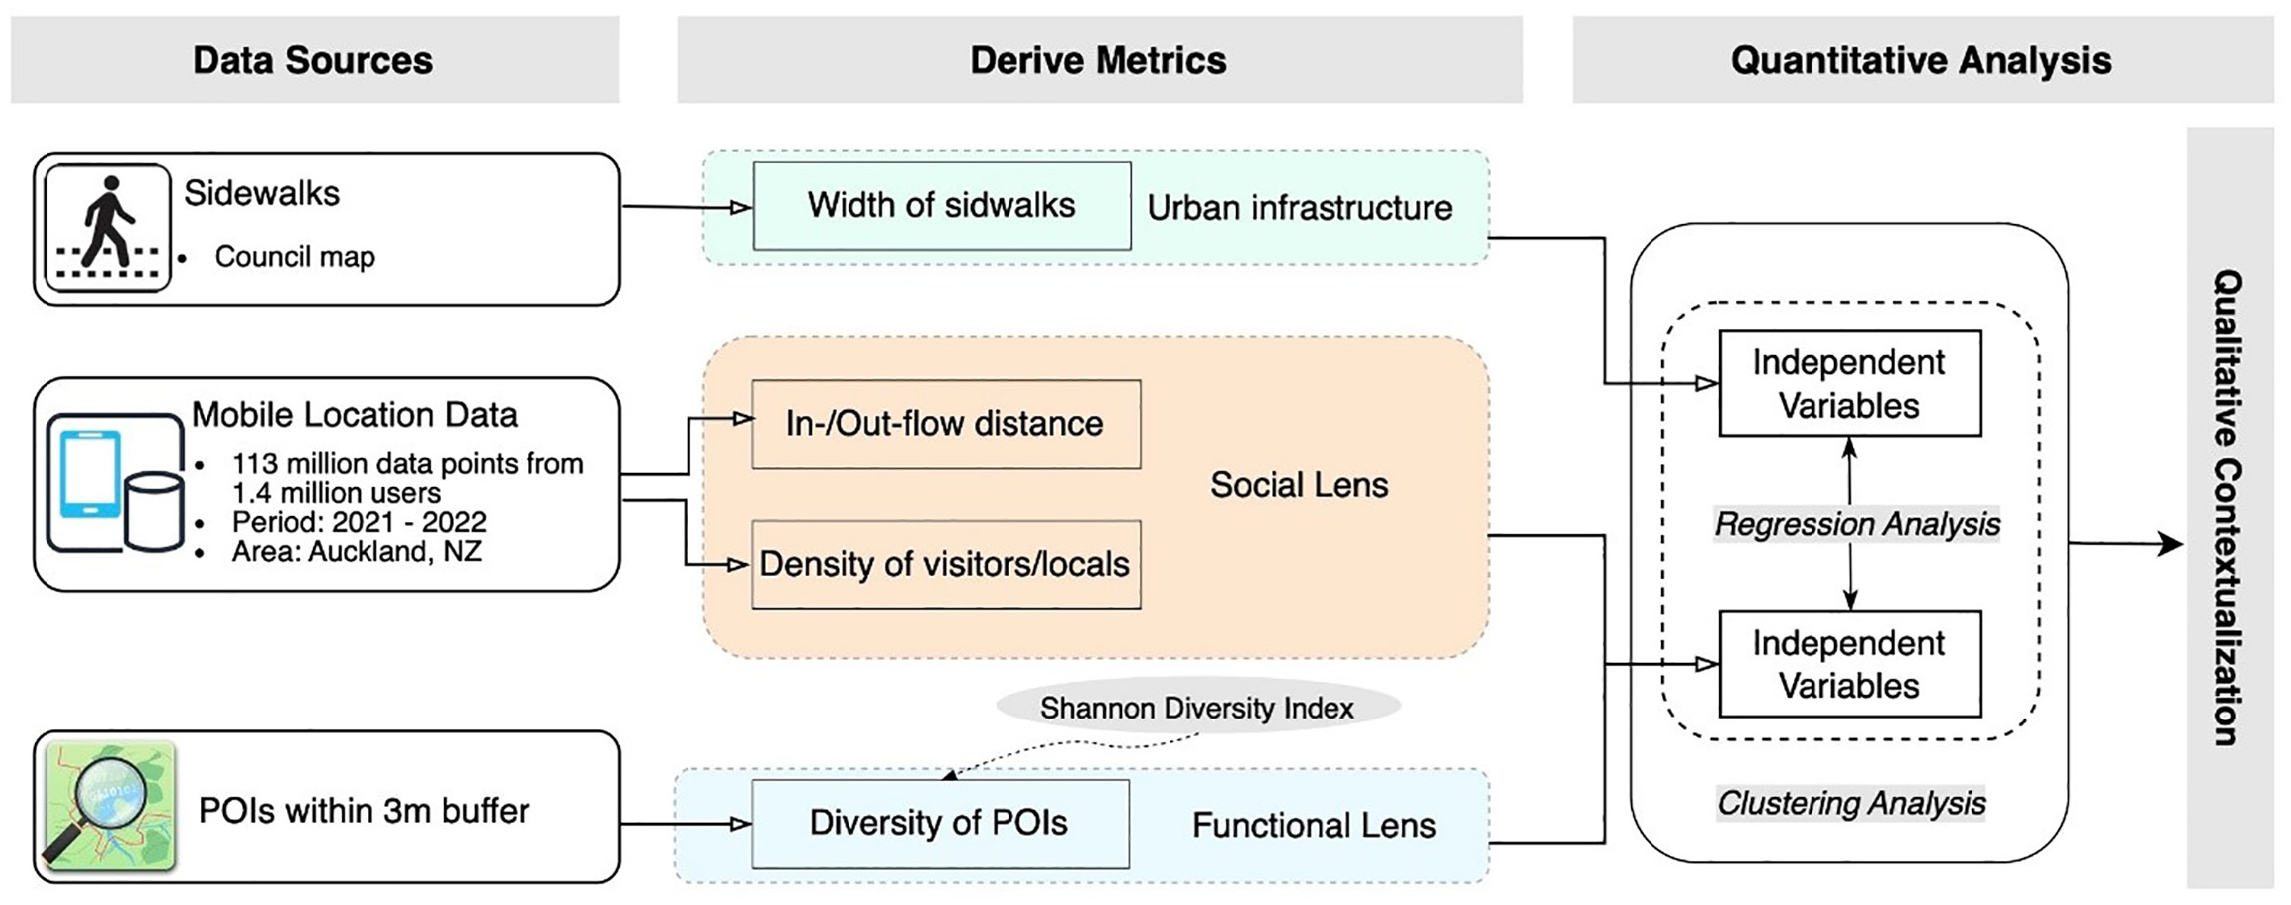
An overview of the research outline.
Data preprocessing
The data preprocessing phase transforms raw data into a structured, analysable format. This process excludes inactive users identified by minimal data interactions throughout the study period. Initially, we aggregated each data point into 300 m hexagonal grid cells, a strategy to mitigate the variable geographical precision linked with diverse smartphone models (Shelton, 2017). This approach supports more accurate and contextually aware spatial analysis, addressing Shelton’s (2017) critiques of simplistic mapping and overemphasised single coordinate pairs that neglect nuanced spatial conceptualisations. The 300 m resolution is chosen to balance geographical precision, data privacy, ethical considerations, and maintaining sufficient observations in individual grid cells. This decision aligns with the rationale of Chen and Poorthuis (2021), where sensitivity analysis of different grid cell sizes (250–1500 m) showed minimal impact on the result of inferred meaningful locations for smart phone users.
Subsequently, we employed the ‘Homelocator’ R package and its suggested ensemble method (Chen and Poorthuis, 2021) to infer the users’ most likely home location based on their footprint patterns. Only data points from users with inferred home locations are retained, ensuring that our analysis is anchored in data points reflecting genuine mobility patterns. This rigorous filtering process excluded about 17% of the initial dataset, yielding a refined subset of approximately 94 million data points from around 885K users. Further refinement was conducted by spatially aligning this data with targeted sidewalk areas, ultimately obtaining a dataset of approximately 859K data points from 36K users, each with an identified home location.
Sidewalks width calculation
The assessment of sidewalk width utilises digitised roadway kerb lines and property parcel boundaries, as provided by the Auckland Council (Geodata Hub, 2020), which precisely outlines the full extent of all sidewalk areas. To ensure a more detailed analysis, sidewalks within the same block were subdivided into various segments, as illustrated in Figure 2. This segmentation acknowledges that different sections of the sidewalk may exhibit varied characteristics, leading to differential usage frequencies across segments within the same block.
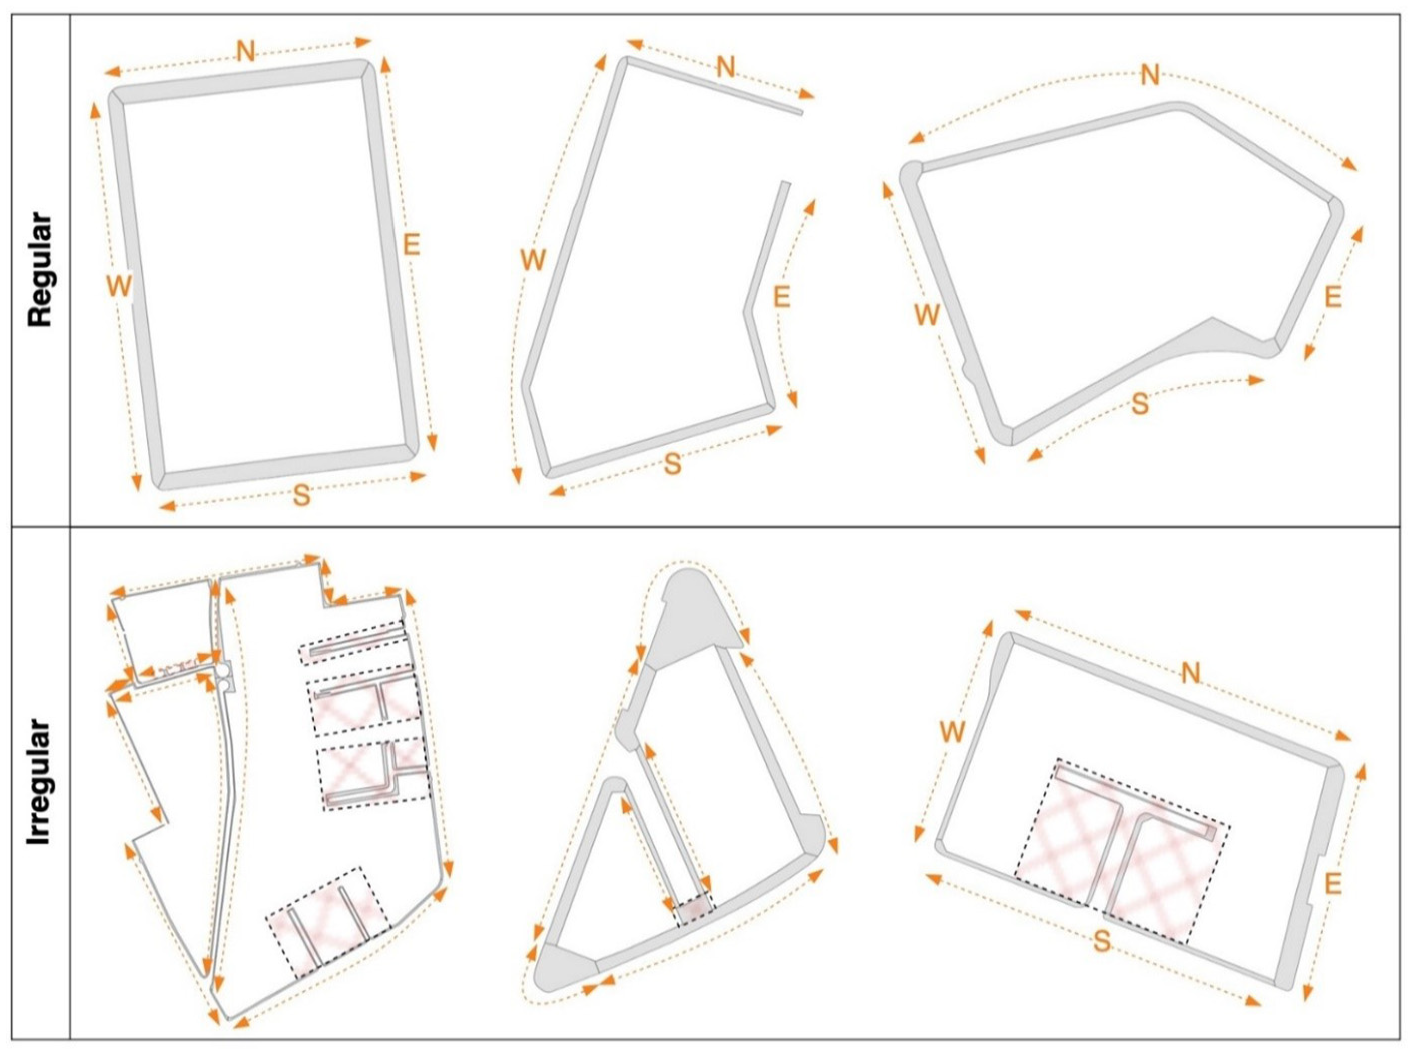
An illustration of dividing sidewalks into segments by different shapes.
For practical analysis, sidewalks are segmented into four directional parts: West, East, North, and South. In dealing with sidewalks with non-standard shapes, our focus remains on those that run alongside roads, deliberately excluding side alleys to ensure consistency in our measurements. For larger areas, like wide corners, each was considered an independent segment to mitigate any disproportionate influence on the overall accuracy of sidewalk width measurements. This process resulted in a total of 2269 sidewalk segments.
Subsequent to segmenting the sidewalks, one edge of each segment was transformed into a sequence of points set at 5 m intervals. This technique permitted the measurement of the distance from each point to the opposite edge of the segment, thus determining the width at specific locations. The average width of each segment was then computed based on these individual measurements (Psyllidis et al., 2023). The calculated average width of segments facilitates a more granular understanding of different usage patterns and serves as the dependent variable for subsequent regression analysis.
Mobility metrics measures – social and functional
To comprehend the social aspect of sidewalks, we developed mobility metrics under a social lens: In flow Distance, Out flow Distance, Density of Visitors and Density of Locals. These were constructed by forming the ‘home-to-destination’ (OD) network for each user. These metrics were carefully chosen for their potential to offer profound insights into pedestrian behaviour and sidewalk utilisation, providing a clear view through a social lens and illuminating the preferences and behaviours of different pedestrian subgroups. We first inferred smartphone user home locations, distinguishing ‘locals’ (residents within a specific hexagonal grid cell) from ‘visitors’ (residents outside of the grid cell). ‘Locals’ are defined as residents living within a 300 m radius, corresponding to the grid cell size used for our mobility metric, while those residing outside this range are considered ‘visitors’. This distinction captures the dynamic relationship between different groups and urban spaces, such as where the visitors come from (i.e. inflow network) and where the locals go out to (i.e. outflow network). We also employed spatial join techniques to link each grid cell (home or visiting location) with intersecting sidewalks, forming the basis for deriving our key mobility metrics: distance, density and diversity.
In flow Distance measures the average travel distance of visitors, specifically charting their movement from the centroids of their home locations to the centroid of the visited neighbourhood. This metric sheds light on the inflow network, capturing the distance travelled by individuals coming into a specific neighbourhood and offering valuable insights into the spatial reach of a neighbourhood’s attraction.
Out flow Distance evaluates the travel distance of locals from the home neighbourhood centroid to the centroids of all other neighbourhoods. This outflow metric reflects the spatial extent to which local residents venture out from their neighbourhood, revealing the interconnectedness of different urban areas and the range of local residents’ activities beyond their immediate surroundings.
On the other hand, the Density of Visitors and Density of Locals metrics focus on the absolute frequency of visitors and locals within each sidewalk area. The Density of Visitors metric quantifies the number of non-local individuals frequenting a sidewalk, reflecting its popularity or functionality to a wider audience. Conversely, the Density of Locals provides a count of local residents utilising the sidewalk, offering a glimpse into the sidewalk’s role and utility in the daily lives of the local community.
For the functional aspect of sidewalks, we concentrated on the Diversity of Points of Interest (POIs) within a 3 m buffer surrounding each sidewalk. We employed Shannon’s diversity index (H) Nagendra, 2002), commonly used for species diversity, to quantify the POI diversity. This diversity metric is a function of both the richness (total number of different POIs) and the evenness (distribution of different POIs) surrounding the sidewalks, and this approach has also been used in urban studies to understand visitor’s demographic diversity (Chuang et al., 2023b). Shannon’s diversity index provides a nuanced understanding by capturing both the variety and distribution of elements. A higher Shannon’s index value indicates a greater diversity of POIs adjacent to sidewalks, unveiling insights into the variety of functionalities these sidewalks support. The calculation of Shannon’s diversity index (H) is as follows:

where
These metrics are selected to provide nuanced insights into the social and functional aspects of pedestrian behaviour and the utilisation of sidewalks in Auckland’s CBD area. Furthermore, these metrics serve as exploratory variables in our subsequent analysis, aiming to identify potential correlations between sidewalk widths and the varied aspects of pedestrian activities and usage patterns.
Regression analysis
To contextualise the usage patterns of sidewalks, we compared the average width of sidewalk segments (i.e. the dependent variable) with the five measured metrics discussed above. Each variable was aggregated into individual sidewalk segments to ensure comprehensive data coverage across all metrics for the analysis.
We initiated with a standard Ordinary Least Squares (OLS) regression model incorporating all five metrics. Next, we performed stepwise regression, utilising both forward selection and backward elimination techniques facilitated by the ‘MASS’ R package. This approach addresses potential multicollinearity issues and identifies the most impactful set of features. It is important to note that our use of these regression models is not aimed at predicting sidewalk widths based on these exploratory variables but rather at providing an initial quantitative exploration of potential covariates that may be correlated with sidewalk vibrancy.
Clustering analysis
To address the intricate dynamics of urban spaces and the diverse needs of their users, we further applied cluster analysis as a robust tool for dissecting and understanding the complex nature of sidewalk usage. Cluster analysis allows us to group similar entities based on selected characteristics. We aimed to categorise sidewalks into distinct clusters, each representing a unique combination of attributes related to pedestrian behaviour and sidewalk functionality.
We utilise the K-means clustering algorithm for its effectiveness and widespread use as an unsupervised machine learning technique for partitioning datasets into a pre-specified number of groups (denoted as ‘K’). To determine the optimal number of clusters (K), we employed the ‘silhouette’ metric, which assesses the consistency within data clusters. The silhouette score quantifies how similar an object is to its cluster compared to others. By computing the average silhouette of observations for various K values, we identified the number that maximises this average, indicating the most distinct clustering. After evaluating K values ranging from 3 to 10, we found that the highest average silhouette width score was at K = 7. We then set K = 7 for the final k-means clustering model. The utilisation of cluster analysis in our study not only aids in summarising the social and functional dimensions of each sidewalk category but also provides valuable insights into their spatial distribution.
Results and discussion
The mean sidewalk width in Auckland’s CBD is approximately 4.3 m, with a 2–5 m common range. Our findings reveal that broader sidewalks are often associated with key urban nodes like Viaduct Harbour, Queen Street, and historical routes such as Hepburn Street (see Figure 3(a)). This pattern is consistent with global urban design guidelines that advocate for wider sidewalks in areas experiencing higher pedestrian volumes and vehicular speed. (Committee on Highway Capacity, 1950; Polus et al., 1983). However, notable deviations exist, such as ‘High Street’, a bustling narrow street parallel to Queen Street with very narrow sidewalks, which, despite its constraints, is undergoing transformation through the High Street Pilot Project aiming to enhance accessibility and prioritise pedestrian space. This reflects the challenges and complexity of developing pedestrian infrastructure as underscored by the Waka Kotahi NZ Transport Agency (2020), suggesting that the current sidewalk widths may not fully meet the diverse needs of pedestrians and underlining the inadequacy of a one-size-fits-all approach in sidewalk design.
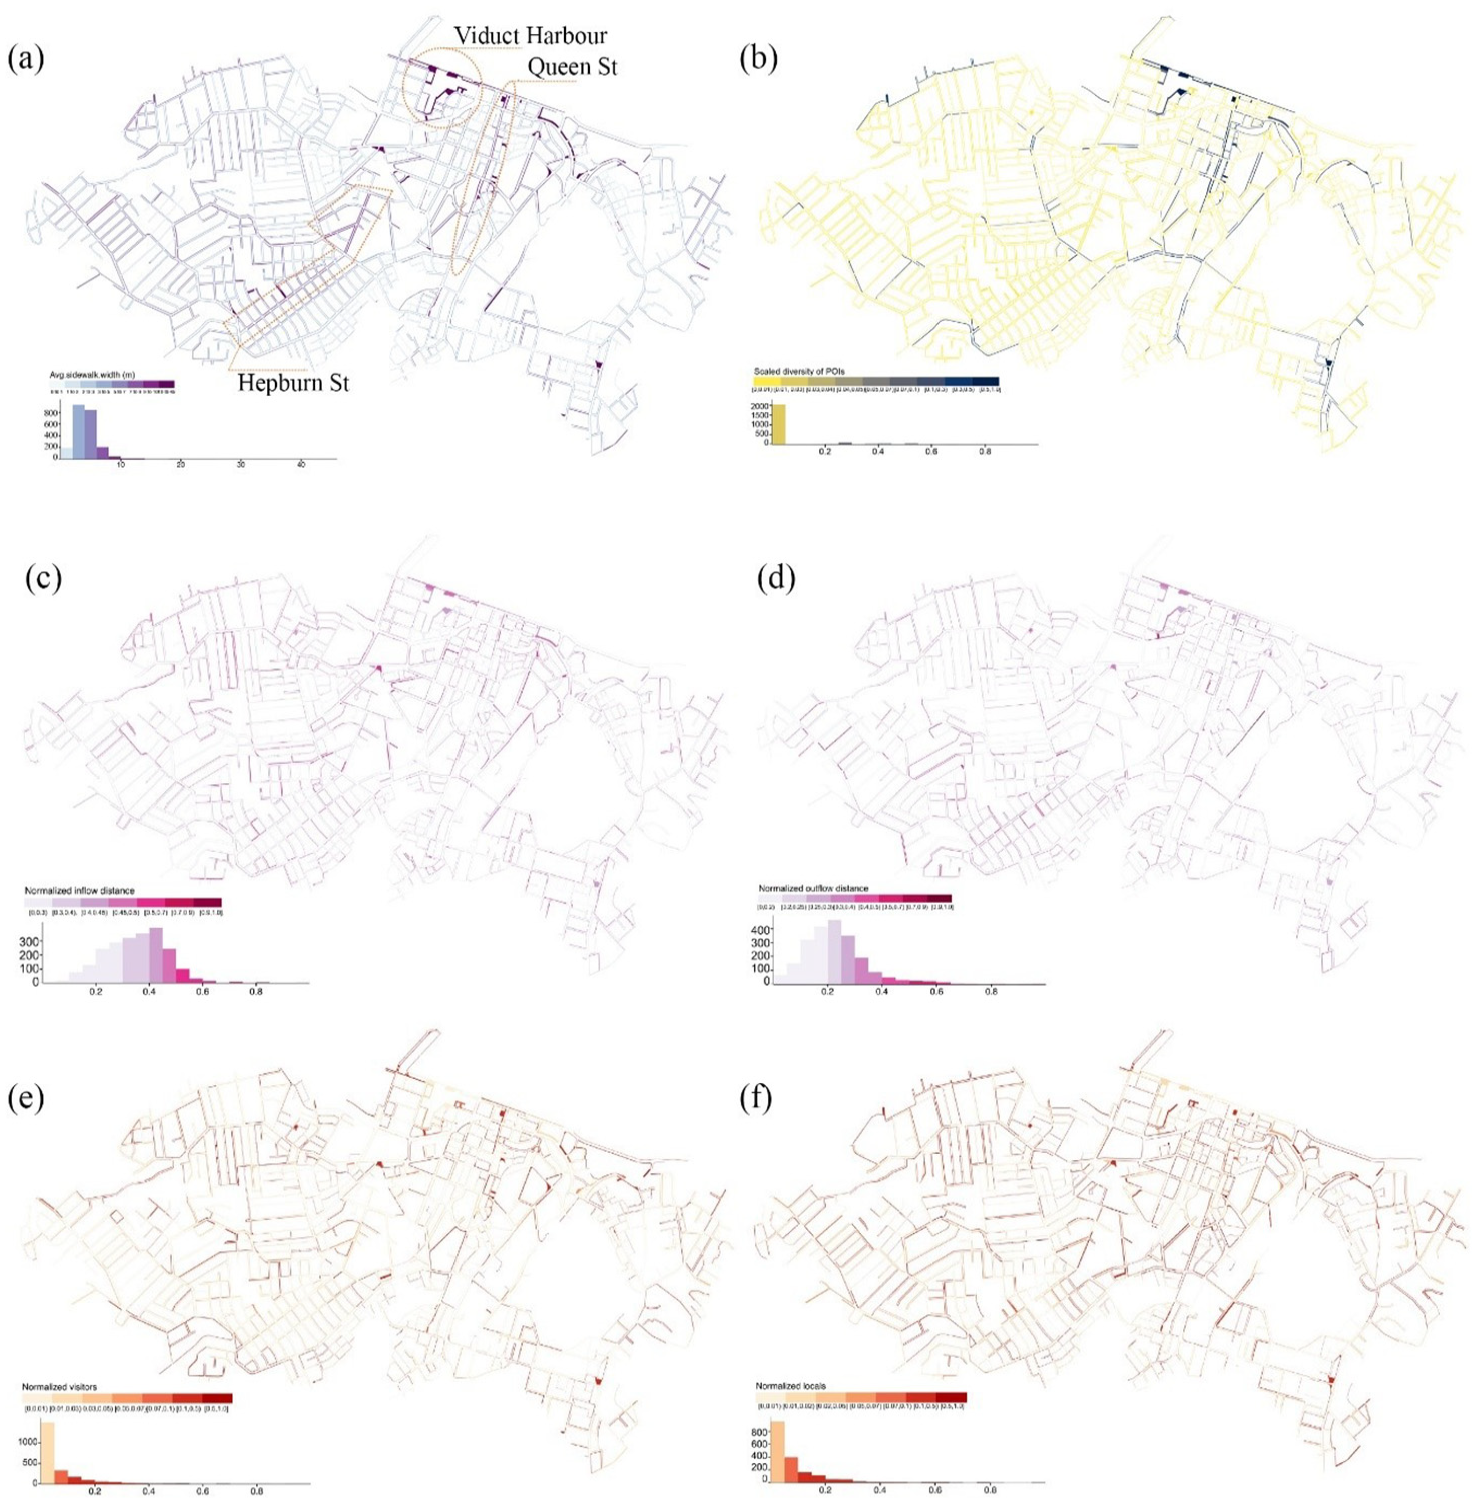
The spatial distribution of different mobility metrics: (a) the spatial distribution of the average sidewalk, (b) spatial distribution of scaled diversity of POIs, (c) inflow distance, (d) outflow distance, (e) density of visitors and (f) density of locals.
The analysis of the mobility patterns, depicted in Figure 3, showcases the spatial distribution of various mobility metrics. The metrics reveal that larger inflow travel distances indicate visitors travelling more to reach certain destinations, particularly in downtown areas such as Viaduct Harbour and Queen Street. This observation aligns with sociological theories regarding the distance effect (Dennis et al., 1999), suggesting that travel costs rise with distance, thereby influencing an individual’s preference based on the value-space distance. These factors can impact the attractiveness of sidewalks and reflect broader market dynamics, including the competitive landscape among destinations. Although our metric cannot detect the exact motives, sidewalks that register higher inflow distances are likely to possess attributes that draw more visitors, enhancing the vibrancy and dynamism of the area.
On the contrary, extensive outflow travel distances imply that residents tend to travel further from their homes for various activities, which can indicate lower walkability. This is contrary to the principles of walkability, which emphasise shorter travel distances to amenities, promoting health and environmental benefits (Forsyth, 2015; Gao et al., 2022). Furthermore, such travel patterns do not align with the concept of ‘15-minute cities’ which aim to ensure that most daily necessities and services are accessible within a 15-minute walk or bike ride from home, fostering more sustainable and liveable urban environments (Chuang et al., 2023a; Weng et al., 2019). This suggests that areas with extended outflow travel distances might lack essential local services. Our analysis particularly highlights higher outflow patterns in Viaduct Harbour and Queen Street areas, both of which are also known for high inflow travel distances that attract visitors to high-profile destinations (Figure 3(d)). This implies that a popular urban hotspot does not necessarily meet the needs of local residents. However, shorter outflow travel across neighbourhoods generally indicates well-serviced local areas, especially those nestled among the CBD’s street blocks, underscoring their potential to support daily essentials and promote walkability.
The analysis of footfall density (Figure 3(e) and (f)) shows that residential neighbourhoods typically attract fewer visitors compared to locals, while key arterials and mixed-use zones like Viaduct Harbour register a higher number of visitors. Notably, the local footfall density across the city, particularly at waterfront promenades and residential zones, displays a uniform high-value pattern. This finding is particularly noteworthy in a predominantly car-centric society like New Zealand (Mohammadzadeh, 2021), potentially influencing sidewalk usage patterns.
In our POI diversity analysis, we observe that areas boasting a broad array of POIs, such as Queen Street and the Quay Street waterfront, are generally expected to be bustling visitor destinations (Figure 3(b)). However, this does not invariably translate into higher visitor footfall, indicating a potential disconnect in leveraging urban amenities to foster pedestrian activity in Auckland City walking areas.
While it is commonly understood that sidewalk width alone cannot determine the vibrancy or the ability of urban spaces to meet pedestrian needs, our mobility matrix and POI diversity analysis empirically reinforce this notion. The findings reveal that although wider sidewalks are often found in busier areas, they do not directly correlate with increased vibrancy or pedestrian satisfaction. Instead, these counterintuitive findings suggest rethinking sidewalk adequacy and adopting a nuanced design approach, considering various urban dynamics and the diverse needs of pedestrians. In summary, our research highlights the complexity of developing effective pedestrian infrastructure and underscores the inadequacy of a one-size-fits-all approach in sidewalk design.
Bridging from these initial insights, we further delved into the matter by conducting regression analyses to investigate the relationships between sidewalk width and its social and functional attributes more deeply. The results indicate that all variables hold statistical significance concerning sidewalk width (Table 1). However, the negative coefficients for ‘Outflow Distance’ and ‘Inflow Distance’ suggest an unexpected relationship with sidewalk width, implying that areas with greater travel distances might not necessarily require wider sidewalks. This finding seems counterintuitive, considering that higher inflow distance generally suggests higher attractiveness based on the theories of the distance effect (Dennis et al., 1999) and sustainable neighbourhood models (Chuang et al., 2023a; Weng et al., 2019) discussed earlier. The positive coefficient for ‘Density of Locals’ and the negative coefficient for ‘Density of Visitors’ indicate sidewalk width requirements based on the population composition of an area. Areas with a denser local population probably likely need wider sidewalks to accommodate everyday pedestrian traffic. In contrast, zones with higher visitor density might not need wider sidewalks, possibly due to the transient nature of visitors’ presence. Visitors typically have shorter stays and more varied movement patterns than locals, often congregating in specific areas, such as viewpoints or landmarks, rather than utilising sidewalks for extensive travel. This distinction in usage patterns highlights the importance of designing sidewalks and urban spaces to meet the unique needs and behaviours of both locals and visitors.
The overview of the regression model results.
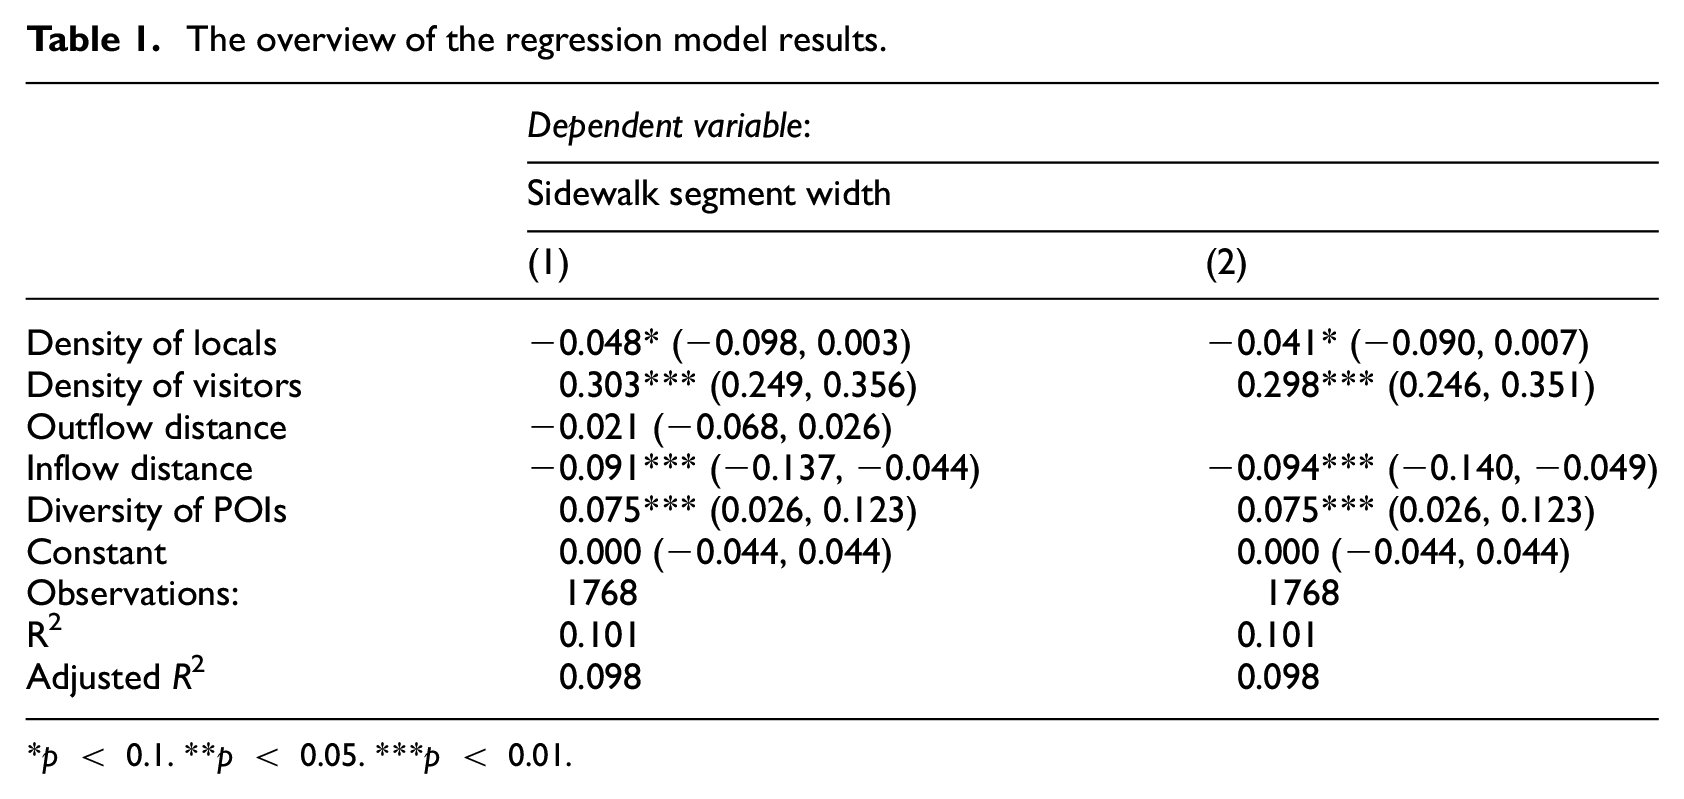
p < 0.1. **p < 0.05. ***p < 0.01.
Additionally, the positive coefficient for ‘Diversity of POIs’ suggests that areas featuring a diverse range of attractions usually need wider sidewalks to cater to increased foot traffic and varied pedestrian requirements, in line with studies emphasising the influence of POIs on the pedestrian experience (Psyllidis et al., 2018; Yao, 2018).
Nonetheless, the low R-squared value is a cautionary indicator that the variables considered within this model do not fully capture the variance in sidewalk width. This signals the complexity of factors at play. Further research and more comprehensive modelling are essential for thoroughly understanding and effectively planning urban spaces. Our analysis underscores the importance of sidewalk width in shaping mobility patterns and points to the need for a multifaceted urban design approach, considering a broader range of determinants of an area’s functionality and attractiveness.
With this insight, we learn that although these variables are all significant, they do not strongly correlate individually. Therefore, we further explore the characteristics of sidewalks comprehensively using cluster analysis. This method will statistically reveal clusters of sidewalks with similar characteristics, enabling us to uncover patterns of commonality or difference across areas and the factors contributing to those patterns. Figure 4 illustrates the spatial distribution of the classified clusters of sidewalks. The cluster analysis has identified seven distinct categories that blend physical, social, and functional elements, offering a comprehensive view of various urban areas (see Table 2). Each category reflects unique urban characteristics:
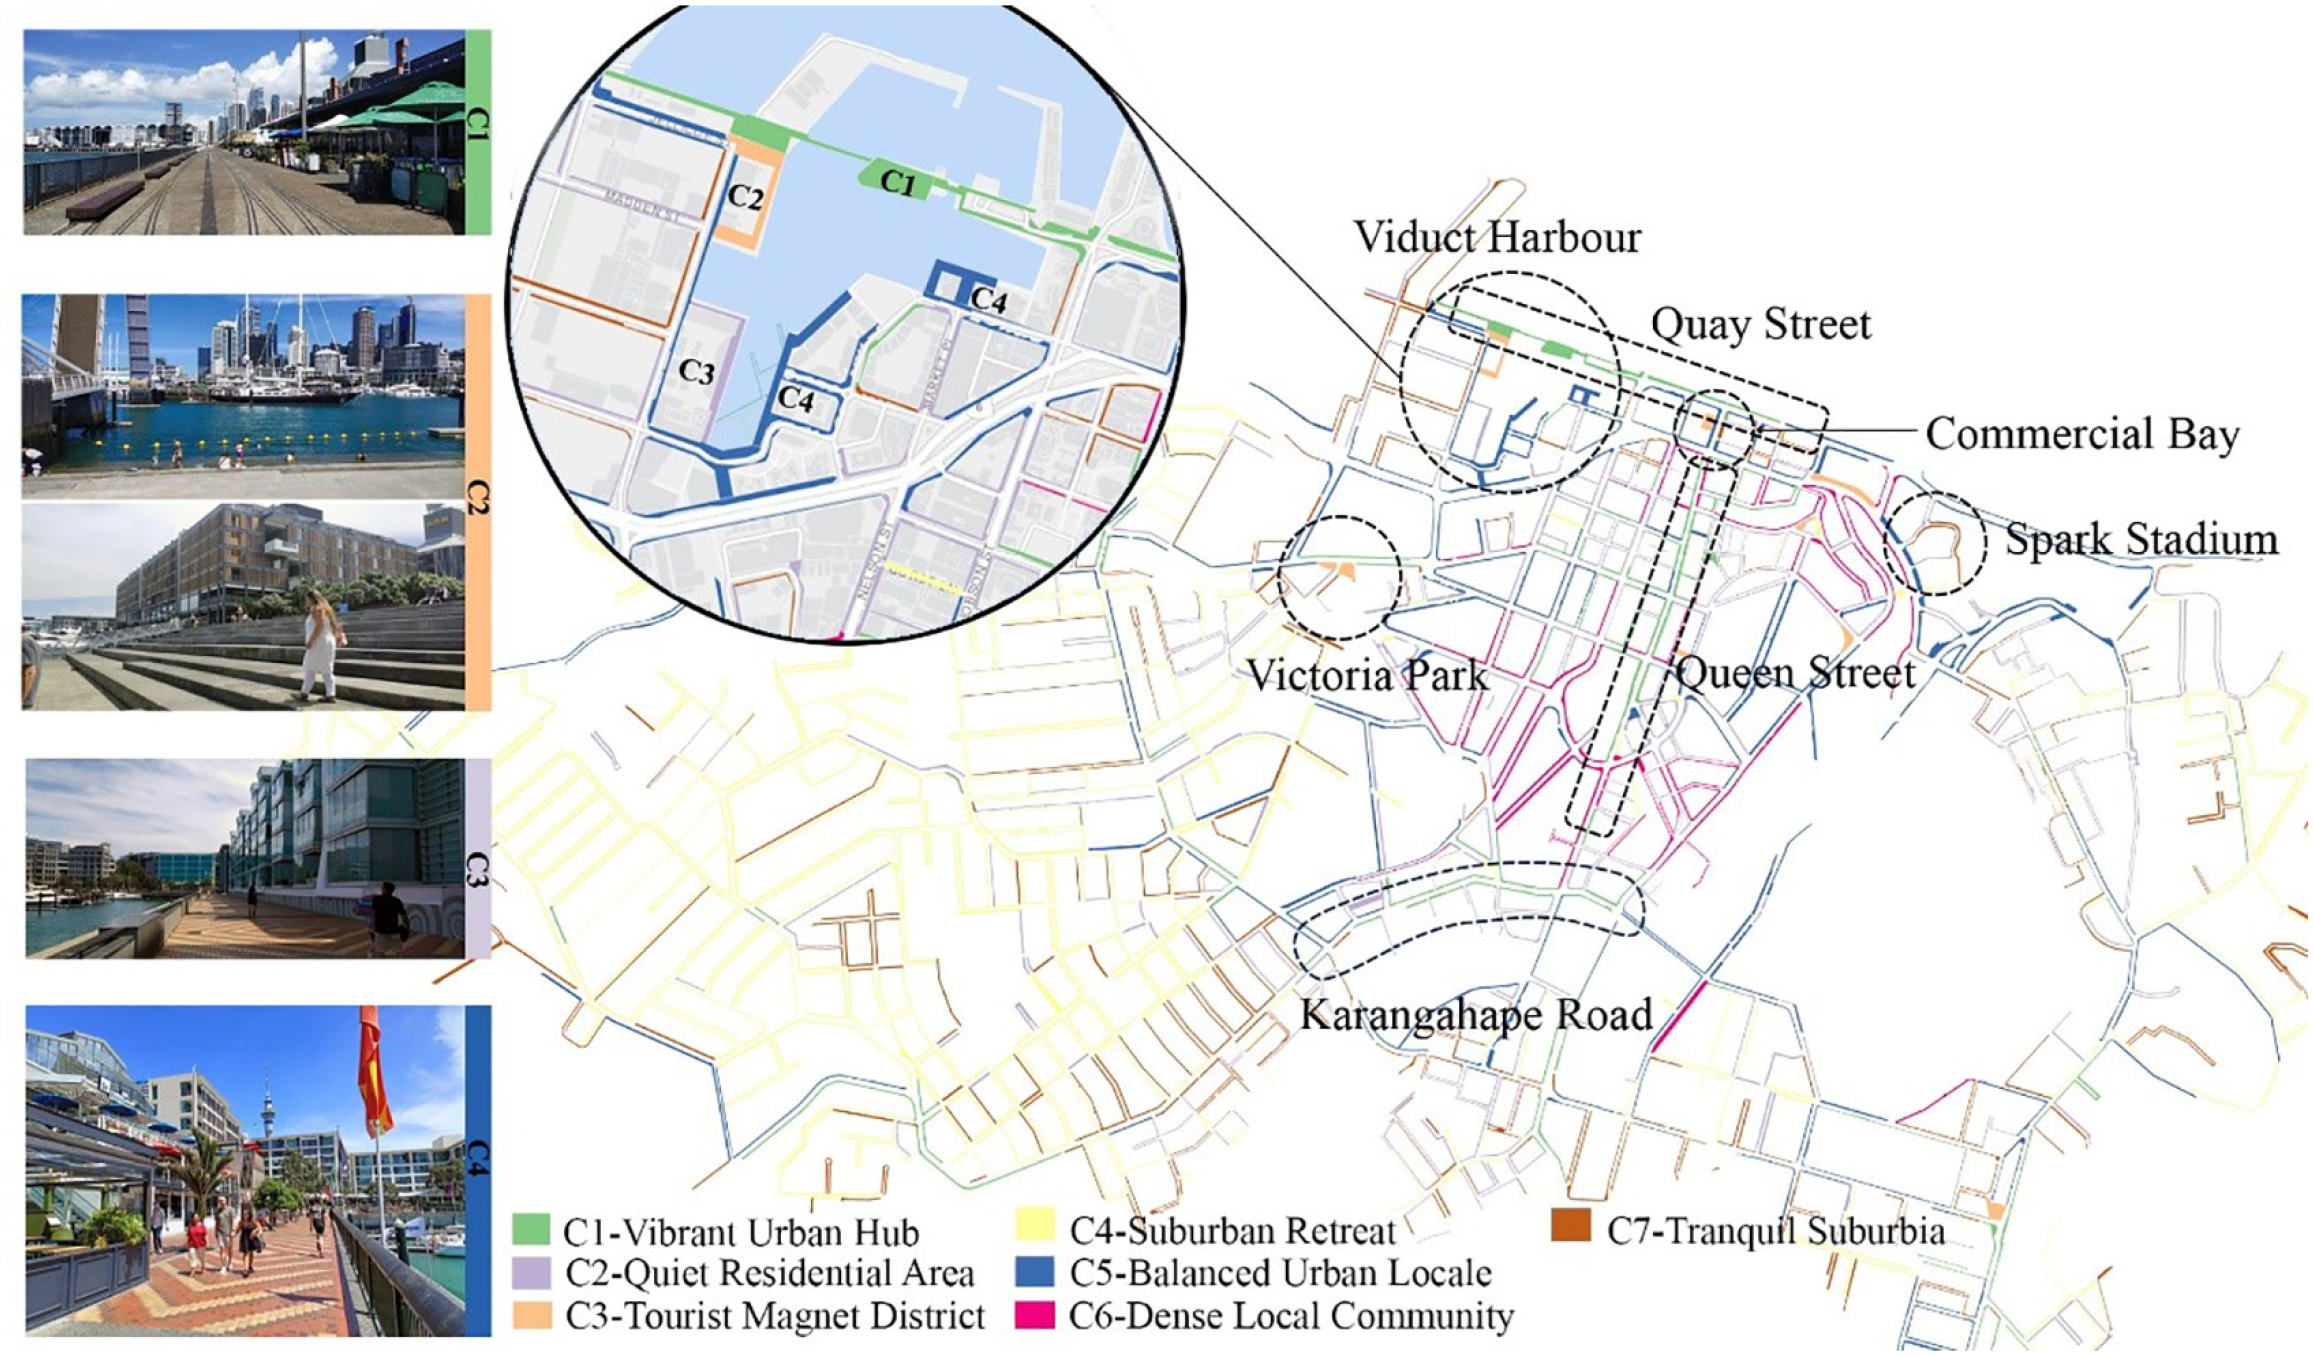
The spatial distribution of classified clusters of sidewalks.
The statistical summary of variables by clusters.
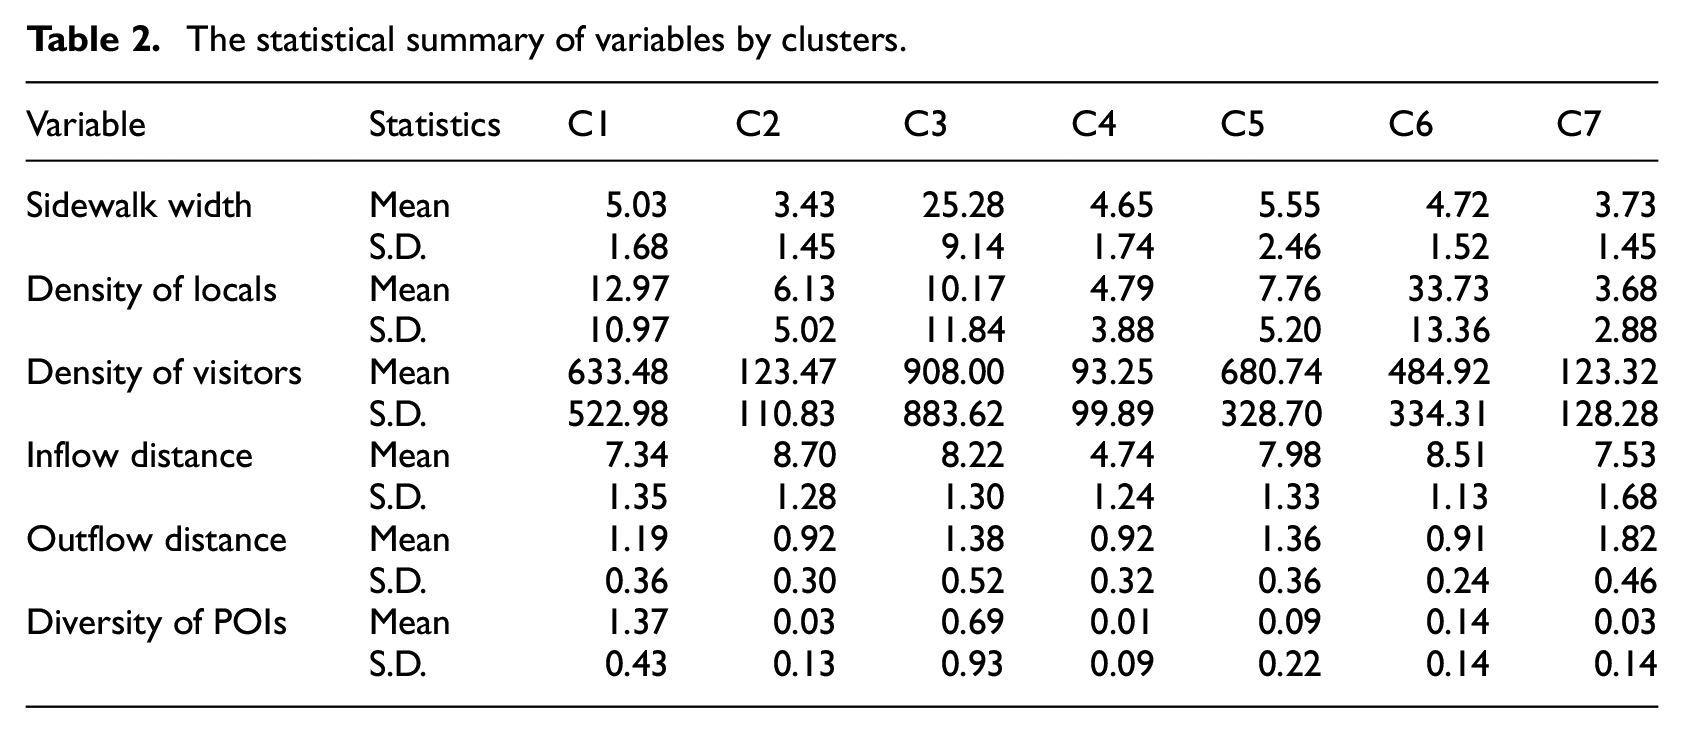
The clusters reveal a nuanced landscape of urban environments, where similar sidewalk widths can serve vastly different urban functions and cater to diverse populations and activities. For instance, the Vibrant Urban Hub (C1) and the Balanced Urban Locale (C5) both feature moderately wide sidewalks. Despite this similarity, C1 is characterised by highly variable local and visitor density and consistent POI diversity, suggesting a dynamic environment conducive to both social and economic activities. In contrast, C5, while also supporting higher local and visitor densities, offers a slightly varied POI diversity, indicating a blend of residential and commercial functions that might not be as intensely dynamic as C1 but still active.
Similarly, the Quiet Residential Area (C2) and Tranquil Suburbia (C7) share narrower sidewalks and lower densities, yet they differ in their accessibility and POI diversity, with C7 offering a slightly better connection to the surrounding areas despite its extremely low POI diversity. This suggests that while both clusters cater to quieter, more residential lifestyles, their interaction with the broader urban fabric varies. Interestingly, the Dense Local Community (C6) shares sidewalk widths similar to C1 and C5 but stands out due to its highest local density, minimal POI diversity, and low accessibility. This indicates a highly localised, dense residential area that, despite its sidewalk width, does not necessarily offer the vibrancy or accessibility of C1 or the balanced functionality of C5.
In addition, this categorisation also uncovered hidden patterns of the current urban landscape. For instance, the precinct of Viaduct Harbour, a success story in urban regeneration, has transitioned from an industrial/commercial hub to a vibrant, mixed-use space focused on leisure and recreation, becoming one of the most vibrant areas in the CBD. (NZ Herald, 2017). However, despite sidewalks being developed with consistent dimensions and quality, cluster analysis revealed four distinct sidewalk environments (Figure 4). The waterfront promenade (Cluster 1) displays vibrant urban activities, while areas inside the harbour with mixed-use, mid-density apartments (Cluster 5) exhibit balanced urban activities. Quieter residential areas along the harbour (Cluster 2) reflect serene residential life. The west end, known for panoramic views of the city and safe areas to interact with water, attracts both visitors and locals, fitting into Cluster 3 as a tourist magnet district. In summary, the analysis of sidewalk widths across different clusters reveals that similar infrastructure can underpin diverse urban experiences and functionalities.
However, it is crucial to acknowledge the inherent limitations of cluster analysis, such as the potential for oversimplifying complex urban dynamics and the influence of variable selection on the results. These limitations underscore the necessity for further localised, context-specific studies. Additionally, the use of mobile phone data presents several limitations regarding data privacy and representativeness.
Firstly, mobile phone data captures device movements rather than individual movements, introducing biases (Demšar et al., 2021). Variations in phone usage across demographics and regions can affect validity. This data may not accurately represent groups like children, the elderly or those without phones, limiting generalisability (Siła-Nowicka et al., 2016). The opt-in nature of data collection adds another layer of selection bias. High participation rates are crucial for effective contact tracing, but uneven participation can sustain transmission chains.
Such localised, context-specific studies can provide detailed insights into urban development strategies, ensuring that sidewalk designs are tailored to each area’s unique characteristics and aligned with broader urban planning objectives. In this manner, the analysis serves as more than just a tool for understanding the current state of sidewalks; it acts as a strategic guide for targeted improvements and informed urban development.
Conclusion
This inquiry into Auckland’s CBD uncovers intricate links between the dimensions of sidewalk infrastructure, pedestrian movement and city functionality. Our analysis underscores that sidewalks are more than mere pathways; they are established as vital components within the urban landscape. Through analysing an extensive mobile location dataset, this research has offered nuanced insights into the adequacy of sidewalk dimensions amidst evolving urban mobility and planning paradigms, emphasising the need for a multifaceted approach to sidewalk design that transcends conventional width and capacity considerations.
Our findings reveal that the mean sidewalk width across Auckland’s CBD is approximately 4.3 m. However, this varies near major urban nodes and pedestrian hotspots. Interestingly, there is no simple correlation between sidewalk width and mobility metrics such as inflow/outflow distances or the density of pedestrians, suggesting that wider sidewalks do not automatically translate to increased pedestrian activity or meet the needs of all user groups effectively.
The cluster analysis further enriched our understanding by identifying seven distinct sidewalk categories, each exemplifying unique physical, social and functional combinations. While this does not prescribe specific design dimensions like width, it offers a framework for assessing sidewalk performance, informing future redevelopment or enhancements. For example, sidewalks in vibrant urban hubs, particularly those in category C1 (Vibrant Urban Hub) characterised by high pedestrian flow and diverse activities, are expected to meet specific standards. Discrepancies in categorisation could highlight mismatches between the current infrastructure and the intended urban dynamic, signalling areas that require enhancements. This approach transcends the traditional one-size-fits-all model in sidewalk planning, advocating for tailored designs that cater to the distinct character and needs of different neighbourhoods, thereby ensuring that sidewalks not only facilitate movement but also enhance the overall urban experience by seamlessly integrating into the fabric of each unique urban ecosystem.
Despite our comprehensive analysis, we acknowledge potential limitations, such as the simplification of urban dynamics through cluster analysis and the impact of selected variables on findings. Currently, our study mainly focuses on the relationship between sidewalk widths and pedestrian vibrancy using mobility metrics. However, other variables, such as network analysis indicators like connectivity, centrality, betweenness, and closeness, could help contextualise sidewalk segments within neighbourhood and regional scales, offering deeper insights into the influences of origins and destinations on pedestrian travel patterns. As such, future research could explore more complex styles of models by adding additional variables and network analysis indicators to obtain a more in-depth understanding of the causal dynamics between sidewalk width and pedestrian vibrancy. Furthermore, it is crucial to recognise the inherent bias associated with using mobile phone data. Although this dataset provides a valuable perspective on pedestrian movement and sidewalk use, it does not perfectly represent the entire population.
While the study focuses on Auckland’s CBD, our methodology is applicable and adaptable to various urban settings. By utilising specific context data, our research method facilitates the development of strategies informed by the specific outcomes of each locality. However, we also acknowledge that challenges will arise when adapting the methodology to significantly different contexts. Denser cities in Europe and Asia present difficulties such as integrating modern strategies with historical and cultural contexts, navigating limited space and accessing mobile phone data under stricter privacy regulations. These cities’ distinct built environments and development histories create complex urban conditions. In particular, densely built environments with narrow streets and skyscrapers, where pedestrian movement can be vertically connected, pose additional challenges (Sun et al., 2021). This complexity may hinder the application of mobile phone data, which may vary in precision and not account for three-dimensional movements, compromising the adaptability of this methodology. Despite these extreme cases, the adaptability of our methodology can serve as a foundational tool for urban design and planning professionals, assisting them in tailoring interventions to meet the unique needs and challenges of diverse urban environments.
This research does not aim to provide or predict the appropriate width for sidewalks; instead, it offers empirical evidence suggesting that sidewalk width should consider more localised characteristics of the built environment, including physical and social characteristics. Most design manuals often prescribe minimum footpath dimensions based on typical pedestrian and vehicle flow conditions. However, conducting pedestrian flow surveys typically requires substantial time and resources and may only provide a snapshot of usage patterns during a particular period.
By leveraging mobility data, we can measure trends in users’ mobility patterns, offering a more comprehensive and continuous indicator of sidewalk utilisation that is otherwise not possible with on-site pedestrian flow counts. This data-driven approach allows for a better understanding of demographic trends and usage patterns over time. Incorporating real-time and historical mobility data can inform the responsiveness of sidewalk performance and pinpoint sidewalk areas that are misaligned with the demand. Monitoring and prioritising these areas for future improvements can enhance the overall functionality and accessibility of urban infrastructure.
In conclusion, this study emphasises sidewalks’ vital role in fostering urban vibrancy, community engagement, and sustainable mobility. It calls for a shift towards adaptable urban planning that recognises sidewalks’ multifunctionality and the dynamic nature of pedestrian behaviour. Adopting a detailed, data-driven approach to sidewalk design can improve urban spaces’ quality, encourage active mobility, and foster more liveable, resilient, and inclusive cities. Further research into the intricate relationship between pedestrian infrastructure and urban life is essential, utilising new technologies and methodologies to champion human-centred urban development.
Footnotes
Declaration of conflicting interests
The author(s) declared no potential conflicts of interest with respect to the research, authorship, and/or publication of this article.
Funding
The author(s) disclosed receipt of the following financial support for the research, authorship, and/or publication of this article: The University of Auckland, Performance Based Research Fund.
Data availability
Data will be made available on request.