
Abstract
The COVID-19 pandemic placed considerable stress on restaurants from restrictions placed on their operations, shifting consumer confidence, rapid expansion of remote work arrangements and aggressive uptake of third-party delivery services. Industry reports suggest that restaurants are experiencing a much higher rate of failure in comparison to other sectors of the economy. Restaurant survival was assessed in the Middlesex–London region of Ontario, Canada as of December 2020 using a novel dataset constructed from public health inspection permits, business listings and social media. Binomial logistic regression models were used to determine the association of operational, demographic and land use factors with restaurant survival during the pandemic. Operations-related factors were considerably more predictive of restaurant survival, though some demographic and land use factors suggest that urban processes continued to play a role in restaurant survival. Restaurants that offered in-house delivery and phone-based ordering methods were considerably less likely to close. Restaurants with a table-based service model, drive-through or an alcohol licence were also less likely to close. Restaurants proximal to a concentration of entertainment land uses were more likely to be closed in December 2020. Closed restaurants were not spatially clustered as compared to open restaurants. The pandemic appears to have disrupted established theoretical relationships between people, place, and restaurant success.
Introduction
Restaurants 1 occupy important locations in commercial and neighbourhood centres of urbanised areas. They are viewed as a catalyst for local and global tourism, a substantial employer, a driver of economic competitiveness and an indicator of community vitality (Cleave et al., 2019). Restaurant performance has been a perennial focus of study in urban geography, providing an indicator of how community attractiveness, talent and culture manifest in the commercial landscape (Dock et al. 2015; Jung and Jang, 2019; Meltzer and Capperis, 2017; Neal, 2006; Smith, 1983, 1985; Wu et al., 2021; Yang et al., 2017). Restaurants are only one component of the broader retail, hospitality and entertainment landscape. Retail, hospitality and entertainment businesses often form the nodes of metropolitan structures within regions (Brown, 1993; Hartman, 1950; Warnes and Daniels, 1980). These places are an important focal point of economic and cultural activity in urban areas, especially when those areas are dominated by restaurants and entertainment uses (Ballantyne et al., 2023; Grant and Perrott, 2011; Singleton et al., 2016).
Restaurants tend to fail and be replaced in a cyclical pattern, with this ‘churn’ in the retail landscape signifying the overall economic and cultural performance of a block, street, neighbourhood, city or even region (Meltzer and Capperis, 2017). A small amount of turnover in the retail landscape can be a healthy form of urban regeneration, providing new services and attracting new residents and visitors. However, major events such as an economic downturn, increased social incivilities or a global pandemic can disrupt this replacement cycle. In turn, an accelerated sudden loss of restaurants could cascade into further social and economic harms to urban areas from employment loss, lower economic activity and reduced attractiveness and vibrancy, thereby overwhelming the resilience of urban areas to recover from the pandemic or another economic downturn (Glaeser, 2022; Minner and Shi, 2017). In addition, the uneven distribution of these closures could further exacerbate socio-spatial inequalities, consolidate the cultural capital from restaurants into wealthier areas and lock less resilient urban areas into long-term socioeconomic decline (Buffel et al., 2023; Florida et al., 2023; Hill and Cheshire, 2023; Orford et al., 2023). While there is considerable evidence about the role of sociodemographic and land use factors on restaurant performance from an urban geography perspective, and substantial evidence from business and hospitality scholarship on restaurant management decisions, the combination of both lines of inquiry into one analysis is limited. Coupled with the presence of a generational economic downturn induced by the COVID-19 pandemic, there is a need for research that investigates the wide range of factors that may correlate with restaurant survival.
The pandemic experience in Ontario, Canada
The first case of COVID-19 in Ontario, Canada was reported on 25 January 2020 (Public Health Agency of Canada, 2020). The spread of the virus culminated in a government-mandated closure of all non-essential businesses on 17 March 2020, restricting all restaurants to only operate by takeaway and delivery (Nielsen, 2021). The provincial government in Ontario proceeded to adopt a reopening framework that resulted in a fluctuating series of restrictions placed on restaurant operations over the following months based upon the number of active COVID-19 cases and hospital capacity available (Reopening Ontario (A Flexible Response to COVID-19) Act 2020, c. 17, 2020). These restrictions were applied on a regional basis by the province, based on consultation with the local public health unit. In short, most restaurants in the study area were allowed to offer outdoor patio dining and limited capacity indoor dining from July to November 2020, before returning to takeaway- and delivery-only operation for the final part of the year.
Public health restrictions severely limited the core revenue stream of restaurants by not allowing on-premises dining for most of the year. Moreover, the constant flux in restrictions placed on restaurant operations, and the immediacy of these restrictions taking effect, resulted in product waste and loss of staff talent (Gilliland et al., 2021). There were also secondary impacts felt by the restaurant industry from restrictions on in-person work in the office sector, suspension of entertainment and small-format retail operations, lack of international travel and limited domestic tourism.
Preliminary evidence suggests that the Ontario restaurant sector sharply declined in market activity as compared to 2019, though it stabilised in late 2020 (Canadian Federation of Independent Business, 2021; Couillard, 2020a, 2020b). Unfortunately, only high-level labour force data are available (Goddard, 2020; Hobbs, 2020), and there are no Ontario-specific data available to investigate restaurant failures.
A high rate of failure in the restaurant sector could hamper recovery from the pandemic, as urban areas struggle to attract new residents, employers and cultural venues without the presence of keystone attractors like restaurants in the urban landscape. Understanding the factors that contributed to restaurants weathering shocks such as the COVID-19 pandemic may provide insights into withstanding external economic pressures in urban areas. These external shocks consisted of public health restrictions placed on normal restaurant operations, broad shifts in consumer behaviour and the mass uptake of third-party delivery services (e.g. UberEats, Doordash, Skip) who arbitrage the relationship between consumer and producer (De Fraja et al., 2021; Martin et al., 2016). Given the contribution of the restaurant industry to urban vitality and attractiveness (Neal, 2006), the study of factors that contribute to restaurant survival during the pandemic could provide valuable evidence about how place-based processes contribute to social, economic and cultural resilience.
Research objectives
We propose that restaurant survival from March to December 2020 could be a function of business-level operational decisions made during the pandemic, and/or spatialised demographic and land use factors. Our study has the following specific research objectives:
identify the operational decisions made in May 2020, as well as surrounding demographics and land uses that significantly correlate with restaurant survival as of December 2020;
investigate the degree to which spatialised factors (demographics and land use) as compared to business-level operational decisions affect model performance in predicting restaurant survival;
investigate the spatial clustering of restaurant closures.
Hypothesising drivers of restaurant survival during COVID-19
Classical theories about retail location and metropolitan structure may help explain the observed patterns in restaurant closures during the pandemic (Brown, 1993; Davies, 1972; Warnes and Daniels, 1980). Sedov (2022) found that US-based restaurants closer to the central business district and in more dense areas were more likely to close, while those in dense neighbourhoods of people under 25 years of age were less likely to close. Yang et al. (2020) determined that lockdowns correlated with a 3.25% decline in restaurant demand, measured at the US county level. Huang et al.’s (2023) investigation of Black-owned restaurant survival in the USA found that restaurants had considerably less foot traffic than other restaurants. Kim et al. (2024) found that restaurants tended to be closed in areas with a greater proportion of car-based accessibility as compared to walking accessibility. Other studies have highlighted the decline of retail agglomerations, particularly those in core areas or high streets, and their emerging transformation into ‘experience economies’ that heavily rely on restaurants as cultural artefacts (Hardaker et al., 2022; Hill and Cheshire, 2023; White et al., 2023). There remains a lack of evidence examining how individual restaurant operational decisions, surrounding demographic factors at a smaller neighbourhood scale and the surrounding land use mix may have influenced business survival during the first year of the pandemic.
We hypothesise that restaurants which chose to substantially change their operations in response to the pandemic had a greater likelihood of survival. Surrounding demographics and land uses may also influence the likelihood of survival, but given the rapid expansion of online delivery and diffusion of economic activity throughout the city, restaurant performance may no longer be strongly co-dependent with spatial factors.
First, operational decisions are made by individual restaurant owners such as how they allow customers to order their products, how they make deliveries, their dining format and products offered, if they are franchised or independent and how long they have been operating in the same location with the same brand. A restaurant’s ability to provide direct service to vehicles via a drive-through, to offer in-house delivery as compared to relying on third-party companies, to have a strong web presence, to have space for outdoor dining or to be configured to provide takeaway service to customers could be considered competitive advantages in the context of the public health restrictions instituted during the pandemic. Further, the choice to close in May 2020, instead of operating only for takeaway and delivery, could have placed businesses on an early path to failure as they lost the consumer market share, talent and revenue necessary to adapt in the later months of the pandemic.
The restaurant industry is highly volatile in comparison to other consumer-orientated industries, and is strongly influenced by external shocks and imperfect business decisions (Kang and Lee, 2015; Koh et al., 2013). Like other consumer-orientated businesses, many restaurants do not survive long term (Renski, 2015). While failure rates are often overstated, many investigations in the USA and Europe have found that 25–50% of restaurants fail within the first five years of opening, irrespective of global market conditions, with those that survive past those first five years tending to survive indefinitely (Muller and Woods, 1991; Parsa et al., 2005, 2011, 2015). Restaurants that survive the first five years of operation may have greater resiliency to later external shocks such as a global pandemic, from building organisational capacity, having a loyal customer base and access to substantial cash reserves (Parsa et al., 2005). The same logic could be applied to chain-affiliated franchises that would have access to broader organisational support on cashflow, procurement and marketing.
Second, restaurants as a consumer-orientated business have a limited geographic service area that is likely affected by the surrounding sociodemographic structure (Parsa et al., 2015; Yang et al., 2017). The expansion of remote work to many sectors, coupled with job loss in the entertainment and tourism-related hospitality sectors, may have altered the traditional geographic drivers of demand for restaurants away from employment uses and towards residential uses (De Fraja et al., 2021). Moreover, the cautioning of older adults about engaging in public life may have encouraged takeaway and delivery from restaurants or pickup and delivery grocery shopping, while reducing dining out in person (Brankston et al., 2021). Sociodemographic measures which correspond to these populations may be useful proxies of how these broad shifts in restaurant demand are playing out in the restaurant landscape.
Restaurant demand may be influenced by adjacent complementary land uses or the presence of other restaurants (Parsa et al., 2011; Smith, 1983, 1985; Wu et al., 2021). Restaurants tend to cluster near each other, and in proximity to complementary retail and entertainment uses, given the competitive advantages from agglomeration and the constraining factor of local zoning restrictions (Brown, 1993; De Beule et al., 2015; Dock et al., 2015; Jung and Jang, 2019). While retail-associated businesses remained open during the pandemic, most offices and entertainment businesses were closed for all of 2020. Given that these uses are traditional drivers of traffic to restaurants in the North American consumer landscape, their closure could have impacted traffic to co-dependent agglomerations of retail, entertainment or office and restaurants (Jung and Jang, 2019; Shoag and Veuger, 2019; Smith, 1983; Wu et al., 2021). Conversely, restaurants near high-density residential areas may have benefitted from people limiting their mobility to their immediate neighbourhood (Barnes et al., 2015; Long and Ren, 2022; Trasberg and Cheshire, 2023; Yang et al., 2020).
Methodology
Study area
The study area encompasses the Middlesex Census Division, located in Southwestern Ontario, Canada, about equidistant proximity to the major metropolitan areas of Toronto, Canada, and Detroit, Michigan. The 2020 population of the Middlesex Census Division is 510,609, with 430,828 in the built-up area of the City of London and 79,781 in the outlying rural county (Statistics Canada, 2020). The census division is composed of the City of London and surrounding Middlesex County, with seven local area municipalities. Restaurants are predominantly clustered in the central core and at major suburban or exurban retail nodes (Figure 1).
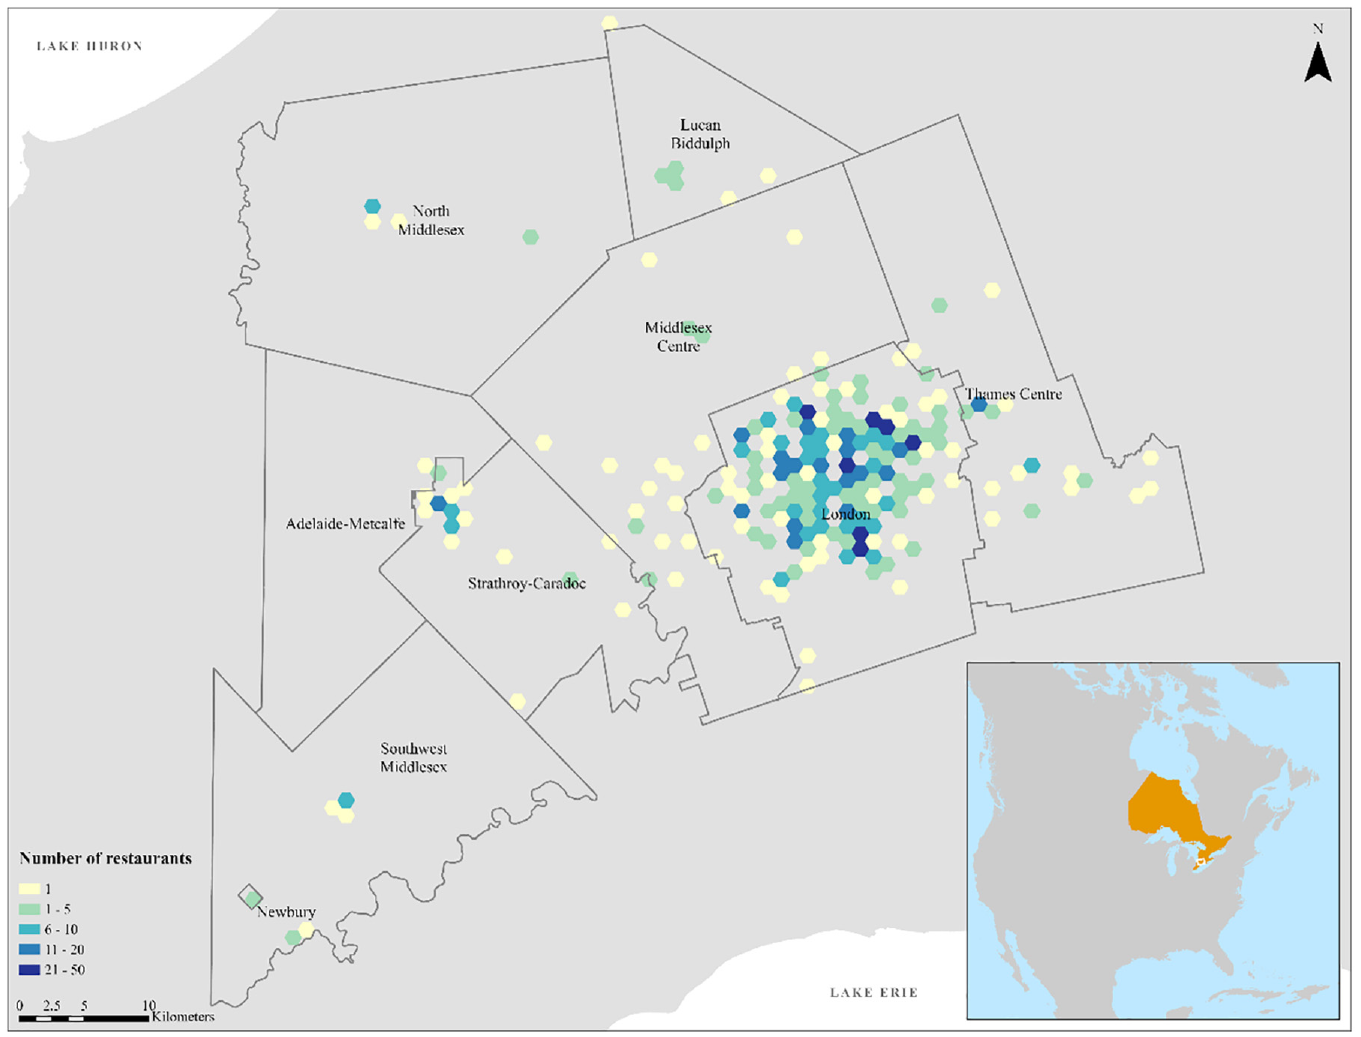
Map of study area, local municipalities and density of restaurants. Inset map shows the location of the study area in the Province of Ontario which is highlighted within North America. Tessellations were drawn in 1200 m bins to provide a visual abstraction of the density of restaurants, as the sheer density in some areas would not be an accurate representation of the spatial pattern of restaurants in the study area.
London is a typical midsized North American city with a primary central business district and set of compact small-block neighbourhoods in the core area, surrounded by concentric rings of newer post-war super-block-style developments with major commercial nodes orientated towards automotive transportation modes (City of London, 2018; Cobban, 2003; Hodge and Gordon, 2008; Larsen and Gilliland, 2008; Novak and Gilliland, 2011). The surrounding rural county is primarily agricultural, with small towns and villages that serve as retail and service centres (Middlesex County, 2006). The region’s metropolitan structure and evolution adopts a classical form applicable to many other global contexts (Hartman, 1950; Hoyt, 1964). Middlesex–London is also spatially and economically independent from the much larger global metropolis of Toronto – existing outside this major sphere of influence in Ontario’s metropolitan structure (Hall and Hall, 2008; Ministry of Municipal Affairs and Housing, 2020). Thus, local socioeconomic processes are relatively unaffected by broader mega-regional processes occurring in the Greater Golden Horseshoe region dominated by Toronto.
Middlesex–London is historically known as a manufacturing and regional service centre, yet deindustrialisation in the 1990s resulted in a loss of the majority manufacturing industrial base (Bradford, 2010). Economic activity is now primarily focused on the agricultural, finance, insurance, education, healthcare and service sectors (Cleave et al., 2019). Relevant to this analysis, approximately 15,745 (7%) of the census division’s labour force were employed prior to the pandemic in food service- and hospitality-related positions (Statistics Canada, 2023). This focus on service and knowledge sector economic activity is typical of smaller urban areas in Western industrialised nations (Felipe and Mehta, 2016). Therefore, Middlesex–London is a typical midsize North American metropolitan area suitable for a highly detailed individual case study that has translational relevance to many other international contexts.
Data collection
The restaurant survival tracking dataset developed for this analysis was initially formed from food safety inspection records collected prior to March 2020 by the Middlesex–London Health Unit which administratively covers the same geographic region as the study area (Middlesex–London Health Unit, 2020). Restaurants in the food safety inspection database were geocoded to points representing precise business locations using the street address on file. These inspection records, as they were completed prior to March 2020, provide the baseline pre-pandemic situation for the restaurant sector within the study area. From this baseline, the study team gathered additional information about each restaurant, including its operating status in May 2020 and December 2020. While SafeGraph and other third-party data brokers may be widely available in the USA and Europe, there is no equivalent provider of this type of data in Canada. Therefore, a bespoke data collection strategy was pursued to achieve a similar level of detail to those third-party commercial datasets.
Phone calls and in-depth web searches on social media platforms and relevant websites (e.g. Google Maps, Yelp, TripAdvisor) were conducted a minimum of twice over the study period to ascertain the operating conditions of restaurants across the province, recording information via Survey123 for ArcGIS (Esri, 2020). The data collection form included validation checks enforced through software controls, and manual review by multiple researchers to ensure data quality and integrity. Specifically, a unique identification number was created for each restaurant that had to be successfully input by the reporting researcher to retrieve existing information about the restaurant from the database, including the address, phone number, email and website on file from the food safety inspection dataset. Once a report was submitted, two other members of the research team validated that the information submitted about the restaurant was accurate before it was merged into the database. Furthermore, random audits of the database were undertaken to confirm the accuracy of the reported information.
Measures
The bespoke nature of the dataset used in our analysis required the creation of new measures from multiple data sources with a set of conditional rules (Figure 2). The process to create and amalgamate these measures into one dataset for our study was managed with ArcGIS Pro and Survey123 for ArcGIS (Esri, 2020).
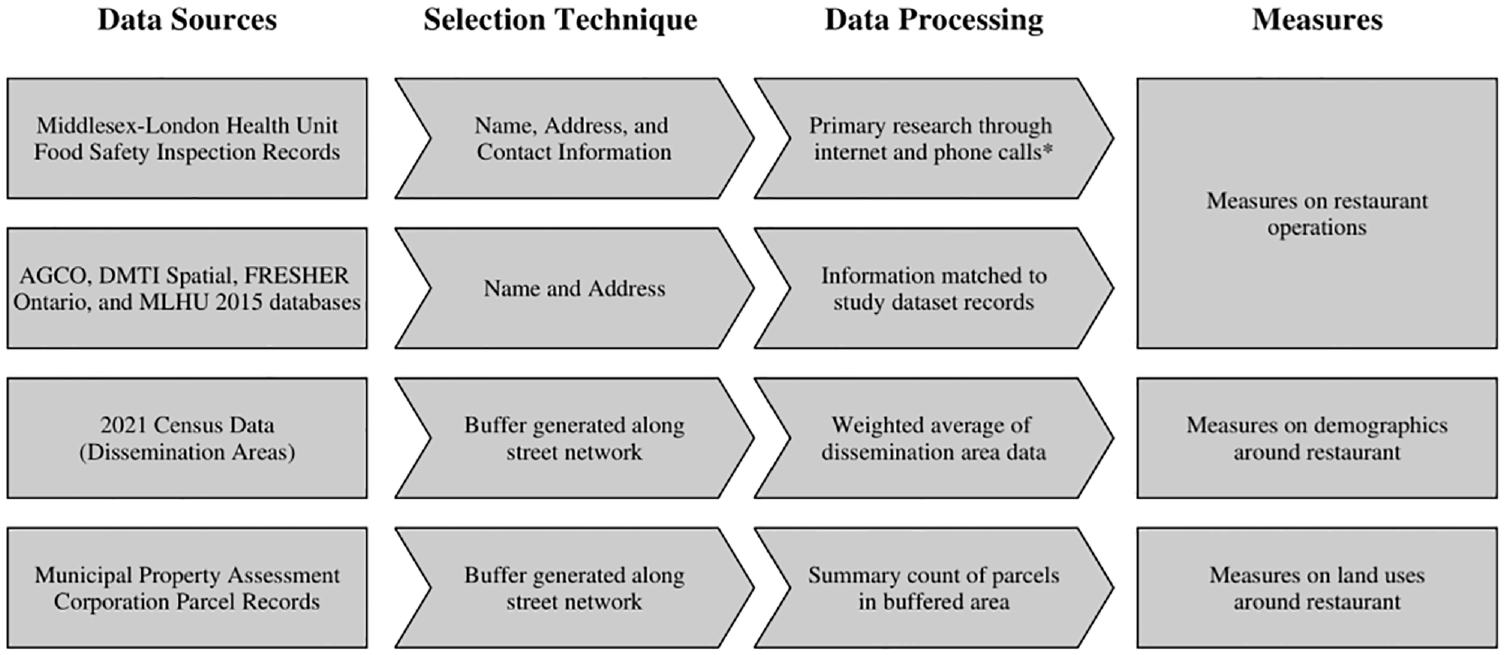
Flowchart describing data sources and processing techniques to develop measures.
The outcome variable in the analysis was the operating status of the restaurant in December 2020, as identified by the study team (Gilliland et al., 2021). All other variables included in the analysis are static in time. Variables were either generated in May 2020 through primary research by the study team or are sourced from datasets that were current as of May 2020 as indicated by the responsible data authority. The food safety inspection dataset was downloaded by the study team on 20 March 2020 (Middlesex–London Health Unit, 2020). Restaurants are inspected by the health unit at least once per year, with an inspection date noted on file. All restaurants in the dataset had an inspection completed between March 2019 and March 2020. Therefore, this dataset represents which restaurants were open before the pandemic restrictions were implemented in March 2020. The study team then determined from this snapshot through primary research, as described earlier, which restaurants were still open or closed in May 2020 and December 2020. While some new restaurants may have opened between April and December 2020, given the poor economic conditions faced by the sector, this would have been a rare occurrence.
Operational factors, such as the methods of delivery and ordering by the restaurant, and the presence of a drive-through and/or outdoor patio were determined from primary research by the study team (Gilliland et al., 2021). Alcohol licence status was determined by matching the name and street-level address to information in the Alcohol and Gaming Commission of Ontario’s (2020) database. Restaurant operating status in May 2015 was determined by matching the name and street-level address to information in an archived copy of the Middlesex–London Health Unit’s food inspection database. Restaurants are classified as chains if their name appears five or more times in the study team’s province-wide dataset (Gilliland et al., 2021). A proxy measure of restaurant agglomerations counts the number of other restaurants within a 400-metre buffer along the street network from each restaurant, aligning with prior investigations of restaurant agglomeration patterns (Jung and Jang, 2019). While alternative methods proposed in Macdonald et al. (2022) and Ballantyne et al. (2023) present an additional method to determine retail and leisure centre agglomerations, there are no equivalent data available in Canada to construct such a classification index.
Socio-demographic-related measures for the neighbourhoods surrounding each restaurant are sourced from the 2021 Census at the dissemination area (DA) scale (Statistics Canada, 2023). The Canadian Census is only completed once every five years, so the 2021 dataset is the closest temporal match to the conditions that would have been found in 2020. The DA is the smallest geographic unit for which Statistics Canada releases socio-demographic data and is an often-used proxy for neighbourhoods in Canadian urban studies (Healy and Gilliland, 2012). Land use measures, such as the amount of residential, entertainment, retail and small (<10,000 m2) or large office (>10,000 m2) space, were determined by the Municipal Property Assessment Corporation’s (2021) standardised coding system for the entire province. These variables were processed by counting the number, or proportion in the case of residential uses, of individual parcels within a 1200-metre buffer along the street network from each restaurant. These variables were processed by a weighted average by proportional land area inside a 1200-metre buffer along the street network from each restaurant. The 1200-metre network distance represents a common service area used to estimate restaurant market areas in North America (Cissé et al., 2020; Sadler et al., 2011; Smith, 1985).
Statistical analysis
We modelled business operating status in December 2020 using a generalised linear model with a binomial response function (Field et al., 2012). A restaurant’s operating status in December 2020 (Y12) is used as the binomial dependent variable, coded as a value of 1 meaning the restaurant is closed and a value of 0 meaning the restaurant is open. Models were fitted three times using variables related solely to restaurant operations, solely to demographics and nearby land uses and all the variables together (equation (1)).

There is adequate statistical power for the regression models given that the sample size is 10 times greater than the number of independent variables (Schaafsma et al., 2021). The logistic binomial regression models were run using the glm function in the MASS package (R Core Team, 2020; Venables and Ripley, 2002). Model selection was informed by Akaike Information Criterion (AIC) tabular analysis, completed using the aictab function in the AICcmodavg package (Burnham and Anderson, 2002; Mazerolle, 2006). Pseudo-R2 values using the Craig–Uhler approach were calculated with the pR2 function in the pscl package (Jackman, 2020). A p-value < 0.05 is considered statistically significant. The variance inflation factor (VIF) was used to test for multicollinearity between covariates in the model (Fox and Weisberg, 2019). The VIF is calculated using the vif function in the CAR package, with a VIF > 3 set as the limit for variable removal due to inflation (Fox and Weisberg, 2019). The clarkevans.test function in the spatstat package (Baddeley et al., 2015), permutated 1000 times with Donnelly edge correction (Clark and Evans, 1954; Donnelly, 1978), is used to determine if restaurants that were closed in December 2020 are more spatially clustered as compared to restaurants that were open in December 2020, and all restaurants in the study area.
Results
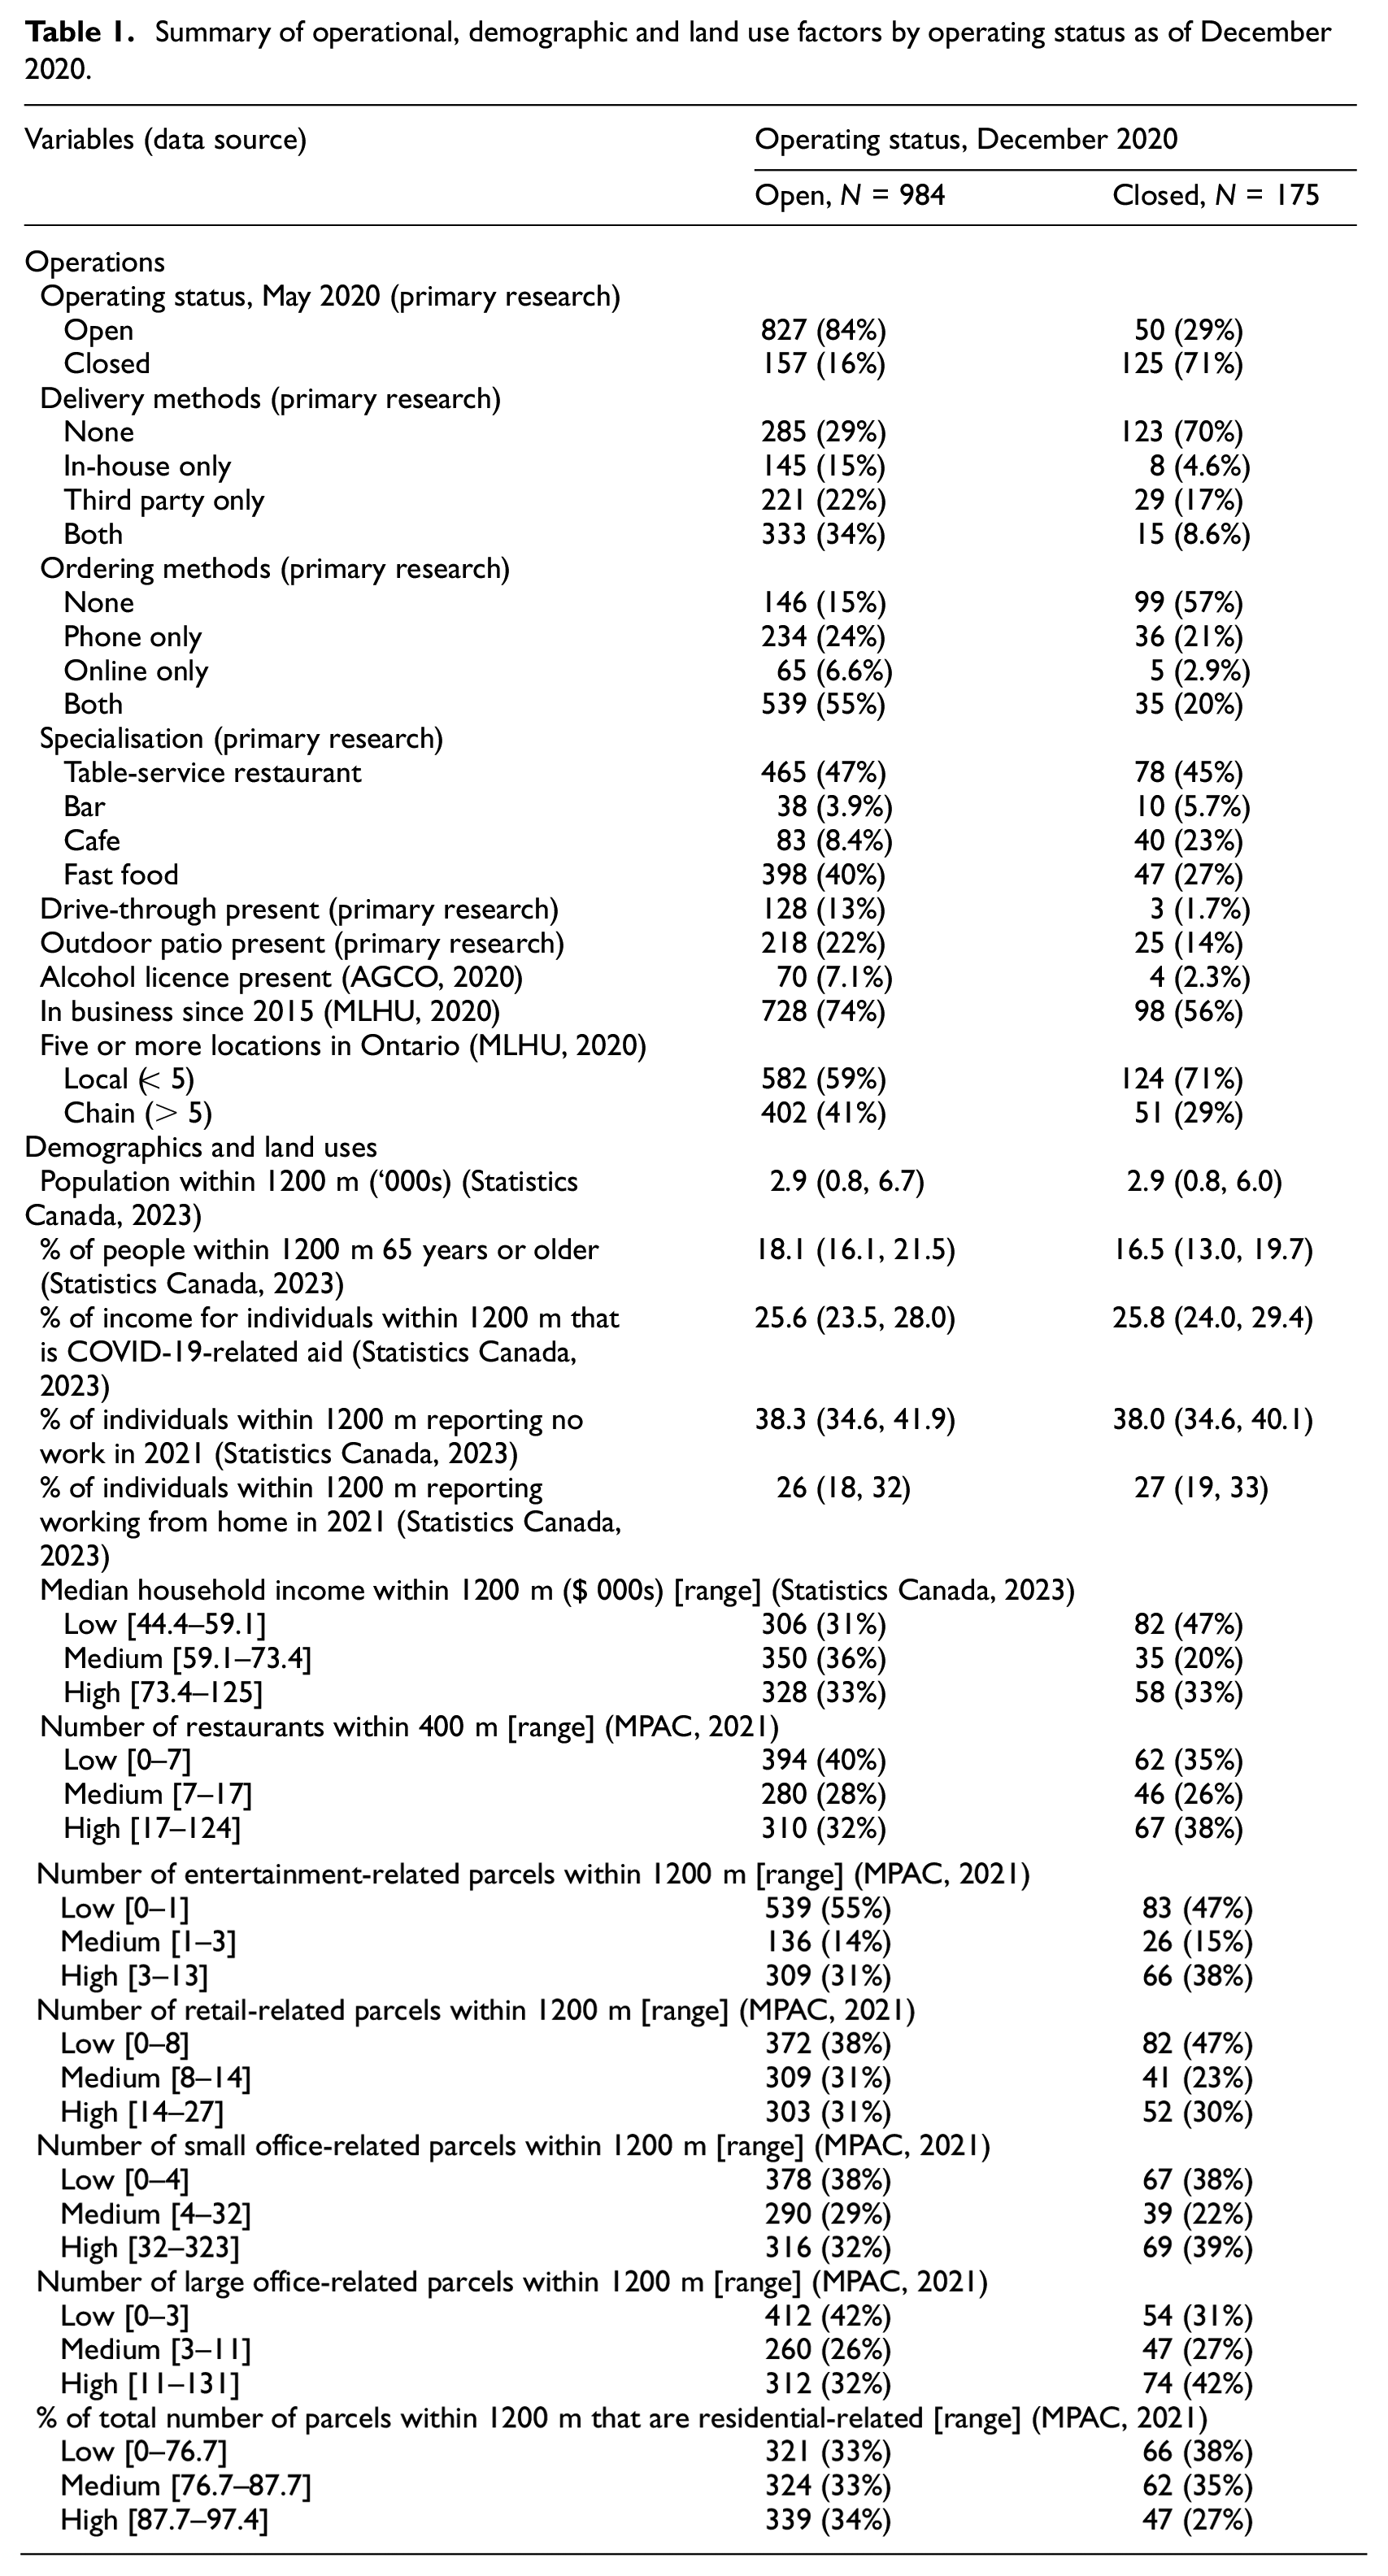
There were 1159 restaurants in the study area initially (prior to March 2020) and thus included in the analysis, with 984 (85%) still open in December 2020 (Table 1). No variables were removed from the analysis based on VIF scores.
Summary of operational, demographic and land use factors by operating status as of December 2020.
How did business operations influence survival?
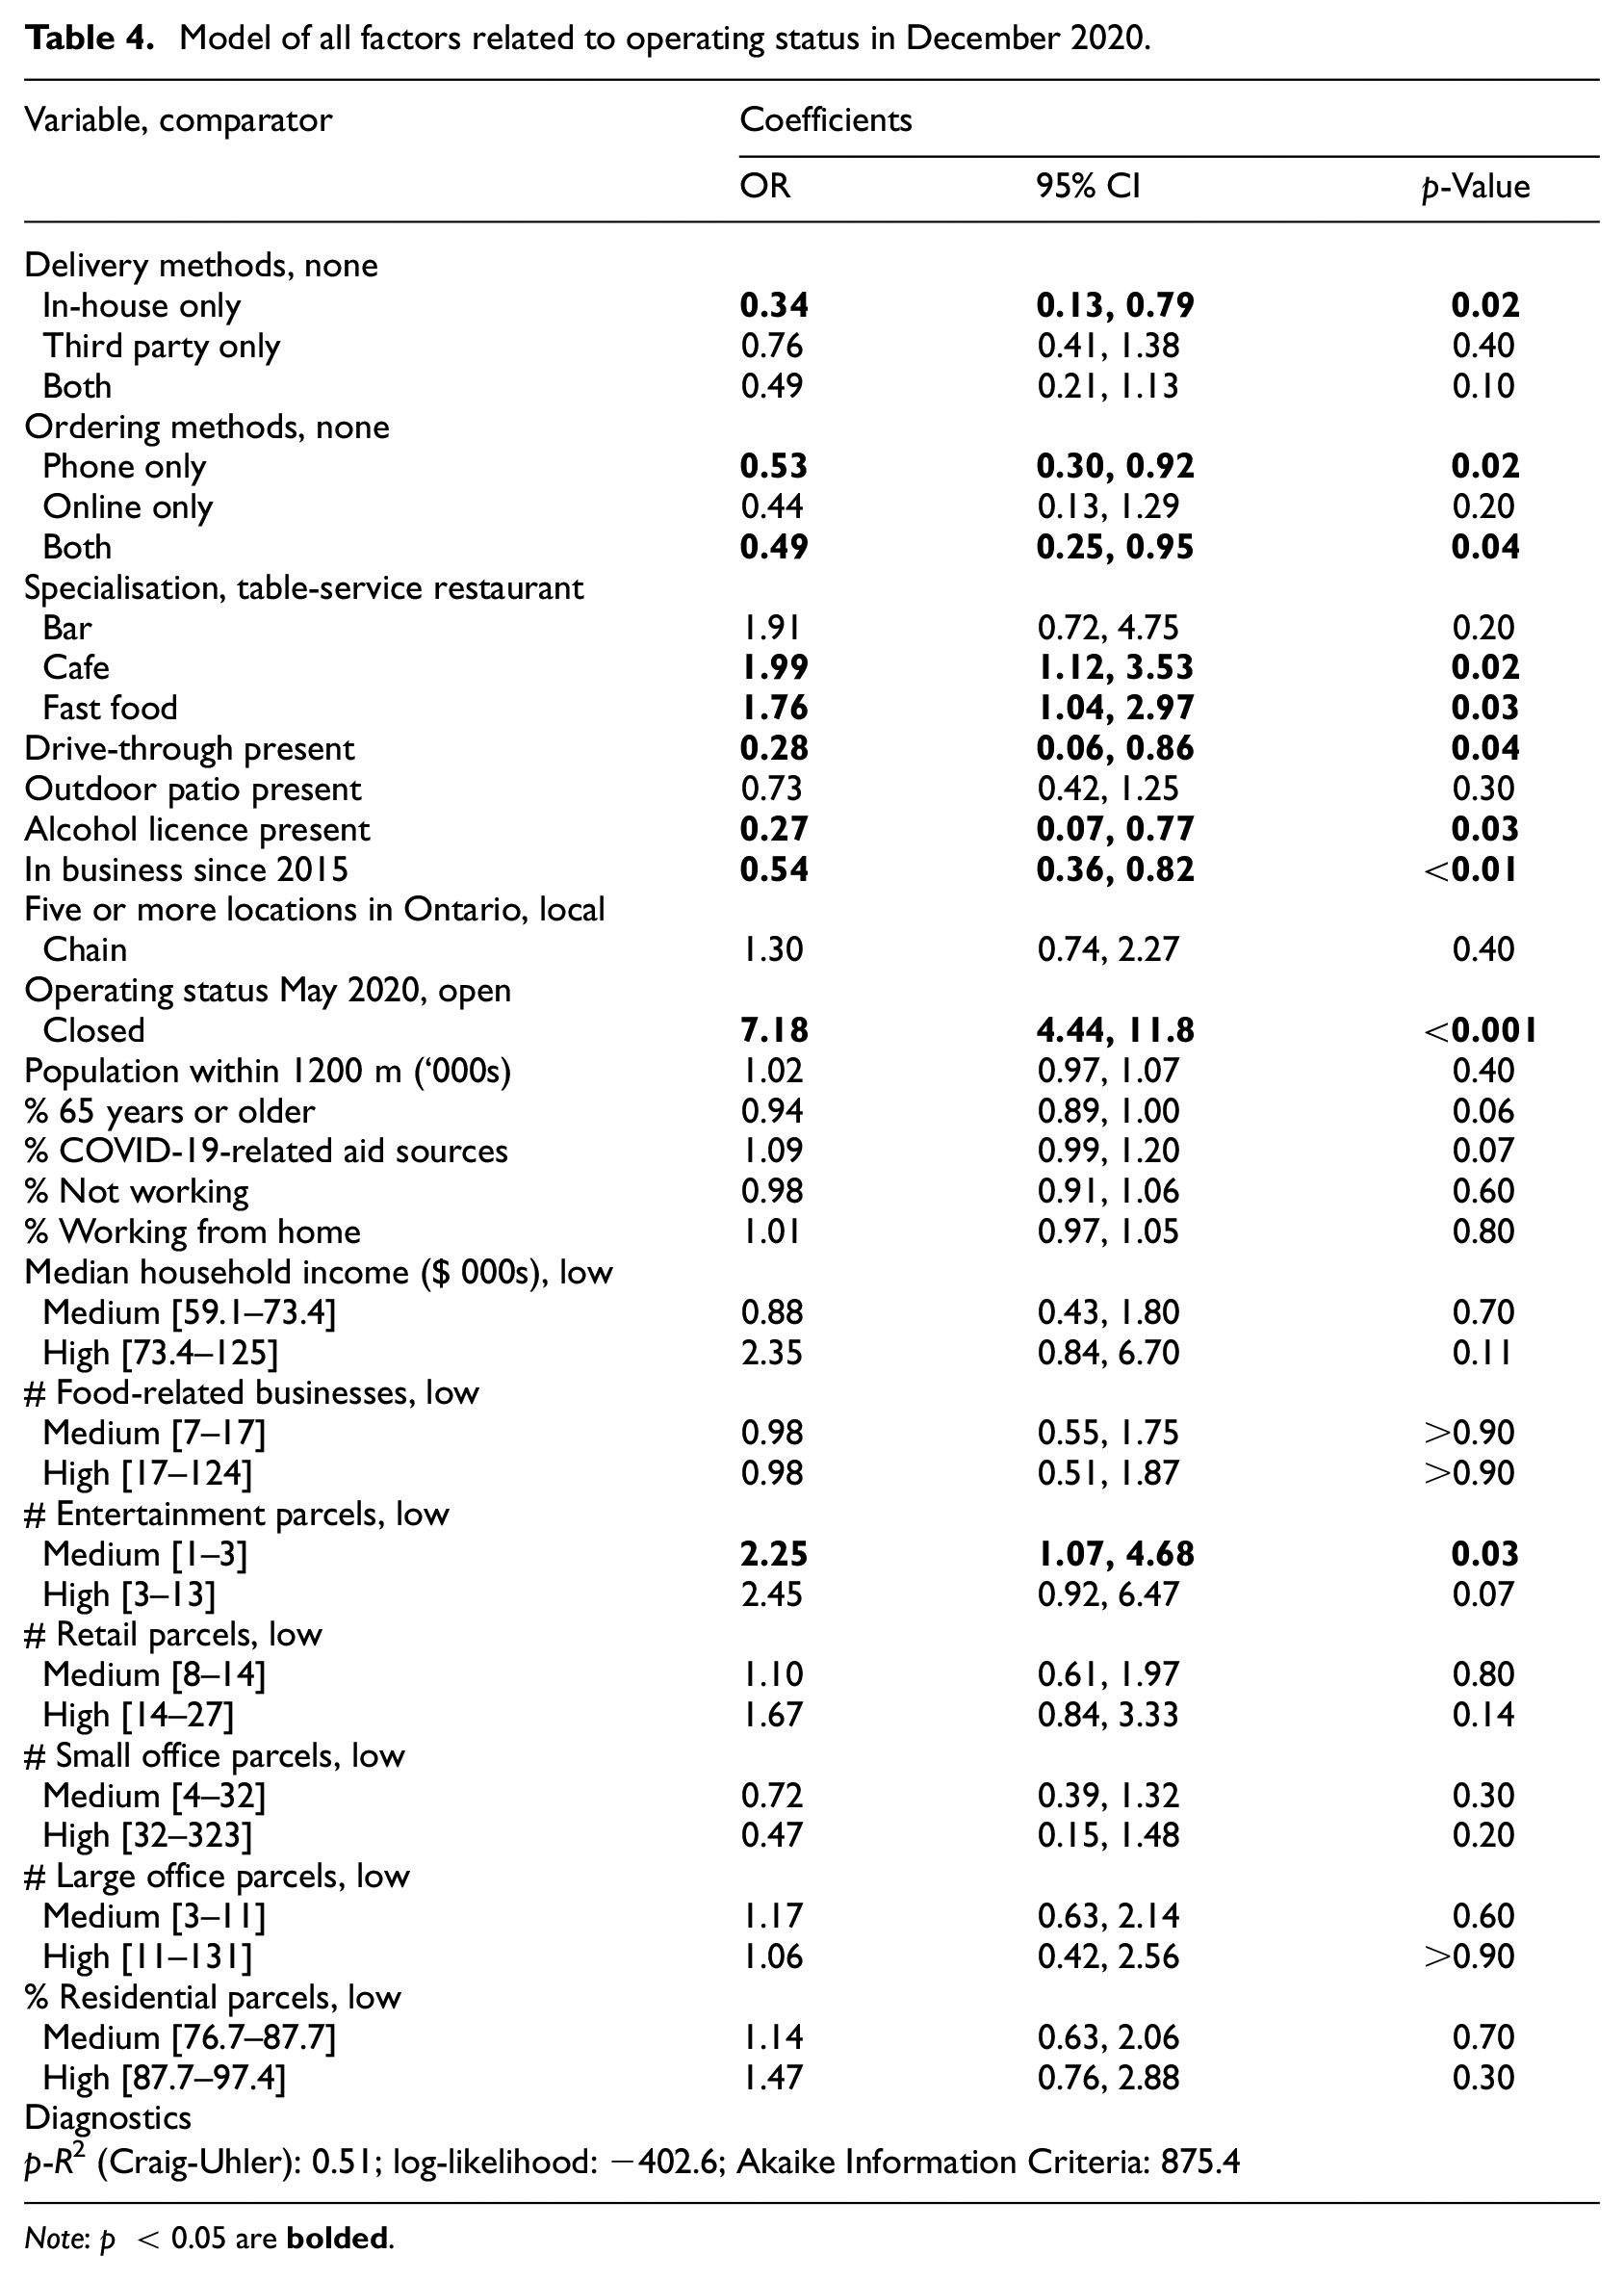
Restaurants that offered in-house delivery only were less likely to be closed in December 2020, with no correlation observed between those using third-party delivery services or both in-house and third-party delivery (Table 2). Only offering online ordering did not correlate with survival. Cafes and fast-food outlets were significantly more likely to have closed by December 2020 as compared to table-service restaurants. The presence of a drive-through and having an alcohol licence were significantly correlated with a lower chance of being closed in December 2020. Restaurants that had been in business for at least the previous five years were significantly less likely to be closed in December 2020. Finally, those restaurants that were closed in May 2020 were significantly more likely to be closed in December 2020.
Model of operational variables related to operating status in December 2020.
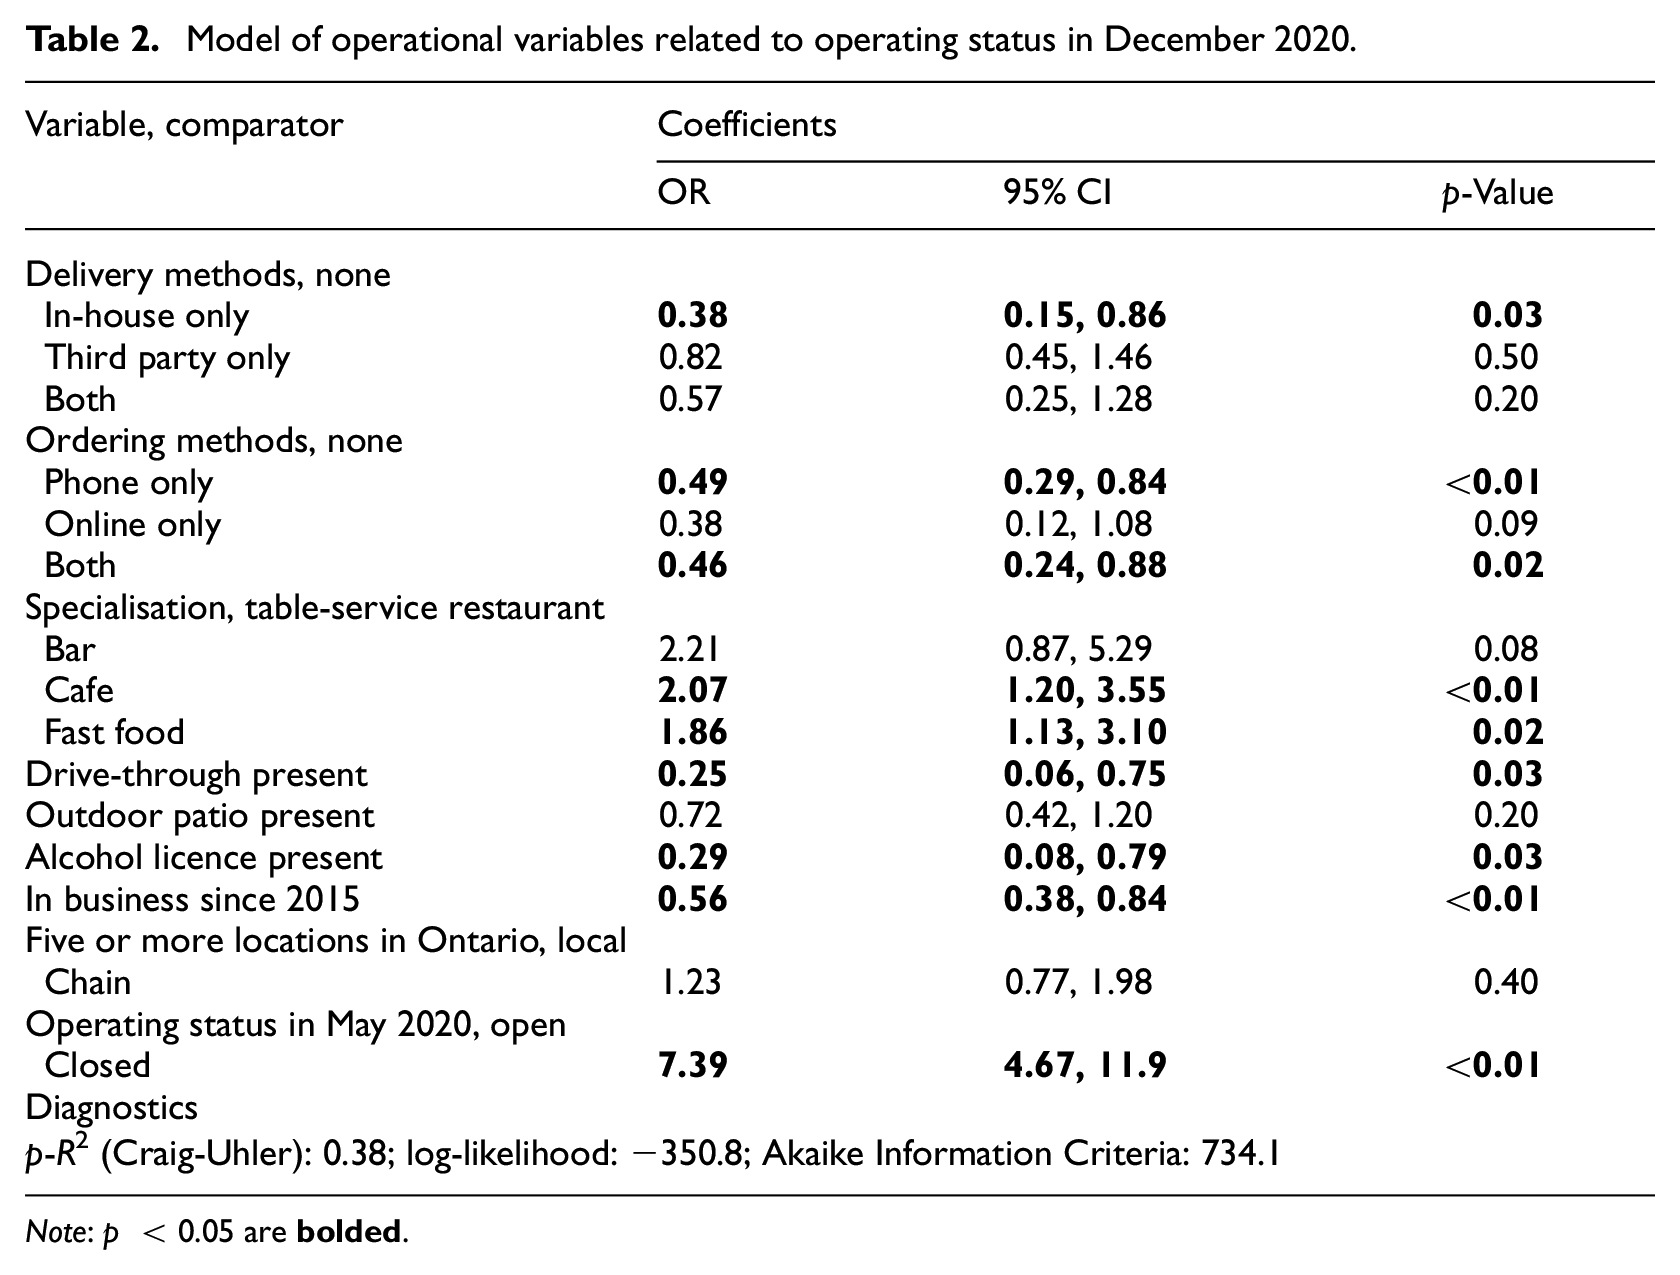
Note: p < 0.05 are
How did surrounding demographics and land uses influence survival?
Restaurants surrounded by neighbourhoods that had a greater proportion of their population over the age of 65 were less likely to be closed in December 2020 (Table 3). Restaurants surrounded by neighbourhoods with a greater proportion of the population receiving COVID-19 aid were more likely to be closed. Restaurants in areas with a greater proportion of entertainment-related land uses were twice as likely to be closed in December 2020.
Model of demographic and land use variables related to operating status in December 2020.
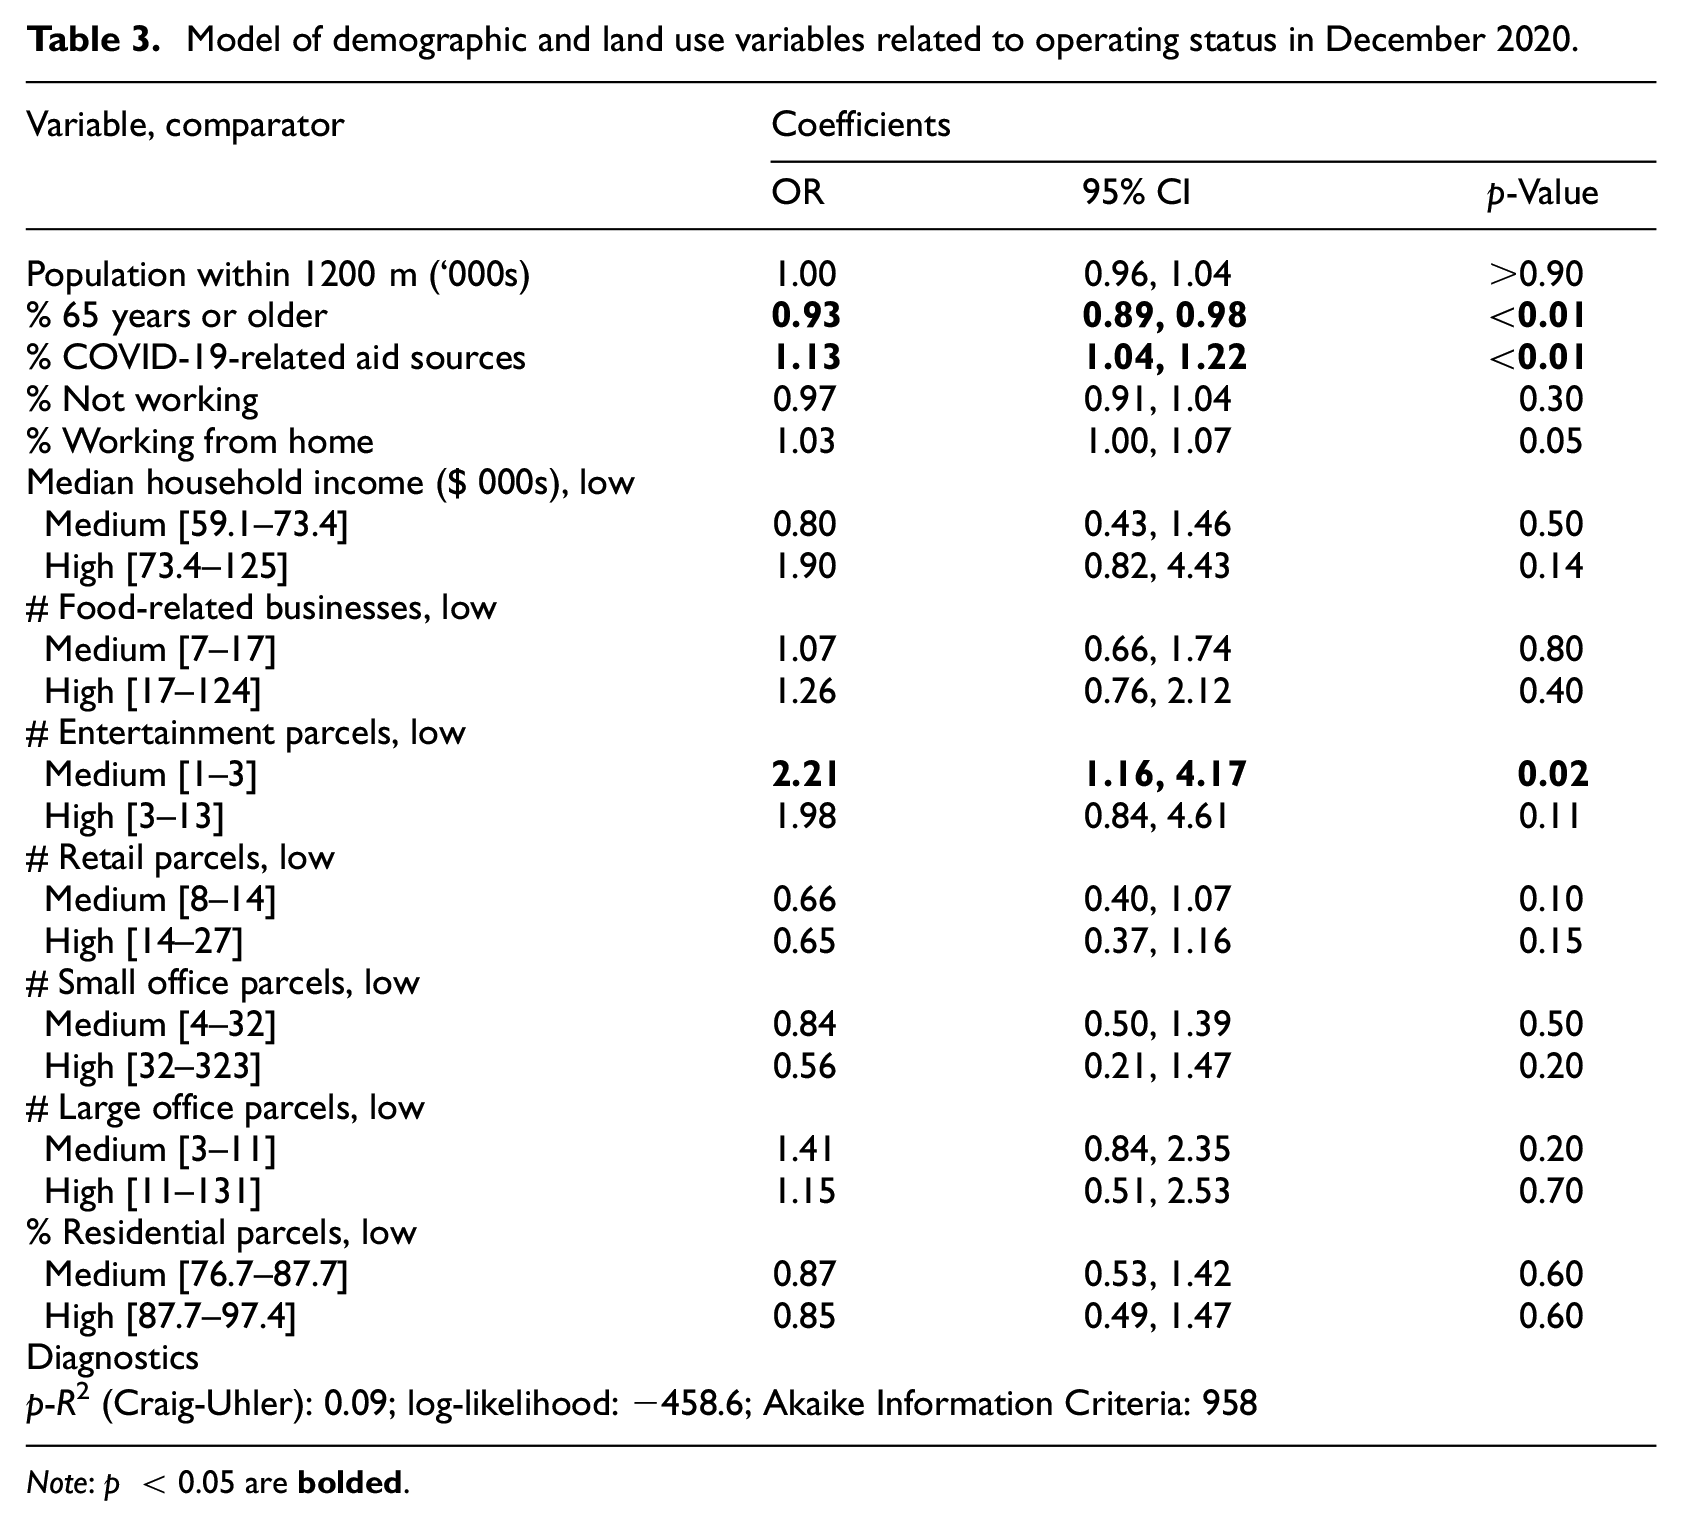
Note: p < 0.05 are
How did business operations, demographics and land uses influence survival?
The correlations found in the previous two models held in this combined model, with the exception of the demographic variables no longer being correlated with operating status in December 2020 (Table 4).
Model of all factors related to operating status in December 2020.
Note: p < 0.05 are
The Akaike Information Criterion analysis of the models reveals that the operations-related variables are more parsimonious in modelling restaurant operating status in December 2020, as compared to demographics and land uses (Table 5).
Akaike Information Criterion analysis for models of operating status in December 2020.
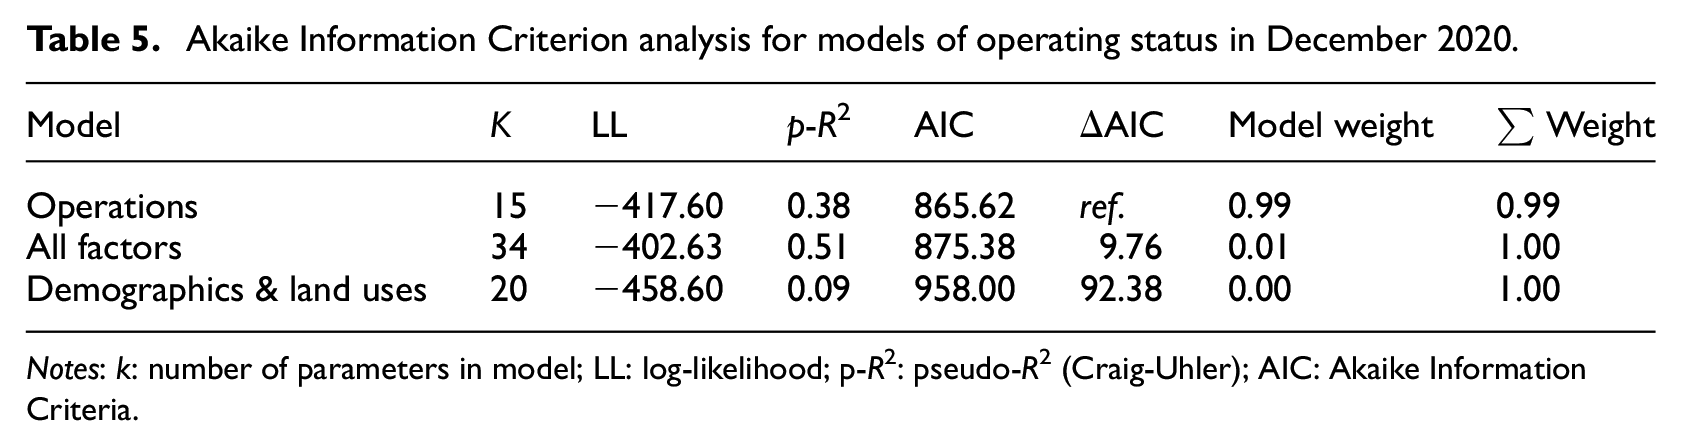
Notes: k: number of parameters in model; LL: log-likelihood; p-R2: pseudo-R2 (Craig-Uhler); AIC: Akaike Information Criteria.
Were restaurant closures spatially clustered?
The Clark–Evans test revealed that all restaurants were significantly clustered (R = 0.17, p < 0.01, Ho: R > 1) in the study area. When only considering restaurants that were open in December 2020, they were significantly clustered relative to a random arrangement of restaurants but had a greater average nearest neighbour distance than all restaurants (R = 0.18, p < 0.01). When only considering restaurants that were closed in December 2020, they were significantly clustered but exhibited a substantially greater average nearest neighbour distance than (R = 0.26, p < 0.01) all restaurants, and open-only restaurants.
Discussion
Our analysis reveals the role of business-level operational decisions, as well as surrounding demographics and land uses, on restaurant survival during the first nine months of the COVID-19 pandemic. Overall, operational decisions were significantly associated with restaurant survival, including the types of ordering and delivery methods offered to consumers, the presence of a drive-through, possessing an alcohol licence and being in business for more than five years. In terms of land uses and demographics, restaurants near mid-sized concentrations of entertainment parcels were more likely to close. Closed restaurants were significantly less spatially clustered than restaurants that were open and the general point pattern of all restaurants in the study area.
The role of operational factors
Restaurant success in the study region was clearly most affected by the decision to close at the start of the pandemic in May 2020, rather than to turn to pickup and delivery-only operations. This choice to not continue operating likely constrained future performance, as businesses that did pivot during the first lockdown event may have assumed a dominant market position. Table-service restaurants had better survival than fast-food outlets. This difference could be from table-service restaurants being able to provide indoor and outdoor dining experiences during summer 2020 (June–August), while fast-food restaurants were likely constrained by a lack of space for both indoor and outdoor dining. Table-service restaurants with alcohol licences may have also benefitted from creating large outdoor licensed patios during the summer. However, what is more likely, given Ontario’s strict alcohol licensing landscape, is that the policy change in March 2020 to allow table-service restaurants to sell all forms of alcohol for takeaway and delivery (Government of Ontario, 2020) may have had a larger impact on survival given that it is a substantial portion of their revenue stream in an on-premises consumption context. Moreover, restaurants that were in business prior to 2015 were considerably more likely to survive than newer businesses. These restaurants likely had greater cash reserves, more experienced staff and management, greater real estate stability, dominant market presence and customer loyalty (Parsa et al., 2005). Consumer use of online ordering and delivery platforms in the restaurant industry expanded considerably from 2019 to 2020 (Brewer and Sebby, 2021). In our study, third-party delivery platform participation did not influence restaurant survival, while in-house delivery had a strong protective effect. Li and Wang (2020) also found that third-party delivery platforms primarily benefitted fast-food and chain restaurants but not independent or table-service restaurants.
The role of surrounding demographics and land uses
We anticipated that the proportion of individuals working from home and income-based factors would have a substantial impact on restaurant survival. The presence of older adults did correlate with a lower chance of restaurants being closed in December 2020. Given that older adults were encouraged to, and did, remain at home during the early months of the pandemic (Brankston et al., 2021), they may have relied on takeaway and delivery more than other population groups that still regularly visited grocery stores and cooked from home. Restaurants surrounded by neighbourhoods with a greater proportion of people receiving government income assistance were more likely to be closed as of December 2020. The design of these assistance programmes in Canada led to quasi-legislated poverty where the government assistance received did not cover total income loss (Pin et al., 2023). This lack of income likely led to a cut in discretionary expenses, thereby reducing spending at nearby restaurants. While these sociodemographic factors did partially explain restaurant survival as of December 2020, their effects disappeared when considering all factors together.
Turning to land use factors, restaurants near concentrations of entertainment parcels – arenas, theatres, live music venues – were considerably less likely to survive, given that all entertainment venues were forced to close during the pandemic. This association aligns with other studies on the spatial dependency between these two sectors (Dock et al., 2015; Smith, 1985). Given that all forms of entertainment were closed for 2020, restaurants in these areas likely lost a considerable amount of foot traffic and ancillary business.
Policy implications
The provincial policy to limit restaurant operations to takeaway and delivery only in March 2020 had a considerable impact on restaurant survival. For restaurants that were not prepared to pivot, the choice to close by May 2020 had long-term repercussions for their survival through to December 2020. While public health action was necessary, the lack of any restaurant-specific financial support or targeted transition grants and resources during the first months likely had an outsized impact on newer, unprepared, independent restaurants (Gilliland et al., 2021). This failure to directly support restaurants has likely hampered economic recovery efforts in many urban centres.
Urban policy could have been more supportive of restaurant operations in the short term. For example, reserving short-term parking spaces near clusters of restaurants could support takeaway and delivery business models, as was done in London and elsewhere (Gilliland et al., 2021). Enabling the creation of large patio areas for restaurants on parking spaces for underused retail and entertainment locations could create more outdoor dining capacity. However, long-term recovery of the restaurant sector may be enabled through addressing the loss of attractiveness, vibrancy and business confidence in urban areas (Glaeser, 2022; Honey-Rosés et al., 2020; Mouratidis, 2021; Wray et al., 2020). The loss of daytime foot traffic due to remote work, and the physical manifestation of serious social and health issues in downtowns (Florida et al., 2023), has likely stunted the recovery of existing businesses that have survived the pandemic and driven away potential new businesses from opening in these areas.
In the Canadian context, wealth, cultural capital and urban vibrancy could concentrate in the wealthiest commercial and entertainment areas often found at the peripheries of the city. At a regional scale, there may be a need for major corrective policy action to regenerate the cores of small and midsize cities that do not have sufficient residents and services to maintain economic attraction for new businesses and consumers. The re-envisioning of the ‘high/main street’ may be necessary to the long-term success of these areas (Jackson et al., 2024; White et al., 2023).
Early in the pandemic, restaurants were temporarily allowed to sell beer, wine and pre-mixed alcohol for takeaway and delivery. The province has subsequently made this regulatory change permanent (Government of Ontario, 2020). This alteration to Ontario’s alcohol sale regulations could have far-reaching effects on urban vitality over the long term by increasing the access to alcohol in local neighbourhoods and encouraging consumption in non-traditional environments outside of restaurants, such as in public parks, and more regularly at home with takeaway meals. While there are likely positive spinoffs for the broader economy, there could be new negative externalities from enabling greater access to alcohol that would need to be addressed in the urban environment through policy, programme and design changes.
Methodological limitations
There are several methodological limitations that should be noted about our study. First, the outcome variable and many of the predictor variables were significantly clustered when assessing spatial autocorrelation. This clustering effect may mean the models are partly a function of broader area-level factors. This result is conceptually sound given restaurant locations are often determined by local government zoning policy, which restricts their location choices to high-traffic avenues and core commercial nodes in London and the smaller rural townships (City of London, 2018). Second, although restaurants are known to naturally cluster for competitive advantage (Jung and Jang, 2019; Smith, 1985), they make independent choices about their own operations regardless of the decisions of their neighbours. Yet, our dataset does not include information on historical patterns of operation or financial performance. Third, the surveying of operating status only during May 2020 and December 2020, both times with the most severe set of restrictions placed on restaurants by the municipal public health unit, may not be truly representative of restaurant operations during the reference period. Certainly, some restaurants could have been open during the summer months and have chosen to wind down operations during these months that were under study. However, given the low absolute number of restaurants closed at both timepoints in the sample, there are likely very few cases of this pattern of operation. Fourth, while identifying if restaurants are located within retail agglomerations could enable additional insights about survival, the methods proposed in Macdonald et al. (2022) and Ballantyne et al. (2023) are not achievable in the Canadian context due to the lack of comparable data. The development of a Canadian-specific retail centre typology similar to the typologies available in the UK and USA is beyond the remit of our study; however, the measures included in our analysis are sufficient proxies for this typological approach to delineating retail and leisure agglomerations.
There are minor temporal mismatches in our dataset that could affect the accuracy of our findings. We did assemble a properly sequenced in time dataset that captures which restaurants were open prior to the pandemic (as of the date of their last permit inspection between March 2019 and March 2020), which were open in May 2020 and which were open in December 2020. Our dataset is appropriately constructed to measure which restaurants failed after the pandemic-based restrictions were introduced in the study area. However, our data collection strategy would not have captured any new restaurants that opened between April and December 2020 or restaurants that had closed within 12 months of their last inspection date. This latter group would have been identified as a closure that occurred in May 2020, even though it may have occurred prior to the pandemic but after the last food safety permit inspection. We also only evaluated restaurant operational decisions, such as using third-party delivery platforms or having a patio, as of May 2020. Restaurant operating conditions could have changed from May to December 2020 or could have been different from their pre-pandemic condition. In addition, the Canadian Census is only collected once every five years, so our sociodemographic data are current as of 2021 which is temporally closer to our time period of interest than 2016. Therefore, our dataset is possibly a reflection of endogenous decisions made by restaurants during the pandemic, rather than a measure of how pre-pandemic conditions faced by restaurants affected performance over the time period of study. However, practically our dataset is constructed from the best available data sources in Canada to provide an approximation of how a set of restaurants that were open prior to the pandemic made decisions during the pandemic and subsequently succeeded or failed by December 2020.
Conclusion
Restaurant survival during the COVID-19 pandemic is significantly associated with individual business decisions about their operations and marketplace choices, and in general is not significantly associated with contextual spatial factors. It appears that the traditional function of ‘location, location, location’ in urban geography was not the most important predictor of restaurant survival during the pandemic. However, the features of individual restaurant locations are manifestations of long-term spatial processes and planning decisions. The pandemic appears to have altered the theorised relationships on how urban processes and landscapes influence restaurant success. Our study would suggest that classical retail location theories have been disrupted, requiring the positing of new hypotheses about the relationships between people and place.
Our study counters considerable dogma (Gilliland et al., 2021) in the sector around the importance of online accessibility for consumers. The use of third-party delivery platforms did not affect restaurant survival. The effects of third-party delivery platforms and other digital marketplaces for restaurants should be investigated further with an urban lens, given their high delivery and service charges, use of casualised labour, incentivisation of insular land use arrangements when operating under the ‘ghost kitchen’ model and lack of knowledge about their geographies of use. Extrapolating from our findings, the formation of ‘ghost kitchens’ as a by-product of third-party delivery platforms that operate exclusively online without an on-premises dining or takeaway experience available to consumers could have wide-ranging implications for urban development (Rinaldi et al., 2022). This new operating model could alter the urban landscape by decoupling the need for restaurants to locate in high-traffic commercial areas to attract consumers. Which restaurant types are converting to this model, where they are locating their ‘ghost kitchens’ and if their shopfronts are being retained in traditional restaurant locations should be a subject of further investigation.
Restaurant closures which are proximal to entertainment land uses, that may have also become vacant, will need to be tracked post pandemic to evaluate if these properties rebound with new restaurants or other retail tenants, or struggle with attracting new tenants that could have cascading impacts on the vibrancy and attractiveness of these areas. Follow-up studies should also examine effects from business improvement districts as well as other retail agglomeration-orientated marketing and policy initiatives, and how they translate to broader socioeconomic performance at an area level. Overall, this study makes a novel contribution to the emerging evidence about the impacts of a global pandemic on restaurants, and in turn how urban processes have been disrupted and altered by the pandemic.
Footnotes
Acknowledgements
The authors wish to acknowledge the efforts of the Human Environments Analysis Lab research assistants and volunteers that supported the Food Retail Environment Study for Health and Economic Resiliency study. The authors are grateful for the feedback received from reviewers which considerably strengthened the manuscript.
Declaration of conflicting interests
The author(s) declared no potential conflicts of interest with respect to the research, authorship, and/or publication of this article.
Funding
The author(s) disclosed receipt of the following financial support for the research, authorship, and/or publication of this article: The authors received a Research Catalyst Grant from The University of Western Ontario, and a COVID-19 Rapid Research Fund grant from the Ontario Ministry of Colleges and Universities.