
Abstract
Residential choices and school choices are intimately connected in school systems where school admission relies on proximity rules. In countries with universal school choice systems, however, it remains an open question whether families’ residential mobility is tied to the choice of their children’s school, and with what consequences. Using administrative data on all children approaching primary-school age in Sweden, we study to what extent families’ financial and socio-economic background affects mobility between neighbourhoods and the characteristics of schools chosen by moving families. Our findings show that families do utilise the housing market as an instrument for school choice over the year preceding their firstborn child starting school. However, while families who move do ‘climb the social ladder’ by moving to neighbourhoods with more households of higher socio-economic status, their chosen schools do not appear to be of higher academic quality compared to those their children would otherwise have attended.
Introduction
Educational choices and outcomes are intimately connected to family characteristics such as income, wealth and parents’ education (Björklund and Salvanes, 2011; Coleman, 1968). In cities where school choice is shaped by residential location, family wealth and income play a crucial role in enabling access to schools of higher academic quality through the housing market. Whereas wealthier families have the financial means to relocate, low-income families tend to have less flexibility in both residential and school choices (Cuddy et al., 2020; Holme, 2002). It remains an open empirical question, however, whether, in welfare states with school choice systems designed to level the playing field for low-income families, high-income families use residential mobility to choose schools that offer higher academic quality and pupil peer groups of equal or higher socio-economic status.
For families with young children, residential location and school choices tend to influence each other (Boterman, 2019), with neighbourhoods as the geographic determinant of pupils’ educational opportunities (Lareau and Goyette, 2014). In the US, for example, both school and residential choices are strongly driven by families’ economic situation, and school choices are largely driven by residential location (Ely and Teske, 2015; Owens, 2016).
A similar close connection between school and residential choices has been noted in European countries, with parents strategically moving to catchment areas where schools are perceived as better (Boterman, 2019; Butler and Robson, 2003; Kauppinen et al., 2022; Rogne et al., 2021). Whereas parents may prefer ‘high-quality schools’, such schools are often difficult to identify when accessible information on school effectiveness is limited or biased (Ainsworth et al., 2023; Beuermann et al., 2023; Rothstein, 2006). Hence, some studies note that when relocating to other residential areas, parents may rely on neighbourhood characteristics and pupil peer composition such as racial and socio-economic characteristics as a proxy for school quality (Abdulkadiroğlu et al., 2020; Billingham and Hunt, 2016; Schachner, 2022).
Yet, there is little research on whether residential choices in welfare states with universal school choice systems are primarily driven by access to schools of higher academic quality or access to peer groups of higher socio-economic status. Recent findings from the US suggest that school choice systems that are detached from catchment areas can potentially weaken the link between residential and school decisions, as it is often cheaper to choose a school than to relocate (Rich et al., 2021). A conjoint experiment analysis by Thelin and Niedomysl (2015), however, shows that in Sweden, geographical proximity remains a significant factor in school choice decision-making. Given the still-relevant geographical aspect, Thelin and Niedomysl (2015) observe that it is plausible that parents with young children may seek to relocate to neighbourhoods perceived as providing a more favourable schooling environment for their children (Bernelius and Vaattovaara, 2016; Cuddy et al., 2020; Hastings et al., 2005; Holme, 2002).
In this study, we focus on residential and school choices in Sweden – a theoretically consequential setting given the country’s combination of a comprehensive welfare state and a universal school choice policy. Despite universal school choice policies, public school admissions in Sweden rely on proximity-based allocation rules. Increasing income inequalities and residential segregation (Mutgan and Mijs, 2023; OECD, 2015b) thus raise the question of whether parents in Sweden also utilise the housing market as a key channel for selecting schools – and, if so, what types of schools they choose.
Our study sets out to answer three research questions: (1) To what extent do families relocate to new neighbourhoods as their children approach school age? (2) What family-level characteristics predict residential mobility? (3) Do the schools attended by children in relocating families differ from the schools they would have attended if they had not moved?
Using full-population administrative data, we study whether families of children close to school age differ in geographic mobility behaviour based on income and wealth, and to what extent moving allows children to access pupil peer groups with higher socio-economic status and schools of higher academic quality. We analyse differences in mobility behaviour among families whose eldest child is five or six years old using logistic regressions. Further, we use propensity score matching to compare school characteristics for children who relocate to new neighbourhoods with those who stay. We do so in order to understand what types of schools parents deem as most attractive when relocating, and how these schools differ from those their children would otherwise have attended in terms of peer group socio-economic status, test scores, and test scores adjusted for peer group socio-economic status, which we use as a proxy for school value-added.
How do parents choose schools?
Studies from Sweden, the UK, the Netherlands, and the US suggest similarities in families’ school choice patterns. Parents prefer schools where peer composition roughly reflects their own socio-economic status and ethnic/racial background (Burgess et al., 2015; Hastings et al., 2005). Especially for families with high socio-economic status, these preferences tend to proxy for ‘better schools’ (Billingham and Hunt, 2016; Denessen et al., 2005; Malmberg et al., 2014; Schneider and Buckley, 2002). Perhaps more importantly, parents prefer to send their children to schools close to their home (Andersson et al., 2012; Collins and Snell, 2000; Mutgan, 2021; Schneider and Buckley, 2002).
Yet, despite similarities in preferences for certain school characteristics (proximity, perceived quality, pupil peer composition), families face distinct economic and spatial constraints when choosing both residential location and school. While low-income families with young children tend to move more often, these moves are less likely to be out of areas of poverty during their children’s early years (Gambaro et al., 2017). The geographic mobility of low-income families tends to be attached less to preferences for certain schools and more to circumstances driven by exogenous shocks such as unemployment, changes in family situation, or housing instability (DeLuca et al., 2019; Lareau and Goyette, 2014). Hence, economic constraints limit low-income families’ residential choices, and in turn, proximity-based allocation rules and proximity preferences mean that these families have limited access to school choices (Burgess and Briggs, 2010; Rich and Owens, 2023). Conversely, while high-income families are more likely to relocate to areas with better living conditions (Clark and Ledwith, 2007; Gingrich and Ansell, 2014), it is not certain whether these areas always provide better schools compared to these families’ previous residential locations.
The link between school and residential choices in Sweden
In 1992, Sweden went through major education reforms including the introduction of universal school choice and independent schools, which were funded by a voucher-like system (Böhlmark and Lindahl, 2015). Independent schools are either for-profit or non-profit establishments and are not allowed to charge tuition but receive funding from the respective municipalities for each pupil attending. In the 2015/16 school year, 17% of primary schools were independently run (Swedish National Agency for Education, 2023).
Under universal school choice for elementary and lower secondary schools in Sweden, parents may freely apply to schools within their municipality of residence. Due to their limited capacities, however, schools employ various allocation rules. Independent schools follow a first-come-first-served principle (Musset, 2012), while municipalities use proximity-based allocation rules for public schools based on the distance between the school and children’s homes. Since municipalities must ensure that all children have a place in a nearby school, children are guaranteed a spot in a nearby designated municipal school regardless of whether their family applies for any specific school (Skollag, 2010:800). In parallel to these changes in the Swedish education sector, differences in pupil achievement across school areas have increased (Holmlund et al., 2019; Östh et al., 2013), which may incentivise indirect school choice via residential choice.
Residential mobility, however, is highly dependent on households’ economic situation. Although Sweden has long been regarded as one of the most equal societies in the world, income inequality has risen rapidly over the last three decades (OECD, 2015b) and so has residential income segregation, especially among families with children (Mutgan and Mijs (2023). Sweden has also transformed into a multicultural society (Statistics Sweden, 2022). Between 2000 and 2018, the proportion of children aged 7–15 born outside the country or with two foreign-born parents increased from 14.1% to 25.3%. The spatial concentration of subsidised rental housing in certain neighbourhoods, as well as income inequality between Sweden- and foreign-born individuals, further contributed to income and ethnic segregation (Andersson et al., 2022).
While a large rental market should imply more equal access to affordable housing, Sweden’s rent control system and a lack of tenant housing constrain mobility, especially for younger households (Öst et al., 2014). Further, rapid urbanisation has led to a shortage of housing and an increase in real-estate prices, creating long queues for tenant housing and a ‘black market’ in the rent-controlled housing market (Christophers, 2013; Öst, 2012b). Those who seek to relocate are thus channelled towards the market for condominiums (i.e. buildings of separately owned apartments) and single-family houses. Couples’ past homeownership and earned income have been linked to the simultaneity of first-time homeownership and childbirth (Öst, 2012a, 2012b). With the distribution of wealth and liquid assets skewed towards the top of the income distribution (Andersson and Vestman, 2021; Lundberg and Waldenström, 2018), many households cannot afford to buy a home. Hence, residential mobility is more accessible for families who can utilise their income and wealth to access educational opportunities for their children.
This rise in income inequality and changes in housing market conditions may also have transformed the indirect market for education, with the housing market becoming more important (Holmlund et al., 2019). This motivates our empirical focus on studying how Swedish families utilise the housing market in relation to school enrolment.
Figure 1 indicates that it is more common for families to move home before their child starts school than in subsequent years. While some of these mobility events may be driven simply by a search for more spacious housing (Öst, 2012a), choice of destination will likely depend on families’ economic constraints as well as their school preferences.
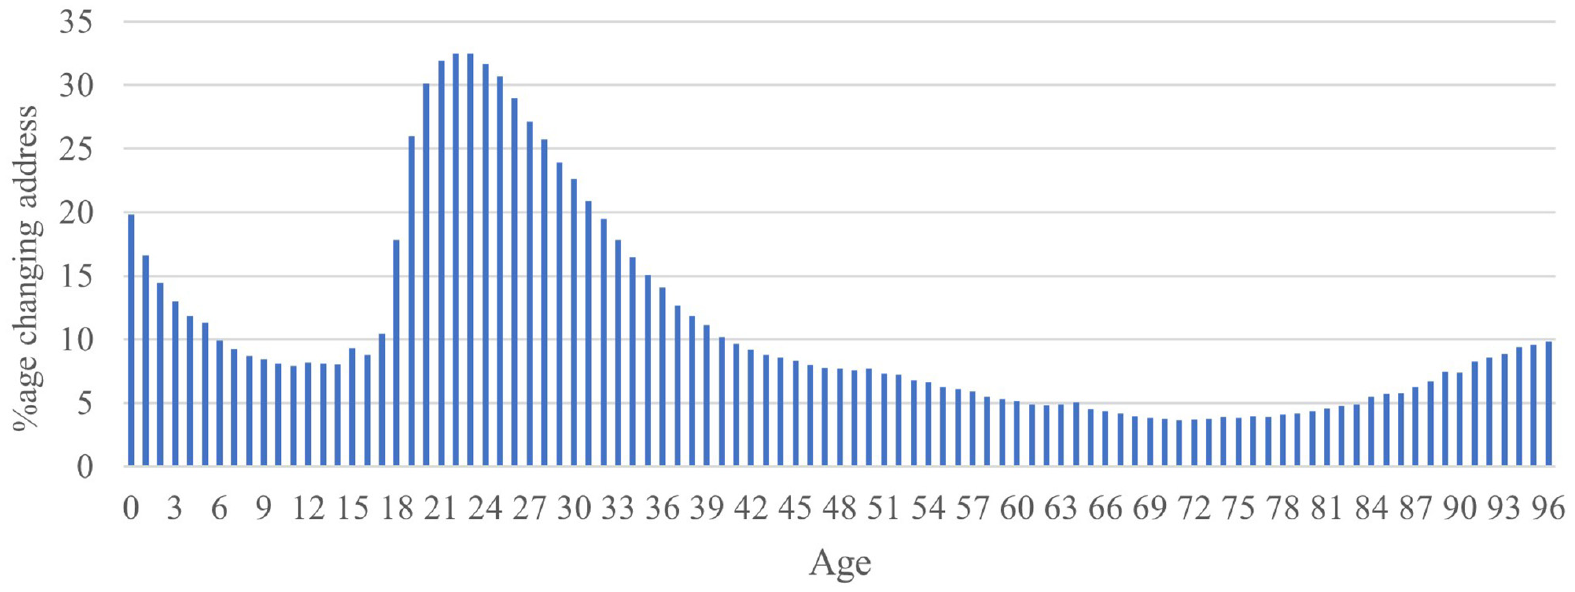
Percentage of Swedish individuals who change address between 2014 and 2015, by age.
Data, geographical areas and family types
Data
To answer our research questions, we use a set of individual-level yearly data collated for us by Statistics Sweden, including residential locations (with dependent children registered at the same address), parents’ income and education, and country of birth, as well as elementary school data (from preschool until ninth grade) showing the school at which each pupil was enrolled on 15 October each year. The Swedish National Agency of Education provides test scores in maths and Swedish national exams among third-grade pupils in each school, which is the first occasion pupils take a national exam.
Population
The study population is constructed in three steps. First, we select all families with an eldest child aged five or six in 2014 in the whole of Sweden. This allows us to isolate the family’s decision to move in relation to the situation of their eldest child. 1 Second, we exclude families whose moves were prompted by the parents separating during 2014–2015. 2 Third, we exclude families who moved to a different municipality (n = 2189) or within the same neighbourhood (n = 1218). Moves between municipalities are mainly attributed to one of the parents having obtained a new job, while a move within a neighbourhood could be attributed to reasons related to housing rather than school choice. 3 Our final population consists of 37,800 families where the eldest child turned five, and 37,300 where the child turned six, during 2014. Out of these, 3504 (4.7%) families moved between 2014 and 2015.
Defining neighbourhoods
Among all first-grade pupils in Sweden in 2017, the median home-to-school distance was just 728 metres, and 86% of first-graders attended one of the three closest schools to their home (63% to the nearest). Of the pupils who went to their nearest school, 95.5% attended a public (i.e. municipality-run) school. These statistics suggest that parents overwhelmingly prefer neighbourhood schools. Sweden, however, does not have school catchment areas. To study mobility across neighbourhoods and to rely on a relatively balanced population within neighbourhoods with non-overlapping neighbourhoods for schools, we use electoral constituencies as a proxy for neighbourhoods. Swedish electoral constituencies are created by the authorities such that there are between 1000 and 2000 eligible voters in each area, depending on the population density of the wider region. In our data, there are a maximum of 100 five- and six-year-olds in each constituency. In 2014, there were a total of 5837 constituencies in Sweden, about half (2884) containing at least one school. 4 Some constituencies in rural areas may have no school at all, yet families may still choose to move there if there are other schools nearby. Thus, we also include these areas, as mobility between constituencies is likely to provide access to new schools. We rely on this smaller-scale definition of neighbourhoods based on constituencies, given parents’ preferences for nearby schools for their young children, proximity-based allocation rules, and the fact that younger pupils travel much shorter distances to school than older pupils (Mutgan, 2021).
Family types
We classify neighbourhoods and families with children into two dimensions: one representing the socio-economic conditions of the neighbourhood compared to the municipality and another reflecting the family’s socio-economic status relative to other households in their neighbourhood. Social conditions in the neighbourhood are measured using higher or lower proportion of gainfully employed residents among working-age residents (aged 20–64) relative to the municipality average. 5 To capture families’ relative financial situation, we measure whether all salary-earning family members have a higher or lower yearly earned income relative to average annual earnings in the neighbourhood. 6
These two dimensions allow us to index the results across four ‘family types’ (A–D). Type A denotes families residing in neighbourhoods characterised by a low percentage of gainfully employed residents with low earnings (7300 families). Type B refers to neighbourhoods with a low proportion of gainfully employed residents with high earnings (15,500 families). Type C refers to neighbourhoods with a high proportion of gainfully employed residents with low earnings (17,000 families). Finally, Type D represents neighbourhoods with a high proportion of gainfully employed residents with high earnings (35,300 families).
Empirical strategy
Our analyses follow a two-step research strategy. First, to analyse the likelihood of neighbourhood mobility as the child approaches school age and the family characteristics that influence this decision, we apply logistic regressions:
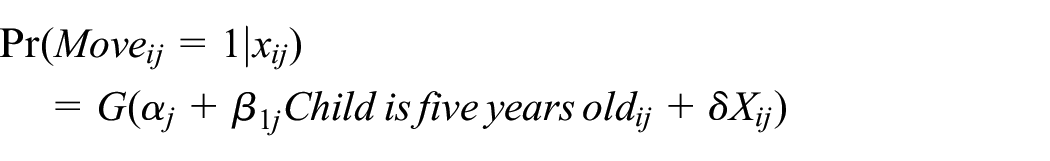
where G(.) is a known function and j refers to four family types based on two dimensions – the social conditions of the neighbourhood relative to the municipality, and the family’s economic situation relative to their neighbourhood. The unit of analysis (i) is the family. Xij refers to the vector of family-level income and housing characteristics described in Appendix 1. We also include a dummy variable indicating whether the child is five or six years old. The multiple logistic regression allows us to simultaneously examine our variables conditioned not only on an opportunity constraint in the form of income but also a ‘push’ factor in the form of social conditions in the neighbourhood. 7
Second, to examine whether the schools that children attend in their new neighbourhood have different characteristics from those they otherwise would have attended, we employ propensity score matching (PSM). Since we cannot know which school parents would have preferred for their children had they not moved, we create a counterfactual population (a control group) for relocating families. Each relocating family is matched with a ‘twin family’ who did not move but resemble the relocated family as closely as possible in terms of the family background variables used in the logistic regression. We further include dummy variables for each family type (A–D) in the matching procedure. After estimating a propensity score, the algorithm matches families according to the one-to-one nearest-neighbour matching technique (Becker and Ichino, 2002). 8 Using these matched families, we compare the socio-economic status (proportion of parents in the pupils’ school cohort with post-secondary education and proportion of parents born abroad) of ‘new’ schools (schools attended by the relocating family) to the counterfactual schools that pupils would have attended (school attended by counterfactual group) had they not moved, to examine potential differences in pupil peer group socio-economic status. In addition to socio-economic status, we also compare third-grade pupils’ test scores between their new schools and counterfactual schools to examine potential differences in academic performance.
Finally, we use regression analysis to control for the effects of the peer groups’ socio-economic status on the test scores. We then study the residual of the regression model to proxy academic quality, that is, the potential ‘value-added’ (Hanushek, 1971; Meyer, 1997) of the schools themselves, beyond what can be inferred from test scores. We again compare this measure of academic quality between ‘new schools’ and ‘counterfactual schools’.
Our analyses assume that mobility between neighbourhoods also provides access to new schools, given the bundled nature of the schools and neighbourhoods. Since some constituencies have no school, and families may also move to one of these constituencies, we compare the actual attended school with the counterfactual school. We believe this is a valid comparison, given that most first-graders attend a school near their home.
Results
Are families more likely to move as their children approach school age?
Table 1 shows mobility rates of the four family types. Overall, 4.7% of families changed residential neighbourhoods between 2014 and 2015. The proportion of families who move is higher among families with five-year-olds in all family types except family Type A, indicating that parents are more likely to move before school commencement, and that low-income families are likely to have less stable living conditions.
Proportion of families with children moving between neighbourhoods, 2014.
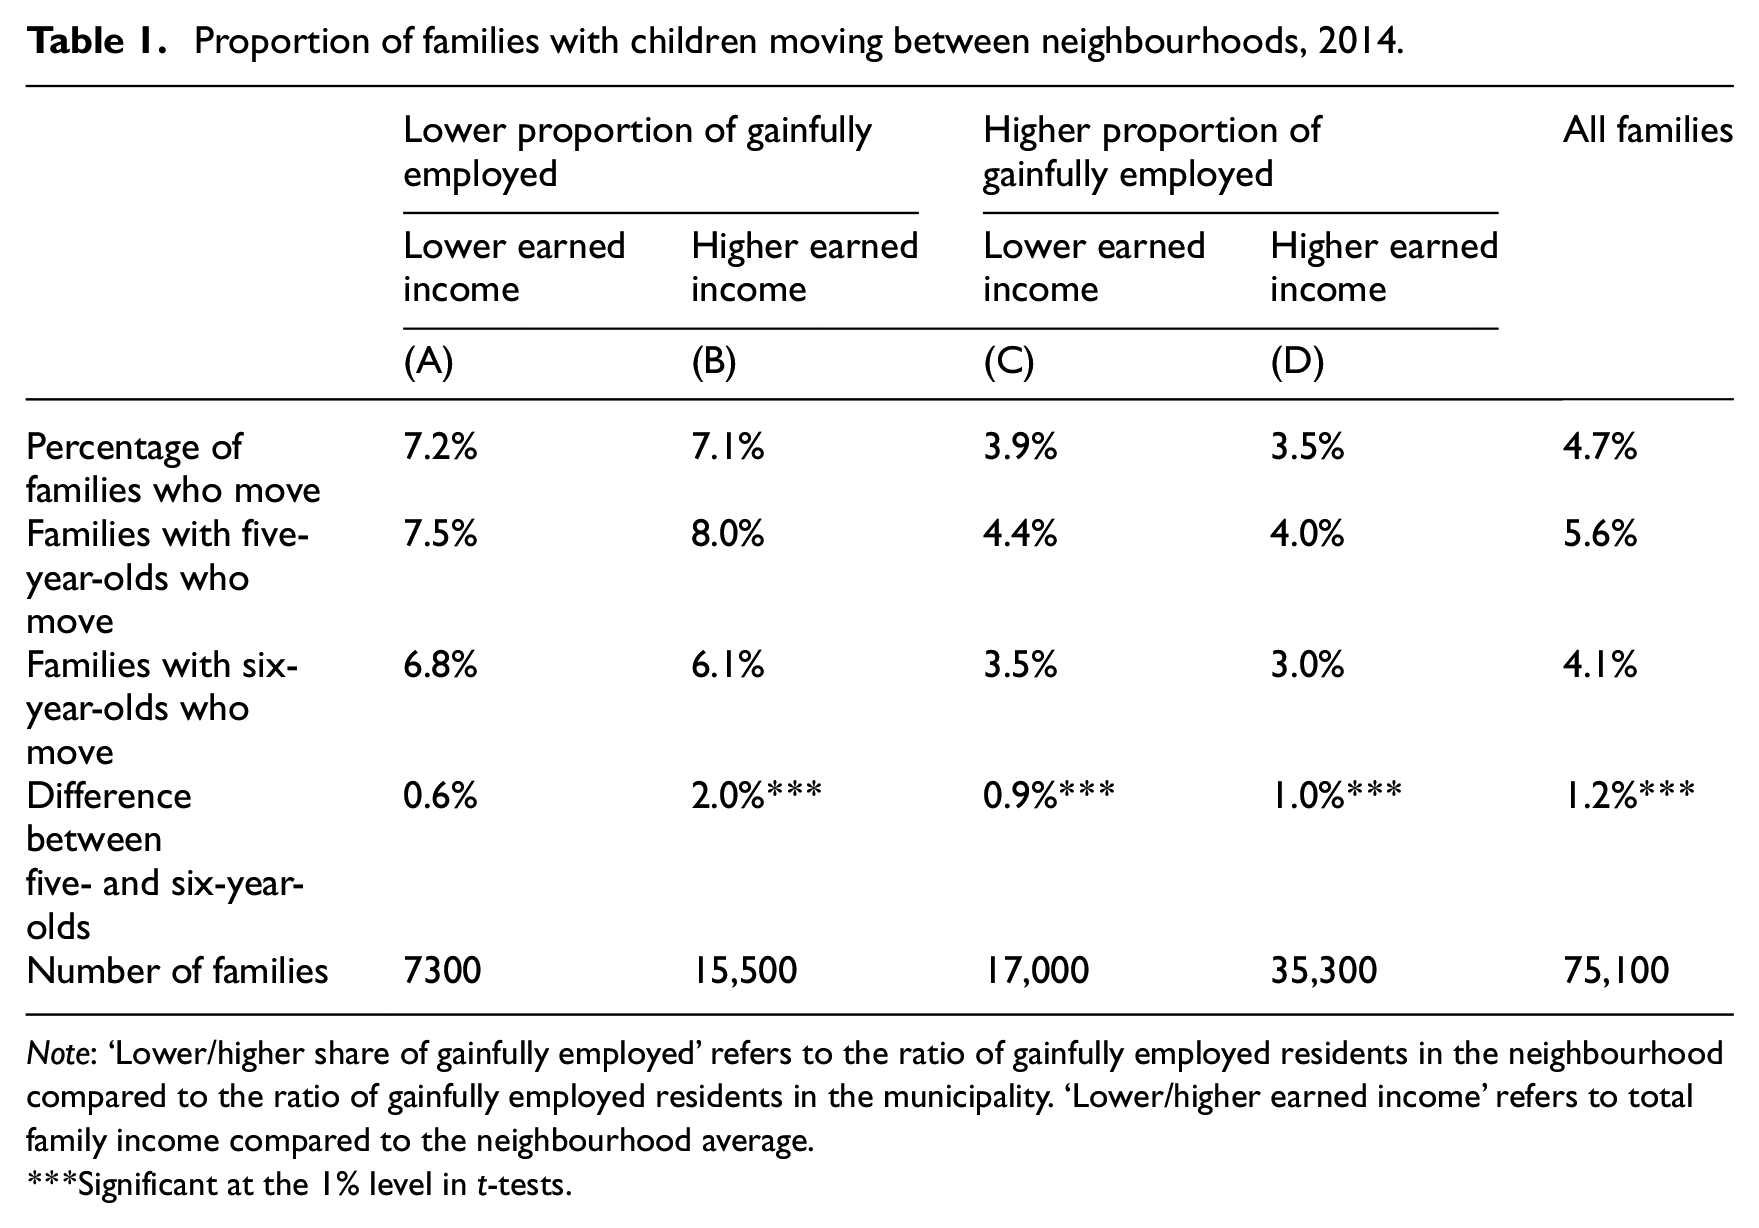
Note: ‘Lower/higher share of gainfully employed’ refers to the ratio of gainfully employed residents in the neighbourhood compared to the ratio of gainfully employed residents in the municipality. ‘Lower/higher earned income’ refers to total family income compared to the neighbourhood average.
Significant at the 1% level in t-tests.
To examine heterogeneity among families and study potential determinants of mobility, we estimate four logistic regression models that account for factors related to family housing conditions, demographics and socio-economic conditions. Table 2 reports average marginal effects (AMEs) for the probability of moving by family type. 9
Probability of moving by family type, average marginal effects (AMEs).
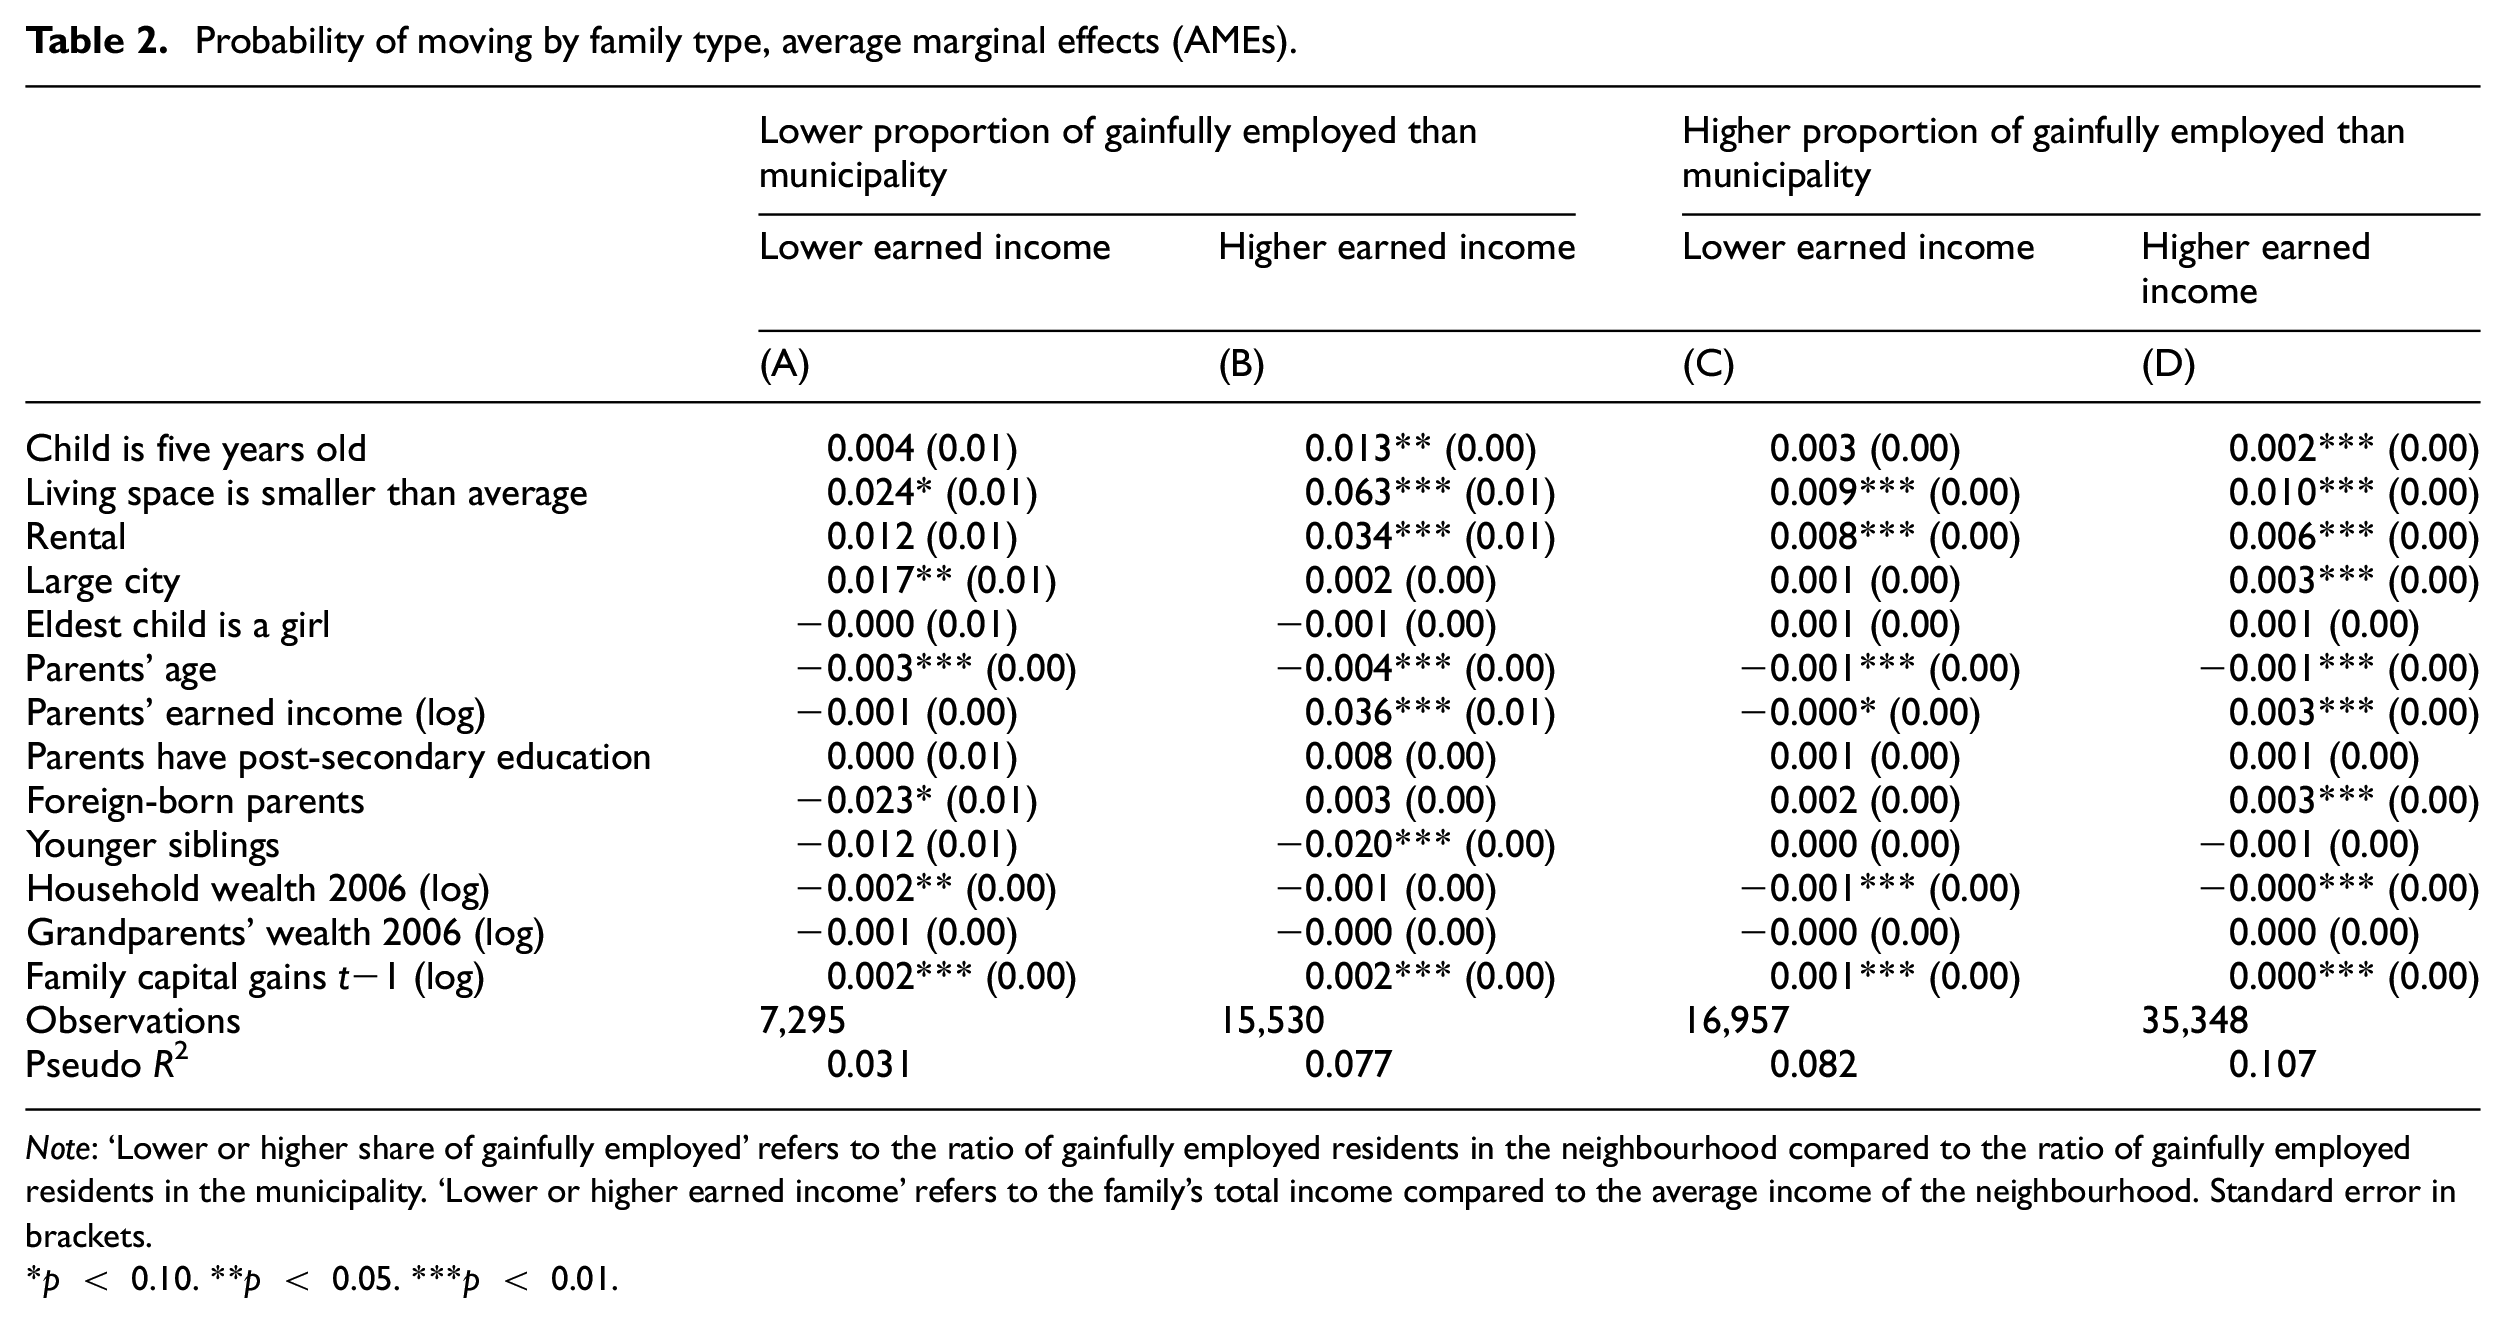
Note: ‘Lower or higher share of gainfully employed’ refers to the ratio of gainfully employed residents in the neighbourhood compared to the ratio of gainfully employed residents in the municipality. ‘Lower or higher earned income’ refers to the family’s total income compared to the average income of the neighbourhood. Standard error in brackets.
p < 0.10. **p < 0.05. ***p < 0.01.
Controlling for a range of family, housing, and neighbourhood characteristics, results in Table 2 below show that families of Types B and D are more likely to move between neighbourhoods the year before their eldest child starts school (Child is five years old = 1) compared to families whose children are six years old. We also find that if families are living in a rental apartment or have a smaller house than average, they are more likely to move to a new neighbourhood. Degree of urbanisation matters for Type A families, who are more likely to move within a larger city – potentially due to higher turnover in housing compared to the countryside.
When examining the dimensions that separate the family types from each other, our results show that income is a strong predictor of moving between neighbourhoods: having a higher relative income compared to the neighbourhood mean increases the probability of moving. Further, neighbourhood social conditions seem to matter as a push factor for those families with relatively higher income: Type B families (who live in neighbourhoods with a lower-than-average share of gainfully employed but earnings above the neighbourhood mean) have a 1% higher probability of relocating compared to Type D families (who reside in neighbourhoods with a higher-than-average share of gainfully employed and earnings also above the neighbourhood mean). This effect does not hold for lower-income families, with no difference between family Types A and C.
Among the four income- and wealth-related variables in Table 2, parents’ earned income is the most important. A 1% increase in earned income increases the probability of relocating by 3.6% for Type B families and by 0.3% for Type D. However, a 1% increase in capital gains increases the probability of relocating by only 0.1–0.2% for all family types. Neither of the two lagged variables Grandparents’wealth or Household wealth has a positive impact on the probability of moving, indicating either that extended family wealth is not broadly related to families’ credit constraints or that the eight-year lags of these variables fail to capture the impact of such income for mobility.
In sum, Table 2 highlights that families are more likely to move before their first child starts school, even after we control for a range of factors. Overall, our results highlight that families seem to move for housing practicalities as well as when their income permits it. As families’ capital gains and earned income increase, they become more likely to relocate. This is especially so for Type B families. On the other hand, family wealth and grandparents’ wealth seem not to affect mobility. Still, these regression models do not allow us to rule out the other potential unobserved factors driving this behaviour.
Do relocating children’s schools differ from those they would otherwise have attended?
It is not possible to determine exactly why families move, either theoretically or methodologically. Yet, using detailed background data on pupils’ families, we can assess the extent to which parents are searching for a school with different characteristics and probe whether schools differ in terms of the pupils’ socio-economic status (parental employment, education level or foreign background) and also whether children in these schools perform better at standardised exams. To test this, we use a PSM approach and identify 3205 families who moved and 3205 in a comparable control group who did not move.
Table 3 shows differences in the school characteristics between the relocating families and their matched ‘twin families’. Results indicate that children who move have peers of higher socio-economic status in their new schools compared to the schools attended by the control group. Movers on average attend schools with a 1.2% higher share of gainfully employed parents, a 2.4% higher share of parents with post-secondary education and a 2.8% lower share of parents with a foreign background.
Family composition and test scores in schools selected among relocating families vs matched control families.
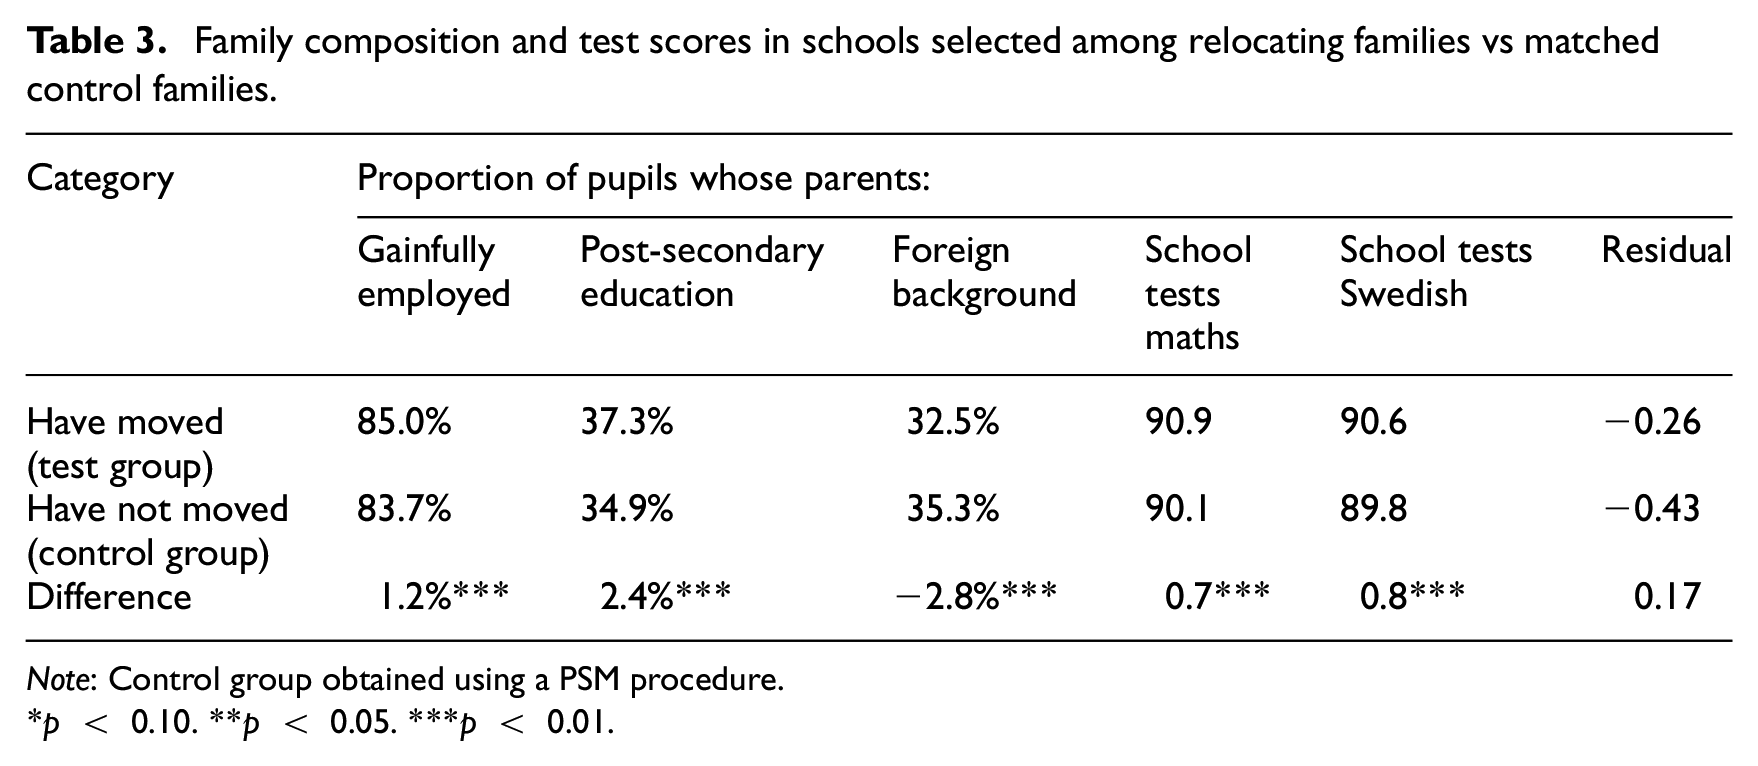
Note: Control group obtained using a PSM procedure.
p < 0.10. **p < 0.05. ***p < 0.01.
When examining differences in test scores, the schools to which families relocate seem to perform slightly better in both mathematics and Swedish, which is expected given the association between socio-economic background and pupil performance (Björklund and Salvanes, 2011; Coleman, 1968). Yet, once we adjust for test scores by the three socio-economic variables, we find that the difference (i.e. residual) is not statistically significant.
Overall, these results demonstrate that parents who move are more likely to choose neighbourhoods that offer a pupil peer group of higher status than their previous one, rather than schools of higher academic quality. 10 This suggests that families may only consider, or have access to, superficial proxies of ‘school quality’, and that the financial advantage of moving seems to be limited to the possible effect of having higher-status peers at school.
Discussion and conclusions
While extensive international research examines mobility patterns and the influence of local housing markets on children’s schooling opportunities using aggregated data, few studies have been able to observe mobility patterns and school enrolment at the family level. Using longitudinal data on families with children approaching school age, this paper adds to the existing literature by examining whether parents utilise the housing market as a means to facilitate their children’s enrolment in specific schools.
Among families whose eldest child was five or six years old in our data, almost 5% changed residential location. Based on these families’ mobility patterns, our results provide considerable support to earlier studies indicating housing instability among low-income families (Gambaro et al., 2017; Lareau and Goyette, 2014) and show that lower-income families in neighbourhoods with lower proportions of gainfully employed residents than the municipality average have a higher likelihood of relocating (∼8%) compared to higher-income families in neighbourhoods with higher proportions of gainfully employed residents (∼4%). Beyond family income, we find that parents who are younger, earn more than the neighbourhood average, live in rental housing, and need more space are more likely to relocate.
Our study adds evidence to whether mobility between neighbourhoods is associated with an aspiration to move ‘upwards’ in terms of school characteristics. Results from the matching models and analyses of residuals show that families’ mobility preceding school enrolment is indeed associated with ‘social climbing’. That is, families who move access schools with higher socio-economic status peers compared to those they would have access to had they stayed put. On the other hand, the schools to which these families move offer only ambiguous advantages in academic quality (‘value-added’) once we adjust for the socio-economic status of peers.
These results contribute to research in other countries indicating that affluent families often choose to relocate to specific residential areas with desirable school characteristics such as a peer group with a high social status (Holme, 2002; Kauppinen et al., 2022; Owens, 2016). While Hällsten and Pfeffer (2017) argue that families’ ability to ‘purchase’ educational opportunities in Sweden is limited due to free education and a large regulated rental market, deregulation in the housing market, such as ending tenure-neutrality policy, has led to a decrease in affordable housing in affluent neighbourhoods, contributing to socio-economic residential segregation (Andersson et al., 2022; Malmberg and Clark, 2021; Turner and Whitehead, 2002). Given that public school admissions rely on a proximity-based allocation mechanism, there is thus an overlap between school and residential segregation (Mutgan and Tapia, 2023).
From parents’ point of view, choosing ‘better’ neighbourhoods but not necessarily ‘better’ schools could also signal a strategic choice in the absence of detailed information about schools. Apart from the influence of peers within school settings, the socio-economic composition of the neighbourhood can also contribute to children’s educational outcomes (Andersson and Subramanian, 2006; Andersson et al., 2023). Targeting and accessing schools of high academic quality through relocation may not be possible for all families due to the difficulty of knowing which schools are ‘good’ for their children, a shortage of housing opportunities or the number of pupil places available in schools. Our study extends international research showing that families are more likely to move to neighbourhoods with a favourable socio-economic backdrop (Ainsworth et al., 2023; Bernelius and Vaattovaara, 2016; Boterman, 2019). However, the decision to move involves push and pull factors (Lee, 1966) as well as economic constraints. Given that we do not control for ‘pull’ factors, our results partly indicate differences in households’ choice opportunities. This could be explored in future research as differences in choice opportunities could capture households’ active decision to stay in their current neighbourhood.
Although many families relocate for housing reasons, we show that families’ earnings are also an important factor in mobility. The effect of income is substantial in magnitude, especially for families who earn more than the neighbourhood average yet live in areas with a lower proportion of employed residents (Type B families), who have a 1% increase in likelihood of moving by earning more than neighbourhood average (compared to Type A families) and a 3% increase in likelihood to move with a 1% increase in absolute income. The size of these effects is probably driven by Sweden’s relatively compressed income distribution (OECD, 2015a), where a small income gain results in disproportionally larger changes in relative income between households compared to other countries. This could also be an implication of housing shortages, since it is primarily condominiums rather than rental apartments that allow mobility, given that a stable income is a prerequisite for a family to be able to borrow for a housing purchase. While our measures of absolute wealth are based on past wealth data and may be underestimated, we do find moderate but stable effects of current capital gains. Given that Swedish households tend to have few liquid assets, 11 these findings suggest that wealth may be less important than income for residential mobility.
Based on our results from the residual analyses, we cannot infer that wealthier families are more likely to utilise the housing market to access higher academic quality. Overall, however, our results show that a higher income enables families to relocate to neighbourhoods that provide access to schools where the peer group is of a higher socio-economic status compared to those that stay. Our findings corroborate the notion of Sweden being in a state of transition between a compensatory welfare state and a system where economic factors matter more for the sorting of individuals across housing, neighbourhoods, and schools (Mutgan and Mijs, 2023; OECD, 2015b).
One interpretation of our results is that families might use socio-economic indicators as proxies for educational opportunities or that they simply value schools whose pupils have a strong socio-economic background. In this way, the housing market does indeed function as an instrument for school choice, and income and wealth provide access. Why these families do not target academically higher-quality schools remains an intriguing question; it may just be that the information needed to assess schools’ academic quality is imperfect, or that families’ preferences are geared towards peer composition in schools rather than academic achievement. These and other potential explanations provide fertile opportunities for future research on school choice and geographic mobility. With this study, we provide novel evidence of self-segregation among families whose children are about to start school.
Footnotes
Appendix 1: Detailed description of variables used in the analysis
Appendix 2
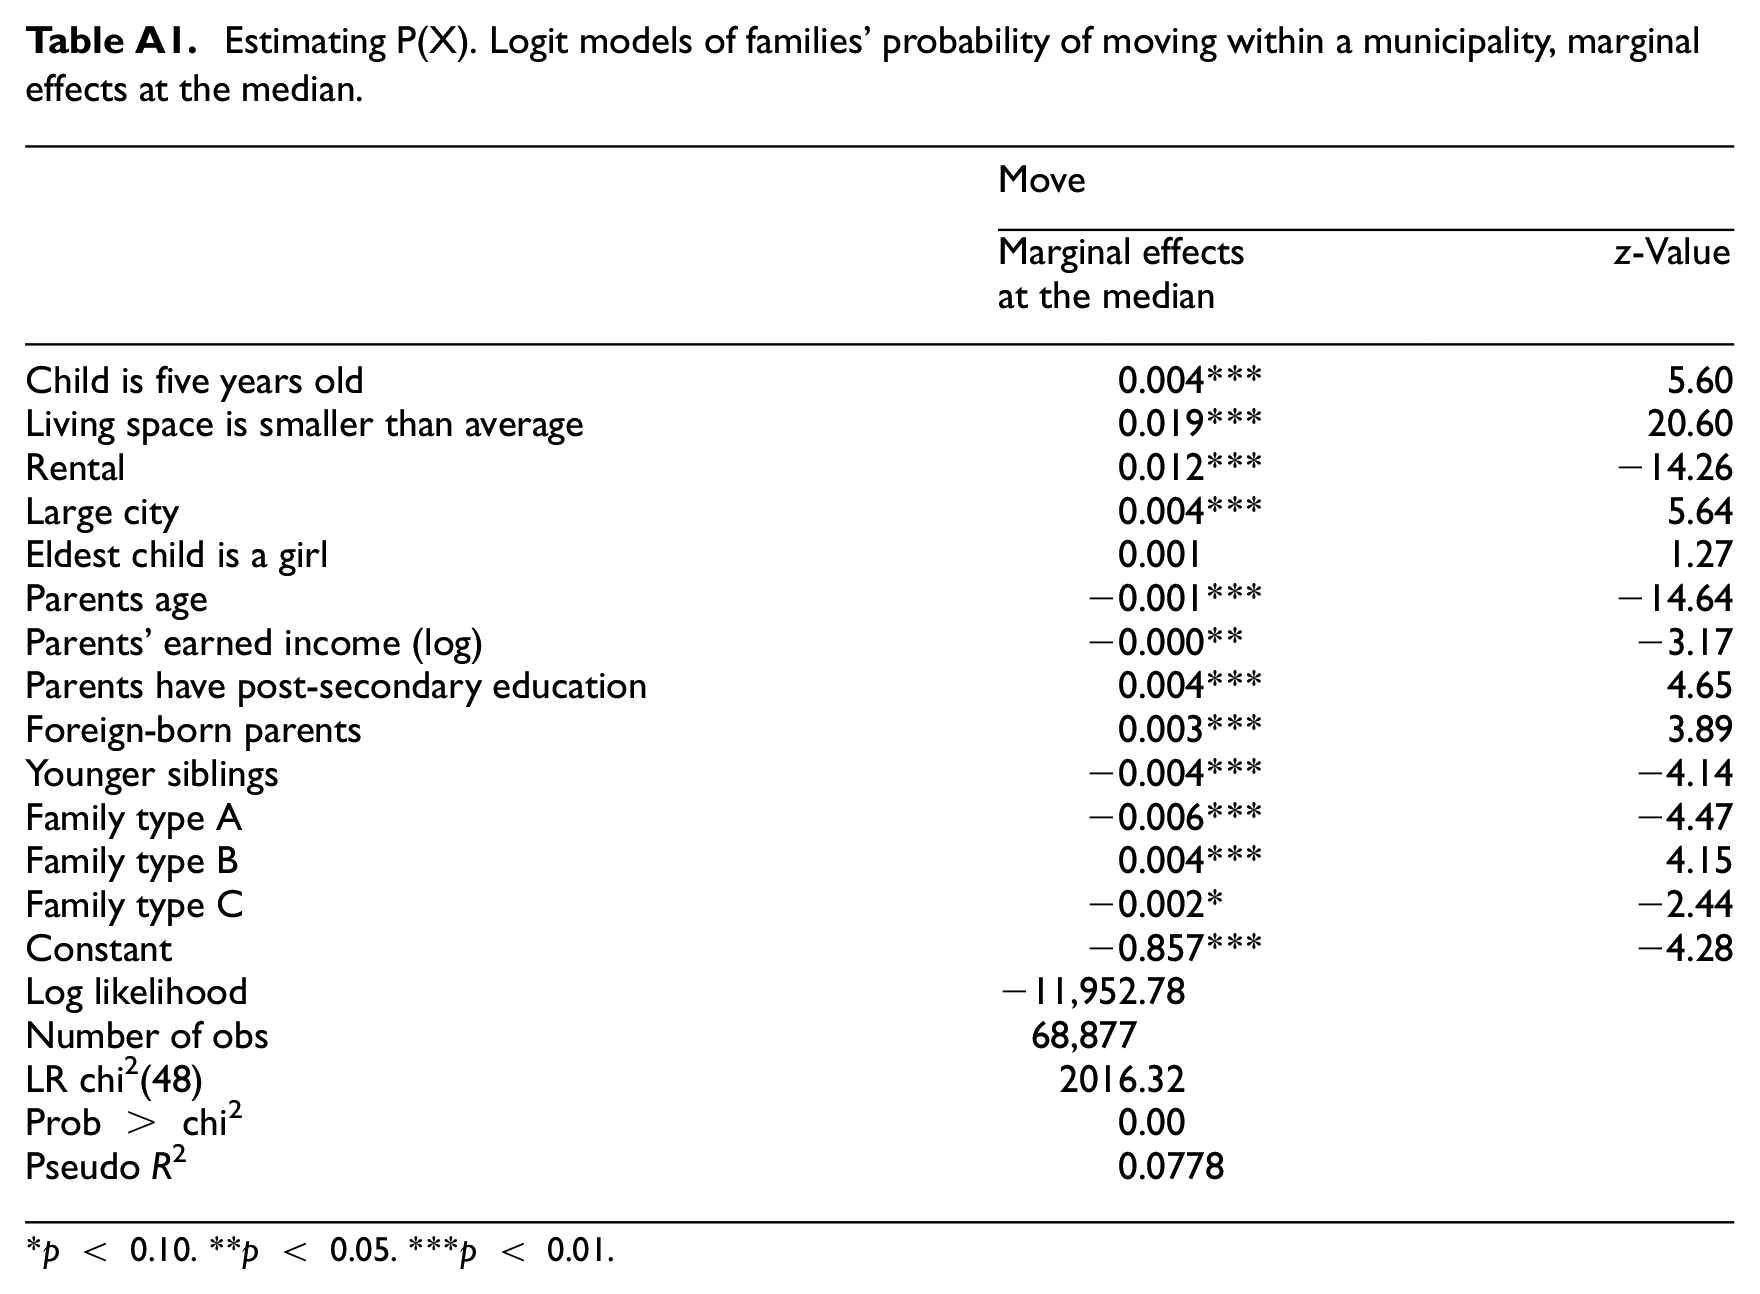
Estimating P(X). Logit models of families’ probability of moving within a municipality, marginal effects at the median.
| Move | ||
|---|---|---|
| Marginal effects at the median | z-Value | |
| Child is five years old | 0.004*** | 5.60 |
| Living space is smaller than average | 0.019*** | 20.60 |
| Rental | 0.012*** | −14.26 |
| Large city | 0.004*** | 5.64 |
| Eldest child is a girl | 0.001 | 1.27 |
| Parents age | −0.001*** | −14.64 |
| Parents’ earned income (log) | −0.000** | −3.17 |
| Parents have post-secondary education | 0.004*** | 4.65 |
| Foreign-born parents | 0.003*** | 3.89 |
| Younger siblings | −0.004*** | −4.14 |
| Family type A | −0.006*** | −4.47 |
| Family type B | 0.004*** | 4.15 |
| Family type C | −0.002* | −2.44 |
| Constant | −0.857*** | −4.28 |
| Log likelihood | −11,952.78 | |
| Number of obs | 68,877 | |
| LR chi2(48) | 2016.32 | |
| Prob > chi2 | 0.00 | |
| Pseudo R2 | 0.0778 | |
p < 0.10. **p < 0.05. ***p < 0.01.
Appendix 3
This appendix provides details of the PSM matching balance. All matching variables have a bias of less than 5%. Assessing the mean difference with a t-test, most variables (10 out of 13) are insignificant, two are significant at the 10% level, and one at the 5% level. For the continuous variables, the variance ratio indicates balance as they are close to 1. The PSM imbalance graph in Figure A1 indicates an overall balanced matching.
Appendix 4
Family composition and test scores in schools selected among relocating families vs matched control families (Mahalanobis distance).
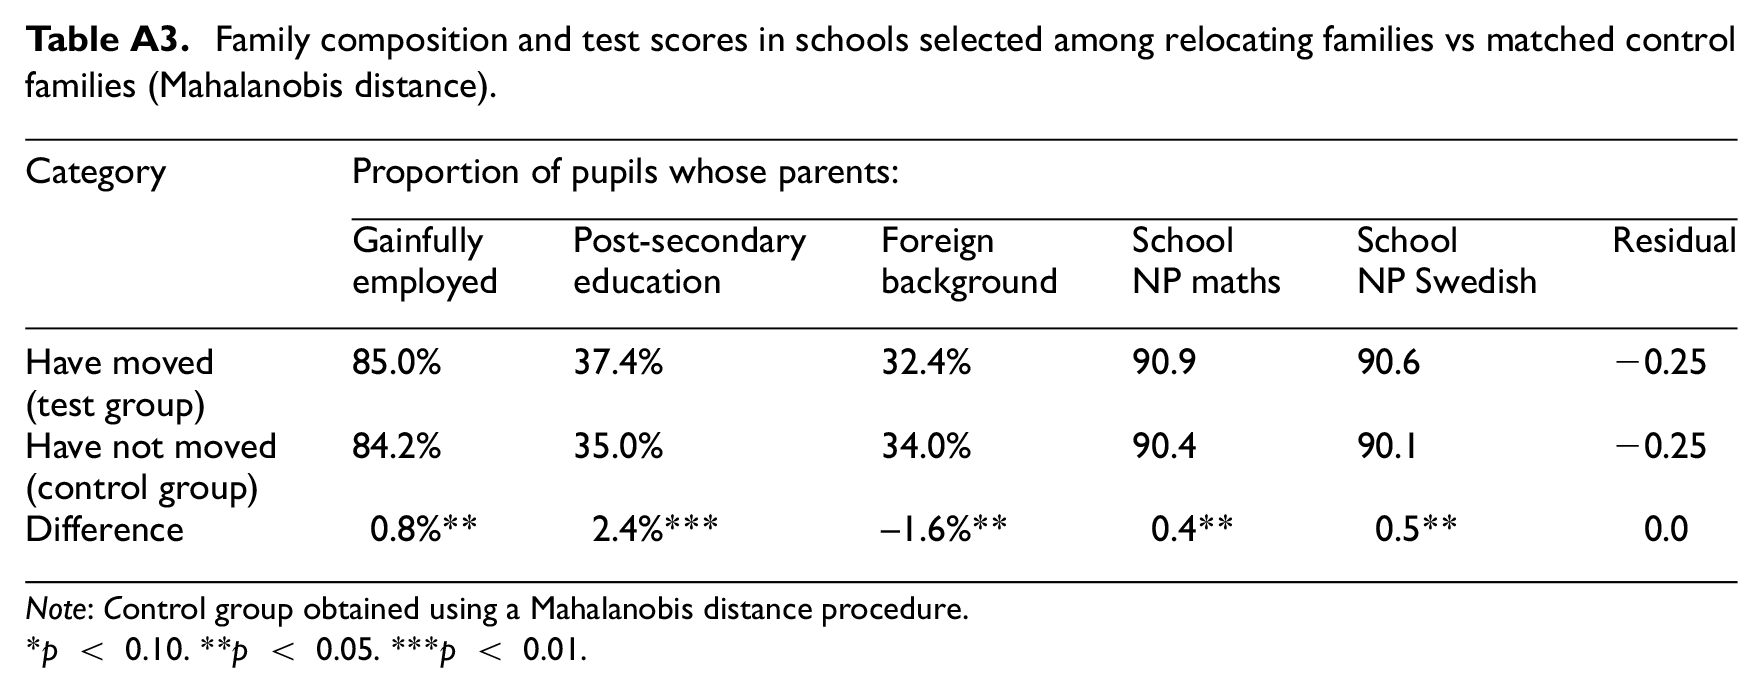
| Category | Proportion of pupils whose parents: | |||||
|---|---|---|---|---|---|---|
| Gainfully employed | Post-secondary education | Foreign background | School NP maths | School NP Swedish | Residual | |
| Have moved (test group) | 85.0% | 37.4% | 32.4% | 90.9 | 90.6 | −0.25 |
| Have not moved (control group) | 84.2% | 35.0% | 34.0% | 90.4 | 90.1 | −0.25 |
| Difference | 0.8%** | 2.4%*** | –1.6%** | 0.4** | 0.5** | 0.0 |
Note: Control group obtained using a Mahalanobis distance procedure.
p < 0.10. **p < 0.05. ***p < 0.01.
Declaration of conflicting interests
The author(s) declared no potential conflicts of interest with respect to the research, authorship, and/or publication of this article.
Funding
The author(s) disclosed receipt of the following financial support for the research, authorship, and/or publication of this article: Selcan Mutgan gratefully acknowledges funding from the Swedish Research Council (2020-02488) and FORTE (2021-01069).