
Abstract
This study investigates whether behavioural interventions can reduce racial and gender discrimination in the rental housing market. In our correspondence tests, we incorporated two specific behavioural interventions: providing employment details to assist letting agents in overcoming statistical discrimination and incorporating anti-discrimination messages to encourage adherence to the ‘Equality, Diversity and Inclusion’ social norm. Although these strategies notably influenced the likelihood of prospective renters receiving responses to their housing inquiries, the outcomes were not consistent across genders or ethnic groups and were not always positive. Racial and gender discrimination in housing markets is a complex issue. There are no ‘one-size-fits-all’ solutions when using behavioural tools to address complex social problems such as racial and gender discrimination. Behavioural interventions demand rigorous field testing prior to widespread adoption.
Introduction
Racial and gender biases are pervasive in housing markets. Males and ethnic minorities face discrimination in rental housing markets globally (Flage, 2018). The issue has been so pronounced that it regularly makes national and international headlines (Mohdin, 2019; Siddique, 2019). In response to a racial discrimination lawsuit, Airbnb had to hide guests’ first names from rental hosts in Oregon, USA, starting in January 2022 (Olson, 2022). Yet, there is little evidence that such measurement effectively counteracts racial and gender discrimination in housing markets.
Despite some well-established theoretical models developed more than half a century ago and a wealth of empirical evidence accumulated over the last two decades, studies examining effective solutions to combat discrimination remain sparse (Llorens et al., 2021; Metinyurt et al., 2021), especially in housing markets. Given the complexity of the products and services involved and the relatively low frequency of transactions, nuanced studies are needed to understand how implicit racial and gender biases influence letting decisions.
This study investigates housing discrimination at the intersection where longstanding market behaviours meet the evolving insights of behavioural research. Although behavioural interventions have the potential to address both statistical and taste-based discrimination in the housing market, their successful implementation remains a challenge. Given the persistent biases and socio-economic dynamics in the housing market, interventions must be carefully tailored to the context.
By collecting evidence from field experiments, this research aims to gain insights into how real-world behavioural interventions can be effectively designed and implemented. Our focus remains twofold: to develop a robust theoretical framework and to translate its insights into tangible, impactful policy recommendations, with the ultimate goal of fostering a more inclusive housing market.
The subsequent sections of the article are structured as follows. The second section lays out the theoretical framework, the third section details the empirical implementations of the research, the fourth section presents and deliberates on the empirical findings and the concluding section offers reflections and directions for future research.
Theoretical framework
We developed a theoretical framework based on a meta-analysis of racial discrimination studies in the housing market and the theoretical framework in Bao (2023), as outlined below.
Classification of racial discrimination in the housing market
We conducted a meta-analysis 1 of 30 housing racial discrimination studies published between 2006 and 2022. Only studies employing the correspondence test method (Jowell and Prescottclarke, 1970) were considered, given its predominant usage in the literature. To implement the correspondence test, researchers create fictitious names indicating a hypothetical applicant’s gender and ethnic background. Inquiries with these names are sent to landlords and real estate agents by email, and the proportion of positive responses is recorded as a measurement of discrimination. In the absence of racial discrimination, response rates should be close between the ethnic majority and minority groups. The correspondence test method is particularly important in the rise of online real estate portals. The algorithms powering these platforms are susceptible to biases, often placing renters at a disadvantage (Meers, 2024; Wainwright, 2023). By studying responses to property listings enquiries through online real estate portals, corresponding tests can effectively detect coded prejudices in the housing sector.
We classified ethnic minorities from these studies into three groups. The first is closely related to the legacy of colonialism, typified by discrimination against Blacks in the UK (Carlsson and Eriksson, 2015) and indigenous Kanaks in New Caledonia (Bunel et al., 2019). Eleven of the 31 studies fit this category. Second, immigrants or foreigners consistently face discrimination in housing markets. Thirteen studies found evidence of discrimination against potential renters with foreign names (see e.g. Gusciute et al., 2022; Molla et al., 2022). Finally, there is discrimination against ethnic groups that are associated with specific adverse events, such as the 9/11 terrorist attack or the Holocaust. Twenty-two papers found that renters with Arabic/Muslim (see, for instance, Antfolk et al., 2019; Moritz and Manger, 2022) or more religious Jewish names (Sansani, 2019) received substantially fewer responses to their rental inquiries. We labelled these three racial discrimination types as ‘Colonial’, ‘Foreign’ and ‘Greylined’, respectively. The term ‘Greylined’ refers to groups that face more ambiguous or subtle biases, because of their association with significant, often negative, historical or contemporary events. The term is inspired by ‘Redlined’, referencing discriminatory practices in mortgage lending, with ‘Greylined’ capturing a more nuanced form of bias.
Our meta-analysis shows enduring racial discrimination against ethnic minorities in the housing market. There are a total of 179 response rates reported in the 30 papers reviewed. Whenever possible, we computed odds ratios for minority groups receiving responses from landlords or letting agents. On average, these groups had an odds ratio of 0.64, indicating that their odds of receiving a response was 0.36 points lower than those of the corresponding majority group. The odds ratios for the ‘Colonial’, ‘Greylined’ and ‘Foreign’ categories stood at 0.56, 0.57 and 0.78, respectively. The consistent evidence of discrimination against these ethnic groups justified their inclusion in our analytical framework.
The role of gender discrimination in the housing market
Few studies have specifically examined gender discrimination in the housing market. However, most of the racial discrimination studies reviewed by Flage (2018) and Gusciute et al. (2022) included gender discrimination within their research frameworks. Empirical evidence supports such a strategy because not only is gender discrimination against males identified consistently but gender and racial discrimination also interact. For example, 14 out of the 29 studies reviewed in Flage (2018) found that female applicants were approximately 30% more likely to receive positive responses from landlords and real estate agents compared to their male counterparts.
We also investigated the role of gender in the meta-analysis. We derived odds ratios by gender, benchmarked against the response rate of the female majority group, from the papers under consideration. Female majority applicants are more likely to receive responses compared to both female and male minority applicants, of which the average odds ratios were 0.73 and 0.55, respectively (see Table S1–3 in section S1 in the Supplemental document). This aligns with existing evidence indicating gender discrimination against male renters. Consequently, it is important to incorporate all three types of racial discrimination as well as gender discrimination in one overarching analytical framework to reliably isolate the main effects and their interaction effects.
Identification of behavioural intervention tools
The racial discrimination evidence summarised above can be ascribed to two main categories: statistical discrimination (Arrow, 1973) and taste-based discrimination (Becker, 1957). Statistical discrimination arises when letting agents or landlords rely on observable characteristics, such as race and gender, to infer unobservable attributes, such as income and employment status. For instance, a landlord might assume that a certain group of people is more prone to rent arrears based on stereotypes, even if some individuals within that group have good, stable incomes.
Taste-based discrimination, on the other hand, is caused by personal biases or prejudices against certain groups. Letting agents or landlords might treat specific groups unfairly not based on rational economic considerations but rather on irrational biases or prejudices. For example, some landlords might decline tenants of a particular ethnic or social background purely based on personal biases, without considering potential tenants’ eligibilities or qualifications.
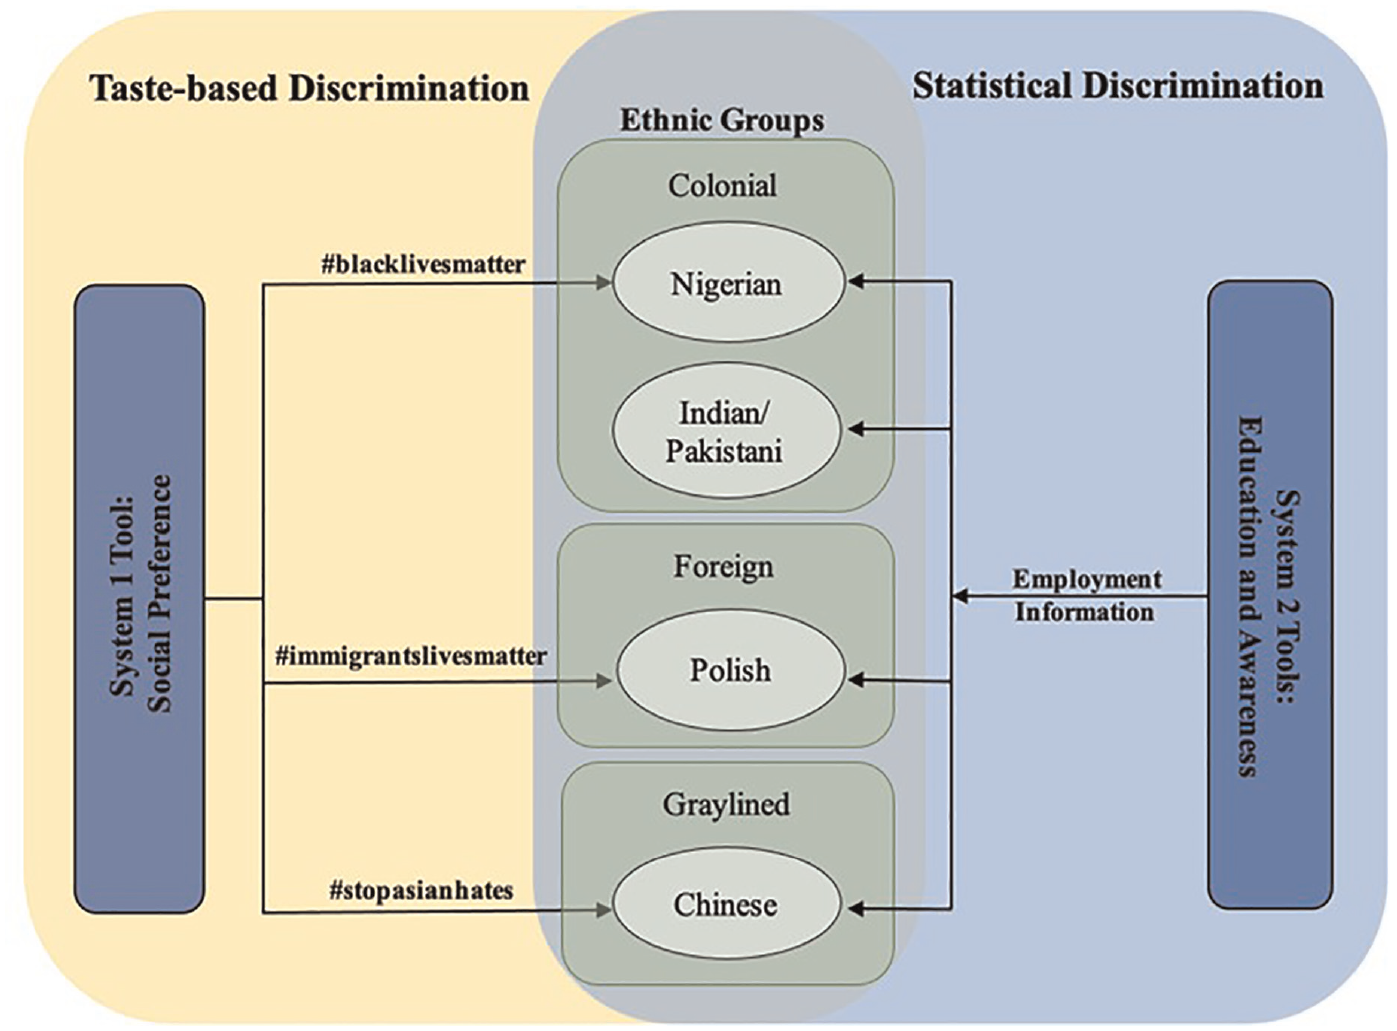
Because all three types of ethnic minority groups are, to varying degrees, distinct from the majority group, this unfamiliarity can lead to statistical discrimination. Likewise, differences in background and lifestyle between minority and majority groups can give rise to taste-based discrimination. Consequently, the three ethnic groups identified in the housing discrimination literature review sit at the intersection between statistical and taste-based discrimination, as illustrated in Figure 1.
Analytical framework and empirical implementations.
Understanding the underlying motivations of these two types of discrimination is pivotal for designing effective behavioural interventions. While statistical discrimination is based on information asymmetry and a rational assessment of probabilities, taste-based discrimination is rooted in irrational biases and personal preferences. Thus, addressing each requires different strategies: reducing information asymmetry for statistical discrimination and reshaping attitudes for taste-based discrimination. Drawing from this understanding and the theoretical framework in Bao (2023), we developed an analytical framework for applying behavioural interventions to combat racial discrimination in the housing market (see Figure 1).
Behavioural interventions are neither monetarily incentivising nor legally/regulatorily coercive. Instead, they mobilise or leverage psychological and social instincts to influence decision-making. Behavioural interventions have been applied extensively in urban studies (see the reviews in Buckley, 2020; Khanna et al., 2021). Bao (2023) classifies these behavioural interventions into two categories: System 1 and System 2 tools. System 1 tools activate the automatic and intuitive parts of our brain in decision-making. Consequently, people respond intuitively and automatically, often without deliberate thought. Tools in this category use defaults as nudges (Thaler and Sunstein, 2008), employ social norms in social influence (Breza and Chandrasekhar, 2019) and appeals (Skoric et al., 2022) or apply automatic escalation design in saving schemes as commitment devices (Benartzi and Thaler, 2013).
System 2 tools focus on overcoming existing behavioural heuristics or cultivating new ones to improve decision-making. These tools specifically target System 2 thinking, which requires conscious mental effort to arrive at rational decisions. Techniques within this category include providing information to educate decision-makers or raise awareness of certain facts (Gong et al., 2019), visualising important aspects of decision-making or complex information (Bhattacharyya et al., 2019) and engaging decision-makers in complex, cognitively demanding tasks via gamification (Mulcahy et al., 2020).
Available evidence indicates that both types of tools are effective in encouraging positive actions, especially in environmental conservation and sustainable urban development (Khanna et al., 2021; Nisa et al., 2019). Insights from related fields suggest that System 1 tools could be helpful in curbing taste-based discrimination, while System 2 tools might potentially mitigate statistical discrimination. Nevertheless, the application of these behavioural tools in racial and gender discrimination studies does not seem to be straightforward. The effects of these behavioural interventions vary significantly between studies. For example, System 2 tools are effective only when combined with System 1 tools in energy-saving experiments in Monaco (Lazaric and Toumi, 2022), while video information interventions outperform social norm nudges in promoting the acceptance of recycled water in the USA (Tanner and Feltz, 2022). Thus, the effectiveness of behavioural interventions is context-specific and needs to be tested with empirical evidence from the housing market. The empirical implementations of the analytical framework are discussed in the next section.
Experiment design and implementations
Study area
The historical connection between the UK and its former colonies prompted waves of migration from Indian and African countries. 2 The end of colonial rule and subsequent waves of decolonisation and nation-building continued to shape migration patterns. Political instability, economic challenges and the quest for better opportunities were driving factors for migrations from Indian and African countries to the UK. According to the Office for National Statistics (ONS, 2022), India was the most common non-UK country of birth in 2021. The most recent census (ONS, 2022) shows that Indian is the largest ethnic minority group in England and Wales, with the Black African community being the third largest. Nigerians were the largest African-born population in the UK in 2021.
Brexit, the UK’s decision to exit the European Union, has had significant implications for EU immigrants in the UK, influencing their legal status, sense of belonging and the potential for racial discrimination. While not all EU immigrants experience such discrimination, individuals from Eastern European countries, in particular, have reported instances of bias based on their nationality or ethnicity. The uncertainty and tensions during the Brexit process may have exacerbated these issues (Di Stasio and Heath, 2021; Lahuerta and Iusmen, 2021; Rzepnikowska, 2019). Statistics show that Polish has been the most common European nationality in the UK since 2007 and was the largest European-born population in 2021 (ONS, 2022).
London is an ethnically diverse, international city. The proportion of British White is only 43.35% in the 2021 Census for London, in contrast to the 78.35% nationwide figure, while the proportion of ethnic minorities in London’s population exceeds national averages for all major ethnic groups, particularly for the Indian and Pakistani groups (ONS, 2022). The proportion of renters is higher, and income is generally lower among these ethnic minority groups. These conditions put them at a disadvantage in areas with constrained housing availability and affordability, such as London.
The UK has embraced neoliberal policies with a market-orientated approach to urban development. This led to accelerated commodification of housing, lack of affordable rental housing and overall challenges in gaining access to the formal, private rental market. The UK faces a notable gap between average incomes and median house prices, with London experiencing an especially pronounced divide. Recent research by a London lettings and estate agent found that only 4% of London rental homes will be available for new tenants in 2023 (Benham & Reeves, 2023). Consequently, entering the private rental housing market in London is very challenging, particularly for low-income households. Statistics indicate that a London renter spends about 45% of their median household income on rent, exceeding the 30% affordable ratio suggested by the Office for National Statistics (ONS, 2020).
Given the challenges of accessing the private rental market, and the size and diversity of the ethnic minority population, London is a suitable test ground for our theoretical model. Furthermore, there has been limited empirical evidence from this market – only two out of the 30 studies in our meta-analysis are from the UK. Therefore, we choose to conduct correspondent tests in the London rental housing market as an effort to fill this gap in the literature.
Racial and gender profiles
Five ethnic groups are included in this study: White British, Indian, Nigerian, Polish and Chinese. The White British group is the ethnic majority in the UK. We chose Indian and Nigerian as representative ethnic minorities for the ‘Colonial’ category, and Polish for the ‘Foreign’ category. Chinese is chosen for the ‘Greylined’ group, given the surge in anti-Asian sentiment during the COVID-19 pandemic period (Grahame Allen and Zayed, 2021; Lang, 2021). Hate crimes against Chinese individuals increased considerably during the early stages of the COVID-19 pandemic in the USA (Han et al., 2022) and London (Gray and Hansen, 2021). Although the spike in hate crimes against Chinese subsided as the pandemic continued, an analysis of social media posts on Quora between 2010 and 2021 found that the semantic similarity between Asian and Black people grew closer, while the semantic distance between Asian and White people increased (Jang et al., 2023). This societal shift could potentially affect landlords’ perceptions of Chinese renters. Therefore, we include Chinese in the research design.
We create 10 fictitious renters representing the five ethnic groups. There is one female and one male renter in each group. We use the first name to indicate gender, and both the first and the second name to signal ethnic background. Previous studies typically selected names based on web searches of common names (Murchie and Pang, 2018), and sometimes validated these names with students (Gusciute et al., 2022; Sawert, 2020) or natives of the respective ethnic groups (Antfolk et al., 2019). We followed this practice to set up an initial list of names based on internet search and suggestions from natives. This list was then tested at an online panel data platform in the UK (www.prolific.co). Filters were applied to select only respondents from London, with a stratified sampling approach ensuring a balanced gender distribution. Respondents were then tasked with identifying the gender and nationality associated with the fictitious names. Only names that achieved a minimum 85% correct identification rate for both gender and nationality were retained for the experiment. In total, 400 respondents participated over four rounds of surveys to check the names between 1 and 11 December 2021. The names utilised in the experiments and the survey links of the name checks are provided in Table S3–1 in section S3 in the Supplemental document. 3
Behavioural interventions
According to the analytical framework in Bao (2023), we use social preference from the System 1 tools list to counteract taste-based discrimination against Nigerian, Polish and Chinese renters. We subsequently refer to this behavioural intervention as ‘Social Norm’, as it leverages prominent social movements prevalent during the experiment’s timeframe. For respondents in the ‘Social Norm’ treatment group, their email messages will end with a social media hashtag, placed directly below their names. These ‘Social Norm’ interventions are designed to remind letting agents of three social trends: ‘Stop Asian Hate’ for Chinese renters, ‘Black Lives Matter’ for Nigerians and ‘Immigrants’ Lives Matter’ for Polish applicants. The corresponding hashtags for these three ‘Social Norm’ interventions are #stopasianhate, #blacklivesmatter and #immigrantslivesmatter. We did not include Indian renters in the ‘Social Norm’ design because there were no clear social norms that apply to this ethnic group.
The second behavioural intervention is an Education and Awareness tool from the System 2 tools list. We labelled this behavioural intervention as ‘Information’ as it provides employment information about potential renters to counteract statistical discrimination. Specifically, messages sent by renters in this treatment group will contain positive information about employment, suggesting the applicant holds a stable or well-compensated position. Sample email messages from this group include: ‘I am a secondary school teacher and find it challenging to answer phone calls during work hours. Emails are preferable’ and ‘I manage a medical practice and cannot take personal calls at work. An email response would be appreciated’. This intervention was applied to all ethnic groups.
Respondents are randomly allocated to a control group, an ‘Information’ treatment group, a ‘Social Norm’ treatment group and a treatment group combining both the ‘Information’ and ‘Social Norm’ interventions. Examples of emails in each group can be found in Figure S3–1 in section S3 in the Supplemental document. The empirical implementation of the analytical framework is summarised in Figure 1.
Experiment implementations
We carried out the experiment at the UK’s largest online real estate portal and property website, www.rightmove.co.uk. In 2021, Rightmove recorded 208 million visits per month and a total of 692,000 properties listed on their website. Therefore, the platform offered us access to the largest available database of rental property listings in the country. We searched for rental properties in the Greater London Area advertised between December 2021 and April 2022. Only houses, flats and apartments are included. All listings are handled by letting agents, with no private landlords involved.
Once a property was identified as eligible for the experiment, we submitted five applications to the letting agent, each requesting a viewing appointment. The five applicants represented different ethnic backgrounds (i.e. one from each of the five groups) but shared the same gender. To avoid any suspicion of spam, we spaced the sending of the five emails by at least 12 hours.
We selected a total of 360 properties, resulting in a sample size of 1800. This sample was evenly divided between the two gender groups and the five ethnic groups. This means there were 360 observations for each ethnic group and 900 observations for each gender group. Half of the sample was randomly chosen to receive an Information behavioural intervention. Within these groups, one-third of the Chinese, Nigerian and Polish renters were randomly selected to incorporate the Social Norm intervention in their email messages.
Each email inquiry process ended either when the letting agent replied or if there was no response after two weeks. If letting agents invited applicants for a viewing, we turned down the offer within 24 hours. Except for the initial application with a request for viewing and the notification to withdraw the application, no attempts were made to communicate with letting agents, such as replying to emails, be it through email replies, messages or phone calls, to minimise the impact on their regular operations. We obtained ethical approval from the Research Committee at the author’s institution.
Empirical findings and discussion
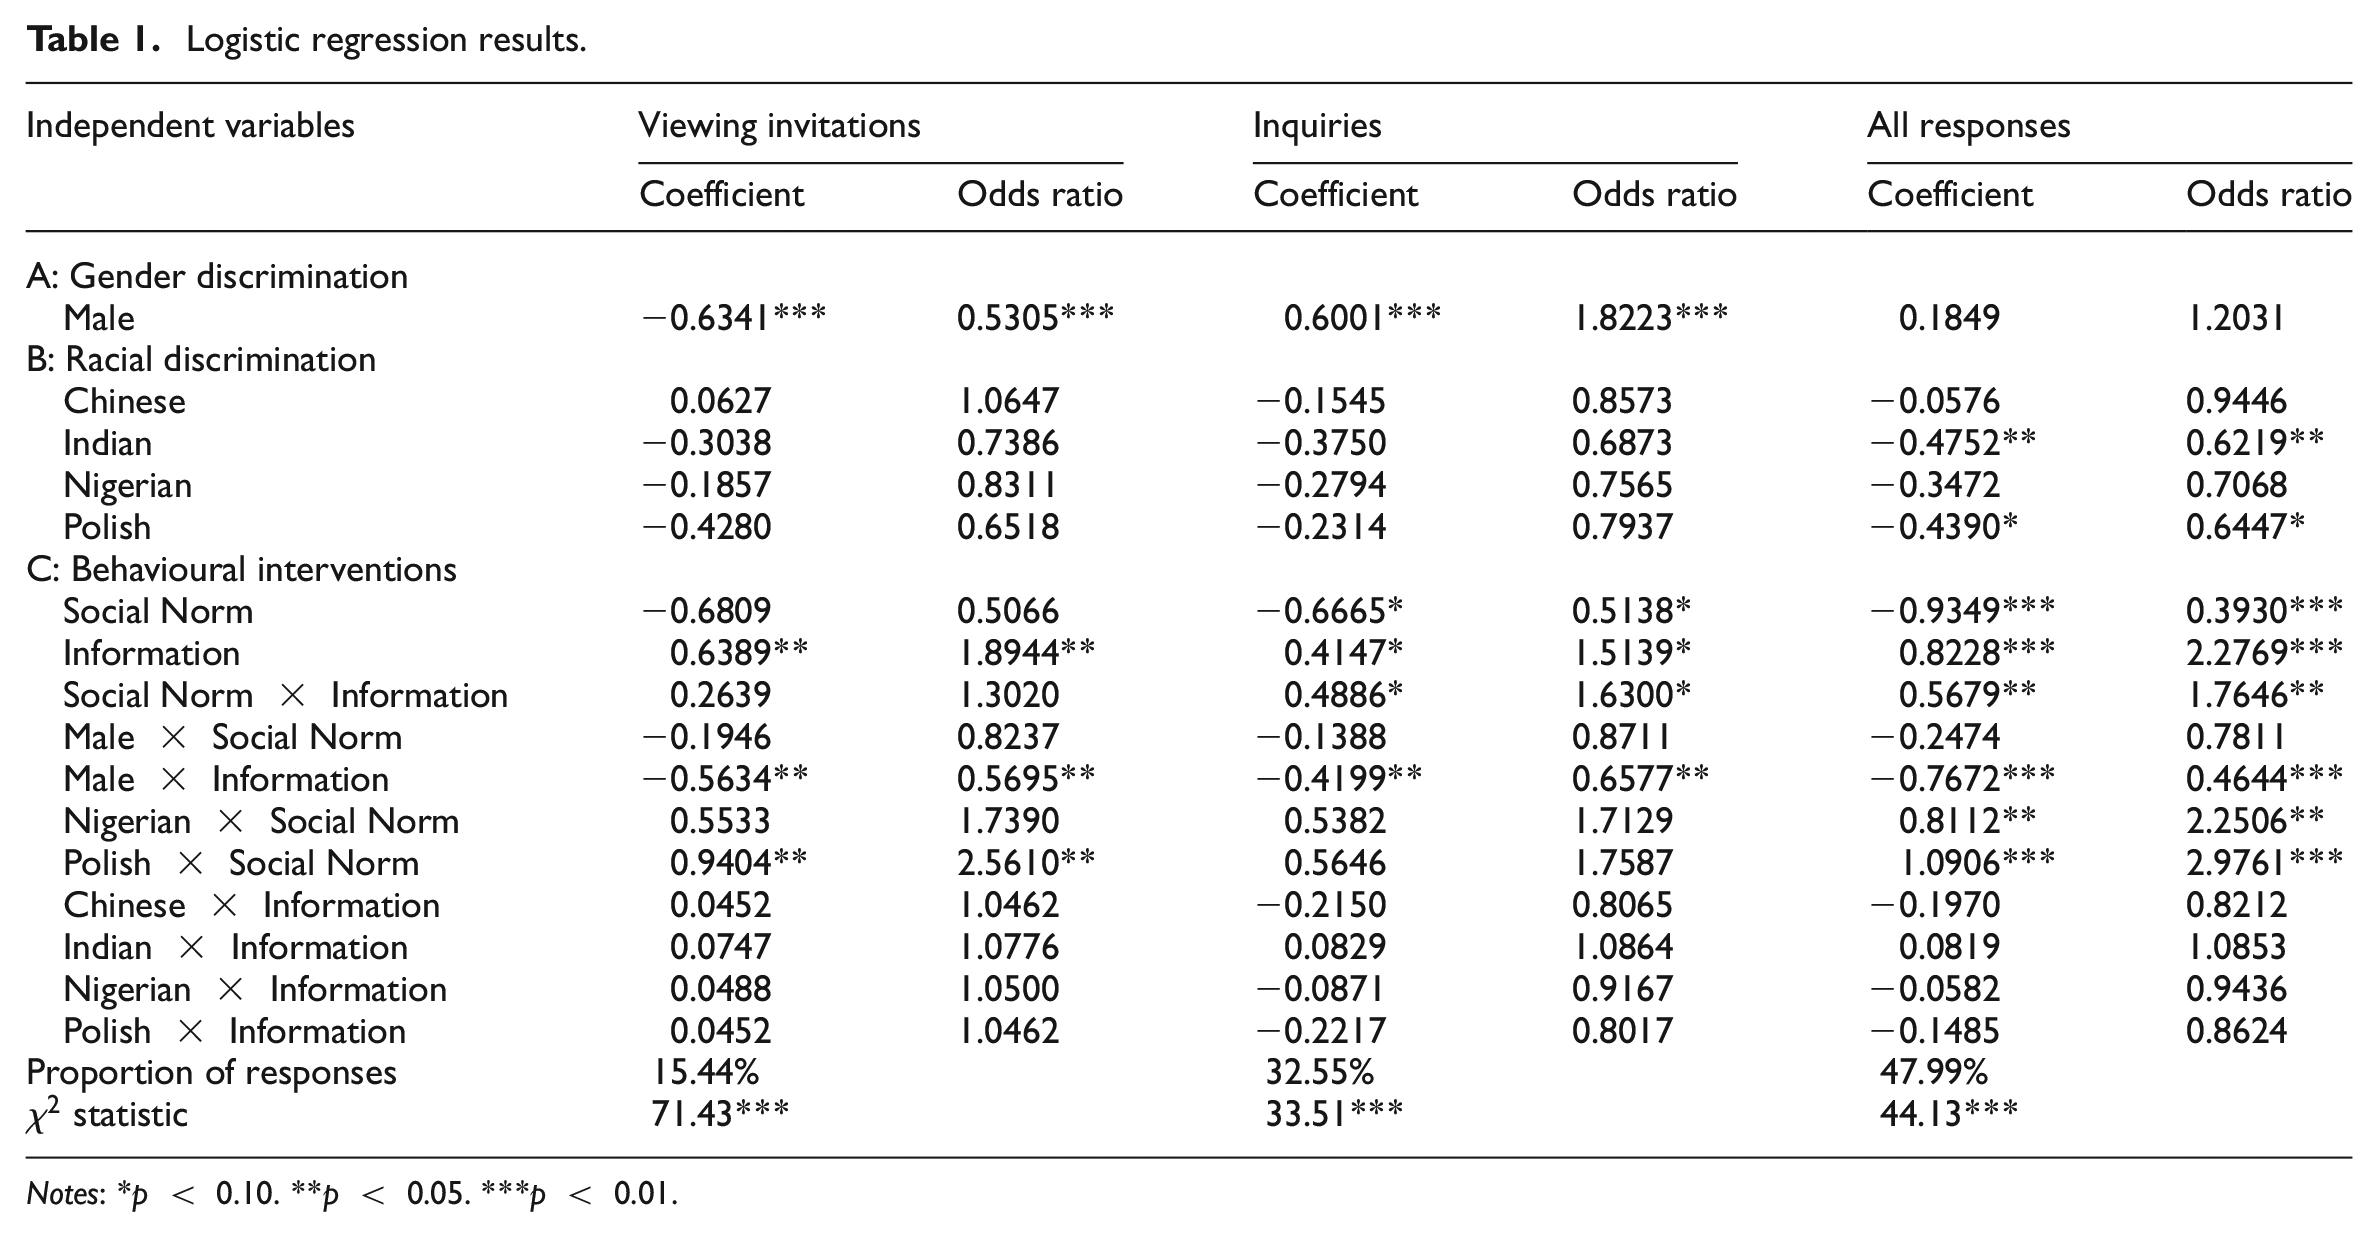
If an email enquiry received an automatic response from the agent without any follow-up emails, or if there were no replies within two weeks, it was classified as ‘no responses’. Nearly half of our inquiries (i.e. 47.99%) received responses from letting agents. Of these, 15.44% resulted in invitations to view the property. We consider these the most favourable responses and have labelled them as ‘Viewing Invitations’. Another 32.55% of responses asked for further information about the applicant’s background and are classified as ‘Inquiries’. We regress indicators of Viewing Invitations, Inquiries and all responses on dummy variables of gender, behavioural interventions and their interaction terms. The results are given in Table 1.
Logistic regression results.
Notes: *p < 0.10. **p < 0.05. ***p < 0.01.
We also broke down response rates by gender, ethnic group and treatment groups to further illustrate the effect of the behavioural interventions. Table 2 reports the difference in response rate between the control group and each of the three treatment groups. Positive figures indicate an increase in response rate due to the respective treatment and vice versa. The patterns revealed in Table 2 are further visualised in Figure 2, where dark-grey dots (solid blue in colour) represent the combined response rate of female and male applications, while gender-specific statistics are represented by grey circles (for males, blue circles in colour) and light-grey dots (for females, orange circles in colour). A consistent scale is maintained along the horizontal axis to ensure that changes in response rate from the control group (as seen in the top two charts) are visible.
Treatment effects on response rate by genders and ethnic groups.
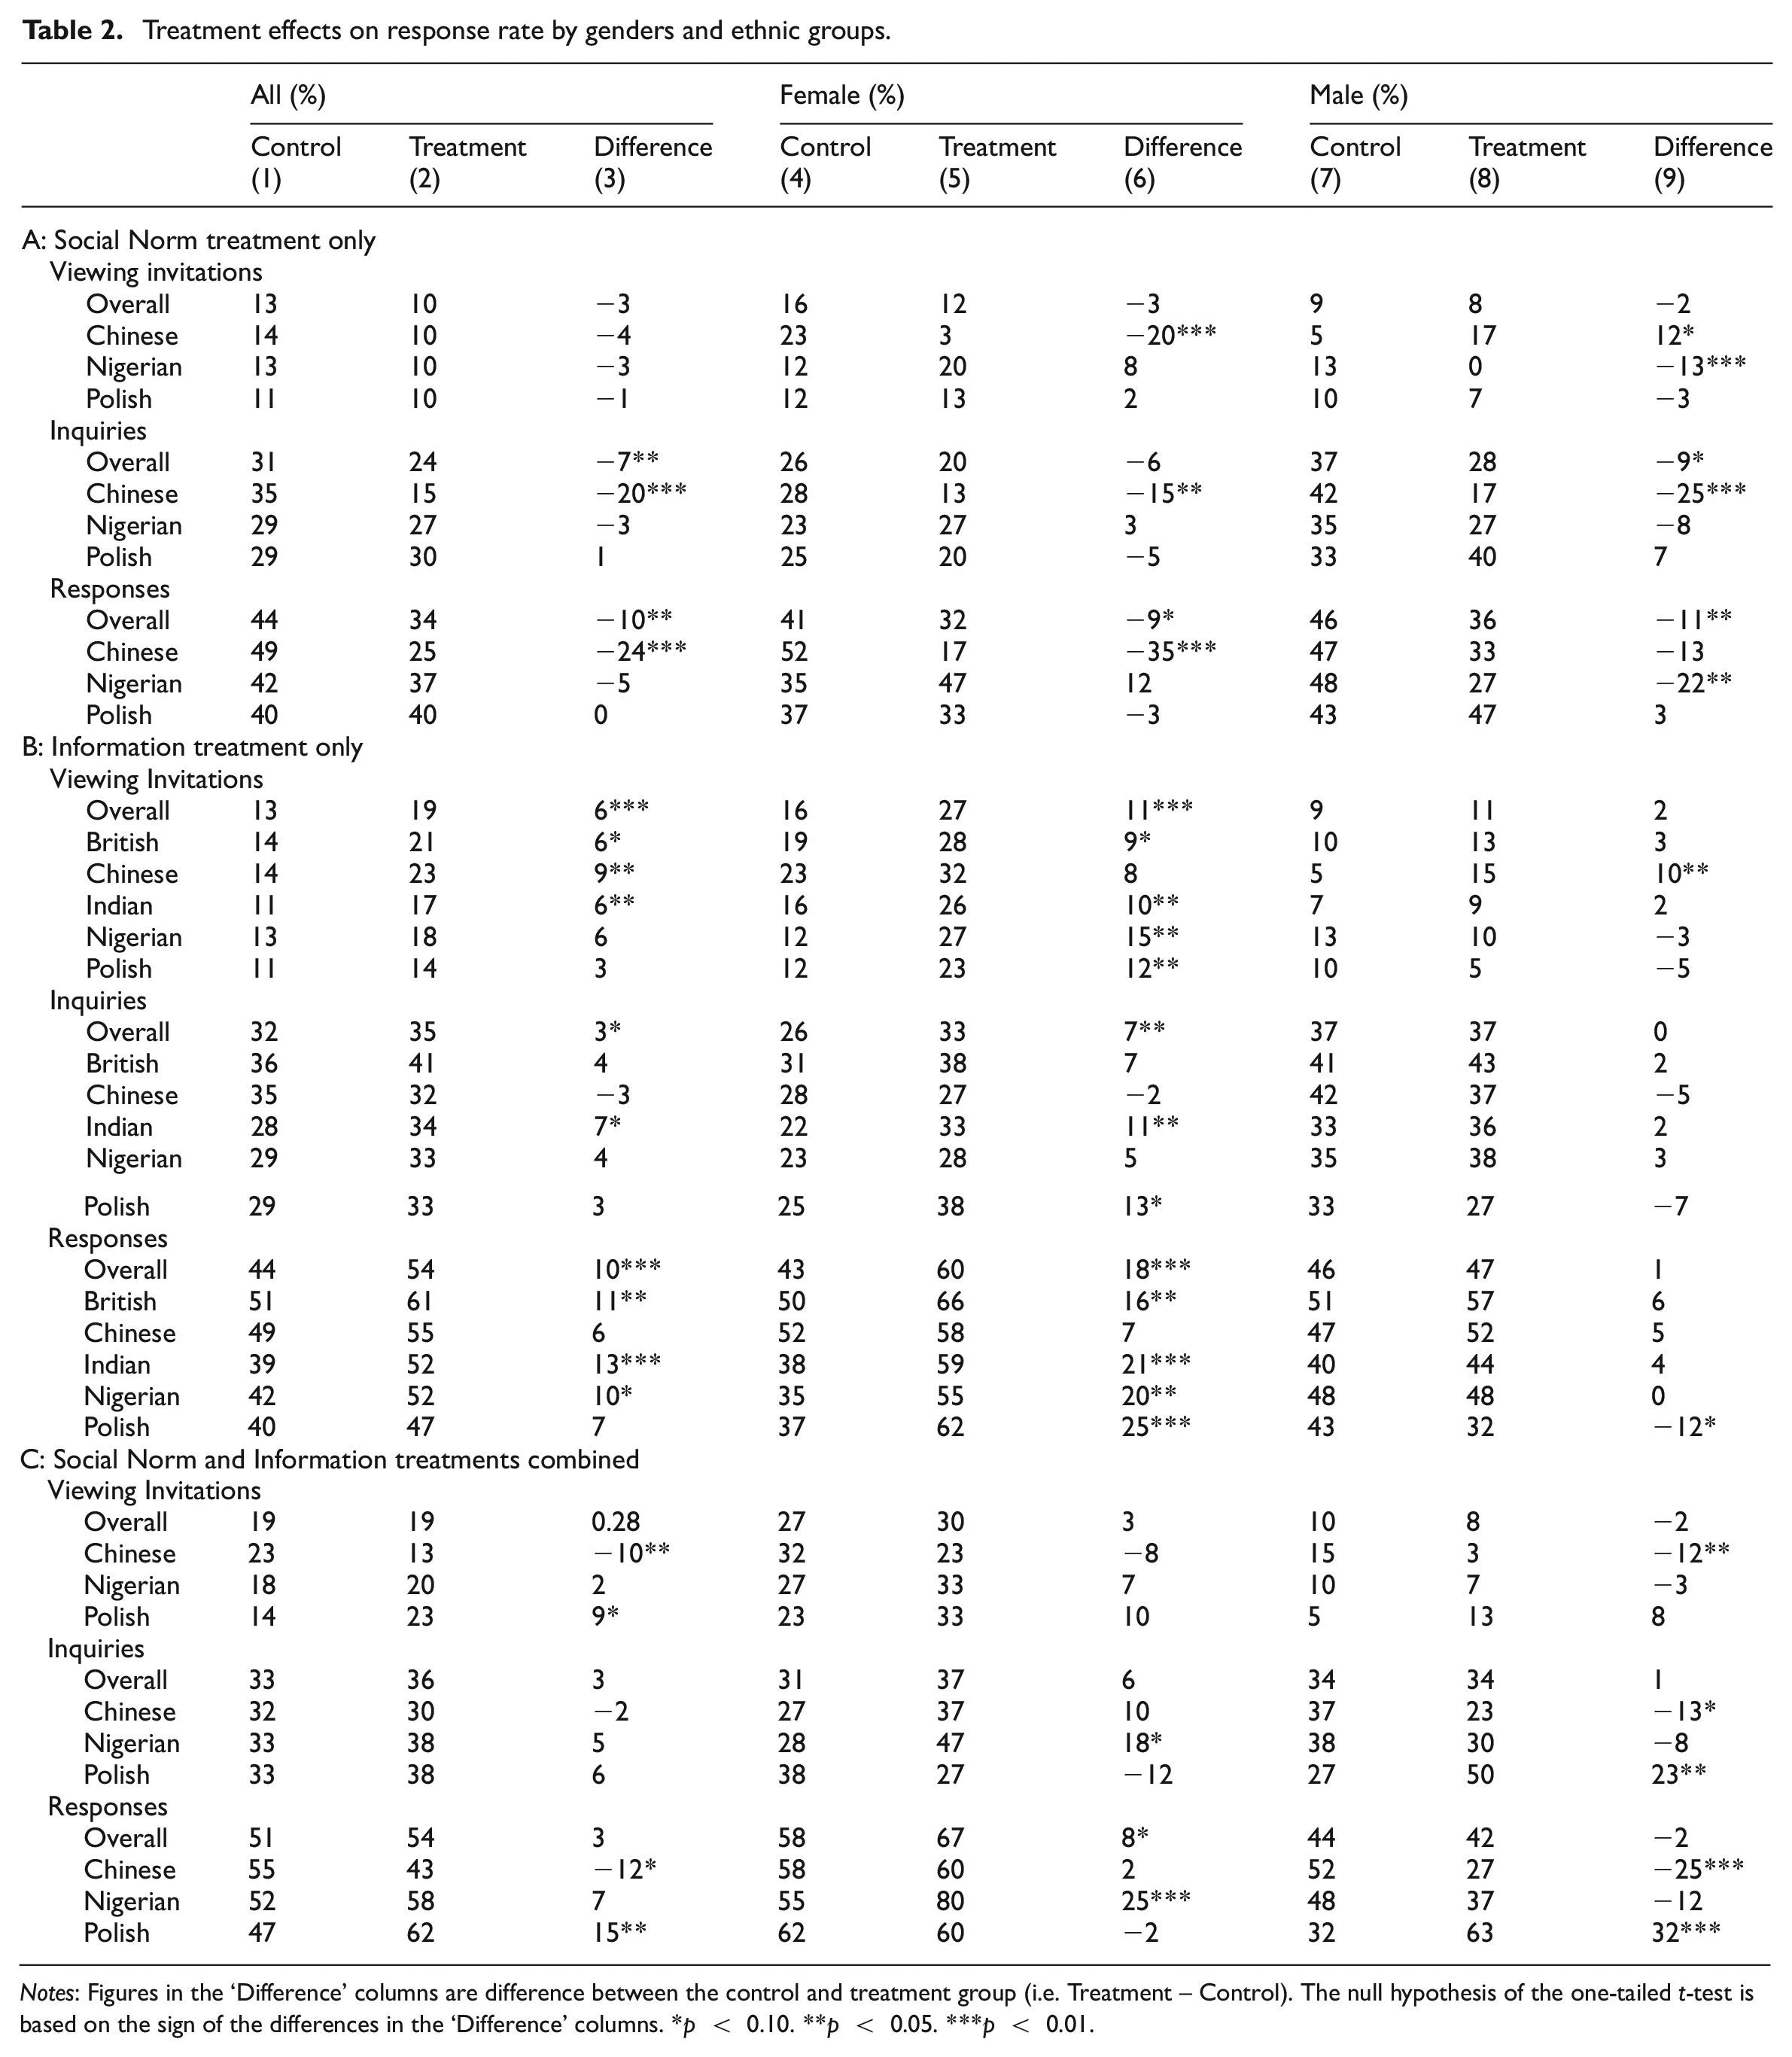
Notes: Figures in the ‘Difference’ columns are difference between the control and treatment group (i.e. Treatment – Control). The null hypothesis of the one-tailed t-test is based on the sign of the differences in the ‘Difference’ columns. *p < 0.10. **p < 0.05. ***p < 0.01.
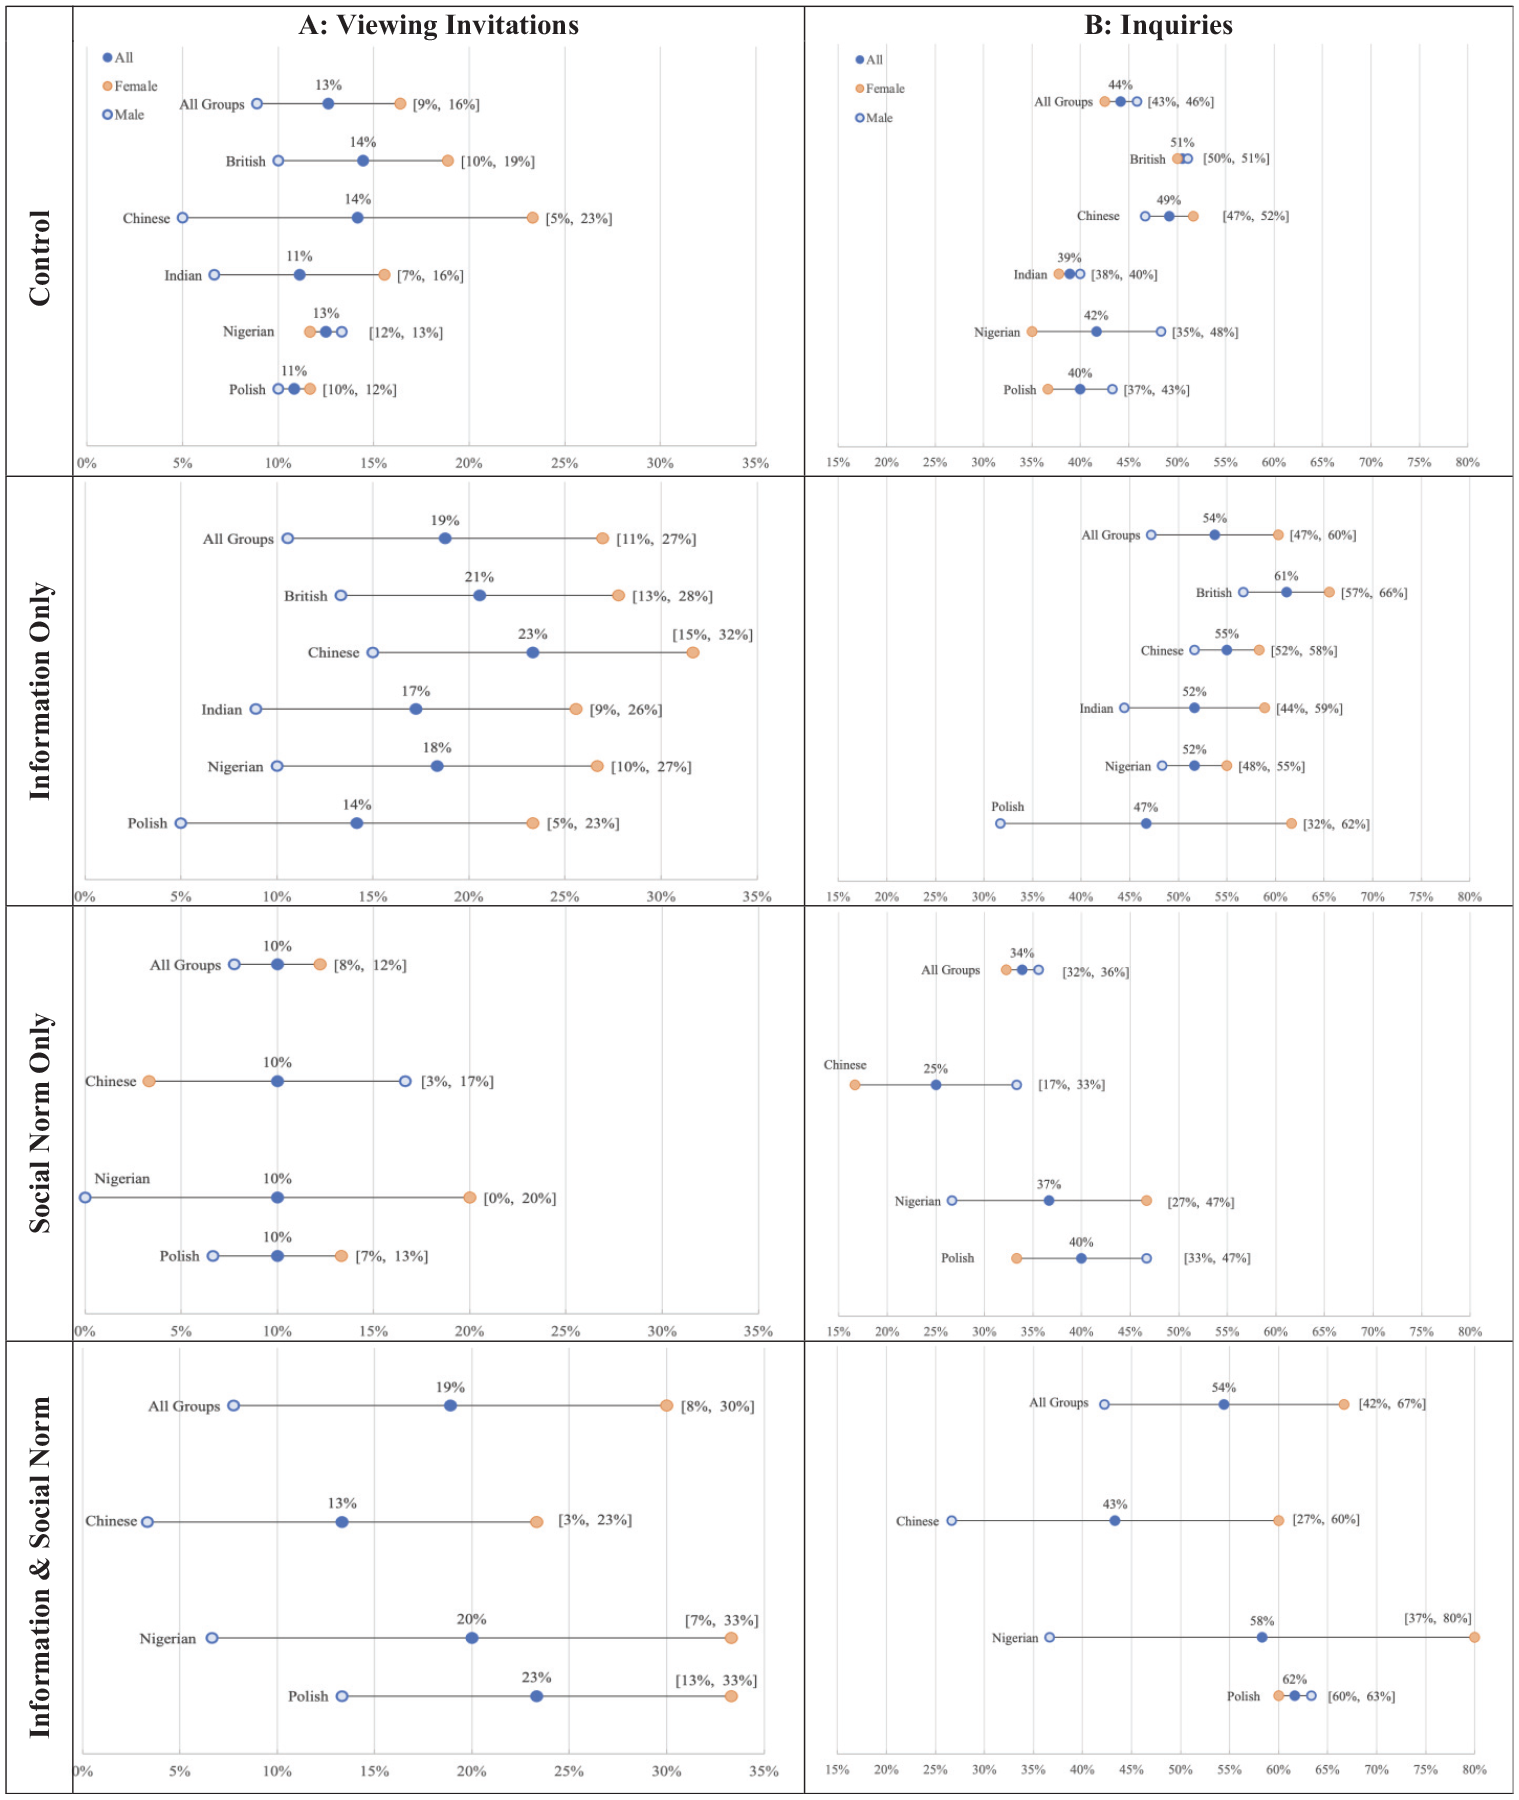
Proportions of applications with responses.
Evidence of gender and racial discrimination
The coefficient estimates of the gender indicator Male revealed gender discrimination in London’s rental housing market. However, gender discrimination affected letting agents’ behaviour differently when deciding whether to offer a viewing appointment straightaway (i.e. Viewing Invitations) or to further evaluate potential tenants (i.e. Inquiries). On average, letting agents discriminated against male renters when offering a viewing appointment based on the initial email inquiry. However, when deciding who to request further information from, letting agents favoured male renters. The 0.5305 odds ratio corresponding to Male in the Viewing Invitations model suggests that, on average, male applicants’ chance of getting viewing invitations is 46.95% lower than that of female applicants. In contrast, the 1.8223 odds ratio of Male in the Inquiries model indicates that male applicants are 82.23% more likely to be asked further questions than female applicants. These observations are confirmed by the control group sample statistics in Table 2. For example, in the ‘Social Norm’ experiment group, the proportions of viewing invitations and inquiries received by male and female applications are 9% versus 16% and 37% versus 26%, respectively. Similarly, in Figure 2, the dark-grey dots for the British White group are positioned to the right of those for most ethnic minority groups, indicating higher response rates for the former.
Regarding racial discrimination, the evidence between models is more consistent. In Panel B of Table 1, the coefficient estimates for the ethnic group dummies are negative, except for Chinese. The odds ratios suggest that ethnic minority groups are between 5.54% and 37.91% less likely to receive a response from letting agents compared to the British White group. This is consistent with the control group sample statistics reported in the second panel of Table 2, where the response rates for all ethnic groups were reported. The response rates for British White applicants are higher than those of all ethnic minority groups, with a few exceptions for Chinese renters.
In summary, statistics from the control group show clear signs of racial and gender discrimination in the London rental housing market. We now turn our attention to the treatment groups to investigate the extent to which the behavioural interventions influence the identified gender and racial biases.
Effects of behavioural interventions on response rates
In Panel C of Table 1, the first set of statistics shows the main effect of behavioural interventions on response rates. The coefficient estimates of Social Norm are negative in all models, indicating that the inclusion of social movement hashtags in emails reduced the likelihood of receiving a response from letting agents. Meanwhile, providing employment information in emails enhanced the chances of obtaining a reply. For example, mentioning employment details in an email increased the odds of securing a viewing invitation by an average of 89.44%. This pattern is also evident in Panel B in Table 2, where the Information intervention introduced a significant improvement in response rate in most cases.
Through detailed statistics reported in Table 2 and Figure 2, we also observed the intertwining of gender stereotyping and behavioural interventions, where the Information intervention worked primarily in favour of female renters. The negligible or adverse effects noted for male renters in the Indian and Polish groups are interesting. This is likely due to racial stereotypes of Black and Eastern European migrants, who are often perceived to work in blue-collar roles, such as construction or janitorial services. Given that our employment information is all white-collar jobs, the Information intervention might be interpreted as a lie and hence treated with caution.
Given that the Social Norm and Information interventions worked in opposite directions on response rates, the mixed outcomes for the ‘Social Norm and Information combined’ treatment group are not surprising. In the logistic regression analysis, when both behavioural interventions are implemented together, the effect is positive. Specifically, the coefficient estimate for the interaction term between Social Norm and Information suggests that incorporating both employment information and a social norm hashtag in emails improved the odds of receiving responses by 30.20%, 63.00% and 76.46% for Viewing Invitations, Inquiries and All Responses, respectively.
Considering the coefficient loadings of Social Norm, Information and their interaction term collectively, the overall impact of the behavioural intervention is positive. This trend is evident in Figure 2. Although the Social Norm intervention shifted some dark-grey dots towards the left (indicating a reduction in response rate), the majority of dark-grey dots moved significantly to the right, suggesting a general increase in response rates.
Effects of behavioural interventions on gender discrimination
The second set of variables in Panel C of Table 1 consists of interaction terms between gender and the behavioural interventions. Their coefficient estimates are utilised to evaluate the impact of behavioural interventions on gender discrimination. If the Social Norm and Information interventions successfully reduced gender discrimination, the coefficient estimates of these interaction terms should have the opposite sign to those of Male. For example, in the Inquiries model, the coefficient estimate of Male is 0.6001, translating to male renters having 82.23% higher odds of being asked further questions. However, in the Information treatment group, this gender gap is reduced to 19.75% (i.e.
Regarding the Viewing Invitations model, behavioural interventions widened the gender divide because the coefficient estimates of the interaction terms have the same sign as Male. For example, in the control group, male applicants are 46.95% less likely to receive a viewing invitation. If social norm hashtags are included in emails, male applicants are 56.34% less likely to be invited (i.e. 1-
These logistic regression findings are confirmed in both Figure 2 and Table 2. For instance, the gender gap is visibly wider in the treatment groups, especially in the Viewing Invitations and Information treatment group. The large and statistically significant improvements in column (6) of Table 2 show that the Information intervention worked much more effectively for female renters. In most cases, the effect of the Information intervention is 10% to 20% stronger for female renters than for their male counterparts.
Effects of behavioural interventions on racial discrimination
The final set of variables included in Panel C in Table 1 are the interaction terms between behavioural interventions and ethnic minority indicators. Coefficient estimates of these sets of variables are used to assess the impact of behavioural interventions on reducing racial discrimination. Positive coefficient estimates can offset the negative loading of the ethnic minority indicators in Panel B and consequently reduce racial gaps.
As the Social Norm interventions were only applied to Chinese, Nigerian and Polish applicants, the Chinese × Social Norm interaction term was omitted as the base category in this analysis. The effect of Social Norm intervention is more positive for Nigerian and Polish renters compared to Chinese applicants. For example, in the ‘Viewing Invitations’ model, the net coefficient loading of Social Norm stands at −0.6809, −0.1276 and 0.2595 for Chinese, Nigerian and Polish renters, respectively. This implies that including social movement hashtags in emails resulted in a −49.34%, −11.98% and 29.63% change in the likelihood of receiving a viewing invitation for Chinese, Nigerian and Polish renters, respectively. While the Social Norm interventions narrowed the racial gap for Polish applicants, they widened it for Chinese and Nigerian renters.
In the Viewing Invitations model, all coefficient estimates for the interaction terms of the information intervention are positive. This indicates that the inclusion of employment details in emails was more advantageous for ethnic minority groups than for the British White group when seeking a viewing invitation. However, in the Inquiries model, only the Chinese group benefitted from the Information intervention. The other ethnic minority groups did not reduce the response rate gap between them and the White British group by including employment information in their emails. On average, the Information intervention does not seem to affect racial discrimination significantly.
The complexity of racial and gender discrimination
When we break down the sample by gender and ethnic groups in Figure 2 and Table 2, the complexity of racial and gender discrimination becomes evident. Firstly, by including ‘#stopasianhate’ in email signatures, female Chinese renters’ chance of getting a viewing invitation dropped by 20%. In contrast, their male counterparts saw an increase of 12%. Meanwhile, when ‘#blacklivesmatter’ was included in Nigerian applicants’ emails, letting agents were 13% less likely to invite them for viewing but 8% more likely to extend the invitation to a female Nigerian renter. These patterns can only be visible when samples are broken down by gender and ethnic groups. Social norm interventions worked in different directions among gender and ethnic groups. They can easily cancel each other out at the aggregate level, as suggested by the small and statistically insignificant results reported in Tables 1 and 2.
The findings from the combined behavioural intervention treatment group revealed another layer of complexity. For example, the Information intervention alone increased Chinese male renters’ chance of receiving a viewing invitation by 10%. However, if Chinese male renters included both employment information and the ‘#stopasianhate’ hashtag in their emails, the chance of receiving a viewing invitation dropped by 12% instead. The opposite was observed for Polish male renters, whose response rate improved notably by using both behavioural interventions in their email messages. Overall, using the two behaviour interventions together helped male renters because the combined effect is larger than the sum of the effects from using each tool alone. The opposite is true for female renters. These findings highlight the challenge of applying behavioural interventions to real-life problems. Social norm interventions should be applied with great caution. They are powerful tools that could affect behaviours significantly, but the size and the direction of the effects are context-specific.
Conclusions
This study investigates the effectiveness of behavioural interventions in mitigating racial and gender discrimination within the rental housing market. Our findings indicate that such interventions are powerful tools. On average, the strategies employed in this research led to changes of up to 56% in gender gaps and 22% in racial disparities in response rates among ethnic minority groups. This underscores the potential of using behavioural interventions in combating racial and gender discrimination in the housing sector. These techniques have already demonstrated their efficiency and efficacy in other domains, including environmental protection and sustainable urban development. Our investigation represents an initial attempt to test the applicability of these tools in the UK’s rental housing market. As noted in our meta-analysis, countries with significant colonial legacies, such as the UK, tend to manifest elevated levels of racial discrimination (see Table S1–4 in section S1 in the Supplemental document). Yet, of the 30 studies we reviewed, only two were UK-based. More studies are needed to verify whether this finding can be generalised to all countries with a colonial legacy. Consequently, our research contributes empirical insights to this relatively unexplored domain.
Our findings also suggest that behavioural interventions are challenging tools to implement, partly because of the context-specific nature of the instruments and partly due to the interaction between gender and racial discrimination. The effects of using each intervention in isolation are significantly different from those when the two tools are combined. These behavioural interventions are double-edged swords that could do substantial damage if not implemented correctly. This echoes some lessons learned from the labour economics literature, where well-intended policies, such as the ‘Ban the Box’ legislation in the USA, backfired by aggravating racial discrimination (Agan and Starr, 2018). There are indeed no ‘one-size-fits-all’ solutions when using behavioural tools to address complex social problems such as racial and gender discrimination. Addressing racial and gender discrimination in the housing market is a nuanced and multifaceted challenge. Hiding one’s first name is far from enough to solve the problem. While behavioural interventions hold promise, their successful application demands rigorous testing using field data, as suggested by many behavioural intervention units in governments (DellaVigna and Linos, 2022).
This research can be extended and improved in several directions. First, although the correspondence test method is commonly used in studies of racial and gender discrimination in the housing market, it does have its limitations. Specifically, racial and gender profiles are solely determined using fictitious names, which may not be as accurately interpreted as researchers anticipate. Moreover, this method is not designed to study discrimination beyond the initial response stage. In contrast, paired testing sends real applicants – who are identical in other than racial background – to meet with landlords and letting agents. Given that this approach is in-person and extends past the preliminary inquiry phase, it has been adopted by the US Department of Housing and Urban Development for their annual housing discrimination surveys, resulting in many related studies (Christensen and Timmins, 2022; Christensen et al., 2022). Future studies could benefit from multi-stage studies employing both correspondence tests and paired testing.
Although the #stopasianhate hashtag is an appropriate social norm intervention for the Chinese group in this study, its wording is notably more assertive than the others. We believe that the two strong words ‘stop’ and ‘hate’ counterbalance each other, and the effect of this hashtag is comparable with that of those with milder phrasing. Nevertheless, we cannot rule out the possibility of the #stopasianhate hashtag being associated with a disruptive persona, which might have skewed the experimental results. Moreover, we did not find a suitable social norm intervention for the Indian group, which is the largest ethnic minority group in the UK. Implementing social norm interventions is intricate due to the nuanced and multifaceted nature of social interactions. Perhaps the efficacy and appropriateness of such an intervention can only truly be established through iterative trial and error.
Finally, it is essential to interpret our empirical findings within the context of our study area. In our meta-analysis, we regressed the odds ratios on an ethnic diversity index developed by Alesina et al. (2003). The data suggests that regions with greater ethnic diversity exhibit reduced racial discrimination. Thus, the racial discrimination identified in our study likely aligns closer to the lower spectrum of potential discrimination levels. Subsequent research should aim to gather empirical evidence outside of London to develop a comprehensive understanding of housing discrimination across the UK.
Footnotes
Acknowledgements
I am grateful for the excellent research support from Andrew Hao Huang and Sonny Yangfanqi Liu, and for the constructive comments and suggestions from the reviewers, participants at the 2023 ASSA – AEA Meeting, Brent Ambrose, Suzanne Charles, John Glascock, Norman Hutchison, Daniel Lebret, Colin Lizieri, Bryan MacGregor, Fiona Stoddard, Chris Webster, Martin Wersing and Xiaoling Zhang. All errors remain mine.
Declaration of conflicting interests
The author declared no potential conflicts of interest with respect to the research, authorship, and/or publication of this article.
Funding
The author received no financial support for the research, authorship, and/or publication of this article.