
Abstract
Suburbanisation appears to be reviving in the beginning of the 21st century. It has once again become an important force driving suburban growth. However, in contrast with 20th-century suburbanisation, the current phase might be better understood through the spillovers of urban gentrification and suburbanisation of poverty that are happening while the core city continues to grow. Using a multilevel binomial regression model on all moving households in the metropolitan region around Amsterdam, this paper shows that movers from Amsterdam are clearly urban oriented when moving out of the city. High-income households dominate the suburbanisation towards neighbourhoods near the city and to relatively urban residential neighbourhoods from the pre-war period. These are also neighbourhoods with sharp house price increases. This reveals a spillover of the urban gentrification process beyond the core city borders. Suburban in-migration of low-income households from the city has also increased and is more oriented to neighbourhoods where affordable housing is accessible.
Introduction
Many metropolitan areas of the post-industrial era are growing and economically flourishing (Glaeser, 2011). This growth is not limited to core cities; metropolitan areas around the cores are growing as well. Although suburban growth diversifies and is not solely dependent on the core city, the in-migration of households moving from the city to the surrounding region remains an important source of demographic growth. In the beginning of the 21st century this dynamic has again become prominent, albeit changed in character. Contrary to the suburbanisation period of the 1970s and 1980s, when the core city was in decline (Hayden, 2003), the growth of the outflow of the city currently coincides with the continuing growth of the core city (Booi et al., 2021; Sandow and Lundholm, 2020). The increasingly expensive core city is not able to accommodate all the urban population growth, triggering increasing migration of high income households into the region around the urban core (Booi et al., 2021; Mazanti, 2007; Paccoud and Mace, 2018). There are two dominant concepts that help to shed new light on the current processes of suburbanisation: the urban gentrification process spreading into suburban areas (Charles, 2013; Markley, 2018; Paccoud and Mace, 2018; Smith, 2002) and the suburbanisation of poverty (Bailey and Minton, 2018; Hochstenbach and Musterd, 2018; Hochstenbach and Musterd, 2021). Both concepts seem to be consequences of an increasingly expensive urban core and both can take place at the same time. However, their geographies could be very different due to differences between residential areas within the metropolitan region as to the composition of the housing stock and the area’s socio-economic position (Boterman et al., 2018).
The migration flow of households moving from the urban core to the region around the urban core is one of the main drivers of change in metropolitan regions (Leetmaa and Tammaru, 2007; Smith, 2002). Yet, it is still unclear how the city–suburb migration flows are distributed over the metropolitan area, how this is differentiated across social classes and what the dynamic processes behind these flows actually are.
This study investigates to what extent suburban residential areas (classified into eight neighbourhood types based on their density, main building period and distance to the city) are socio-economically changing and how these changes coincide with changes in the residential mobility of high- and low-income households from the core city. This is done by using registration data on the socio-economic characteristics of the population and the housing stock and data on residential mobility in the metropolitan region of Amsterdam over two periods of time. The following research questions will be answered:
To what extent are residential neighbourhood types in the metropolitan region around the city of Amsterdam showing changes in their socio-economic composition in the first decades of the 21st century?
How many households moved into these residential neighbourhoods types and what share came from the core city? How did this pattern in suburbanisation change during the first decades of the 21st century? And how does this differ between high- and low-income households?
To what extent do households moving from the city show a distinctive orientation towards neighbourhood and housing types compared to other moving households in the metropolitan areas around the city and how does this pattern hold when stratified for high and low income?
Metropolitan residential areas
Metropolitan residential areas in the post-industrial Western world contain a variety of residential environments (Wimark et al., 2020) – from relatively densely populated urban areas to suburban and more rural residential environments and anything in between. Density is a key characteristic in defining urban, suburban and rural areas (Cooke and Denton, 2015). Yet, residential areas also differ in housing types, ranging from small rental units to large, owner-occupied single-family dwellings and from pre-war to newly built housing. Perhaps on a lower level than in urban settings (Airgood-Obrycki, 2019), these suburban areas alter as they experience changes in socio-economic composition (Teernstra, 2014). The wide variety of suburban areas serves an equally wide variety of households (Boterman et al., 2018). Some areas may be more attractive or accessible to households moving from the city than to households moving from other directions. This makes these areas more susceptible to changes in the outflow of the city and the spread of urban gentrification (Charles, 2013; Paccoud and Mace, 2018). The suburbanisation of poverty could have its own geographical orientation as well (Hochstenbach and Musterd, 2018).
The diversity in residential areas reflects the different conditions and housing regimes under whose rules they were built (Wimark et al., 2020). These impact how different housing types age over time and how housing and neighbourhoods improve or decline in quality and perceived attractiveness (Galster, 1996).
Dwelling aesthetics and quality are important elements in whether a neighbourhood is found attractive among the urban-oriented fraction of the middle class and play a vital role in how susceptible a neighbourhood is to gentrification (Bridge, 2003). What building period is found attractive by the urban middle class differs per country. In case of the United Kingdom, this mostly regards older dwellings from the Georgian or Victorian period (Bridge, 2003). In the Netherlands, it is the building period just before World War II (Hochstenbach, 2017).
In Europe, the acute post-war housing shortage triggered rigorous state-led building programmes, which resulted in the production of a large social housing stock, especially between 1950 and 1979, with some being built in high density. While they remedied part of the housing shortage, many of those areas are nowadays considered less attractive and several are in relative decline (Hedin et al., 2012; Hochstenbach and van Gent, 2015). This could be the case even more for those built in dense settings (Cooke and Denton, 2015). After this period, in which state-led housing regimes dominated, market-led, yet state-stimulated, housing regimes took over in many European countries. After 1980, owner-occupied single-family homes became dominant in building programmes, mostly in suburban settings. These neighbourhoods from the 1980s and 1990s are ageing now and some are declining in attractiveness. In the beginning of the 21st century this remains a dominant housing type outside the urban cores, but more densely built areas are arising with more (rental) apartments outside urban cores as well.
Unlike the ‘first-tier suburbs’ in the US (Vicino, 2008), the oldest suburbs in Europe are not necessarily near urban cores. Therefore, distance to urban cores, building period and density of a neighbourhood are, together, important physical aspects that characterise residential areas (Airgood-Obrycki, 2019; Cooke and Denton, 2015; Vicino, 2008; Wimark et al., 2020).
Suburbanisation
From the second half of the 20th century onwards, much new housing has been built in suburban settings. It became the dominant milieu in many metropolitan areas (Hayden, 2003). When these suburbs were built, most of them were exclusively dedicated to housing and consumer-oriented services. Commonly, their residents commuted to the core city for work, speciality shops and cultural activities. Although suburban areas have always been physically and socially diverse (Hayden, 2003; Masotti and Hadden, 1973), many suburban areas changed over time and several became more urbanised. As a result, suburbs are no longer subordinated to the urban core(s) but an important part of the urban fabric (Keil, 2018). Population growth of suburbs is not exclusively linked to suburbanisation from the core city (anymore). Suburbs also receive migrants from other parts of the country or even from abroad. This makes suburban areas more independent, but they are still part of the wider metropolitan fabric. These changes, although multifaceted in their appearances, can be seen throughout the world and described as post-suburban (Phelps and Wu, 2011).
Although diversification is now an important characteristic of suburban areas, the core city in the metropolitan area still plays an important role with its concentration of jobs and functions, which serves as a magnet for young people. Not all of them stay and some will eventually move to the suburbs. With the increasing growth of core cities in the 21st century, suburbanisation from these core cities might even become more relevant (Booi et al., 2021).
Spillover of urban gentrification
In many post-industrial metropolitan regions, gentrification is a widespread process that significantly changes the urban core (Hochstenbach, 2017). This process has matured in several core cities and has almost reached its limits. Partly simultaneously and partly as a consequence of the urban gentrification process, it now shows up in and seems to spread into less central areas (Charles, 2013; Markley, 2018; Paccoud and Mace, 2018), provincial towns (Bridge, 2003) and even rural regions (Phillips, 1993, 2009).
Moving from a gentrified city to suburban or rural areas does of course not directly point towards processes of gentrification in suburban or rural areas. However, there are certain aspects of the current suburbanisation process that can be characterised as a spillover of the urban gentrification process. In gentrified cities, where not as many areas are left that are ‘gentrifiable’, suburban areas around the city may be the next alternative (Paccoud and Mace, 2018). Gentrified cities increasingly see an out-migration of high-income and higher-educated households into the metropolitan regions around cities (Booi et al., 2021; Mazanti, 2007; Sandow and Lundholm, 2020). House prices have increased, especially in cities (Hochstenbach and Arundel, 2020), and, for some households, the difference in house prices between cities and (parts of) suburban areas serves as a trigger to sell their house in the city and buy a larger one in a less expensive area elsewhere in the metropolitan area around the core city (Karsten, 2020). These households price local buyers, who have less excess value to spend, out of the market and this potentially leads to exclusionary displacement in suburban areas (Marcuse, 1985).
The spillover of the urban gentrification process will not necessarily be spread evenly over the region around the gentrified core city. Households predominantly move to neighbourhoods that match their socio-economic, ethnic and also sociocultural (lifestyle) characteristics (Boterman et al., 2018). The literature on urban gentrification shows that the neighbourhood choice of the urban middle class is deliberate (Boterman, 2012; Bridge, 2003). Settling in these other urban areas, especially when it is done by many, helps the urban middle class to continue their urban lifestyle. A respondent in Mazanti’s research on families in Copenhagen phrased this feeling as follows: You cannot move the cafés to Trekroner [suburb 25 kilometre west of Copenhagen, near Roskilde], but you can move some of the spirit of the city by living together with people who have been used to living in a city. (Mazanti, 2007: 65)
A growing in-migration of urban middle-class households in certain residential areas can change the character and socio-economic composition of these areas. This process can then be characterised as a spillover of the gentrified city into specific areas around the core city.
Spillover of urban gentrification is not necessarily similar to suburban or rural gentrification although it can overlap. The literature on rural gentrification describes how rural areas are gentrifying, with rent gaps developing in rural areas as well (Smith, 1979). Farm buildings that have become derelict due to the shrinking agricultural sector can potentially be attractive for urban households to refurbish or even rebuild anew, adding value to the area (Nelson et al., 2010; Phillips, 1993). In suburban areas, the gentrification process is shown by ‘teardowns’ (Charles, 2013), the incremental process of demolishing older and cheaper dwellings in modestly priced suburbs and building large, expensive dwellings in their place. The focus in this paper, however, is on the spillover of the gentrified urban core and residential mobility as one of the key aspects within gentrification (Smith, 2002) rather than on gentrification processes in suburban or rural areas.
Suburbanisation of poverty
Renting or buying a house in gentrifying areas has become more expensive. Possibilities – even for middle-class households but in general for relatively poorer households – have therefore become more limited. The literature on gentrification often describes the displacement of poor households (Atkinson, 2000) but less often looks at where poor households move to and actually come from. The literature on the suburbanisation of poverty sees a rising share of low-income households in suburban areas (Bailey and Minton, 2018; Cooke and Denton, 2015; Hochstenbach and Musterd, 2021; Howell and Timberlake, 2014). However, rising poverty in suburban areas can have multiple causes and is not necessarily brought on by selective in-migration of low-income households from the city. It could also be due to in situ changes (e.g. rising unemployment or ageing), selective out-migration of higher-income households or selective in-migration of low-income households from elsewhere (Murphy and Allard, 2015; Teernstra, 2014). There are studies that show a rising share of low-income households moving into suburban areas (Hochstenbach and Musterd, 2018), but that literature does not necessarily reveal where the poor households come from. These two aspects – where they move to and where they come from – require more attention.
All income groups face their own difficulties in finding a suitable home. Yet, with regard to the availability and affordability of housing, low-income households generally have less options than high-income households. Lower-income households can even face direct displacement when rising rents force them to move to less expensive housing, often in more peripheral areas. In countries with strong tenant rights and rent subsidies for those in need of that, direct displacement is unlikely. Here, indirect displacement may be a more important process (Marcuse, 1985). Indirect displacement happens when lower-income households from elsewhere are increasingly faced with inaccessible and unaffordable core cities; consequently, they have to move to more accessible and more affordable areas further away from the city. These low-income households actually never move into the city.
Low-income households are more oriented towards housing that is affordable to them. In the Dutch context, the availability of social housing will likely be the most important factor for explaining the social spatial pattern of low-income households in a metropolitan context (Hochstenbach and Musterd, 2018).
Data and methods
The metropolitan region of Amsterdam has been chosen as case study area. It is a diverse region containing very different residential areas ranging from predominantly urban to clearly suburban and highly rural areas. The city of Amsterdam functions as the main urban core in this metropolitan region. Amsterdam can be seen as a strongly gentrified city (Boterman and Van Gent, 2023) where an overspill of the urban gentrification process is likely to take place. Although tenant rights in the Netherlands prevent many low-income households from being pushed out of the city, suburban poverty in Amsterdam’s region is still increasing (Hochstenbach and Musterd, 2018). This makes the metropolitan region an interesting area in which to investigate both processes in a comparative way. The delineation of the case study area is formed by the housing market area ‘Metropolitan Region of Amsterdam’, as defined by the national government, and contains 31 municipalities. To capture the changes through time, two time periods were selected: 2005–2006 and 2017–2018. These two time periods both represent periods of high economic growth, rising house prices and a high mobility rate. In the first period (2005–2006), the city population growth was more moderate, but, after the economic crisis (2008–2013), this growth accelerated. The second period (2017–2018) represents a time of high population growth.
Neighbourhood types
To gain insight into the geography of the spillover of urban gentrification and the suburbanisation of poverty, a classification was made of different neighbourhood types. The neighbourhood types consist of clusters of more or less comparable neighbourhoods in the metropolitan area of Amsterdam. This area, excluding Amsterdam, contains 177 residential neighbourhoods, based on the neighbourhood classification provided by Statistics Netherlands. Statistics Netherlands also provides a wide variety of statistics on this neighbourhood level. Via the microdata service of Statistics Netherlands, these statistics were used to construct clusters of neighbourhoods.
Based on the literature, three indicators were used to define different neighbourhood types (Airgood-Obrycki, 2019; Cooke and Denton, 2015; Vicino, 2008; Wimark et al., 2020): distance to the urban core (the closer, the more connected to the urban core); density (urban areas as ‘highly dense’ and rural areas as ‘sparsely populated’); and building period (indicating a specific building regime, aesthetics and ageing through time). These indicators are used in many studies on socio-economic changes in suburbs although the exact definitions differ, related to the local context of these studies. For this analysis, the neighbourhoods were classified into eight neighbourhood types capturing the relevant differences in suburban areas in the metropolitan region around Amsterdam. First, a division by the distance to the city was applied, classifying all (clusters of) neighbourhoods adjacent to the city as ‘near the city’. All other neighbourhoods were labelled ‘further from the city’. This was followed by a subdivision based on density. The density was measured as the number of inhabitants per square kilometre of land (low density: less than 1000; medium density: 1000–4000; high density: 4000 or more). Lastly, the main (most frequently present) building period was defined per neighbourhood. The combination of these three dimensions led to 24 possible combinations (distance (2)*density (3)*building period (4)). Not all combinations existed, and some were empirically irrelevant. Ultimately, eight neighbourhood types remained (see also Figure 1).
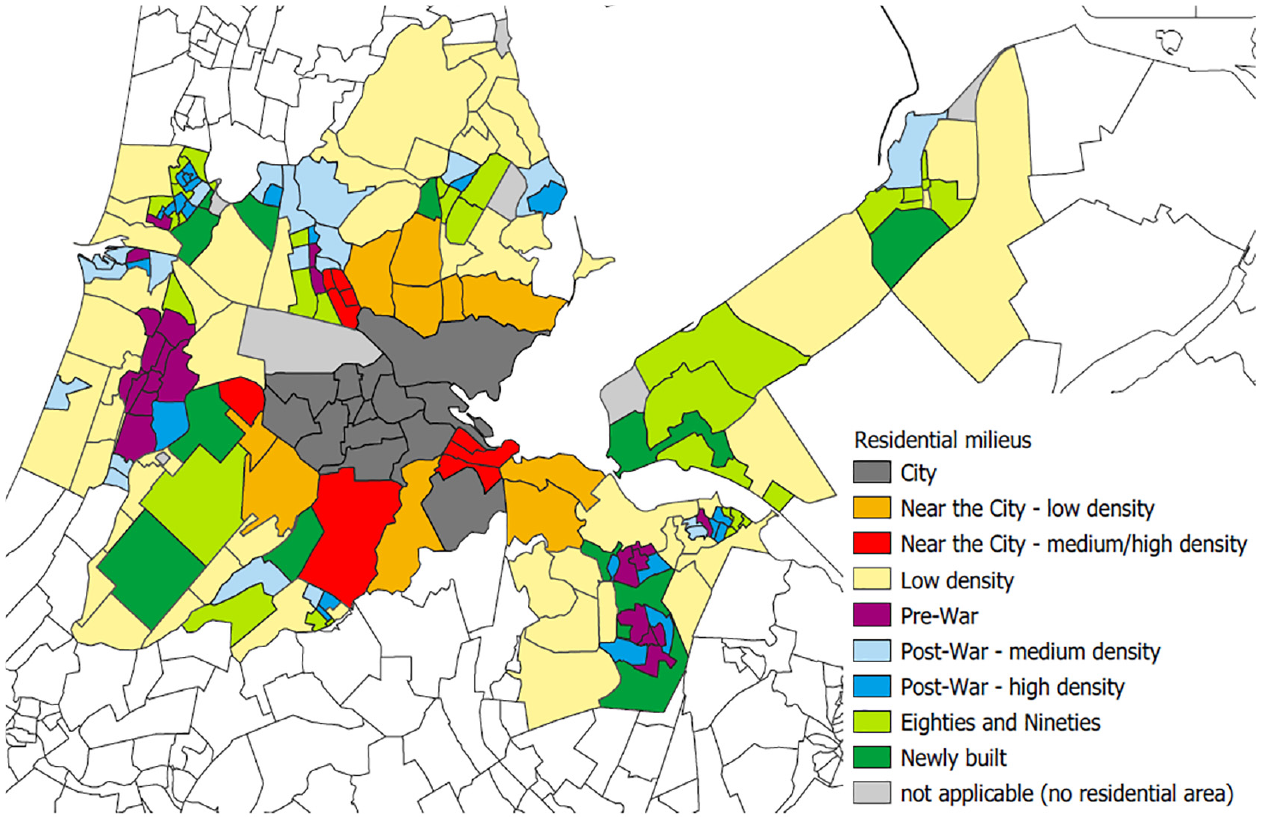
Neighbourhood types in the metropolitan area of Amsterdam.
Within the ‘near the city’ neighbourhood type, the number of neighbourhoods was too small to make many subdivisions. This resulted in two neighbourhood types near the city (number of neighbourhoods between brackets):
Near the city:
low density (10)
medium/high density (9)
Newly built neighbourhoods often have a low density because of vacant land. This is only temporary; density will increase when more new housing stock is added. Therefore, all neighbourhoods with a main building period after 2000 (regardless of density) were put in the ‘newly built’ neighbourhood type (they were all further from the city). The remaining neighbourhoods further from the city with a low density were put together in the ‘low density’ neighbourhood type. Medium/high density neighbourhoods were divided by their main building period. For the post-war neighbourhoods, it was possible to make a division between medium and high density. This resulted in six neighbourhood types further from the city:
Further from the city:
Newly built (≥2000) (10)
Low density – built before 2000 (53)
Pre-war (<1946) – medium/high density (22)
Post-war (1946–1979) – medium density (20)
Post-war (1946–1979) – high density (23)
Eighties and nineties – medium/high density (30)
To answer the first research question – to what extent residential neighbourhood types in the metropolitan region around the city of Amsterdam are showing changes in their socio-economic composition in the first decades of the 21st century – a description was given of the relative presence in the neighbourhood types of the socio-economic characteristics: first and fourth quartiles of the national distribution of yearly disposable income; low educated with no vocational training and high educated with higher vocational training or university; and first and fourth quartiles of the national distribution of housing values. This was done by computing location quotients at the end of the studied time periods (31 December 2006 and 31 December 2018). This allowed for looking at the relative changes of these neighbourhood types within the metropolitan area regardless of overall changes that affected the metropolitan region in general (e.g. the overall rise in house values).
Residential moves
Detailed information on the residential moves was obtained via the microdata service of Statistics Netherlands. These data contain all – so not a sample of – registered moves, including information on the former and current place of residence, dwelling characteristics and the socio-economic position of all individual moving households. Here, the focus is on households that are oriented on the market for independent housing; therefore, dwellings that were occupied by multiple households were not included in the analysis. 1 This means that all dwellings that came available and were taken by a moving household were included in the analysis, which therefore contained nearly all the available housing supply of existing and newly built dwellings (only excluding unsold or vacant rental dwellings). The situation (type of dwelling, type of household etc.) was measured at the end of the time period (31 December 2006 and 31 December 2018) and therefore after the move.
First, the descriptives were given of the moving households per neighbourhood type. This answers the second research question – how many households moved into these residential neighbourhood types and what share came from the core city? How did this pattern in suburbanisation change during the first decades of the 21st century? And how does this differ between high- and low-income households? This gives a first insight into the scale and the moving pattern of households from the city into the region around the city and how it coincides with the (changes) in the socio-economic position of the neighbourhood types.
To answer the third research question – to what extent moving households from the city are showing a distinctive orientation on neighbourhood and housing types compared to other moving households in the metropolitan areas around the city and how this pattern holds when stratified for high and low income – a multilevel logistic regression analysis was performed. The dependent variable was whether the dwelling was obtained by a mover from Amsterdam or obtained by another mover. The independent variables include information about the housing supply: the dwelling characteristics and neighbourhood types. The first level is that of the individual moving household (202,230 cases) and the second level that of the neighbourhood (177 neighbourhoods). The characteristics of the dwelling are all variables on the first level. The neighbourhood type is on the level of the neighbourhood. The neighbourhood types are partly defined by the main building period of the dwellings; therefore, an interaction variable was added to the model that combined the neighbourhood type and the building period of the individual dwelling. The dwelling characteristics have missing cases (size: 1%; building period: 1%; tenure: 8%; value: 9%; type: 1%). The missing cases partly overlapped (for dwellings where the size is unknown, the building period is often unknown as well) but not entirely. The cases missing information on tenure and value were overrepresented in the newly built housing stock but were found in the other building periods too. As this bias in missing cases could potentially influence the results on the newly built housing stock, they should be interpreted carefully. The missing cases were part of the regression model (as a separate category). For reasons of clarity, they are not shown in the results. Ideally, a division between social rent and private rent should be made. Unfortunately, this variable was not available for the period 2005–2006. In 2017–2018, the share of social housing was 70% of the total rental stock. In 2005–2006, the share of social housing was presumably higher. In the intermediate period, social housing was sold to owner-occupiers and private investors extended their housing stock (Hochstenbach and Ronald, 2020).
Next, the regression models were stratified by high-income and low-income households, leaving the middle out. Students were left out as well because their income does not always represent their socio-economic position. High-income households were defined by their yearly household disposable income, being in the top fourth quartile of the national income distribution (n = 52,378), with low-income households being in the first quartile (n = 38,961). Another main indicator of socio-economic position, education level, could not be included in the models due to too many missing cases (2005–2006: 60% missing; 2017–2018: 48% missing).
The models offered special insights in the suburbanisation of urban households into different residential neighbourhood types around the urban core and how they differ in their mobility patterns from other movers. The stratification by income provided insight in the extent to which movers from the urban core contribute to processes of socio-economic change in different neighbourhood types that can be indicative of spillover of urban gentrification and of suburbanisation of poverty processes.
Results
Characteristics and socio-economic changes in the neighbourhood types
The eight neighbourhood types differ from each other in the characteristics of the housing supply and the socio-economic status of the households as well as the changes in these characteristics between the two time periods (Figure 2). As found in other research (Airgood-Obrycki, 2019), most neighbourhood types appear to be relatively stable in their socio-economic status (measured as the share of higher- and lower-income households, higher-educated households and the value of the dwellings). There was no clear relative increase in lower- or higher-income households in any of the neighbourhood types.
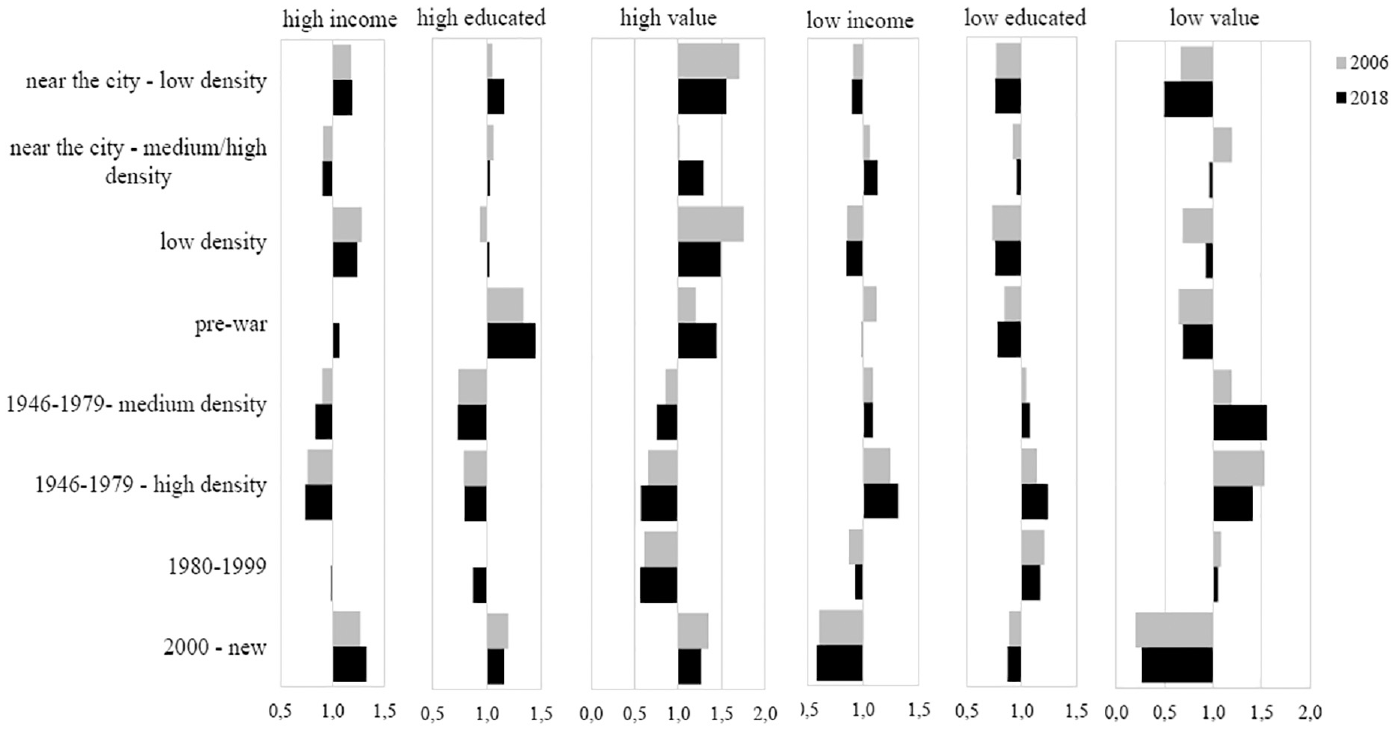
Location quotients of socio-economic characteristics by neighbourhood and dwelling type, 2006 and 2018.
In the ‘near the city’ neighbourhoods, there was a relative increase in house values (‘near the city – medium/high density’) and in higher-educated households (‘near the city – low density’). In the ‘pre-war’ neighbourhoods, the changes were most significant: house prices increased as well as the share of higher-educated households. These increases could be indicative of processes of spillover of urban gentrification. The ‘pre-war’ neighbourhoods contain older urban cores, including the medium-sized city of Haarlem. These neighbourhoods are often seen as attractive residential milieus for the urban middle class (Hochstenbach, 2017).
The ‘post-war’ neighbourhoods, built between 1946 and 1979, contain less expensive dwellings and are generally less affluent. These neighbourhoods saw an increase in lower-educated households (‘post-war – high density’) and a relative increase in low-value dwellings (‘post-war – medium density’). This could be a sign of relative impoverishment. These dwellings are often seen as less attractive by the urban middle class (Hedin et al., 2012; Hochstenbach and van Gent, 2015). The affluent ‘low density’ neighbourhoods saw a relative decline in house values, while the relative share of high-income households stayed high.
In the next section, the role of the households moving away from the city into these neighbourhood types is analysed in greater detail.
Residential mobility in the metropolitan region around the city
Around 100,000 households moved in each of the two time periods in the metropolitan region around the city of Amsterdam. Most households moved over short distance within this region (70.2%) and 17.0% came from outside the metropolitan region. The share (and number) of these households that had their former address in Amsterdam is smaller but increased significantly between the two time periods (from 11.2% to 14.4%). This is likely related to the growth of the city in general (Booi et al., 2021). The share of movers from Amsterdam in the total number of moving households is not evenly spread over the neighbourhood types. In the two neighbourhood types ‘near the city’, the share is much higher than in the neighbourhood types further away (Table 1), indicating the importance of distance and staying close to the city for city leavers. Neither is the increase evenly spread. The ‘pre-war’ neighbourhood type saw the highest increase of movers from Amsterdam (8.1% to 14.2%; +76.6%), followed by the geographically often adjacent ‘post-war – high density’ neighbourhood type (4.9% to 8.2%; +67.2%). In the ‘near the city’ neighbourhoods, the increase is also relatively high (+37.5% and +45.5%). In the other neighbourhood types, there is no, or only a small, increase.
Household moves in the region around Amsterdam per two-year period, by residential milieu, total moves and the share of households moving from Amsterdam.
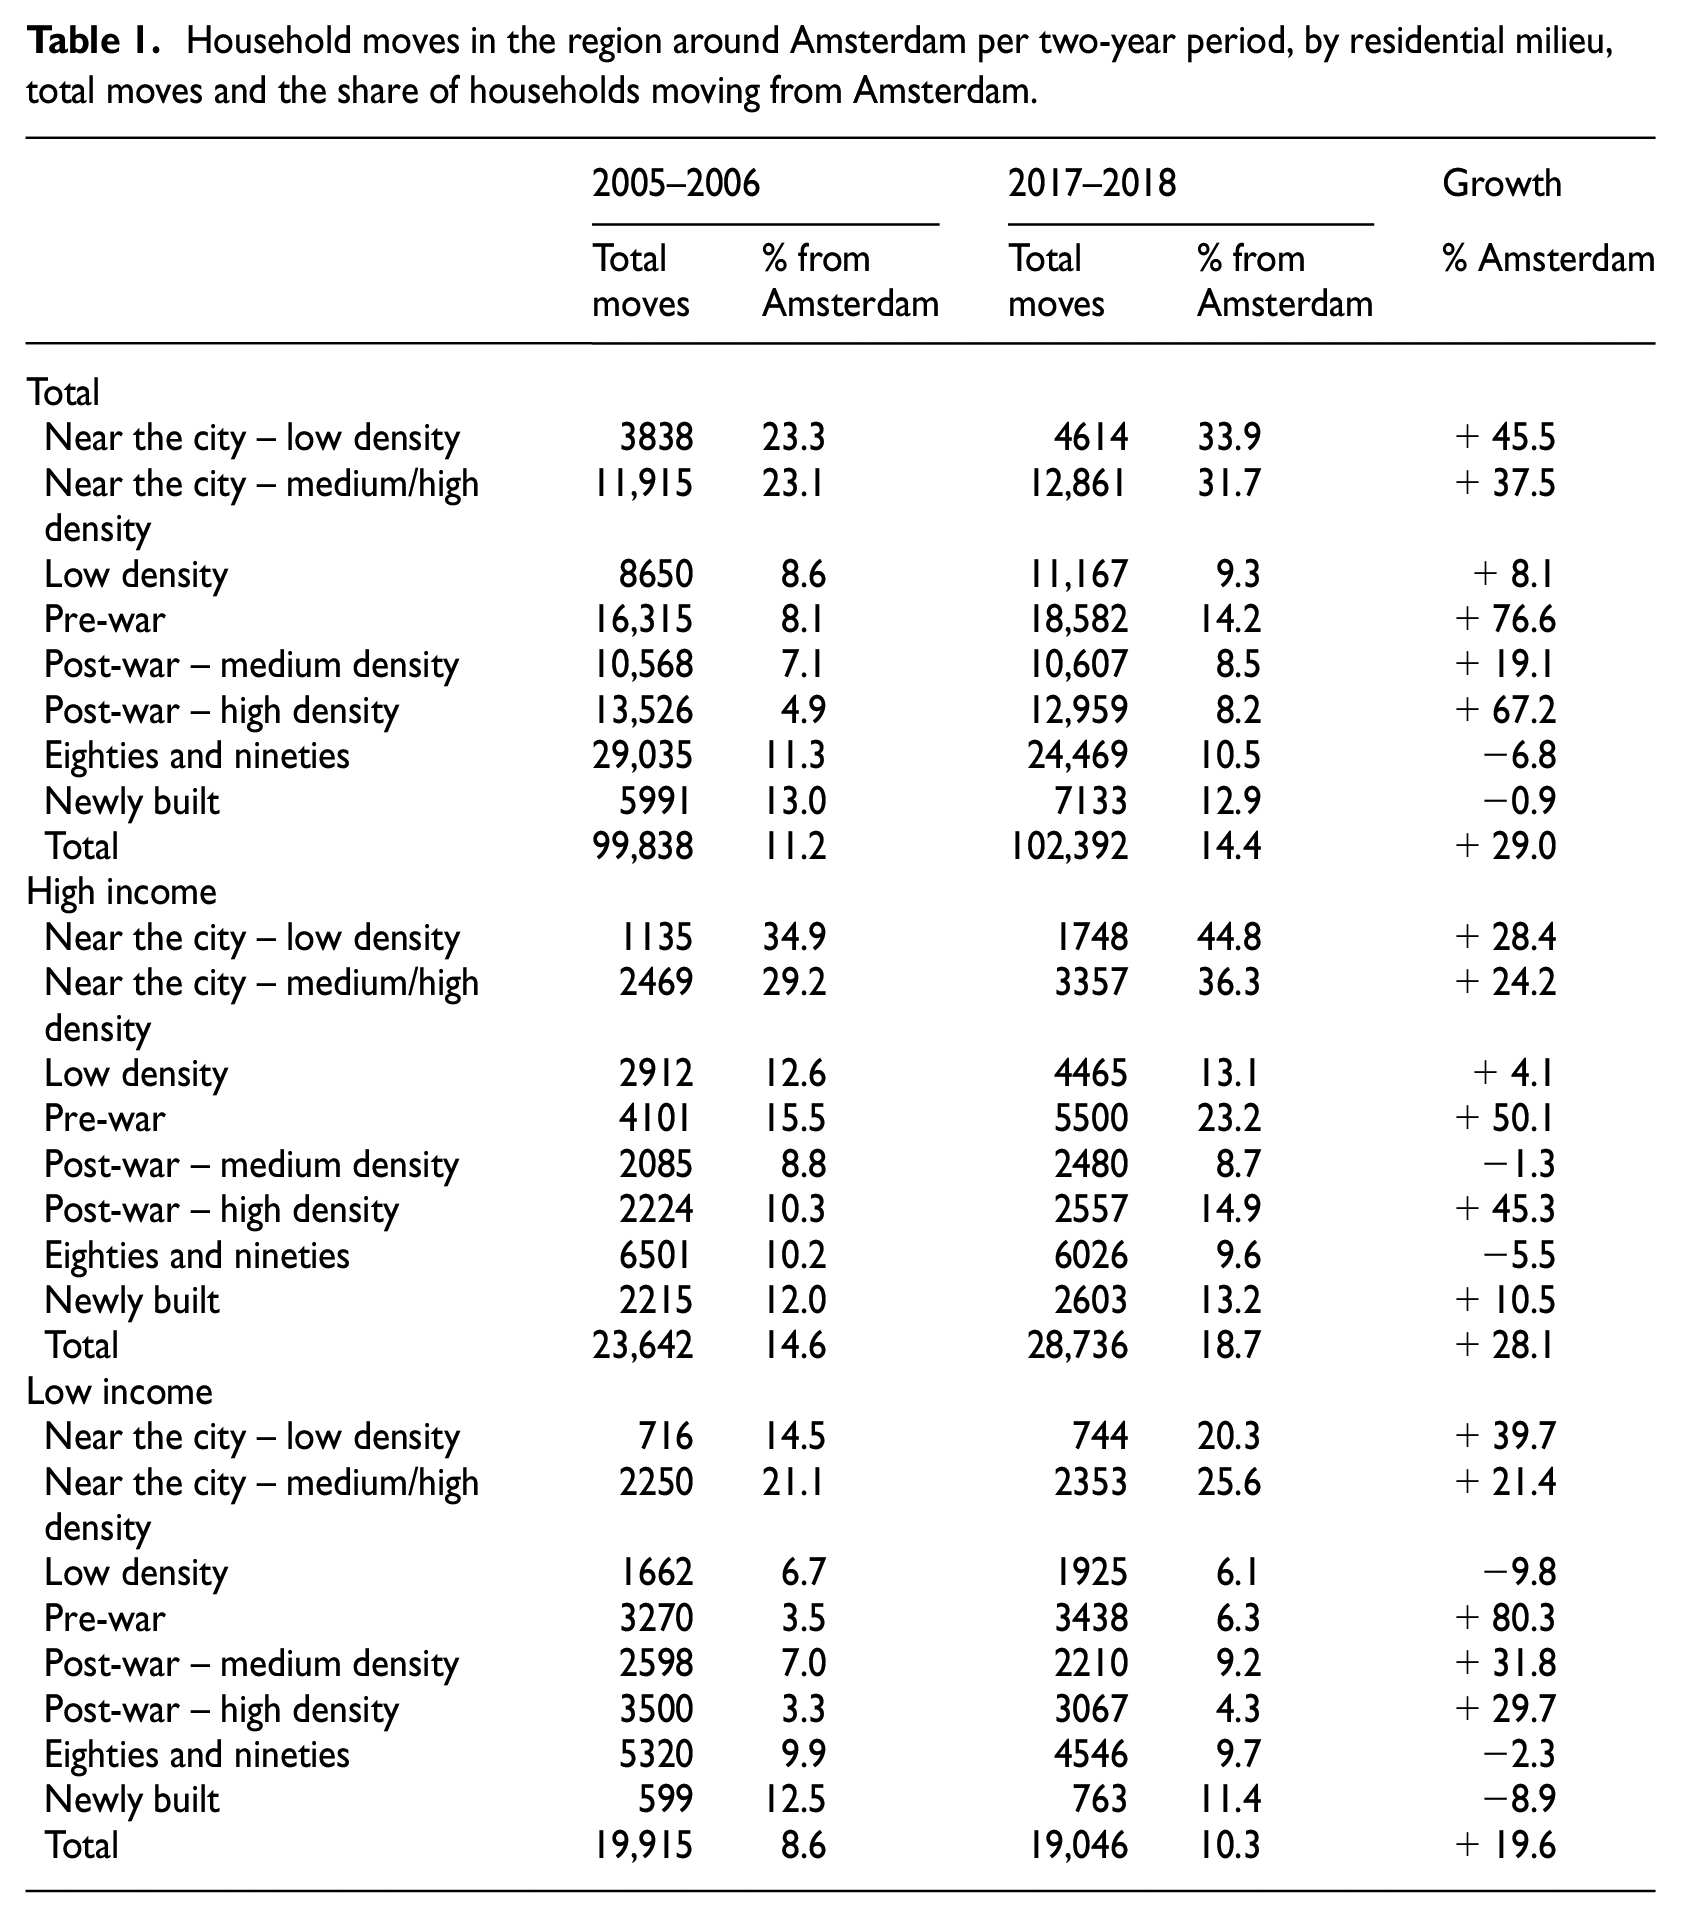
Moving households in the metropolitan region around Amsterdam increasingly have a high income (see Table 1). Within the high-income group, the share of movers from Amsterdam was already relatively high and became even higher (from 14.6% to 18.7%). Most high-income movers moved within the metropolitan region around the city (65.5%); 16.8% came from outside the region. The growth of the share of high-income movers from Amsterdam appears to be concentrated in the neighbourhood types ‘near the city’, ‘pre-war’ and ‘post-war – high density’.
The total number of low-income movers decreased slightly between the two time periods. However, within the low-income group, the share of movers from Amsterdam increased, albeit from a lower starting position and at a slower pace than the high-income movers (from 8.6% to 10.3%). Low-income movers predominantly moved within the metropolitan region around the core (74.8%); 15.9% came from outside the metropolitan region. The growth of the share of low-income movers from Amsterdam shows a similar pattern to that of the high-income movers and adds the ‘post-war – medium density’ neighbourhood type to that pattern.
Patterns in suburbanisation
The moving patterns of different households not only depend on the available residential neighbourhood types but also on the available housing supply in terms of dwelling characteristics within these areas. To compare the results independently, a multilevel logistic regression model was performed (see Table 2) and predicted probabilities are computed (see Figure 3).
Multilevel logistic regression model on moving households from Amsterdam to the region around Amsterdam, compared to all other movers in the region around Amsterdam, total and by income group.
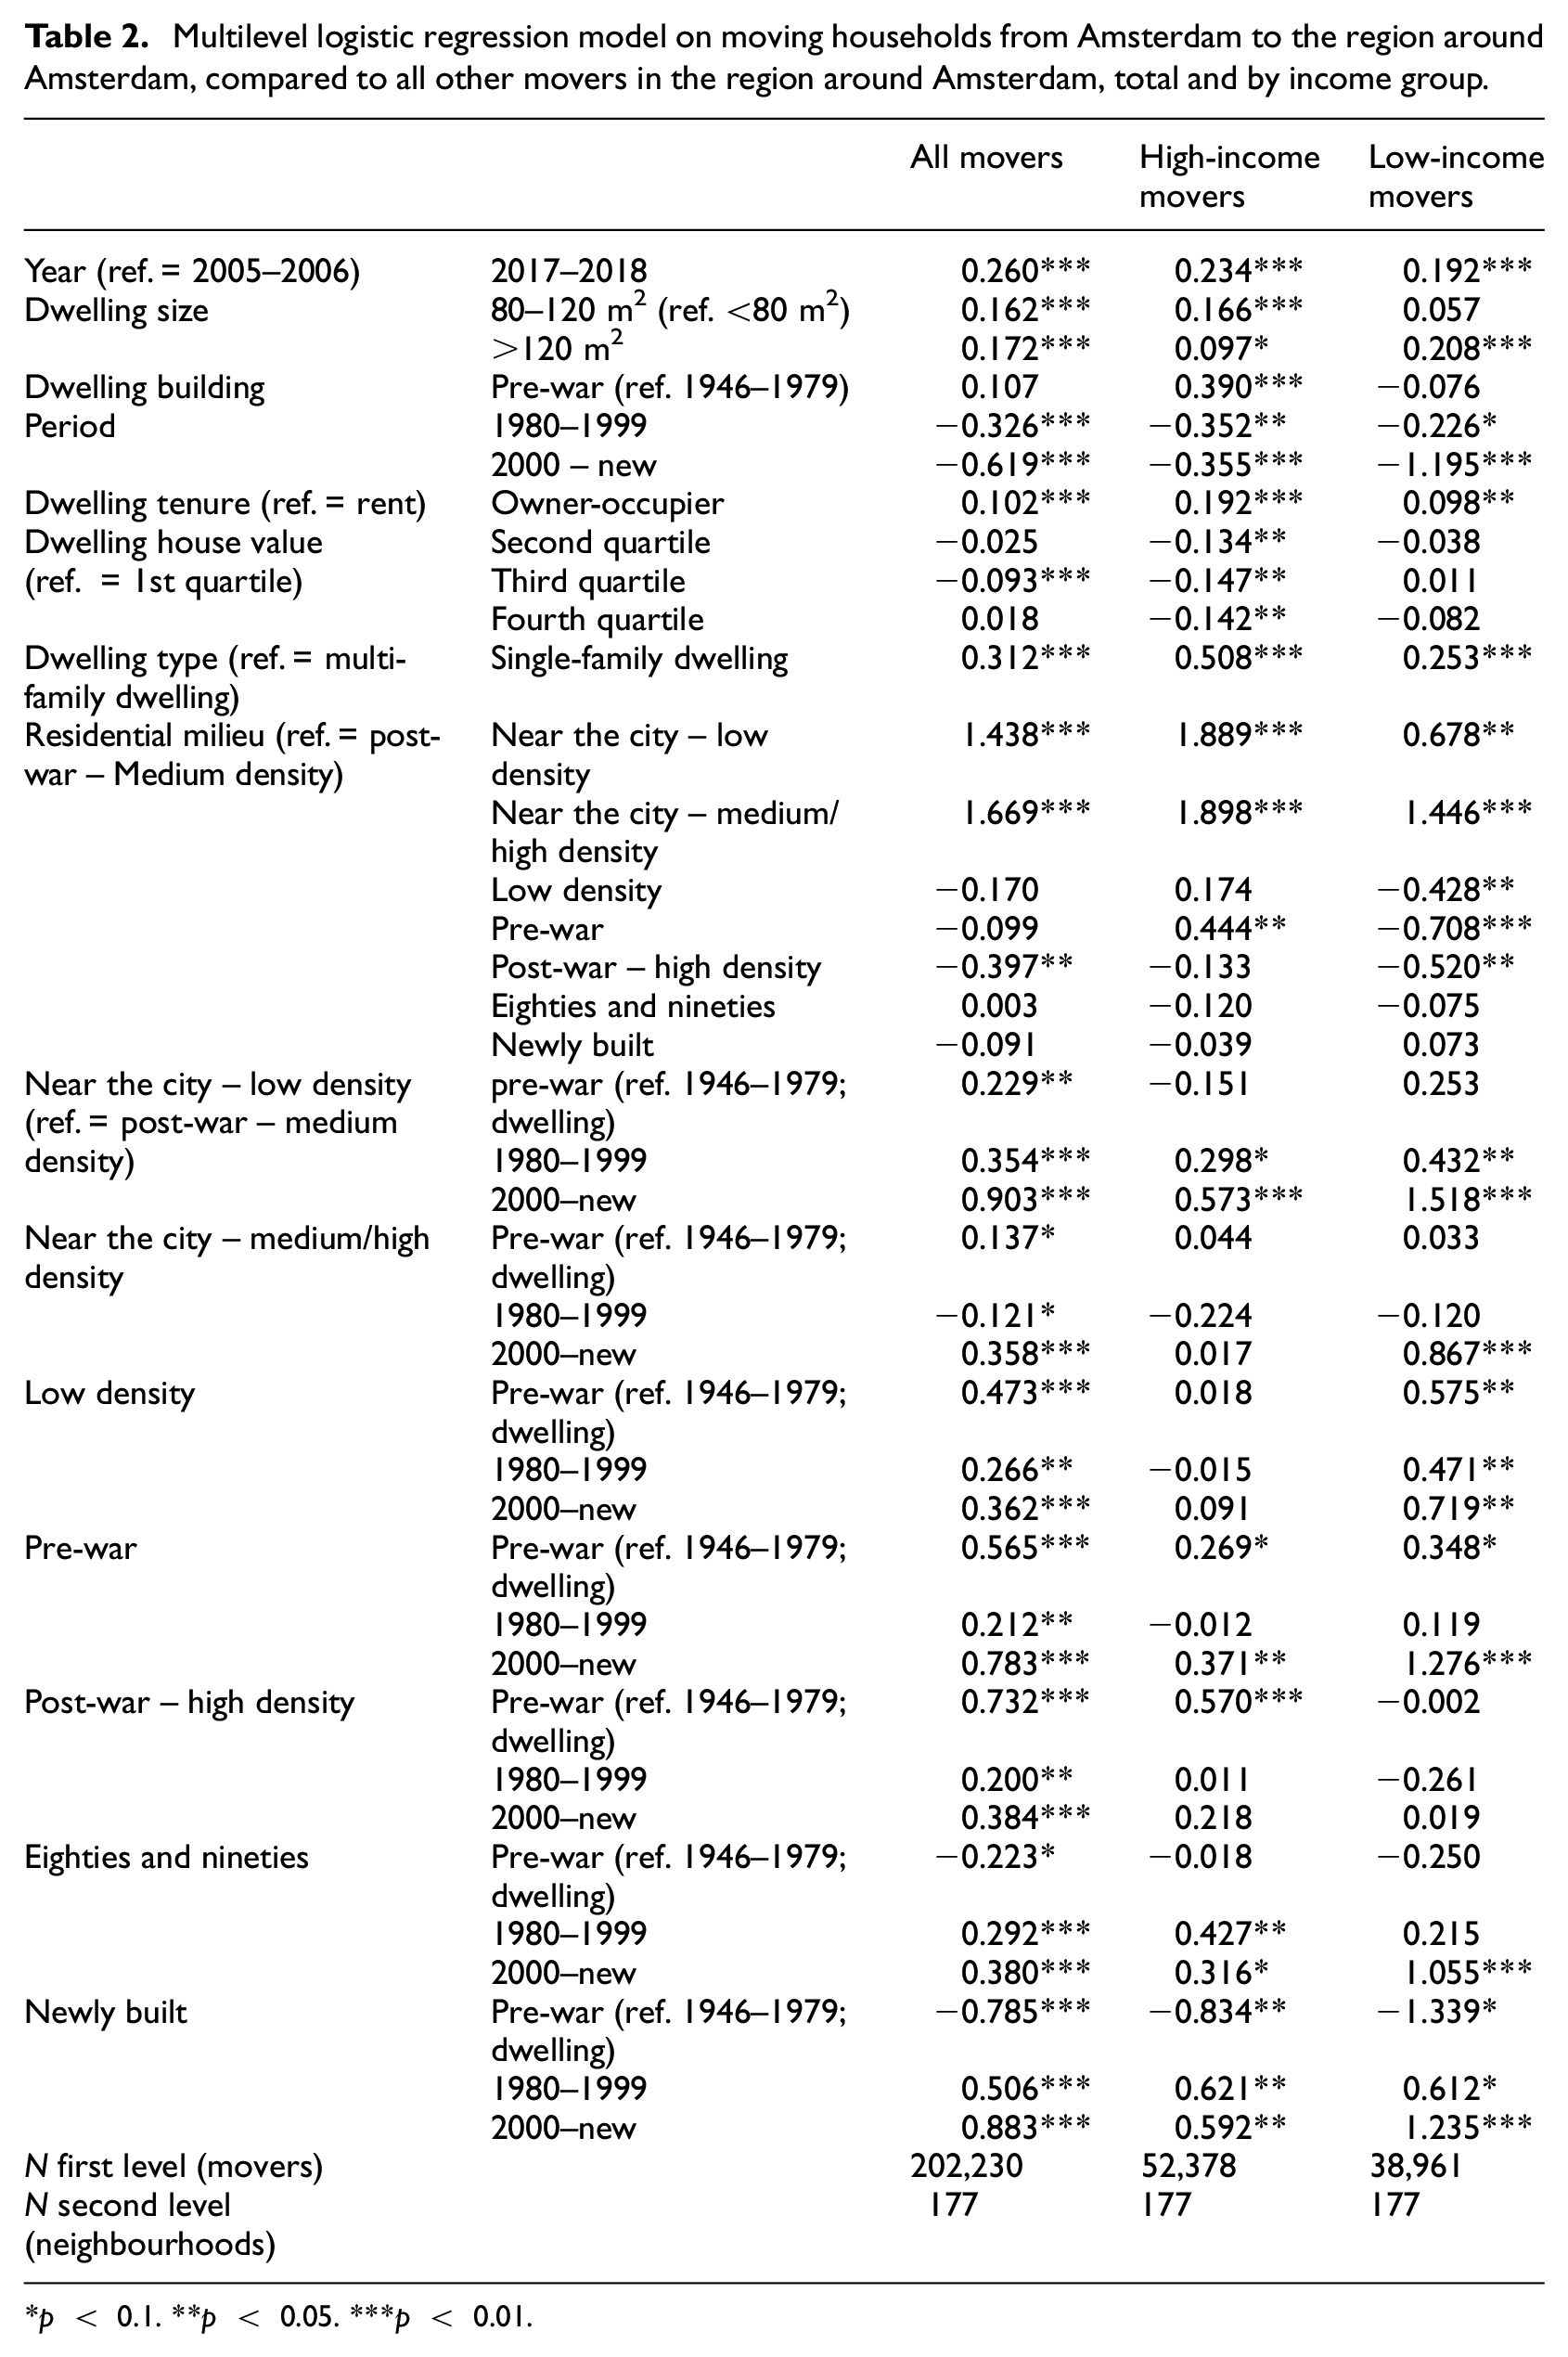
p < 0.1. **p < 0.05. ***p < 0.01.
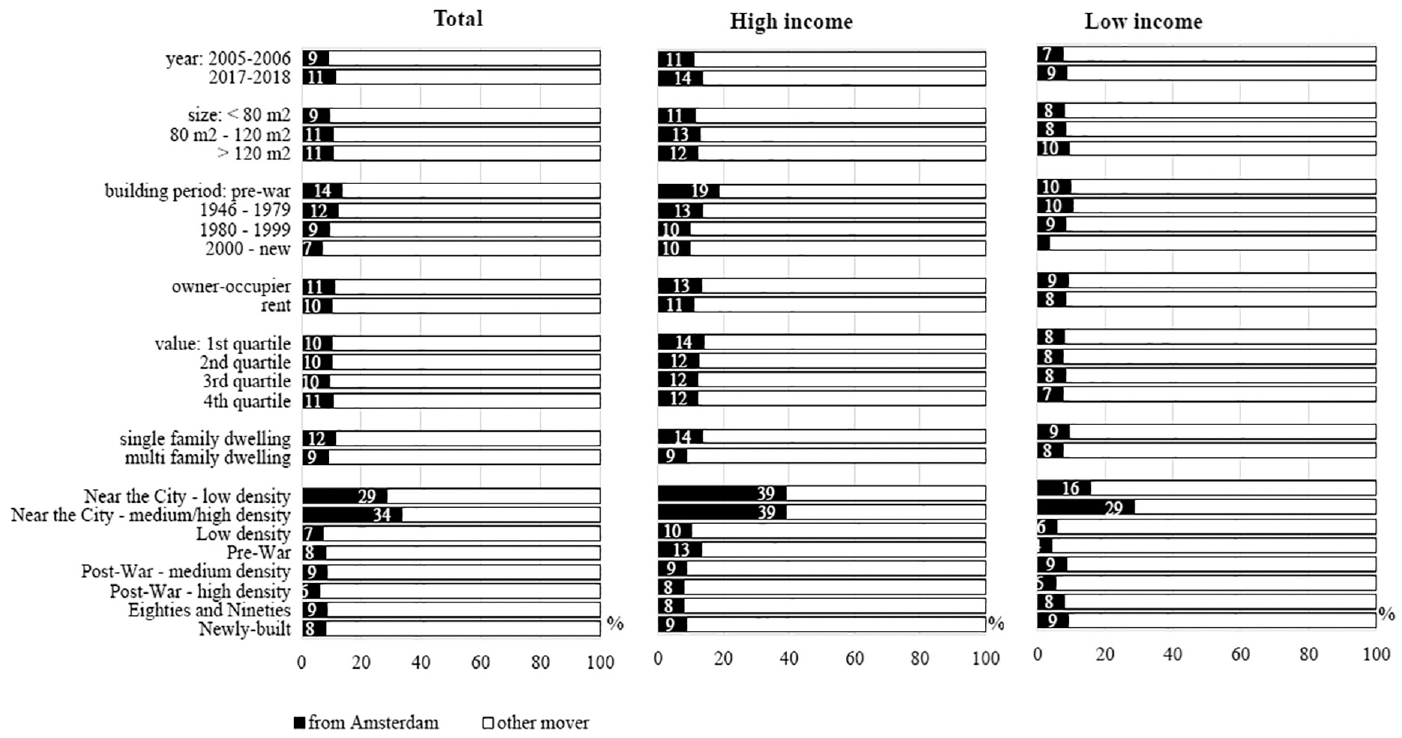
Predicted probabilities of a mover from Amsterdam compared to other movers for year, neighbourhood and dwelling type.
The probability that a mover from Amsterdam, compared to another mover, obtained a dwelling was higher in 2017–2018 than in 2005–2006. This means that movers from the city became more dominant in obtaining dwellings that became available for moving households. Movers from Amsterdam are relatively ‘suburban’ in their choice of dwelling: they more often move to larger, owner-occupied single-family dwellings compared to other movers in the metropolitan region around Amsterdam. They were less oriented on newer dwellings built after 1980. Within the neighbourhood types, they relatively often move to the neighbourhoods ‘near the city’ and less often to the ‘post-war high density’ neighbourhood type. Moving households from the city thus have a distinctive pattern compared to other moving households, both regarding the residential areas they move to and the type of dwelling.
Patterns in spillover of urban gentrification and suburbanisation of poverty
Low- and high-income groups are (in general) focused on different subsets of the housing market. A stratified analysis for low- and high-income households gives insight into the role that suburbanisation from the urban core plays for different income groups. The pattern of high-income movers from Amsterdam is comparable with the general pattern but more outspoken (Figure 3, Table 2 – high income). The increase between the two time periods of movers from the city was larger for high income movers compared to all moving households and their orientation on owner-occupied, single family dwellings was stronger. In their choice of residential area, they are clearly more urban oriented: they moved to ‘near the city’ and ‘pre-war’ neighbourhood types, and to pre-war dwellings in general. These are the same neighbourhood types that have shown a rise in house prices and/or an increase in the share of high-educated households in general. Table 1 shows that the ‘post-war – high density’ neighbourhood type is a relevant area for high-income movers from Amsterdam as well. The model in Table 2 demonstrates that the pre-war dwellings in this area are of particular interest to high-income movers from Amsterdam. This again shows the preference for the more distinctive dwellings of the pre-war period.
The total number of low-income movers decreased slightly, but, within this group, the share that came from the city increased (Figure 3, see also Table 2– low income). This suggests a slightly growing role of low-income movers from the city in suburban poverty compared to other low-income movers. Low-income movers often do not move to larger, owner-occupied single-family dwellings; however, when they do, they are more likely to be a mover from the city. The differences between low-income movers from the city and other low-income movers are small but significant. The first category more often moves to the ‘near the city’ neighbourhood types than the second category. Although neighbourhoods near the city became more expensive in general, the presence of social housing, especially in the ‘near the city – medium/high density’ neighbourhood type, kept them accessible for low-income households from the city. Compared to other low-income movers, low-income movers from the city do not particularly move to residential areas with a lower or decreasing economic status, such as the post-war neighbourhoods. Suburban poverty therefore does not necessarily coincide with a distinctive moving pattern of low-income households from the city.
Conclusion
At the beginning of the 21st century, metropolitan regions throughout the post-industrial world are economically flourishing. This not only leads to growing core cities but also to growing metropolitan regions around cities. Although suburban areas around core cities diversify and become less dependent on the core city (Keil, 2018), suburbanisation from the city is still an important factor in metropolitan growth. Suburban residential areas are socio-economically quite stable (Airgood-Obrycki, 2019), but the analysis of the dynamics of the metropolitan region around Amsterdam also demonstrates important changes. The increased migration flow from the city to the suburbs can be a source of change in these residential areas (Murphy and Allard, 2015; Teernstra, 2014). In the context of a tight housing market (reflected in the sharp rise in house prices in certain residential areas, Hochstenbach and Arundel, 2020), former city dwellers take a larger share of the available housing supply in the region around the city. Simultaneously with this trend, especially in those residential areas urban households tend to move to, more higher-educated households and higher house prices can be observed.
The relative increase in the number of urban movers into the suburbs compared to other movers can be observed for high- and to a lesser extent for low-income households. Processes of spillover of urban gentrification and suburbanisation of poverty hence may take place simultaneously. These processes take place more in the residential neighbourhoods near the city than in neighbourhoods further away. They also affect larger, owner-occupied single-family dwellings more than smaller rental apartments. This indicates a preference, for both high- and low-income households, for living near the urban core but also for more ‘suburban’ dwelling types, which are scarce in the city (Booi et al., 2021; Kadi and Musterd, 2015).
High-income households from the city are very important for the general suburbanisation pattern. These affluent former city dwellers show a distinctive geography in their preferences for dwelling types and residential areas. Not only do they more often move to the neighbourhoods near the city but also towards smaller urban centres from the pre-war period. This relates to neighbourhoods that see a rise in the share of higher-educated households and an increase in house values. As other residential areas, including the affluent ‘low density’ neighbourhood type, did not see this increase in house values, it appears that their choice for residential area can therefore be seen as deliberate (Bridge, 2003; Hochstenbach, 2017) and should be considered spillover of the urban gentrification process (Markley, 2018; Paccoud and Mace, 2018).
Low-income movers from the city also became more numerous relative to other low-income movers, indicating a slight increasing suburbanisation of poverty from the city as well. Low-income households from the city are, like high-income movers, relatively more oriented on the neighbourhoods near the city, especially the densely built areas with more (social) rental apartments. Although these more densely built areas are at greater risk of suburban poverty (Cooke and Denton, 2015), there were no signs of increasing poverty in these neighbourhoods near the city. The post-war neighbourhoods further from the city did show signs of relative impoverishment (Hedin et al., 2012), but this was not accompanied by a larger share of low-income movers from the city into these neighbourhoods. This indicates that suburban poverty in these neighbourhoods is fuelled by other mechanisms than low-income households moving out of the city (Atkinson, 2000). Further research on the influence of moving households coming from all different directions (coming from elsewhere outside the metropolitan region, or from different location within the metropolitan region) or in situ changes may expand the knowledge on mechanisms that fuel suburban poverty even more.
Metropolitan regions need a diversity of types of residential areas and a varied housing supply to cater to the needs of different households. These needs differ across income groups, but former city dwellers also have a distinctive orientation (Boterman et al., 2018). This results in diverging patterns of the changing socio-economic composition of residential areas. Especially the in-migration of high-income households from the city seems to lead to higher house prices. Other areas, where these high-income households are less inclined to move to, are often in relative decline (Hedin et al., 2012). Within tight housing markets and with the ongoing liberalisation of these markets, segregation or separation of different population categories will likely further increase (Musterd et al., 2020). This may have unwanted polarising effects. Continuation of the provision of affordable housing in all residential areas may, however, dampen these developments.
This paper has shown that the housing supply and the available residential areas are important factors in the moving behaviour of households. It also demonstrated that this differs by income and the place where movers come from. Future research may benefit from a further differentiation of the characteristics of the moving households (beyond high or low income) and where movers come from in relation to the housing supply.
This analysis shows that suburbanisation, defined as residential mobility from the core city into the region around the core city, has become increasingly relevant in times of urban growth. A growing urban core leads to increasing suburbanisation. The suburbanisation trend at the beginning of the 21st century shows both signs of spillover of urban gentrification and suburbanisation of poverty. The spillover of gentrification is most pronounced. This will have a large impact on residential areas outside the urban core and will change metropolitan residential areas significantly.
Footnotes
Acknowledgements
The author would like to thank Sako Musterd, Willem Boterman and the three anonymous referees for their valuable comments on previous drafts of this paper.
Declaration of conflicting interests
The author declared no potential conflicts of interest with respect to the research, authorship, and/or publication of this article.
Funding
The author received no financial support for the research, authorship, and/or publication of this article.