
Abstract
This article builds on the concept of ‘degrowth’ to create an experimental, measurable definition of ‘housing degrowth’, which can be applied to the 99% of households in mainstream housing. Like ‘degrowth’, housing degrowth runs against housing policy which has assumed that more housing is good. The article explores whether measurement of housing degrowth is possible with existing data, and whether any housing degrowth has occurred in the existing pro-growth housing system in England and Wales. Building on Kallis et al., ‘housing degrowth’ is defined as a reduction of the total resources going into housing production and use, without an increase in inequality or a loss of wellbeing. First, using the total number of rooms as a proxy, over 1981–2011, England and Wales experienced significant increases in embodied CO2 (from housing construction, maintenance and disposal). Only a handful of areas experienced reductions, even in resources per person, and in these, inequality increased, and some had very little space per person for the worst-off, likely to harm wellbeing. Second, estimated data on direct CO2 production by homes in use 2008–18 showed a reduction, which was equitable between income and tenure groups. However, the poorest were hit hardest by rising energy costs, likely to have depressed wellbeing, again failing the degrowth definition. In conclusion, assessing broad trends in housing degrowth is possible, even with imperfect data. Future intentional degrowth appears possible, but will need more political justification, changes to incentives and regulation, and a focus on those worst-off.
Introduction
This article builds on the existing (if multi-faceted and highly-contested) concepts and measures of ‘growth’ and ‘degrowth’, to explore the concept of ‘housing degrowth’, and to create a definition for it, with experimental measures focussing on embodied and operational carbon dioxide (CO2) production, which can be used to assess trends over time, at national and local levels.
The growth paradigm which dominates politics and business in most of the world is ‘the entrenched cognitive framework in which economic growth is constructed and conceived as necessary, good, and imperative’ (Kallis et al., 2018: 294). However, since the 1960s, the economic growth paradigm has been challenged. Economic growth, at least as currently measured principally through gross domestic product (GDP) or GDP per person (Bleys, 2012), has serious and unsustainable environmental costs. It is associated with high and in many cases increasing inequality around the world (Hills et al., 2010; OECD, 2018; Piketty, 2021). It is not always associated with rising wellbeing (De Neve et al., 2018; Easterlin, 2010; Wilkinson and Pickett, 2010), and can have the effect of impoverishing, restricting or breaking up communities (Assemblea de Barris per un Turisme Sostenible, 2019). Growth is becoming greener, although not fast enough to meet national or international targets for CO2 reduction, or to make significant differences to wellbeing and equity. Some have argued that the key GDP measure should be altered to take account of the externalities, such as pollution, and of the positive production that it does not measure, such as unpaid work (Coyle, 2015; Lepenies, 2016). Others have suggested GDP should be modified to focus on ‘green’ or ‘sustainable’ growth (Fiorino, 2018; Kallis et al., 2018), or ‘inclusive growth’, economic growth that avoids increasing inequality, or gives some benefits to the worst-off (Commission on Growth and Development, 2008; European Commission, 2010; Ianchovichina et al., 2009; OECD, 2018). Others argue that GDP needs to be replaced with a measure of national wellbeing (Krueger, 2009; Stiglitz et al., 2018) or supplemented with multiple indicators (Piketty, 2021).
Some groups have argued that because GDP and GDP growth are correlated with CO2 production and environmental damage, negative growth in GDP is not necessarily negative overall. More significant groups advocate a more holistic process of ‘degrowth’ (Cosme et al., 2017; D’Alisa et al., 2015; Kallis et al., 2018; Weiss and Cattaneo, 2017). ‘Degrowth’ is ‘an equitable downscaling of throughput, with a concomitant securing of wellbeing’ (Kallis et al., 2018: 297). Degrowth implies more than a change in resource use, it involves transformation of ways of life, governance, economics, relationships and ethics. As envisaged, degrowth is likely to be accompanied by a reduction in output and GDP, as conventionally measured, but with no loss of wellbeing. The degrowth hypothesis ‘posits that such a trajectory of social transformation is necessary, desirable, and possible’ (Kallis et al., 2018: 291). Degrowth theory is normative, but it is based on empirical assumptions, which require empirical investigation (Weiss and Cattaneo, 2017).
The article explores the relationship between housing and growth, before defining housing degrowth and exploring measures for housing degrowth. It then applies these measures to available data for England and Wales over the recent past, before discussing what can be learnt from this experiment in measurement and its results.
Housing and growth
Urban degrowth is becoming an increasingly important dimension of degrowth research and policy (as described in the Introduction to this issue). Housing is a key part of urban infrastructure, and an essential resource for individual and collective health and wellbeing. Access to minimum acceptable housing quantity and quality would be part of any assessment of living standards, equity and wellbeing in growth or degrowth. However, housing also contributes to the environmental, social and economic problems that the degrowth movement seeks to address.
Housing policy and housing studies have operated within a housing growth paradigm, nested within the growth paradigm of the wider economy (Martinez-Alier et al., 2015; Mete, 2022). There have been innovations in ‘smart growth’ and greener development. However, in much of the world, both the housing industry and housing policy aim to increase quantity, quality and financial value of housing, in total and per person. Housing growth is generally a deeply-embedded and unexamined goal, agreed upon by those representing poorly-housed or homeless people as well as those representing property magnates and the building industry. All of these groups hope to contribute to the overall standard of living and economic growth, and some hope to improve housing conditions for the worst-housed. In addition, housing growth is an element of broader economic growth. In 2019, 5% of UK GDP was linked to moving home (Office for Budget Responsibility, 2021). Rising house prices, home building and moving (particularly by mortgaged homeowners and first-time buyers), are widely seen as catalysts to further growth (Apergis, 2021). In the UK, politicians competed on the number of new homes they promised to get built for most of the 20th century (Anacker et al., 2020; Malpass and Murie, 1999), and these overt housing growth politics have returned in the 21st century, in the face of low building rates and affordability problems. In the 2019 election the UK government promised an average of 300,000 additional homes a year in England by the mid-2020s, a level of growth not achieved since the 1960s (The Conservative Party, 2019).
However, the building, use, maintenance and demolition of homes are major contributors to the production of CO2 that leads to climate change, as well as to habitat and biodiversity loss (Lavagna et al., 2019). In 2018, the average home in England produced 4.4 tonnes of CO2 for heating, hot water and the operation of appliances (MHCLG, 2021). Even the production of a home which is ‘zero carbon’ in use has an impact through the CO2 embodied in the consumption and transportation of materials (and workers) in construction, maintenance and eventual demolition. The actual impact of a ‘low carbon’ home in use will be affected by the ‘design-construction gap’, ‘construction-performance gap’ and ‘rebound’ effects from residents using more energy in reaction to greater efficiency and lower costs (Committee on Climate Change, 2019; Pretlove and Kade, 2016; Quilgars et al., 2016). Housing growth has also been implicated in failing to much improve wellbeing or the conditions for the worst-off, if at all. For example, it took till 1991 for the most crowded 10th of the population in England and Wales to gain the amount of space per person that the average person had in 1911 (Tunstall, 2015).
Housing degrowth
Linked to ‘degrowth’ overall, we can imagine a concept of ‘housing degrowth’, which, if achieved, could contribute to wider degrowth. Like ‘degrowth’ overall, housing degrowth runs against most of the history of housing policy and housing scholarship in many countries. They have assumed that more housing in total and per person was good and should be a goal, and that it could be achieved through mainstream ownership and building types. Assuming conventional use of materials and energy in construction and use, housing growth would also mean CO2 growth.
To date, the concept of ‘degrowth’per se has not been discussed extensively in literature on housing. However, there has been substantial concern about the impact of the production and use of housing on the environment and about the equity and wellbeing outcomes of current mainstream housing systems. For example, there has been apprehension regarding ‘overconsumption’ of housing, both in the context of finite natural resources, and in the context of inequalities and underconsumption in the form of homelessness and overcrowding. For example, in the 2000s, US research tracked the development of so-called ‘houses on steroids’, very large homes seen as symbols of inequality (Dwyer, 2009). In many nations there has been concern about empty homes and second homes, in the context of housing shortages and affordability problems, and many nations use incentives to improve usage of the housing stock. The ‘tiny houses’ movement which promotes small, self-built, innovatively designed or sited homes, presents a challenge to housing growth, and to the rising expectations and regulatory standards which lead to it (Shearer and Burton, 2021; Stefánsdóttir and Xue, 2018). There have also been significant efforts to decouple housing growth from resource and energy use, through technological development and efficiency in construction and use.
Some scholars and activists argued for regulation of ‘excess’ consumption, and some have proposed caps on maximum space for homes or residents (Liegey and Nelson, 2020; Stefánsdóttir and Xue, 2018). For example, the Swiss NGO o500 argues for a space budget of 20 m2 of (good quality) private living space per person, half the current average in the UK (o500, n.d.). Some have proposed meeting housing need and improving equity and wellbeing sustainably, through redistribution of housing space rather than new building (Dorling, 2014). Kallis said, ‘Stop the construction of new houses, [instead] rehabilitating the existing housing stock and facilitating the full occupation of houses’ (Kallis, 2015). Few administrations have approached these ideas, but in Barcelona, the city council recognised the demands of a community group for ‘tourism degrowth’, on the grounds that tourist demand for accommodation was harming the city (Assemblea de Barris per un Turisme Sostenible, 2019; Martínez Alonso, 2022).
Housing and the built environment are considered in the literature on degrowth, although one review found that only four of 91 degrowth articles covered housing (Weiss and Cattaneo, 2017). There is growing discussion of how degrowth could be achieved through reform, for example: how planning could be used to promote degrowth (Xue and Kębłowski, 2022), although in practice planning is usually a ‘system-maintainer’ (Xue, 2022: 418). Alexander and Gleeson (2019) explored what degrowth would mean for all of world suburbia. However, authors exploring degrowth and housing have tended to focus on alternatives to existing mainstream housing, involving innovative design, technology, ownership, governance and finance (Nelson and Schneider, 2018). There are numerous case studies of innovative models such as co-housing, co-ownership, self-build, community land trusts, eco-communities, self-sufficiency, community gardening, squatting, rent or mortgage strikes and occupations of foreclosed buildings, and how they could contribute to degrowth (Cucca and Friesenecker, 2022; D’Alisa et al., 2015; Fournier, 2008; Nelson and Schneider, 2018; Weiss and Cattaneo, 2017). One review found that co-housing, a form that as yet provides for fewer than 1000 households in the UK (cohousing.org.uk), had received more research attention than projects affecting the hundreds of millions of existing homes, or larger-scale new development (Cosme et al., 2017). However, the literature recognised that these forms face numerous financial, legal and cultural barriers in order to form and expand, and are not accessible to the whole population, due to the money, skills, time and tenacity that this innovation often requires.
Aims
Overall, there is room for more research on how degrowth in housing could be defined and measured, and for empirical evidence on whether it has been or can be achieved (Kaika et al, 2023). Concepts and measures which can apply to existing housing, mostly with conventional ownership, governance and construction, will be particularly valuable, as this is where most people live and where the biggest effect on total growth or degrowth is likely to be generated over the short- and medium-term.
This paper will explore the idea of ‘housing degrowth’, and empirical evidence on whether it is ‘desirable, and possible’ (Kallis et al., 2018: 291). It aims to answer the following questions:
How can ‘housing degrowth’ be defined?
What measures for housing degrowth are available?
Using these measures, are there any national or local examples of housing degrowth in the recent past?
What can be learnt from this experiment in measurement and its results?
The UK, comprised of England, Wales, Scotland and Northern Ireland, is used as a case study. The UK is a high-income state, a G7 and OECD member. In 2018/19, 91% of households in England were satisfied with their homes, and 83% had homes which were ‘decent’ (wind and weathertight, with reasonably modern facilities and no serious health and safety risks). However, 68% of homes were 40 years old or more (MHCLG, 2021). In 2018 the average English home provided 37 m2 internal floorspace per person, compared to 37 m2 in France, 35 m2 in Germany and 61 m2 in the USA (MHCLG, 2018). About 37% of households in England had at least one more bedroom than the official minimum ‘bedroom standard’, although 3% were overcrowded (MHCLG, 2021). The UK had relatively high income inequality (Piketty, 2021). However, the gaps between average housing conditions and those for people on lower incomes was smaller than in many other European countries (Eurostat, 2020).
The UK provides a challenging context for housing degrowth: it has significant population growth (Figure 1); national and local policies encourage home building; its housing stock is relatively old; and there is limited support for alternative forms of housing or for improved home energy efficiency. However, this makes it comparable to many other nations. In addition, even where an area lacks substantial housing degrowth policy or large-scale community initiatives, there is still value in assessing whether: any housing degrowth has occurred; to test definitions and measures; to establish a baseline; to assess how far things have to change to achieve degrowth; and to inform the development of future policies and actions.
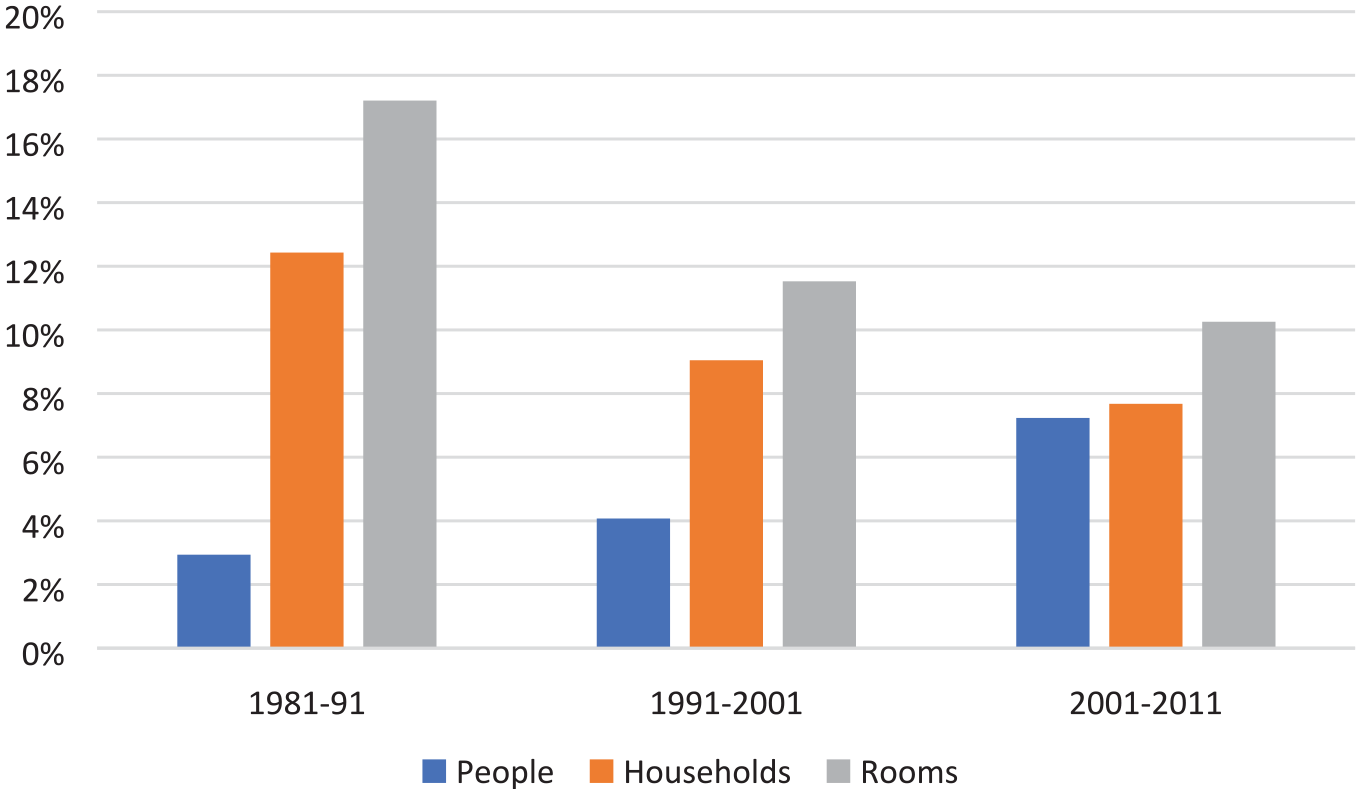
Rate of growth in number of people, households and rooms, England and Wales, 1981–2011.
Defining housing degrowth
Building on Kallis et al. (2018), ‘housing degrowth’ is defined here as reduction of the total resources going into housing production and use, without an increase in inequality or a loss of wellbeing (p. 297). Housing degrowth could be measured by the proportion of people or households living in homes with finance, governance, community, design and environmental impact providing alternatives to those produced through mainstream housing organisations, and outside mainstream forms of growth. In 2022, 196,000 UK households lived in homes provided by a range of groups and organisations belonging to the Confederation of Cooperative Housing (www.cch.coop), which would fit this definition.
However, these alternatives made up just 1% of the total. The remaining 99% of households were in more conventional owned or rented homes. As an experiment in defining and measuring housing degrowth, this paper focuses on the housing of the 99%. It also focusses on environmental rather than governance or social aspects of degrowth. Within the environmental dimension of degrowth, it focusses on embodied and operational CO2 production, rather than wider measures of resource use such as material throughput. In these terms, building on Kallis et al. (2018), housing degrowth is defined as: a reduction in the total resources used in the construction and use of housing, without increasing inequality, or reducing wellbeing. Equity in degrowth is defined as the worst-off not losing out in either absolute or relative terms. The maintenance of wellbeing is not tested directly, but is defined here as degrowth avoiding any very low consumption of housing or very high housing costs, especially for the worst-off.
Operationalising this definition requires measures and data on resources used in housing over time, how the outputs are distributed across the population, and evidence on implications for wellbeing. The ideal measure would include: (1) a comprehensive account of embodied resources and energy used in initial construction, maintenance and eventual demolition of homes (life cycle analysis); (2) a direct assessment of operational resources and energy used throughout the building’s life; and (3) data on effects for different parts of the population, and on wellbeing. In practice, these data are not available. Instead, this paper assesses housing degrowth through measures for which data are available, which are plausible although imperfect (and which could be adapted as further data emerges). In these terms, housing degrowth is:
(1) A reduction in total embodied CO2 production, in the construction, maintenance and eventual removal of housing, measured though the proxy of housing size as measured by the number of rooms;
(2) A reduction in total operational CO2 production in home use per year, measured through a proxy modelled on home characteristics;
(3) Equity in degrowth, defined here as the worst-off and social renters not losing out in either absolute or relative terms;
(4) Wellbeing in degrowth, defined here as the avoidance of any very low consumption of housing or very high housing costs, especially for the worst-off and social renters.
Embodied CO2 is a one-off cost, and embodied CO2 per year reduces as the life of the home extends (Stevenson, 2019), while demolition necessarily means embodied CO2 is lost. In contrast, operational CO2 adds up year-on-year through the lifetime of the home, although retrofitting or changed usage could reduce it. In theory, careful demolition of inefficient older homes and replacement with new, more efficient homes can contribute to net reductions in combined, embodied and operational CO2 over time in some cases: when and how this is true is an empirical question (Ding and Ying, 2019; Kayaçetin and Tanyer, 2020; UCL Engineering, n.d.). CO2 production embodied in initial construction, maintenance and eventual disposal of a home is likely to outweigh the CO2 produced in a year’s use. However, the multiple is lower than a usual expected home lifetime of multiple decades. Lavagna et al. (2019: 260) said that when comparing outputs per year, ‘in old buildings the ratio of impacts between the production of materials and the impact of energy consumption on the use phase is 1:10’. This means that for older buildings in use for more than 10 years, which make up the vast majority of UK homes, operational rather than embodied CO2 will be more significant for total CO2 output and total contribution to degrowth.
Degrowth is concerned with total resources, because that is what is of significance for the planet. If there is population increase, as in the UK, housing degrowth would require extra reductions in resource and energy use per person. However, in this analysis, resources per person are sometimes also reported, to show changes in efficiency net of population growth.
The paper examines the period since 1981, selected pragmatically because of the availability of data for the chosen measures. Over this time, there were no UK policies to encourage reductions in embodied CO2 in new or existing homes, or even to encourage monitoring (Committee on Climate Change, 2019; Moncaster and Symons, 2013; UCL Engineering, n.d.). However, there was policy to reduce energy use and CO2 production in homes, through improvements in electricity generation, some encouragement of demand reduction, and energy efficiency activities. UK building regulations, which regulate construction, have been promoting energy efficiency since 1965, and since then, ‘constructional changes have been caused primarily by amendments to building regulations for the conservation of fuel and power’ (BRE, 2019: 3). Energy efficiency was promoted by EU regulation during UK membership, and through UK government incentives and owner and social landlord interests. The aim was to reduce costs to residents and fuel poverty, and only latterly to reduce CO2 emissions (e.g. Mohan et al., 2018). There were also some small-scale community initiatives to create housing alternatives. Thus, this experiment in measurement is not an assessment of the impact of comprehensive housing degrowth policy, but of the results of ‘business as usual’ housing growth policy with some adaptations. The aim is to describe and explore this legacy and more recent trends, which any more substantial future degrowth policy and activity will have to address.
Measuring housing degrowth
Measuring a proxy for embodied CO2
In the UK, ‘analysis of whole life embodied energy and carbon of buildings… is considerably restricted by the lack of data’ (Moncaster and Symons, 2013: 522). The position has not changed significantly over the 2010s. Evidence directly covering embodied resources, energy or CO2 in housing exists for case studies, but there is no national data or good evidence on different types of homes (UCL Engineering, n.d.). Despite the introduction of a standard European methodology in 2013, measurements of embodied CO2 in housing vary widely according to the measures used, and between individual homes (Simonen et al., 2017). However, available evidence suggests that embodied CO2 can be reduced by ensuring long-term demand for homes, avoiding sites that require high CO2 use in foundations and for transport, and by using low impact material such as wood over concrete (Minunno et al., 2021). Multi-family (multi-storey) blocks of flats can have twice the embodied carbon per m2 than houses (Simonen et al., 2017). Newer homes tend to have less embodied resource use (Lavagna et al., 2019).
However, other things being equal, larger homes have higher embodied CO2, and home size, usually measured in total internal floor space, has been recognised as a proxy for embodied CO2 (Nelson, 2018). The embodied energy impact of increasing home size in the US has outweighed improvements in energy efficiency (Clune et al., 2012). The number of homes cannot fully capture the quantity of housing available overall (Gleeson, 2021), or its embodied CO2. It is assumed here that the amount of housing in numbers of rooms can provide an adequate proxy for the materials and energy used in construction, particularly over shorter time periods when construction materials and methods changed little. This assumption can be tested as further data becomes available.
Housing space has long been seen by housing policymakers, campaigners and academics as of value in its own right, parallel to household income. Low absolute consumption of space per person has negative effects on health and wellbeing, for example through the transmission of communicable disease and through stress (Marmot et al., 2020; WHO, 2018). For over a century, policymakers and NGOs have campaigned against ‘overcrowding’ (officially-defined ‘underconsumption’ of housing) (Malpass and Murie, 1999; Tunstall, 2015). COVID-19 has given minimum housing space renewed salience, and World Health Organisation, Public Health England and the UK government’s scientific advisors all recommended that vulnerable and infected people should have their own bedroom (PHE, 2021; WHO, 2020). However, quarantine bedrooms do not need to be provided in private homes, and it seems likely that that the wellbeing benefits of more space reach a threshold, as has been found for income, and that, as with income (Atkinson, 1970; Hills et al., 2010; Piketty, 2021), space relative to the rest of society may be as important as absolute space (Tunstall, 2015). In addition, embodied CO2 effects of housing space should be recognised and measured, in any case.
Assessing trends in the distribution of housing space alongside trends in housing growth and at sub-national level requires longitudinal and disaggregatable data. While the Survey of English Housing assesses internal floorspace in occupied homes, this is only available from 1996 (Gleeson, 2021; MHCLG, 2018). The census of population provides data for England and Wales on housing space in terms of the number of rooms, and the distribution of rooms between people, for each decade 1911–2011 and for national and local levels and tenures. Data from the 2021 census are not yet available. Data on ‘rooms’ include bedrooms, living rooms and kitchens big enough to eat in. These data can also be used to assess changes in inequality.
Measuring estimated operational CO2 production
Numerous housing energy-use assessment tools have been developed around the world, and their use has been encouraged by government and international regulators (Stevenson, 2019). In the UK, since 2008 all homes have been required to have an Environmental Impact Rating (EIR) to estimate the CO2 produced through energy consumed for hot water, space heating and cooling. EIR ratings are modelled for individual homes through a formula based on the age of building, building methods, regulations in use at the time of construction, and features such as wall, floor and loft insulation and double glazing, a certain level of thermal comfort and services. (The Energy Performance Certificate required across the EU when a home is sold or rented across the is based on the same data).
EIRs are estimates, and do not reflect variations between buildings of the same type, performance in use, or the impact of residents (Committee on Climate Change, 2019). Several small studies have found the modelling varies between assessors and has a large margin of error (Liddiard et al., 2021: 349; Stevenson, 2019). Newer homes generally have lower EIR, but EIR does not take into account recent improvements in the sustainability of electricity production, or homes which generate their own power. In 2018, an average home in England built before 1919 used 314 kWh/m2, while an average home built after 1990 used only 192 kWh/m2, or 39% less per m2 (MHCLG, 2021). It has been argued that EIR should be revised or replaced with real rather than modelled data (Committee on Climate Change, 2019). Again, results based on EIR can be tested or replaced as improved data becomes available.
Measuring equity and wellbeing
The equity of changes in CO2 production in housing construction, measured through the proxy of housing space, will be assessed in two ways. First, the paper will examine the absolute and relative change for the ‘worst-off’ in terms of space, in this case the lowest 10th percentile of the distribution of housing space. Second, it will examine the absolute and relative change for those in social housing tenure, which on average house those most disadvantaged in terms of income and other dimensions (Tunstall, 2021) The equity of changes in CO2 production of housing in use, measured through the EIR, will be assessed by examining the absolute and relative change by income quintile, with the lowest quintile roughly equivalent to the 10th percentile of the distribution. Again, the absolute and relative changes for social housing tenants will also be considered.
There are growing sources of direct data on people’s wellbeing. In the UK, national data on wellbeing have been collected since 2011, showing slight increases in average life satisfaction, life being worthwhile, happiness and reductions in anxiety from 2011 to 2019, with some reverses during the pandemic (ONS, 2022). These data cannot yet be linked to measures for embodied or operational CO2 in homes. Perhaps surprisingly, to date, the aspect of housing most associated with wellbeing in cross-sectional surveys appears to be affordability, followed by tenure, while space and overcrowding appear to be relatively unimportant (Department of Communities and Local Government, 2016; Peasgood et al., 2017). Nonetheless, wellbeing effects of any changes in embodied CO2 will be assessed by considering changes in the absolute space per person of the worst housed, as well as for social tenants. The wellbeing effects of any changes in operational CO2 changes will be assessed indirectly, by considering the cost of energy, with a focus on costs for the lowest income quintile.
Results
This section applies the measures of housing growth and degrowth to assess change over recent years in embodied CO2 and CO2 in use in housing, in total and per person, and trends in equity and wellbeing, looking at national and local level.
Housing growth or degrowth measured in CO2 embodied in housing in England and Wales 1981–2011, via the proxy of housing space
National level
Over the 20th century, the numbers of people, households, homes and rooms in England and Wales and the amount of embodied CO2 grew in every decade (Figure 1).
Over 1981–2011 as a whole, England and Wales experienced a 39% increase in the number of rooms, failing to meet the first condition for housing degrowth. There was a 15% increase in the population. The median number of rooms per person increased from 1.5 to 2.0, or by 33%, also failing to meet a less demanding definition based on housing space per person. While mean and median housing space per person grew in each decade 1981–2011, the rates of growth in total housing space and mean space per person reduced, getting closer to degrowth.
Meanwhile, some people had low absolute space throughout 1981–2011, and inequality in housing space increased. The worst-housed 10th percentile in England and Wales had one room per person in 1981 and the same in 2011, despite overall housing growth, so they made no absolute gains, and fell further behind in relative terms. It is not possible to calculate the median space per person by tenure for 1981, but in 2011 social renters had a median 2.0 rooms per person, the same as the overall median, which suggests that change in space distribution was unlikely to have had an inequitable effect by tenure.
Regional level
Perhaps there are some examples of housing degrowth in the proxy for embodied CO2 among the 10 geographical regions of England. There were strong regional variations in population change 1981–2011, and in both the North East and North West, population was lower in 2011 than in 1981. Nonetheless, the number of rooms grew in every region (Figure 2).
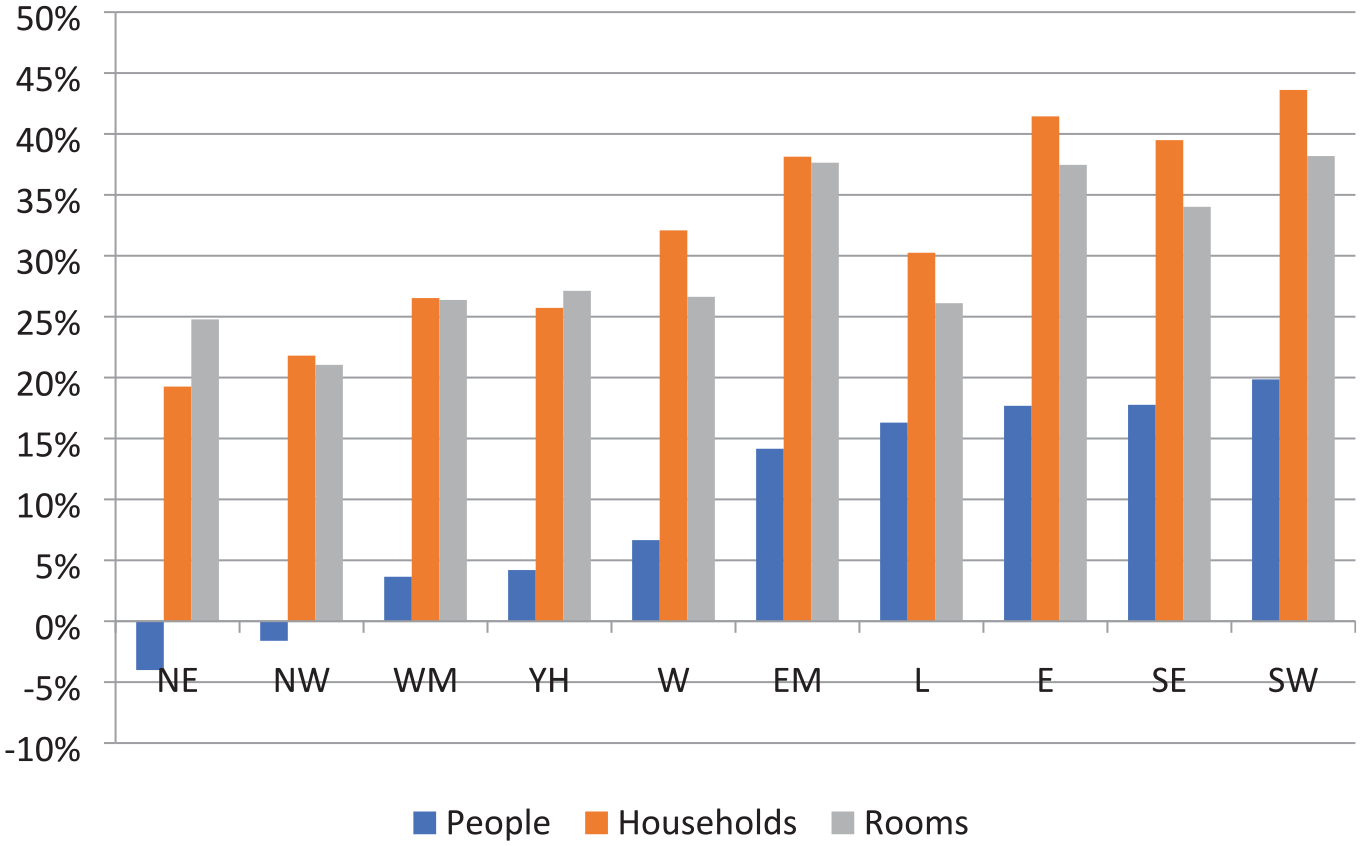
Rates of growth in numbers of people, households and rooms, UK regions, 1981–2011.
Turning to the less demanding definition of housing space per person, over 1981–2011, median housing space per person increased in every region except London, in most cases from 1.5 to 2.0 rooms per person (or by 33%). In London median space was at 1.5 rooms per person in 1981 and 1991, at 1.67 in 2001, and then down to 1.5 again in 2011. However, in London, this went alongside regressive change in distribution of housing space, so fails the equity criterion. Only those at the 80th and 90th (highest) percentiles had significant growth, each gaining 0.50 rooms per person. The worst housed (those at the 10th percentile) experienced a reduction from 1.0 to 0.83 rooms per person 1981–2011. The reduction from already very low absolute levels of housing space per person seems likely to have reduced wellbeing for the affected people, meaning this potential ‘degrowth’ would fail the wellbeing criterion. Thus, in per person terms, even the exceptional London region does not provide an example of housing degrowth in the proxy for embodied CO2.
Local authority level
England and Wales have just over 300 local authorities. They are the key planning agencies in the UK, responsible for influencing and approving housing development, and potentially for promoting housing degrowth (Xue, 2022). In 2011 they had populations averaging 200,000 and ranging from 2000 to 1,110,000. Over 1981–2011, no local authority experienced a reduction in the total number of rooms, even though many experienced loss of population. The area with the lowest growth in number of rooms in total was Blaenau Gwent in Wales. In 1981 it was a coal mining community, but by 2011 had no mines or miners. Over 1981–2011 population fell by 7%, but even here the number of rooms – and embodied CO2– grew by 14%.
Using the less demanding definition of housing space per person, over 1981–2011, 339 or 97% of the total local authorities experienced an increase in median space per person. In 15 local authorities, including 11 in London and four in the South East around London, there was no change in median space per person 1981–2011. Two suburban local authorities in London, Newham and Waltham Forest, making up less than 1% of the total, actually experienced a decrease in median space per person, one element of the definition of housing degrowth. However, this change was inequitable. In both areas, those at the 10th percentile (the worst housed) experienced similar absolute and greater relative losses in housing space per person than the median. Their already very low absolute levels of housing space reduced 1981–2011, for example in Newham from 0.8 to 0.7 rooms per person. Again, this seems likely to have reduced wellbeing for the affected residents. Thus, even these exceptional local authorities cannot be considered as examples of ‘housing degrowth’.
Housing degrowth in terms of operational CO2 production at national level in England 2008–18
Apart from case studies, operational CO2 production can only be measured at national level, for England, and for the period 2008–18. In 2008, the average EIR rating for a home in England (including unoccupied homes) was equivalent to energy use of 391.2 kWh/m2. Over 2008–18, the average internal floor space of a home in England grew from 91 m2 to 94 m2, or by 3%. The number of homes grew from 22.2 m to 24.2 m, an increase of 9% (MHCLG, 2021). While the average size of homes and the total number of homes increased 2008–18, this was not enough to cancel out the effect of improved energy efficiency on CO2 in use. The average EIR rating for a home in England (including unoccupied homes) fell, through new building and improvement, from the equivalent to energy use of 391.2–259.0 kWh/m2, a reduction of 34% (MHCLG, 2021). This amounted to a reduction in emissions from 6.3 to 4.4 tonnes of CO2 per year from the average size home, a smaller reduction of 27% (because the average size of homes increased slightly), but still a substantial one (MHCLG, 2021). Using the EIR, and assuming even homes that are empty use energy (perhaps later in the year), over 2008–18 the total EIR-measured energy use of homes fell from 790,000 m to 589,000 kWh and the total CO2 production fell from 140 to 107 m tonnes, This was a reduction of 26% in both cases, despite growth in the number and average size of homes (Figure 1). Assuming the validity and accuracy of EIR did not vary over time (which is not certain), on this measure, one element of housing degrowth in terms of total operational CO2 production was achieved nationwide.
In both 2008 and 2018, poorer households had slightly higher typical home energy use per square metre than average, but as households on higher incomes tended to have larger homes, they had higher average total energy costs and greater CO2 emissions from their homes (MHCLG, 2021). In 2008, households in the lowest income quintile produced 5.6 tonnes of CO2 per year and those in the highest 7.6 tonnes. By 2018, estimated CO2 production had reduced for all income groups. The highest income quintile made a bigger absolute contribution to the change, but the relative contributions were the same, at 40% reduction for the lowest income quintile and 41% for the highest (see Figure 3). In both 2008 and 2018, social renting households had lower typical home energy use per square metre, lower total energy costs and lower CO2 emissions from their homes than average. Over 2008–18, they experienced small absolute changes other than tenures, but similar proportionate ones. Thus, the substantial reduction in operational CO2 production from homes in England 2008–18 found from the available proxy was equitable, which is remarkable.
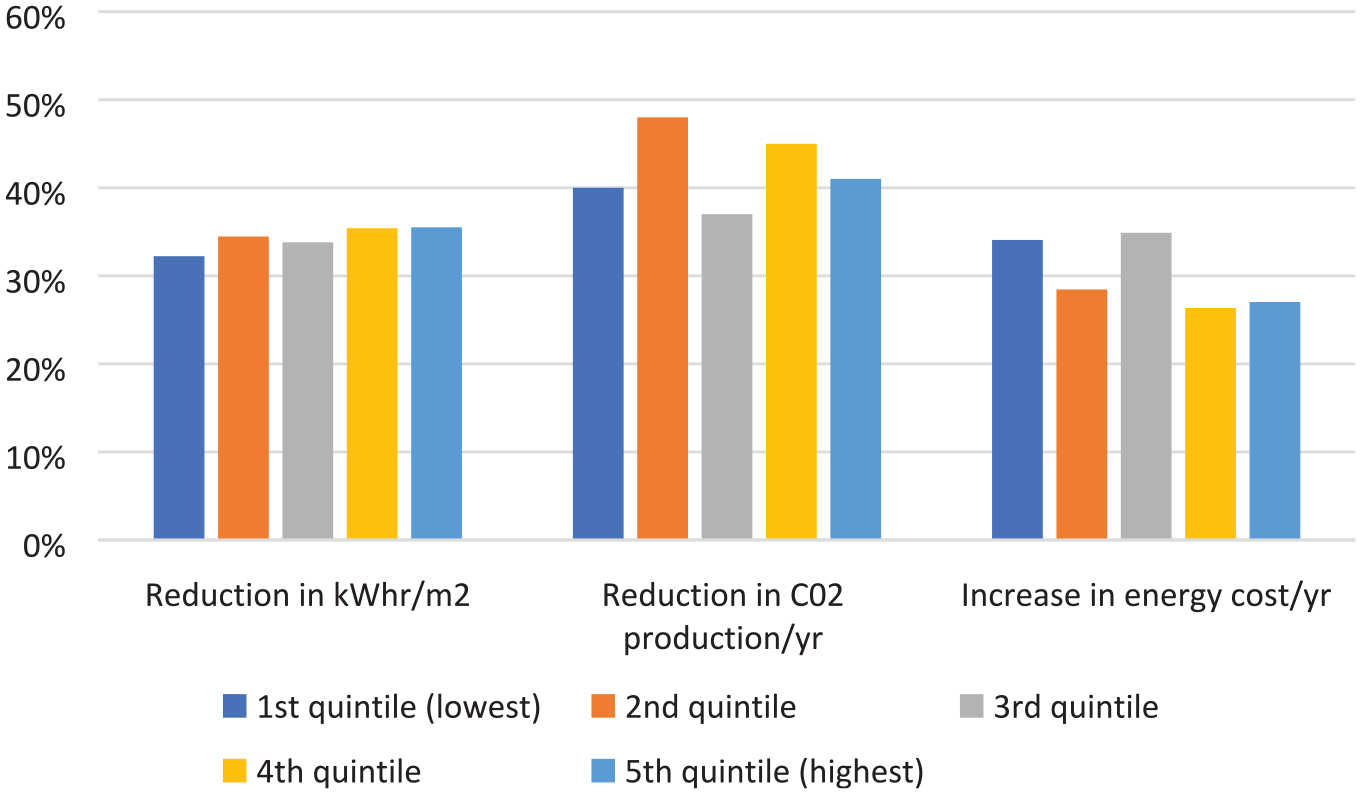
Relative change in annual household energy use per square metre, real terms energy cost, and CO2 use, by household income quintile, England, 2008–18.
In addition to arguments for housing degrowth, one of the rationales for improving energy efficiency in housing is to reduce bills for residents, especially those on low incomes. However, over 2008–18, the cost of energy increased significantly. In 2008, the average EIR rating meant an average home energy cost of £776 (€892)/year, but in 2018 it was £1007 (€1158)/year (at 2020 prices and exchange rates), a 30% increase. This was partly due to change in world prices, and partly to UK regulatory requirements placed on suppliers, which included measures to reduce CO2 production, including through home energy efficiency. Those in the lowest income quintile experienced slightly lower absolute increases in costs than those in the highest quintile (£240 compared to £251). However, these were significant absolute changes, and the lowest income quintile also experienced greater relative real-terms increases, of 34% compared to 27% (Figure 3).
Similarly, social renters experienced rising costs, and although the absolute increases were smaller, they experienced the same percentage increase as owners (MHCLG, 2021). This suggests that, due to rising energy costs, the marked and equitable decrease in CO2 outputs in home use was likely to have wellbeing costs for those on low incomes and in social renting, including fuel poverty and ‘heat or eat’ dilemmas (Rodriguez-Alvarez et al., 2019). Thus, in the context of rising energy costs, the reduction in CO2 outputs 2008–18 cannot be considered ‘housing degrowth’. This result is particularly concerning given the unprecedented home energy cost rises taking place across the world in 2022. However, it should be noted that if there had not been a marked decrease in home energy use 2008–18, the impact on those on lowest incomes and social renters would have been worse without the substantial and equitable reductions in energy use.
Discussion
This paper has made use of imperfect measures of CO2 embodied in home construction and in use, but the extent to which they are adequate proxies remains to be tested and proven. However, using the proxy of rooms, the CO2 embodied in home construction in England and Wales increased by 39% 1981–2011. There were no examples, even at local level, where there was no growth in the total number of rooms. Even when the weaker criterion of space per person was considered, there were very few examples of reductions and none that were equitable and maintained wellbeing. In some senses, this not a surprising result, but it underlines the challenge posed by the idea of housing degrowth. The relationship between new housing space construction and embodied resource use has changed significantly over time, with newer spaces involving less embodied CO2 than past ones (Lavagna et al., 2019). However, efficiencies in construction would have had to increase by a very substantial 39% to keep up with construction rates in England 1981–2011, and only a reduction in embodied CO2 in new rooms to zero would mean that total embodied CO2 had not increased.
However, assuming normal home lifespans of multiple decades, it is operational CO2 that is likely to make the greatest contribution to total ‘cradle to grave’ CO2 output from homes. In contrast to the growth in embodied CO2 in housing over time, there was a 30% reduction in average estimated operational CO2 from heating and powering homes in England 2008–18. Despite an increase of 8% in the number of homes (Figure 1), the total operational CO2 produced by all homes in England and Wales reduced by 24%. The operational CO2 per room or per quantity of embodied CO2 will have reduced further. Newer homes generally have lower EIR (MHCLG, 2021), so new homes and new rooms produced 1981–2011 are likely to have contributed to reduced CO2 average production in use for each home, and this trend is likely to continue.
Over the decade 2001–11, the number of rooms in England and Wales (and presumably the embodied CO2 in those rooms) grew by 10% (Figure 1), while the total operational CO2 produced by all homes in England and Wales reduced by 24%. The combined effect of recent increases in total embodied CO2 and reductions in total operational CO2 will be a reduction in CO2, assuming the ratio between embodied CO2 and CO2 in use for these new rooms was 1:2 or more. While the average size of homes and the total number of homes in England increased 2008–18, this was unlikely to have been enough to cancel out improved energy efficiency. This presents a different picture to case study evidence of where the impact of new energy efficient homes was cancelled out by their larger size, as in the US (Clune et al., 2012), or by their low- or under-occupancy (Quilgars et al., 2016). It demonstrates that even at national level, this kind of cancelling out is not inevitable.
Conclusions
This paper has explored the concept of housing degrowth, which will be an essential part of degrowth overall, but has been less covered in research to date than some other aspects of degrowth, and which has been difficult to define and measure. The paper has developed a definition of housing degrowth. It has developed and applied a measure of housing degrowth in terms of embodied and operational CO2 production, one element of degrowth, which also enables assessment of the impact on the equality and wellbeing elements. It has attempted to find acceptable methods and data to operationalise these definitions to recent data for parts of the UK, a country with a high GDP and a growing population.
The measures used here are imperfect proxies. Choosing and operationalising them has demonstrated the limits of the UK evidence base for assessing housing degrowth. The extent to which the number of rooms is an adequate proxy for CO2 embodied in construction, and to which EIR as measured is a good indicator of CO2 production, need to be tested and confirmed. More research is needed on the best indicators to use to monitor housing degrowth, ensuring that they can also measure equity and wellbeing. More work is needed to generate new and more appropriate datasets. Some other nations may have better measures, and hopefully, UK measures can be substituted with those, (e.g. real rather than modelled data for operational CO2) as they emerge.
Nonetheless, a number of lessons can be learnt from this experiment in measurement and its results. The available measures, while imperfect, have demonstrated potential methods for assessing housing degrowth. This experiment found very different results for the two measures of CO2 production, and showed that assessments can change significantly when measures for equity and wellbeing elements are applied. This confirms the importance of specifying and applying measures. In addition, the measures, while imperfect, have resulted in useful provisional findings. These provide grounds for more optimistic conclusions, for advocates of housing growth suggest that while not yet achieved, housing degrowth is within reach.
In literal terms, the evidence from the recent past on embodied CO2 in England and Wales supports the statement that ‘degrowth proposals are to a certain extent utopian—there is no… place where they fully exist’ (Kallis et al., 2018: 308). No national, regional or local examples of reduced embodied CO2 in housing 1981–2011 were found without increased inequality or reduced wellbeing. This finding fits with other studies of the context for housing degrowth using a variety of definitions and measures, which have found considerable barriers to housing degrowth (Cucca and Friesenecker, 2022; Martínez Alonso, 2022; Mete, 2022).
However, the evidence on operational CO2 challenges the spirit of Kallis et al.’s statement. It suggests that housing degrowth is within reach, even in countries with population and household growth like the UK, and that planned attempts at degrowth in embodied resources and energy may well be able to limit increases in inequality and to maintain wellbeing though a focus on the worst-off. In contrast to embodied CO2 in homes, changes in operational CO2 production in homes in England 2008–18 were the result of intention, planning and support at national scale. This action had an impact which was rapid and much more egalitarian than the very exceptional cases of unplanned degrowth in housing space per person. Changes in operational CO2 only failed to meet the full housing degrowth criteria due to the context of rising prices for fuel and the failure to protect the poorest from their effects.
This evidence suggests that housing degrowth can be achieved in the UK and elsewhere, but will require intentionality, more political justification to counteract the housing growth paradigm, planning, changes to the incentives and regulation in the housing system, a favourable context, and a focus on the worst-off.
Housing degrowth in the recent past in the UK was made more challenging by population and household growth. Small households are likely to have more housing space, embodied CO2, and operational CO2 per person than larger ones, and a population with higher proportions of small households will have greater impacts in total than one with larger households (Nelson, 2018). UK population and household growth slowed after Brexit and the pandemic (ONS, 2021), but on the other hand, after 2018, UK reductions in operational CO2 from homes have stalled, and further progress depends on removing gas from domestic heating in existing as well as new homes. However, policies have weakened (Committee on Climate Change, 2019), and energy price rises have only continued.
Footnotes
Acknowledgements
Many thanks to Federico Demaria for support and guidance, and to Joyeeta Gupta and several anonymous reviewers for their comments, which have all much improved the text.
Declaration of conflicting interests
The author declared no potential conflicts of interest with respect to the research, authorship, and/or publication of this article.
Funding
The author received no financial support for the research, authorship, and/or publication of this article.