
Abstract
Governments the world over routinely undertake Land Value Capture (LVC) to recover some (or all) of the uplift in land values arising from the right to develop in order to fund infrastructure and public goods. Instruments to exact LVC are diverse but are usually implemented independently. However, since 2011 England has been experimenting with a dual approach to LVC, applying both a tariff-style levy to fund local infrastructure (the Community Infrastructure Levy) and negotiated obligations, used primarily to fund affordable housing (Section 106 agreements). In this article we employ a difference-in-differences (DID) method to identify the interaction of these two instruments available to local planning authorities. We explore the question of whether the Community Infrastructure Levy ‘crowds out’ affordable housing secured through Section 106 planning agreements. In so doing we show that the interaction of these two approaches is heterogeneous across local authorities of different types. This raises questions for understanding the economic geography of development activity and the theory and practice of Land Value Capture.
Introduction
Inflation in residential real estate prices has become a hallmark of urban life for many citizens the world over. A large body of academic work now serves to describe the specific economic determinants and social implications of house price inflation in a vast array of contexts (see, for indicative examples, Acolin and Green, 2017; Bangura and Lee, 2019; Li et al., 2020; Zhang et al., 2016). Describing the universality of this public policy problem Wetzstein (2017) refers to the ‘global urban housing affordability crisis’. However, formulating a policy response that results in the delivery of sufficient affordable housing has proven to be a seemingly intractable problem for policy makers.
In many contexts the question of how more affordable housing should be secured has been elided with the broader issue of ‘Land Value Capture’ (LVC). This is the process by which either/both cash payments or/and in-kind contributions are made by the development industry and delivered in parallel to a specific development. These contributions should, in theory, reflect the uplift in land values associated with the award of planning consent. This state–market interaction is a common feature of polities the world over and, although the economic mechanism differs from context to context, the underlying principle remains the same: for a private developer to deliver new housing at market rates there will often be a statutory requirement for this profit-orientated activity to be accompanied with social, environmental and economic public goods. How these public goods should be secured, what proportion of the uplift in land values could/should be recovered by the state and which specific public goods should be made a condition of new development are all facets of what has come to be known internationally as the question of Land Value Capture (LVC).
As housing affordability has declined and become an increasingly pressing social and economic issue in many advanced economies, LVC has become a popular way of financing affordable housing. For example, in 2020 £4.7bn of the total £7bn that was raised through LVC in England represented the delivery of affordable housing by private developers as a result of the imposition of a quota of affordable housing to be delivered as part of what would otherwise be wholly commercial developments. In total this resulted in 44,000 new affordable homes – around half of the total of all affordable housing delivered in England in that financial year (Lord et al., 2020). However, delivering a substantial number of affordable dwellings in this way represents a very specific bargain between the local state, in the shape of planning control, and the development industry. Evidence would suggest that this bargain is strongly influenced by site-specific debates on ‘development viability’, the strength of the market and the corresponding value available through the development available to be captured through LVC and returned in the form of affordable housing. In reflecting on this point Ferm and Raco (2020: 13) describe a ‘dependency on the market and private-sector actors to deliver public benefit, and magnifies the already existing inequalities between places. Local authorities and citizens face a growing degree of dependence on lucrative development on viable sites with potential for land value uplift, in order to fund broader infrastructure and affordable housing elsewhere’.
This important finding provides the stimulus for further research on the geographic extent of this identified phenomenon and, critically, to quantify the relationship between market conditions, Land Value Capture practices and planning outcomes. In this paper we set out to investigate the relationship between these aspects of how real estate markets are animated in two ways. First, we consider how local authorities in England choose to manage LVC in relation to house prices as a measure of development viability across all 326 local planning authorities in England. We specifically seek to consider local authorities’ propensity to adopt a voluntary LVC mechanism, the Community Infrastructure Levy. Second, we consider the degree to which variations in development viability might explain variations in outcome with regard to what has been secured through LVC policies in England. In this respect we use development viability as the prism through which to view how contextually different local authorities secure LVC contributions of different types with a particular focus on direct payments versus affordable housing contributions secured through a parallel negotiated process.
The paper proceeds as follows. In the next section we describe the policy context, research design and data collection. This is followed by an account of the difference-in-differences methodology we employ in the main analytical section of the paper before model results are presented and discussed.
Policy context: Pass the parcel or the viability charade?
The concept that private development value should be subject to a charge or levy is a common feature of diverse socio-political contexts the world over (Gielen and van der Krabben, 2019). The origins of this public policy question can be found in the 19th century with what Mill (1965) described as the ‘unearned increment’ and Henry George’s advocacy of the nationalisation of land rights through a single land tax (Buurman, 1986). In modern times a range of practices can be identified with respect to how some or all of the uplift in land values resulting from the right to develop might be recovered (see e.g. Whitehead, 2016).
In England, the methods applied to this public policy question represent a hybrid approach. First, Local Planning Authorities’ (LPAs’) ability to negotiate obligatory contributions (hence ‘planning obligations’) with developers on a case-by-case basis is provided under Section 106 of the 1990 Town and Country Planning Act – although the practice in effect goes back to the 1971 Town and Country Planning Act which enabled LPAs to enter into a contractual arrangement with developers. Since this time planning obligations have been agreed between developers and local authorities to make what would otherwise be unacceptable development permissible in planning terms (Jowell, 1977). Since the 1990 Town and Country Planning Act, these obligations have typically been referred to as Section 106 (S106) obligations, in reference to the clause in that Act that permits their use. By the 2000s S106 was being used to compensate third parties for externalities and act as a de facto tax on the uplift in land values resulting from planning consent (Corkindale, 2004). This led to calls to separate the two functions of direct mitigation and affordable housing, and a supplement to charge to meet wider infrastructure needs (Crook et al., 2006). S106 agreements are negotiated on a case-by-case basis and as such are agreed through the planning application process, with agreements set out in a parallel document using contract law to bind both parties to the agreement. Since the 1990 Act case law has been used to define precedents of S106 regulations.
Second, the Planning Act 2008 and subsequent regulations from 2010 (and amendments of 2019) provide the legislative basis for the Community Infrastructure Levy (CIL). This is a locally determined fixed charge on development which usually takes a relative form, such as ‘£X per square metre of new development’. Following public consultation and independent examination, an adopting LPA must publish the levy rate in a CIL ‘charging schedule’ which then applies to most new development that creates net additional floor space of 100 m2 or more. Local planning authorities that have chosen to adopt the CIL can operate these two approaches, CIL and S106, in parallel to manage LVC.
Planning obligations and the CIL in combination represent significant funding for social and environmental mitigation of development for LPAs. A study of the value and geographic incidence of developer contributions in England in 2018 showed that the aggregate value of these developer contributions was worth £6bn annually to local authorities in England (Lord et al., 2018a). This was followed by a subsequent study for the financial year 2018–2019 which showed that the value of LVC exacted through these two instruments by English local authorities had grown to £7bn (Lord et al., 2020). However, S106 and CIL are distinct in concept, methodology and character – negotiated S106 agreements contrast with the published levy on development represented by CIL – and are consequently used to elicit different kinds of developer contribution. CIL results in cash contributions made by the development industry to LPAs that can then be pooled over time to support direct statutory investment in infrastructure. Perhaps the best example of this is the investment of CIL proceeds into Crossrail, a major east–west transit project in London (Planning Resource, 2016). By contrast S106 results more usually in the delivery of in-kind benefits that are provided by the developer in the course of producing the development for which they have received planning consent. The consequence is that local planning authorities may choose to mix the two instruments in parallel to recover different types of developer contribution: CIL to generate direct cash payments and S106 to secure in-kind contributions, such as affordable housing.
For commercial developers, providing new housing of this affordable variety is clearly in tension with the profit motive. Without the option to use S106 to secure affordable housing of these types there would be no regulatory compulsion on developers to provide anything other than housing traded at market rates. So, how does the development industry respond to the requirement that is sometimes placed upon them to deliver affordable housing?
Playing the viability charade
Answering this question is best accomplished by reference to behavioural insights into the process by which S106 agreements are negotiated and agreed. A programme of semi-structured interviews conducted in parallel with the quantitative data collection reported later in this paper points to a clearly articulated understanding that CIL and S106 were considered in combination by developers. For example, one planning consultant described a trade-off: what we want to do is get to a point where we can tell the council, ‘if you have 30% affordable housing they can get X developer contributions, but if they went for 20% affordable housing they could get more in developer contributions’. As part of that we will be looking at the scope for CIL, but that will be a question as to whether or not they want to have the maximum amount of affordable housing – because if they have that there will not be room for developer contributions. (Case Study Interviewee, B3)
Testimony from LPAs in weaker markets repeatedly corroborated the analysis that CIL had diminished planners’ capacity to secure affordable housing through S106. Indeed, for some LPAs the decision to introduce CIL came with the explicit expectation that this would have to be compensated for with a reduced set of requests for other public goods through the parallel S106 system. One LPA officer in a weak housing market area said: 106 was scaled back quite a lot. We used to seek obligations for transport, public realm, open space, sport, and community facilities, etc. It was all through 106 before … This has all gone since CIL. (Case Study Interviewee, J1)
In other parts of the country the presence of CIL was understood as less of a deterrence to the use of S106. For example, testimony from an LPA officer in an area characterised by high house prices and strong development viability suggested that in such settings: CIL has had no impact on affordable housing whatsoever. (Case Study Interviewee, Q1)
Indeed, in this particular case the authority had seen an aggregate growth in the value of developer contributions exacted since implementing CIL alongside S106: CIL has increased our overall receipts from developer contributions as the smaller developers have to pay CIL and we have a lot of these small sites. (Case Study Interviewee, Q1)
The implications of this small set of excerpts from a programme of 80 interviews conducted across 20 case studies from across England (for fuller qualitative evidence see Lord et al., 2020) points to the potential for the operation of two parallel systems, CIL and S106, to have a profound effect on the types of public goods that are being secured and the geography of their provision. In some areas interview testimony suggests that CIL is crowding out S106, which effectively means that LPAs are generating cash receipts through CIL at the expense of affordable housing units. By contrast, in other areas interviewees described a situation where CIL may co-exist with S106 and result in an increase in the overall level of investment secured which successfully funds both the delivery of new infrastructure and affordable housing.
These findings chime with much of the existing literature that seeks to understand the behavioural aspects of the negotiated process that underpins Section 106 agreements. In this regard some authors have pointed to the use of ‘viability assessments’ by developers in the negotiation process to argue that the inclusion of an affordable housing quota removes the prima facie business case for development (McAllister, 2017, 2019; McAllister et al., 2019). This negotiation practice has come to be understood as one of the ways in which the development industry may seek to ‘game’ the negotiation process and can be found in reporting of the ‘viability charade’ (Lord et al., 2019) and ‘pass the parcel’ (Crosby, 2019). Indeed, in this latter contribution Crosby (2019) dissects specific cases where the manner in which viability assessments have been computed and presented by developers has acted as a pretext to diminish the levels of affordable housing that have been delivered in practice. A similar point is made by Wyatt (2017) in seeking to identify the circumstances under which developers might use the argument of compromised scheme viability to diminish contributions of S106-funded affordable housing on the grounds that this in-kind contribution has been ‘crowded out’ by the presence of a cash payment through CIL (p. 165): One of the key differences between CIL and planning obligations that was highlighted in the interviews was that CIL is a fixed levy and S106 is negotiable. This has led to concerns that, where scheme viability is an issue, there will be a reduction in planning obligations sought and, notably, a reduction in affordable housing provided.
This raises the issue of the behavioural economics of the whole process. If we proceed with the reasonable assumption that developers will favour those sites where development viability is most conspicuous and assemble a strategy accordingly, we must also consider how local authorities might respond (Lord and Gu, 2018). Which authorities are most likely to adopt CIL? Where an authority has chosen to operate both CIL and S106 in parallel do the two instruments interact to change the mix of what is secured through developer contributions? Is there a behavioural economic geography that means we can understand variations in outcome as a function of variations in market conditions?
To understand the interaction of S106 and CIL we present analysis using two data sets from two consecutive iterations of The Incidence, Value and Delivery of Planning Obligations and Community Infrastructure Levy in England (2016/2017 and 2018/2019; Lord et al., 2018a, 2018b). These two projects were commissioned by the Ministry of Housing, Communities and Local Government and were designed to provide intelligence on the value, geographic incidence and investment of contributions made by the development industry through S106 and CIL. The evidence presented here draws upon surveys distributed to every LPA in England in both 2017 and 2019 (to harvest data for the financial years 2016/2017 and 2018/2019, respectively). Full details of the surveys, including their reproduction, and case study interviews can be found in Lord et al., (2018a, 2018b, 2020).
In the following sections we present an econometric analysis that combines the results of this primary survey data with an account of development viability, measured through a decile ranking of LPAs by house prices. Although it might be argued that house prices are not an exact corollary for ‘viability’ because of the site-specific nature of real estate development, there is clear evidence that the central ingredient of development viability as a concept is the existence of a strong market, for which house prices are the most commonly employed general indicator. Indeed, much of the literature reinforces this point by acknowledging that general tendencies in house prices are locked in to the psychology of how we think about real estate (Murphy, 2019) as well as being core to the development industry’s own assessments of future returns and, therefore, development viability (for example, Colenutt et al., 2015; Grayston, 2017). In the following analysis we explore three specific questions that pertain to the interaction of developer contributions policies vis à vis CIL and S106 in the context of geographically variable development viability. First, do variations in development viability explain the geography of CIL adoption? Second, has the pattern of CIL adoption had a material effect on what has been secured through S106? Third, what is the geographically differential effect on the overall level of developer contributions that have been exacted through the combination of CIL and S106?
Does development viability influence which local authorities might be expected to adopt CIL?
At the time of writing 50% (161 out of 326) of LPAs in England have adopted CIL. To understand if the presence or absence of development viability influences local authorities’ decision making with regard to the adoption (or not) of CIL we can begin by classifying all 326 LPAs in England into a decile rank using average house price per square metre (Office for National Statistics (ONS), 2017) 1 as an indicator of development viability. Each decile correspondingly includes approximately 33 LPAs. The number and the proportion of CIL-charging LPAs are then counted alongside the breakdown of ten decile bands as shown in Table 1. As can be seen, the propensity for LPAs to adopt CIL generally increases as the average dwelling price increases. The two extreme bands (first and tenth deciles) show a significant discrepancy in the number of LPAs that chose to adopt CIL charging: only 9% of LPAs in first decile versus 88% of LPAs in the tenth decile have introduced CIL.
The average house price (£ per square metre) decile groups and the number and proportion of CIL charging LPAs in the deciles.
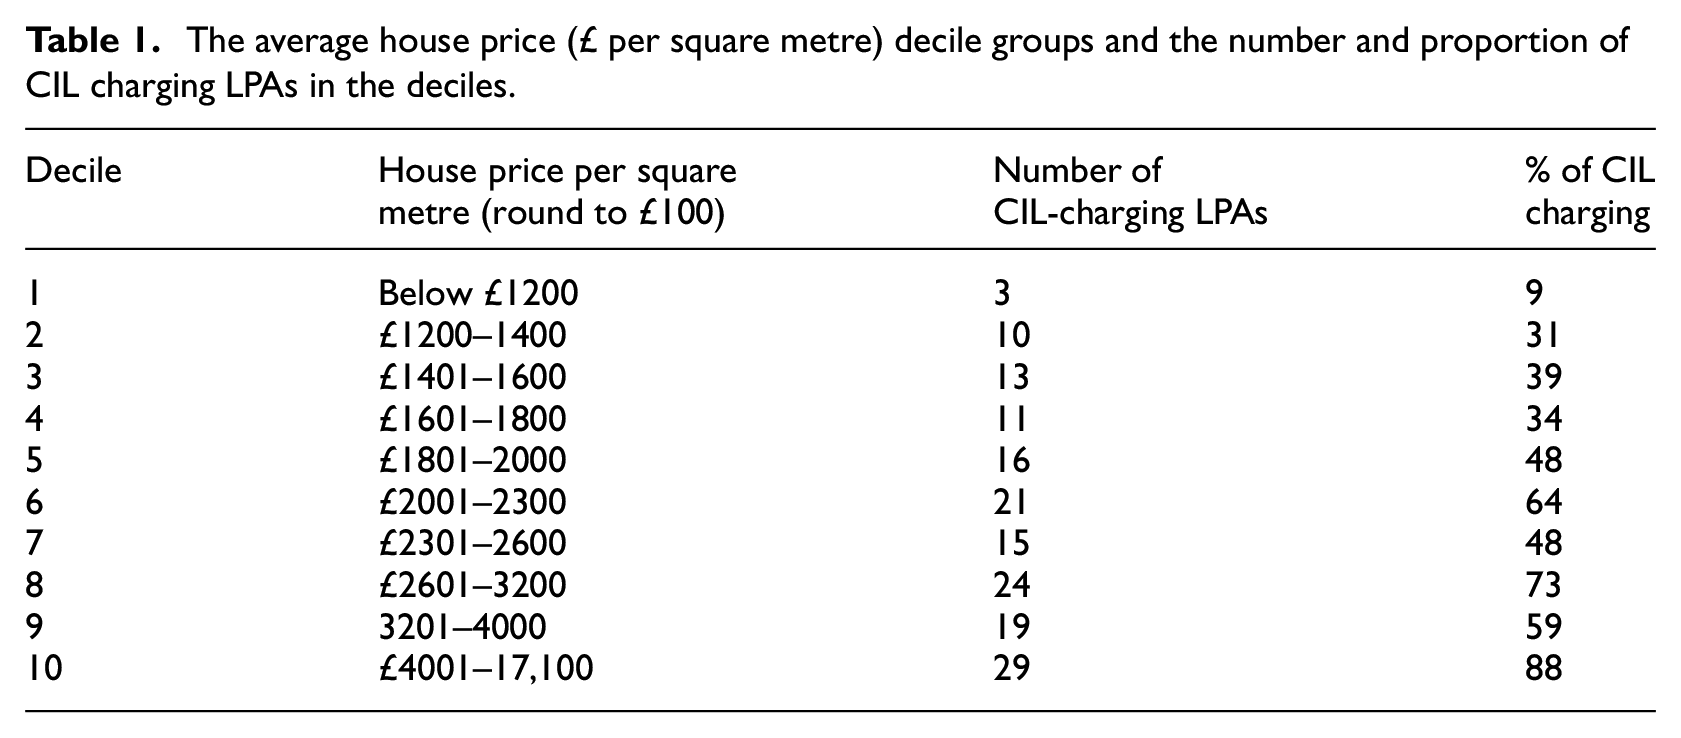
Expressing the number of CIL-charging LPAs in relation to development viability provides a useful perspective on the capacity for LPAs to charge CIL in different market conditions. From this observation we can hypothesise that LPAs in weaker markets have a generally weaker propensity to adopt CIL, preferring to rely on the negotiated process of S106 agreements. Conversely, in stronger markets the presence of strong development viability provides a behavioural incentive for local authorities in such settings to combine CIL and S106 to potentially capture a greater proportion of the uplift associated with the award of planning consent.
To test this hypothesis, we employ a logistic model to provide an assessment of the likelihood of CIL adoption across all 326 LPAs distributed between the ten house price deciles based on the cross-sectional data from 2018. The log-odds probability of CIL adoption is regressed on ten dummy variables corresponding to ten house price deciles and a covariate ‘housing need’ which uses the English standard method for the assessment of housing requirement (Ministry of Housing, Communities and Local Government (MHCLG), 2019). This measure provides an objective assessment of housing need that is applied uniformly throughout England to establish a forecast number of new dwellings to be produced in each local authority area. In our analysis the standard method for the assessment of housing need provides a measure of development viability in that it effectively describes an assessment of the scale of new development required across England as a whole that is then spatially devolved to individual local authorities.
If the probability of CIL adoption is defined as
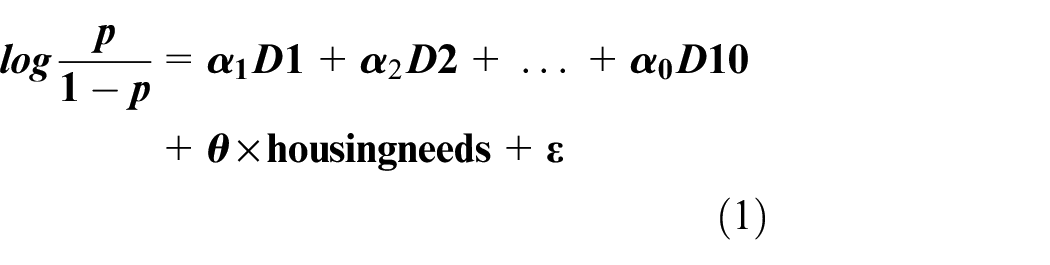
where
The logistic regression results in a likelihood ratio chi-square of 68.2 with a p-value of 0.000, indicating that the model is overall significant. The overall rate of correct classification is estimated to be 69.5% with 62.8% sensitivity (true positive rate) and 75.6% specificity (true negative rate), indicating that the use of house price deciles as a proxy for development viability can correctly classify 69.5% of local authorities in terms of their decision to adopt CIL or not.
More importantly, the predicted probability of CIL adoption corresponding to each house price decile can be obtained from the marginal effect of each dummy variable on the probability of CIL adoption. The predicted probabilities for the ten house price deciles are illustrated in Figure 1. This shows that the predicted probability of adopting CIL amongst LPAs in the first decile is as low as 12%. For those LPAs with house prices above the median (fifth decile), the probability of CIL adoption increases to above 50% (except the seventh decile at 44%) and those authorities in the highest house price decile have an 82% probability of adopting CIL.
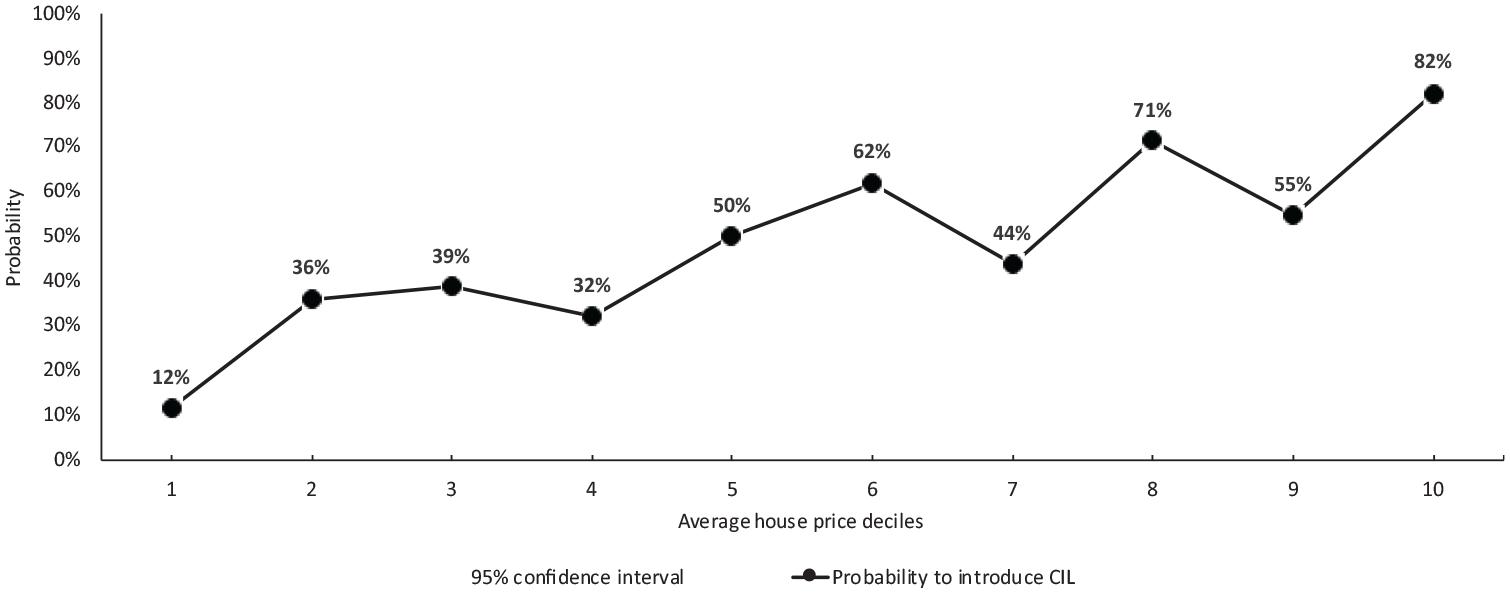
Predicted probabilities of CIL adoption for the house price deciles.
Does development viability explain variations in the character of developer contributions?
In the previous section the presence of development viability, as measured by average house prices, was found to be an important factor in explaining a LPA’s decision whether or not to adopt CIL. LPAs with lower levels of development viability are less likely to adopt CIL, and hence the introduction of CIL in weak markets might lead to a three-way trade-off between CIL receipts, infrastructure investment and affordable housing funded through S106, and the economic viability of development. Continuing to use average house price as a proxy for development viability, this section seeks to detect the threshold where the trade-off between CIL and S106 occurs and with what geographic effects. We confine ourselves to S106-provided affordable housing as this is the most significant developer contribution that is exacted through this mechanism: Lord et al. (2020) show that of the £7bn aggregate total for developer contributions raised in England in 2018/2019, £6bn (85%) was the result of S106 negotiations. The majority of these S106 contributions (£4.7bn, 78%) resulted in the 44,000 units of affordable housing contributions delivered in that financial year. The definition of affordable housing that we employ includes the four main types of dwelling in this category in England:
Affordable rent: housing rented to eligible households by local authorities or registered providers at a rent no more than 80% of market rent.
Social rent: housing rented to eligible households by local authorities or registered providers at guideline rents determined by the government.
Affordable home ownership, intermediate rent and shared ownership: discounted sale or rent below market levels (but normally above social rents) to eligible households within income guidelines.
Starter homes: dwellings for sale at 80% (or less) of market prices with restrictions on purchase to first-time buyers with income restrictions.
To explore this question of how development viability influences the co-existence of CIL and S106-provided affordable housing we conduct a ‘quasi-experiment’ (Angrist and Pischke, 2010) on the 326 LPAs using a difference-in-differences (DID) approach to evaluate the effects of adopting CIL. The DID estimator describes the difference between the change in outcomes before and after a treatment is effected between treatment and control groups. To frame our question in a quasi-experiment, the number of S106-funded affordable housing units in a LPA is the ‘outcome’ variable of interest. The ‘treatment group’ is comprised of the 161 out of 326 LPAs that had adopted CIL by the start of the financial year 2018/2019. The remaining LPAs in England that continued to operate only the pre-existing S106 system represent the ‘control group’. The ‘treatment’ is effected whenever a LPA adopts CIL which divides the before and after periods of CIL adoption as the pre- and post-treatment periods. Note that the earliest post-treatment period started from 2011 (instead of the introduction year of CIL in 2008) as the first three LPAs to adopt CIL did so in 2011.
Using a standard two-group/two-period DID estimator, the estimated average treatment effect (ATE) of CIL adoption for outcome variable
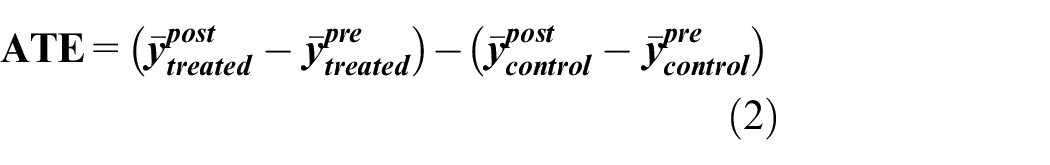
where
Table 2 reports the sample means of S106-funded affordable housing units for the treatment and control groups at pre- and post-adoption of CIL. The individual-level statistics for all the LPAs are presented in Panel A and the group-level statistics in terms of the LPAs in ten house price deciles are in Panel B. Among all the CIL-charging LPAs (in Panel A), the difference in the mean number of affordable housing units between the pre- and post-CIL adoption is 38.3 units (given by 54.6 minus 16.3 units) compared with 24.1 units for the non-CIL-charging LPAs. Therefore, by assuming the same rate of growth in affordable housing across all LPAs, the adoption of CIL is found to yield an overall positive impact on the change in S106-funded affordable housing units.
Sample mean of affordable housing units through Section 106 (nil grant) of the CIL- and non-CIL-charging local authorities for the two sample periods 2000–2010 and 2011–2018.
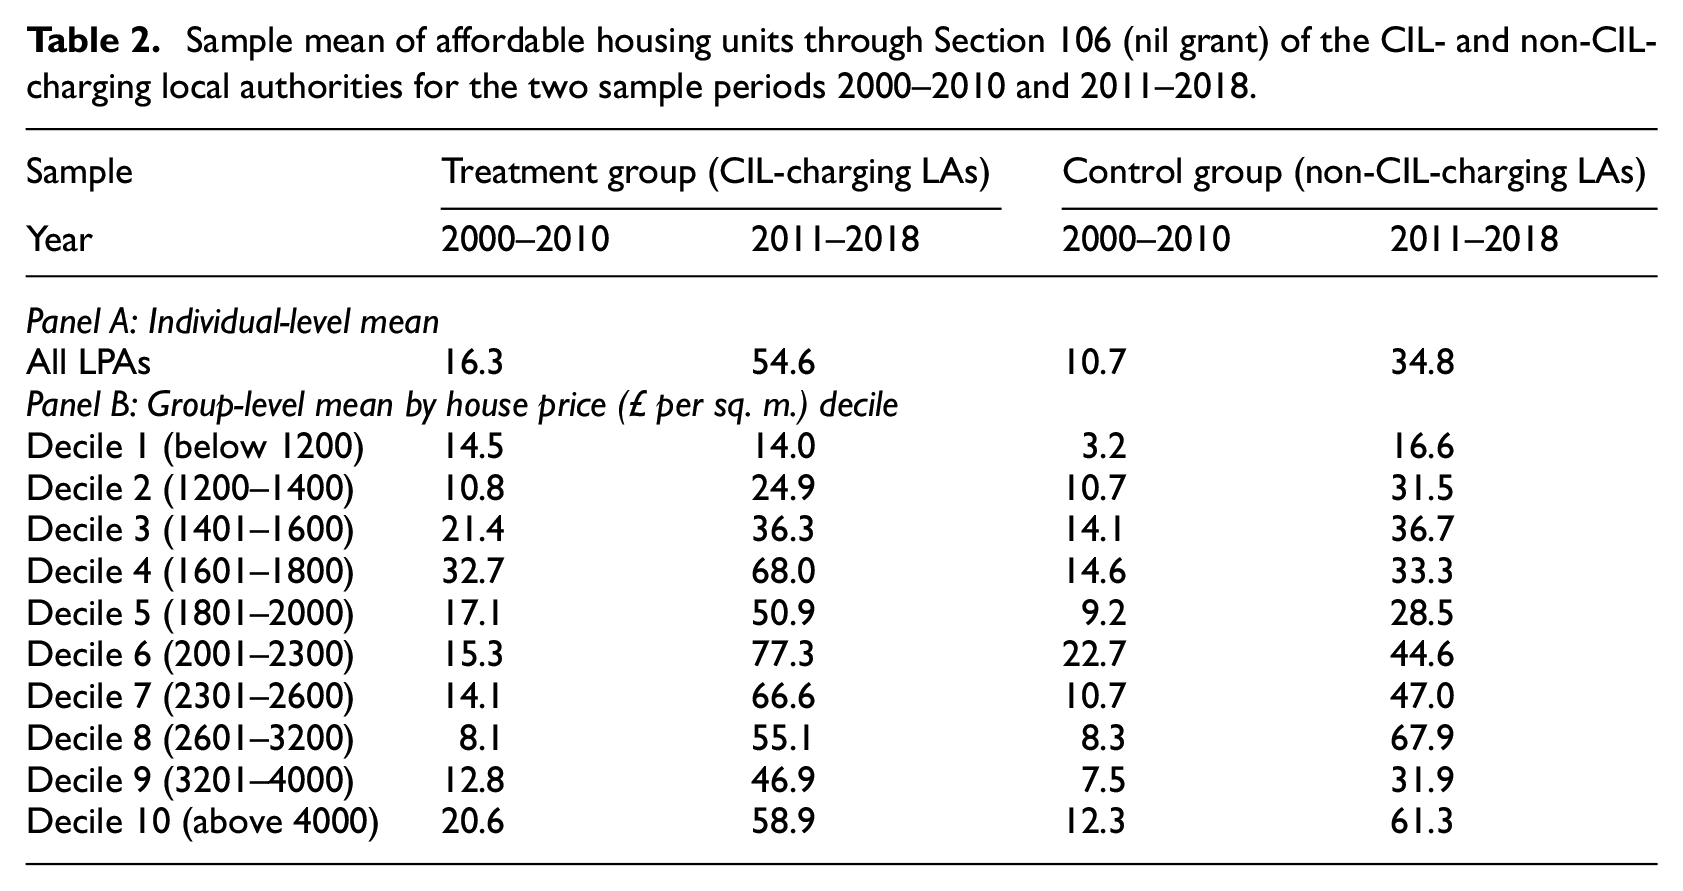
However, it could be argued that this assumption of an identical growth rate in affordable housing across all LPAs is unrealistic as different LPAs will respond to their own local circumstances and should have locally bespoke affordable housing targets. Given that the previous section demonstrated house prices to be an effective proxy for development viability in estimating the propensity for LPAs to adopt CIL, we can further categorise all 326 LPAs into ten bands of development viability. The group-level mean values of affordable housing variations across different development viability groups are set out in Panel B of Table 2. A clear pattern is observable: CIL-charging LPAs with low levels of development viability (house prices below £1200 m2) have experienced a negative 0.5 unit change in affordable housing compared with an increase of 13.4 units of affordable housing for the non-CIL-charging LPAs given the same house price condition. The same negative impact of CIL adoption can also be observed by LPAs in the second and third house price deciles. For stronger housing markets above the median (the fifth decile), the rates of change in affordable housing across pre- and post-CIL adoption periods were able to be maintained and some even observed an increase in quantity of S106-provided affordable housing that had been secured (e.g. sixth and seventh deciles).
This simple comparison of sample means provides an insight into the overall impact of CIL and a pattern of how development viability influences what LPAs are able to secure through LVC. Beyond the treatment effect from sample mean, the rate of growth over time in affordable housing may involve many factors other than the adoption of CIL that affect affordable housing outcomes. For example, time-specific factors (e.g. national policies on housing delivery) and individual-specific factors (e.g. local housing needs assessments) could vary the rate of growth in affordable housing locally. To address these issues a regression model can be designed. A DID model with fixed effect is formulated as:
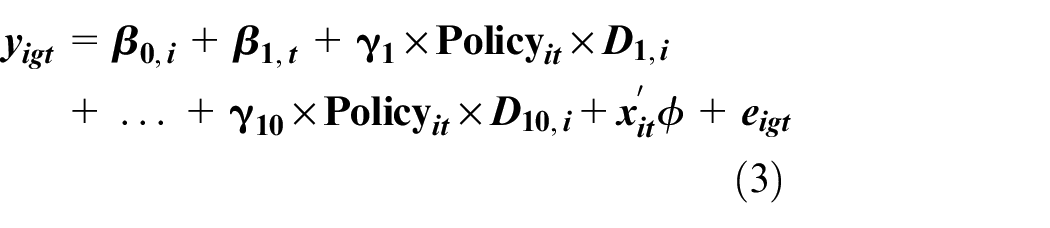
where
The estimation result of the DID model is reported in Table 3. We also estimate a benchmark result in the absence of group-specific treatment effects for comparison which is presented in Model [1]. The heterogenous group-specific treatment effects of CIL across house price deciles are estimated in Model [2]. The average treatment effect in Model [1] shows that CIL-charging LPAs on average were able to secure six more units of S106-funded affordable housing after adopting CIL. However, this obscures the evidence that there is variation amongst CIL-charging authorities dependent upon the level of development viability present as measured by average house prices. The result in Model [2] provides a detailed breakdown of the impact of CIL on affordable housing across all ten groups of LPAs by the level of development viability present in the local authority areas (as measured by average house prices). After adopting CIL, LPAs in the first, second, third and fourth house price deciles experienced a decrease in S106-funded affordable housing (by 34, 14, 11, 4 units, respectively). In contrast, for LPAs in the fifth decile and higher, adopting CIL could secure up to 21 units more in S106-funded affordable housing.
Estimation of the CIL treatment effect by high–low house price.
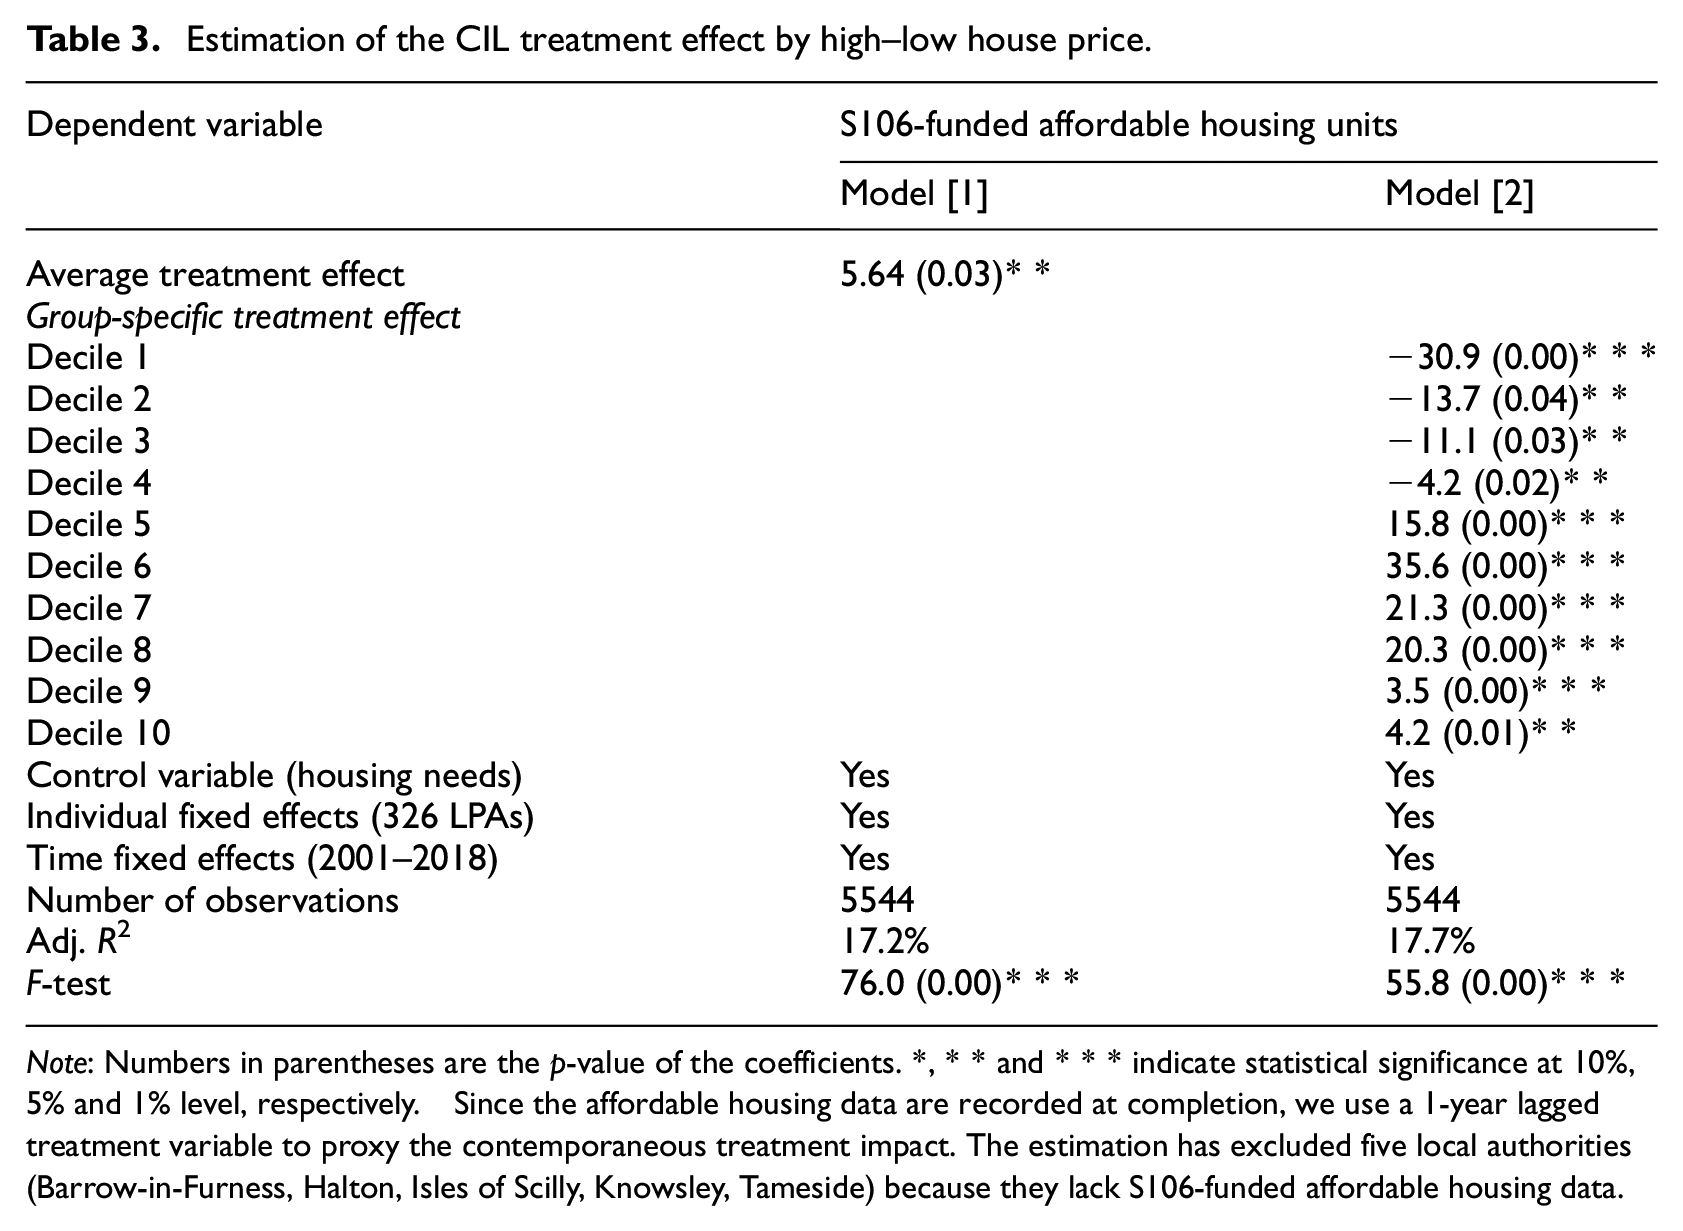
Note: Numbers in parentheses are the p-value of the coefficients. *, ** and *** indicate statistical significance at 10%, 5% and 1% level, respectively. Since the affordable housing data are recorded at completion, we use a 1-year lagged treatment variable to proxy the contemporaneous treatment impact. The estimation has excluded five local authorities (Barrow-in-Furness, Halton, Isles of Scilly, Knowsley, Tameside) because they lack S106-funded affordable housing data.
To visualise the heterogeneous impact clearly, Figure 2 plots the coefficients of estimated treatment effects of CIL on S106 affordable housing by ten deciles of house price (£ per square metre). The LPAs belonging to each group are listed beneath the horizonal axis. According to the plot, the treatment effect of CIL adoption exhibits an increasing but non-linear pattern from the weakest and the strongest housing markets. Under the combined developer contribution system the point at which the effect of CIL on S106-funded affordable housing becomes neutral and then positive is between the fourth and fifth deciles of the average house price distribution. The average house price of £1800 per m2 is the threshold at which this trade-off takes place. For LPAs with house prices below £1800 per m2, affordable housing units through S106 have been crowded out by CIL; beyond this value CIL can be understood as providing supplementary cash contributions alongside S106-funded affordable housing.
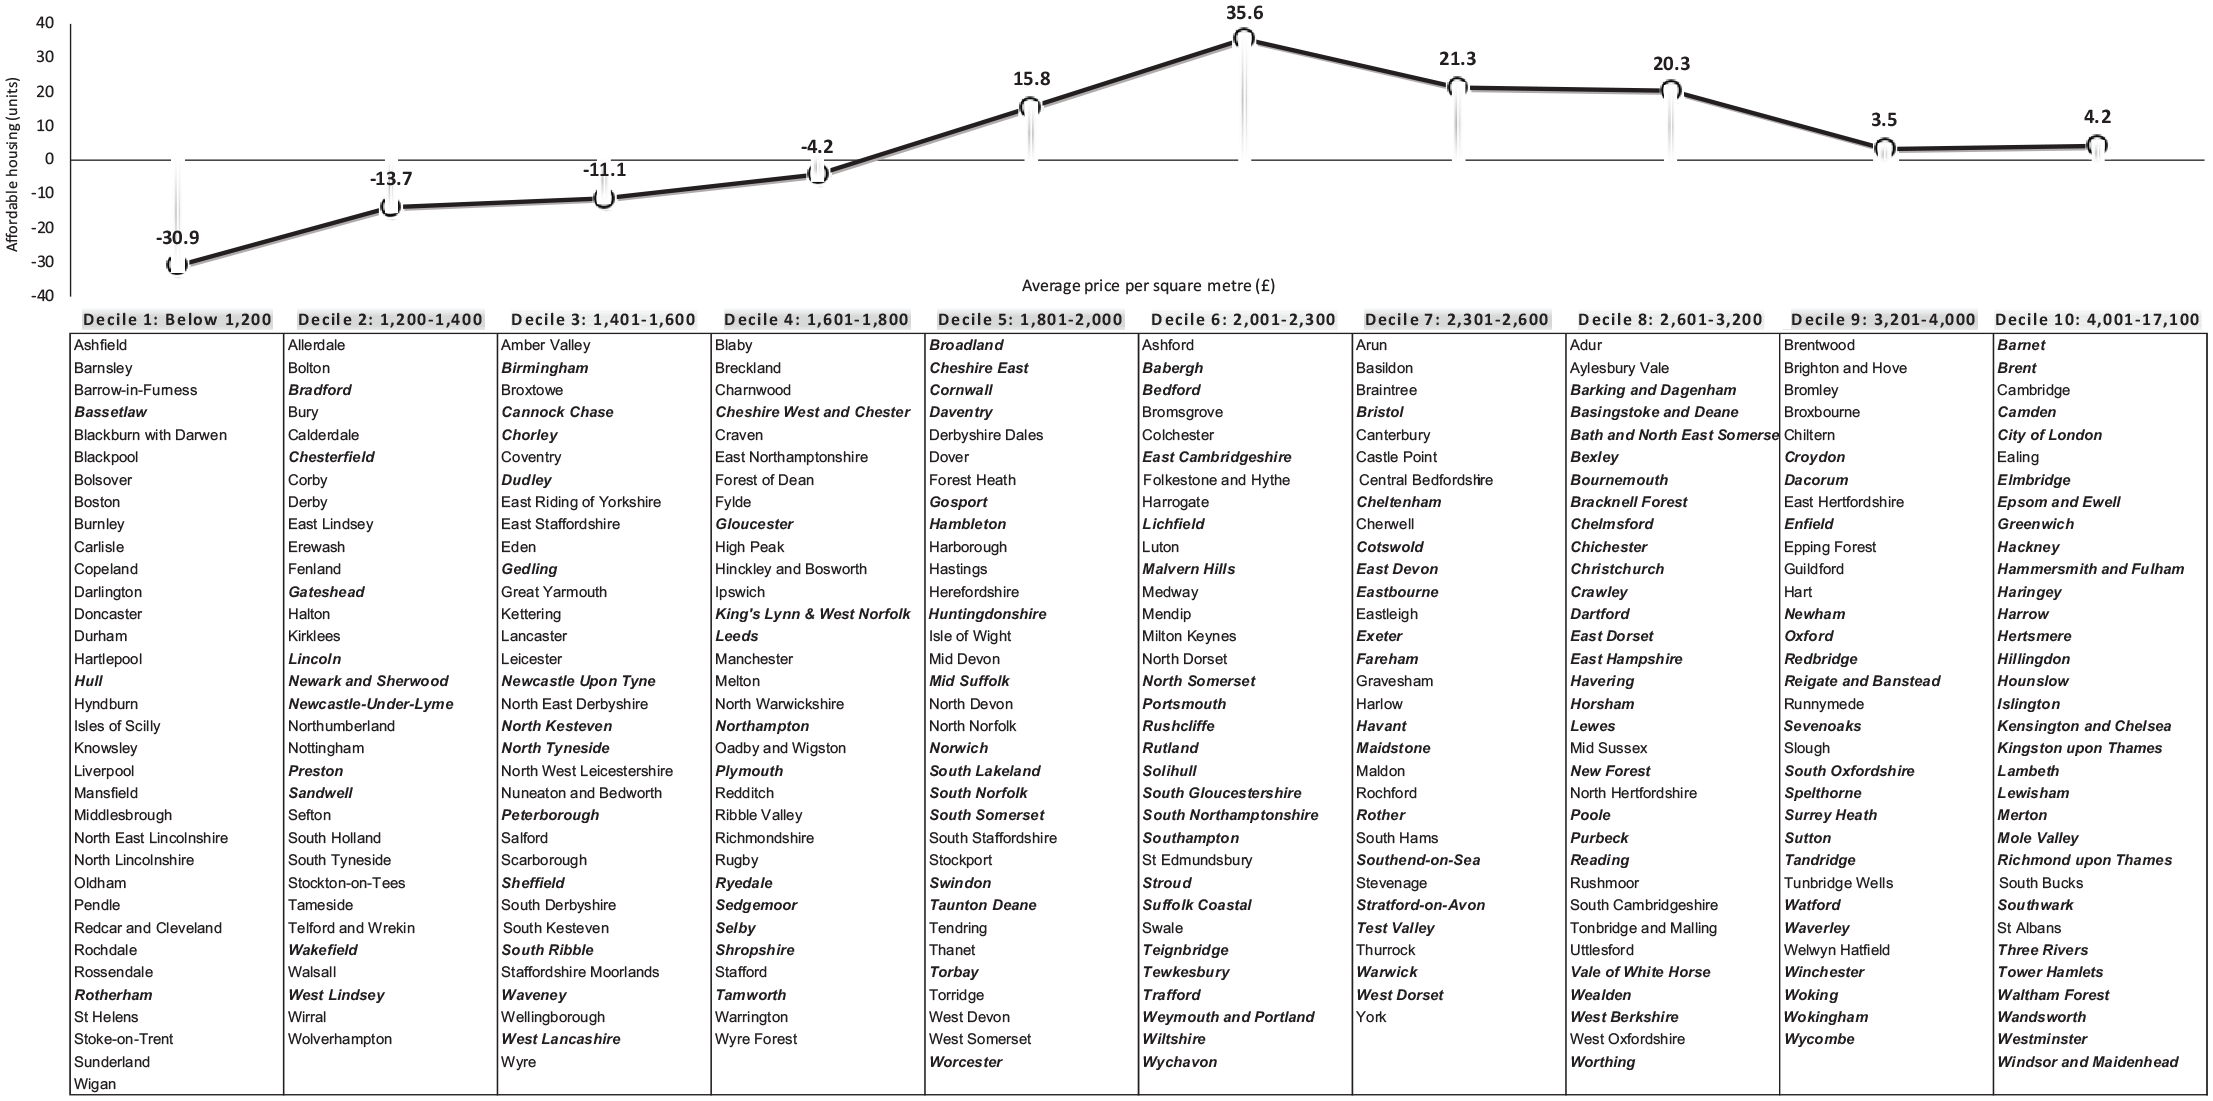
Estimated treatment effect coefficients of CIL on S106 affordable housing, by deciles of average house price (£ per square metre) and the list of LPAs in each decile group (the CIL-charging LPAs are in bold text).
The findings of Table 3 are very clear. For those authorities in decile four and below, the choice to implement CIL should come with the expectation that it may diminish the amount of affordable housing that could be secured through S106. In these LPAs the levels of development viability are not sufficiently strong to support the co-existence of CIL and S106 – mandatory cash receipts generated through CIL could be ‘crowding out’ what can be achieved through S106. However, for LPAs in decile six and higher CIL can be understood as an important instrument for supplementing what can be achieved through S106. Amongst these local authorities CIL is not a stimulus to affordable housing provision but, rather, rates of affordable housing secured through S106 can be understood as stable or even able to grow alongside a mandatory CIL charge on development. Crucially the variable that explains LPAs’ capacity to implement CIL alongside S106 is the level of existing development viability. On this analysis for any authority with strong development viability it could be sensible to adopt CIL as it would provide an additional instrument to manage LVC that will not come at the expense of the S106 contributions for affordable housing.
These observations raise three related further questions. First, to what extent does the availability of CIL mean that LPAs with strong development viability are able to use this in addition to S106 to secure more than they did prior to their adoption of CIL? Second, for those CIL-adopting LPAs that have lower levels of development viability, has CIL had any effect on the mix of developer contributions that have been exacted (in favour of cash contributions through CIL and away from affordable housing through S106)? Third, has it had a material effect on the overall value of what has been secured?
Does development viability affect the amount of value LPAs are able to capture?
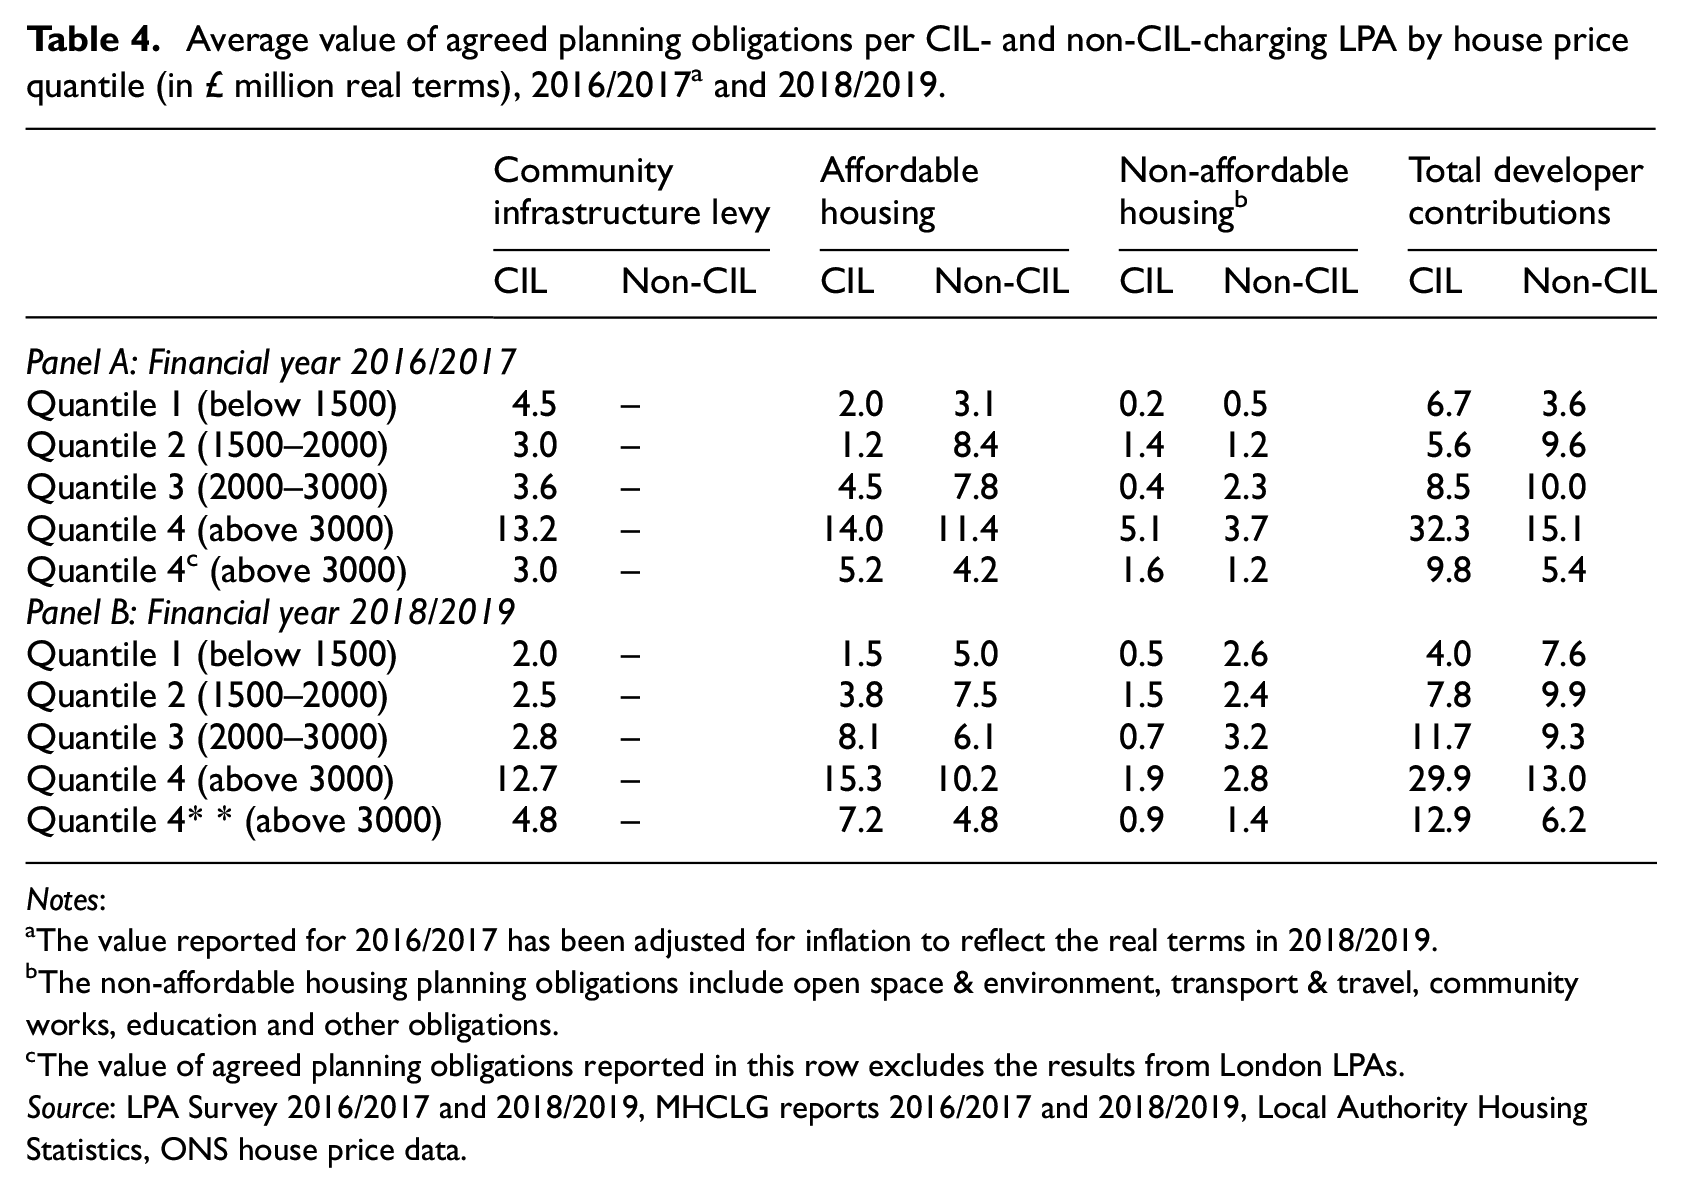
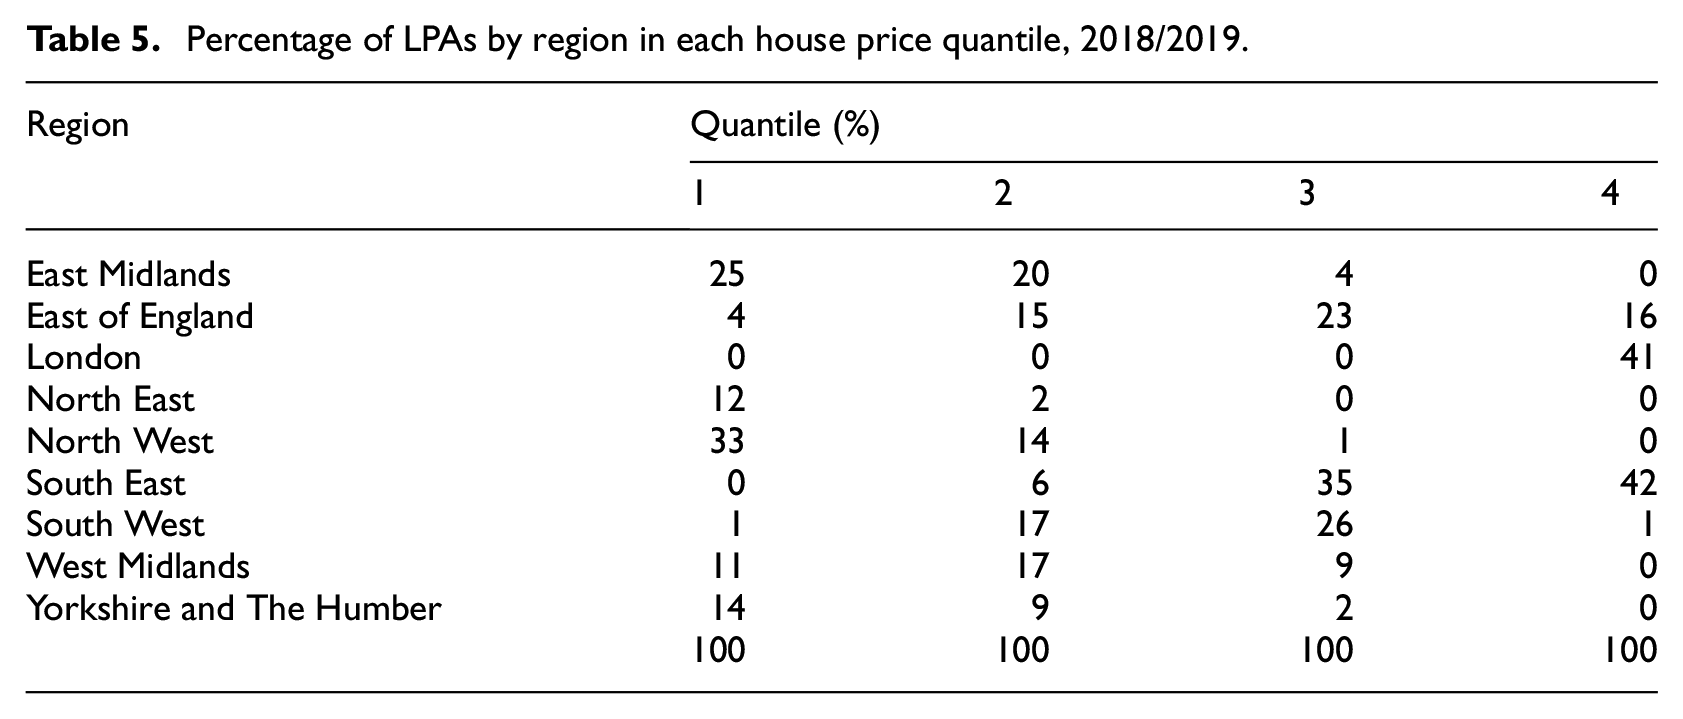
In this section we use the data from the two surveys of local authorities for the financial years 2016/2017 and 2018/2019 to consider the effect of CIL adoption on the absolute value of developer contributions secured for local authorities. Considering the value of S106 planning obligations and CIL secured by English LPAs we estimate the average value of agreed developer contributions per LPA. The estimation method is based on the methodology employed in Lord et al. (2018a, 2020) which uses assumptions and secondary sources (e.g. average house price, CIL adoption schedule) in order to scale individual-level survey responses to provide regional, national and groups level (using the LPA family typology devised by Vickers et al., 2003) analyses. The estimated total value of developer contributions is then grouped by variation in house price (£ per square metre) quantiles 2 and CIL/non-CIL adoption. The average value of developer contributions per CIL and non-CIL LPAs can then be calculated by dividing the total value by the number of CIL and non-CIL LPAs within each house price quantile. The comparison of the average value of developer contributions for 2016/2017 and 2018/2019 is presented in Table 4. The regional distribution of LPAs in each house price quantile is also summarised in Table 5 to assist with geographic comparison.
Average value of agreed planning obligations per CIL- and non-CIL-charging LPA by house price quantile (in £ million real terms), 2016/2017 a and 2018/2019.
Notes:
The value reported for 2016/2017 has been adjusted for inflation to reflect the real terms in 2018/2019.
The non-affordable housing planning obligations include open space & environment, transport & travel, community works, education and other obligations.
The value of agreed planning obligations reported in this row excludes the results from London LPAs.
Source: LPA Survey 2016/2017 and 2018/2019, MHCLG reports 2016/2017 and 2018/2019, Local Authority Housing Statistics, ONS house price data.
Percentage of LPAs by region in each house price quantile, 2018/2019.
The overall result shows that making CIL available to LPAs in stronger housing markets, especially the top quantile, can increase the average amount of LVC secured. For instance, in 2016/2017, LPAs with average house prices above £3000 m2 recorded an average value of total developer contributions through CIL and S106 of £32.3 million per LPA for authorities that had adopted CIL versus £15.1 million for non-CIL-adopting LPAs. A similar result emerges from the 2018/2019 data set for LPAs with average house prices above £3000 m2 (£29.9 m for CIL and £13 m for non-CIL LPAs).
The average figures in the fourth quantile could be distorted by the fact that this includes London LPAs that have an additional form of LVC applied to development in the form of ‘Mayoral CIL’ that is exacted by the Mayor of London and does not apply outside London. Still, the findings are robust by excluding the contributions of London LPAs in the fourth house price quantile with the result that CIL-adopting authorities in this quantile secured £9.8 m whilst non-CIL-adopting authorities were able to capture £5.4 m in 2016/2017. Applying the same method for the top quantile (excluding London authorities) for 2018/2019 produces similar results: CIL-adopting authorities secured £12.9 m whilst non-CIL-adopting authorities captured less than half this sum, £6.2 m.
The difference between CIL and non-CIL LPAs in the average value of total exactions secured is less obvious across the first to third house price quantiles. For example, in 2016/2017, non-CIL-adopting LPAs in quantiles two and three on average secured larger exactions than equivalent CIL-charging LPAs, whilst CIL-charging LPAs in quantile one secured larger exactions than the non-CIL LPAs. By 2018/2019, the non-CIL LPAs in quantiles one and two recorded larger exactions than the CIL-charging LPAs. However, non-CIL-adopting LPAs in quantile three secured less than CIL-charging LPAs. This mixed portrait potentially reflects the adoption of CIL by authorities between 2016/2017 and 2018/2019. As adopting authorities will have made the self-assessment that CIL represented a viable charge on development this might explain why CIL authorities in quantiles two and three performed relatively better in comparison with non-CIL-adopting authorities in 2018/2019 than in 2016/2017.
With respect to a comparison of the agreed value of S106 affordable housing between CIL- and non-CIL-charging authorities, there is evidence of a trade-off effect between CIL and S106-funded affordable housing in relation to house prices. The CIL-charging LPAs from the first to third house price quantiles on average secured less affordable housing than the non-CIL-charging LPAs in 2016/2017. The same finding can be observed with respect to the first and second quantiles in 2018/2019. To illustrate, the implications of the decision to adopt CIL or not we can consider a counterfactual analysis using the results in Table 4. A non-CIL-charging LPA from the first quantile was able, on average, to secure £3.1 m in S106 affordable housing contributions in 2016/2017. If the same authority adopted CIL subsequently it would be expected to secure £1.5 m in affordable housing contributions in 2018/2019. However, the LPA would have been able to exact £5 m from affordable housing if it had remained as a non-CIL-adopting LPA. The findings for LPAs in the second house price quantile obey the same pattern. Yet, for those in quantiles three and four, the scenario is reversed. For example, a non-CIL-charging LPA from the third quantile secured £7.8 m in S106-funded affordable housing contributions in 2016/2017. If the same LPA subsequently adopted CIL it would be expected to secure £8.1 m in S106 affordable housing in 2018/2019, whereas it would only have been able to exact £6.1 m in the event that it had remained a non-CIL-charging authority.
This counterfactual analysis indicates that there may be a trade-off effect between CIL and in-kind contributions resulting through S106 in CIL-adopting authorities where markets are weaker. Such authorities are primarily located in the North West, North East, East Midlands, West Midlands and Yorkshire and The Humber (see Table 5 for the distribution of house price quantiles by region). By contrast adopting CIL in LPAs where development viability is stronger may make it possible for LPAs to recover more land value uplift through the use of CIL and S106 in parallel. This may be the effect revealed in the analysis presented in this paper that is observable in the South East and London.
Conclusion
The principal conclusion of this paper is that there is a strong geographic variation in how CIL and S106 interact. At one extreme, in some areas the existence of CIL has provided an additional mechanism by which LVC can be exacted. The adoption of CIL within local authorities with the greatest development viability has not diminished the level of affordable housing that could concomitantly be secured through S106. This may reflect an increased potential to secure a greater proportion of the uplift in land values resulting from planning consent in some parts of England. However, this is conjecture and points to the requirement for further research on the degree to which different approaches to LVC secure relatively more or less of the change in land value attributable to the right to develop.
In other parts of England the situation is very different. LPAs in weaker markets may experience a negative impact on their capacity to use S106 to capture increased land values as a result of adopting CIL. In our analysis this is reflected in a diminished capacity to secure S106-funded affordable housing. The large size and diverse nature of market conditions in English local authorities means that many, even in decile one of the house price distribution, have issues of housing unaffordability in some areas.
The resulting conclusion is that a local authority’s decision regarding whether or not to adopt CIL can have an effect on LVC outcomes and would ideally be guided by the analysis contained in this paper. Local authorities with strong development viability may well be sensible to adopt CIL as it represents an LVC instrument that can generate cash receipts supplementary to in-kind contributions through S106.
A final point on which further research may be required is the degree to which the market variations between LPAs illustrated by our results actually describe a capacity to bargain. Given that S106 contributions are negotiated it must be acknowledged that there is a clear behavioural aspect to how affordable housing contributions are negotiated that may be correlated with prevailing market conditions. LPAs in the strongest markets may be able to maintain (and grow) the levels of affordable housing secured through S106 in combination with CIL as they are bargaining from a position of strength relative to local authorities that have generally lower levels of development viability. Conversely, LPAs in weaker markets may see CIL more readily crowd out S106-secured affordable housing as their capacity to negotiate is weak to begin with and weakened further by the presence of CIL. The findings reported in this paper, together with those of cognate research (Dunning et al., 2019), point to the need for further work on the behavioural aspects of the relationship between LVC processes and built environment outcomes.
Footnotes
Declaration of conflicting interests
The authors declared no potential conflicts of interest with respect to the research, authorship, and/or publication of this article.
Funding
The authors would like to acknowledge the support of two ESRC awards that informed the conceptual and methodological approach taken in this paper: Award number ES/M008444/1, SIMS City: Testing new tools for value capture and Award number ES/T000279/1), Financing clean air: The potential of Land Value Capture to secure sustainable urban development.
The data presented in this paper was collected in the course of a project funded by the UK Ministry for Housing, Communities and Local Government: The Incidence, Value and Delivery of Planning Obligations and Community Infrastructure Levy in England in 2018-19.