
Abstract
As cities resume life in public space, they face the difficult task of retaining outdoor activity while decreasing exposure to airborne viruses, such as the novel coronavirus. Even though the transmission risk is higher in indoor spaces, recent evidence suggests that physical contact outdoors also contributes to an increased virus exposure. Given that streets constitute the largest percentage of public space in cities, there is an increasing need to prioritise their use to minimise transmission risk. However, city officials currently lack the assessment tools to achieve this. This article evaluates the extent to which street segments are associated with spatiotemporal variations of potential exposures of pedestrians to virus transmission. We develop a multi-component risk score that considers both urban form and human activity along streets over time, including (a) an assessment of pedestrian infrastructure according to the average width of pavements, (b) a measure of accessibility for each street based on its position in the street network, (c) an activity exposure score that identifies places along streets where exposure could be higher and (d) an estimate of the number of pedestrians that will pass through each street during weekdays and weekends. We use Amsterdam in the Netherlands as a case study to illustrate how our score could be used to assess the exposure of pedestrians to virus transmission along streets. Our approach can be replicated in other cities facing a similar challenge of bringing life back to the streets while minimising transmission risks.
Introduction
The COVID-19 pandemic underscored the critical link between the urban built environment and public health issues (United Nations, 2020a, 2020b). How we design, build and use cities plays a crucial role in spreading and containing airborne diseases. Many cities embraced the same measure to curb the spread of COVID-19: people should avoid physical contact. As a result, lockdowns and stay-at-home (SAH) orders, with different levels of restrictions and enforcement, were implemented in thousands of cities worldwide. Physical distancing has become the most effective way to reduce the risk of transmission. The association between the number of confirmed cases across Chinese provinces and cases originating from Wuhan (where COVID-19 was first reported in December 2019) provided the first indications that physical distancing would be the critical factor in slowing down virus transmission (Zhao et al., 2020). Even in countries where SAH orders were decentralised, such as the United States, a reduction in mobility resulting from physical distancing (mandated or voluntary) showed a downward effect on disease transmission (Badr et al., 2020).
Transmission risk appears to be higher in indoor spaces than outdoor ones. However, recent evidence shows that exposure to airborne viruses further arises from human population movements between places (Freeman and Eykelbosh, 2020; Jia et al., 2020), making city streets a relevant object of study. Moreover, people tend to use city streets in unforeseen ways: restaurants move their terraces outside, shops require people to queue on the pavement and sports classes move their activities outdoors. This shift in space use causes extra pressure on outdoor public spaces, followed by a potential increase in transmission risk. Simultaneously, city streets are commonly intended to be shared amongst all members of society, and usage of these spaces on a day-to-day basis is unavoidable for many people, which may be especially problematic for vulnerable people who depend on street infrastructure to maintain physical activity and lower the risk of severe chronic diseases, such as obesity (Yates et al., 2021). Given that city streets collectively represent the largest percentage of outdoor public spaces and are potential sources of exposure to airborne viruses through serendipitous or planned interactions, there is an increasing need to prioritise their use to ensure transmission risks are minimised.
As cities resume life in public space by taking steps towards letting people back on the streets and restarting outdoor activities, society faces the difficult task of decreasing potential outdoor exposures to airborne contagious diseases, such as COVID-19. Missteps in the reopening strategies can provoke new spikes of infections. For example, using restaurant activity data in the United States, Glaeser et al. (2020) showed that once restaurants were allowed to reopen, consumers inferred that it was safe to go out and COVID-19 cases increased. Keeping a safe distance is also challenging in many outdoor areas, such as in parks and commercial zones. It can be even more challenging when walking along streets with often narrow pavements. Therefore, the consideration of factors such as the geometry and topology of city streets and their pavements, as well as the human activities occurring along them (or in proximity to them), is critical for cities aiming at providing safe physical distancing measures for pedestrians moving around the city and decreasing exposure and transmission risks. City streets vary substantially across neighbourhoods, yet city officials often lack the tools to propose neighbourhood-specific policies and design local interventions to secure their inhabitants’ safety.
This article introduces a tool for distinguishing streets that cannot safely host outdoor activities, under physical distancing constraints. Specifically, we develop a multi-component risk score to assess pedestrians’ exposure to potential virus transmission along city streets. To that end, we consider several factors pertaining to urban form and human activity along streets over time. First, we include a metric to assess how easy or difficult it is for pedestrians to navigate street pavements using the available pedestrian infrastructure safely. To capture this, we use the average width of pavements to indicate each street segment’s capacity to allow for physical distancing. Second, we incorporate an accessibility metric to measure how accessible a street segment is relative to all other street segments in the street network. This metric captures the likeliness of people from different areas encountering one another on any given street. Third, we consider the concentration and categories of activities (represented by business establishments) along street segments that could result in a higher chance of exposure and virus transmission. Recent studies show that the levels of transmission risk vary by type of activity (e.g. restaurants are associated with higher transmission risks compared to bookshops) (Benzell et al., 2020). Thus, movement to and from high-risk activities can contribute to the spread of the virus to other places (e.g. the streets surrounding it or a person’s residence). Lastly, we incorporate a measurement of the estimated number of pedestrians that will pass through each street during weekdays and weekends. This metric complements the static accessibility measure of our model, as it captures two distinct time periods of pedestrian movement across the city. Moreover, our measure of pedestrian flows captures local visitation differences that take into consideration the location of both amenities and people’s homes, whereas the accessibility component captures broader differences in the street network configuration between the centre and the periphery of the city. By combining these four components, we construct a multi-component risk score that reflects a street’s outdoor activity: it complements the pedestrian accessibility and estimated crowdedness of a street with the space that is available for such crowds while maintaining physical distance, and extends it with the risk associated with specific types of activities these streets host. We use Amsterdam, in the Netherlands, as a case study, because of its rich variation in the street layout and activities of the city. Within the city limits, there is a combination of centuries-old areas with narrow streets, alongside new developments characterised by wider pavements and strictly residential areas.
This research has a twofold contribution: first, it provides novel insight into how the form, structure and dynamics of the urban built environment could be integrated to understand exposure to airborne contagious diseases, such as COVID-19. Second, it introduces a risk-scoring method that leverages a combination of geospatial data to prioritise the use of individual streets by pedestrians. The proposed multi-component scoring method can be used to assess how city streets can ensure lower exposure to infectious viruses, while they resume their liveliness. It could provide city officials with data-driven insights to prioritise areas at risk and implement customised policies and interventions according to different city settings, at the neighbourhood and street-segment level.
The remainder of the article is structured as follows. First, we review the related research on the impact of the urban environment on the spread of COVID-19. Second, we detail the data sources, explain how we construct the four components of the proposed risk score and describe how we integrate the components into this score. Next, we present the results on the assessment of city streets in Amsterdam. We then discuss the outcomes of our analysis, showcase the utility of our method for risk assessment and intervention design and outline the limitations of our approach. Finally, we summarise the conclusions and suggest future lines of research.
Airborne diseases and the city: The case of COVID-19
In airborne diseases, such as COVID-19, the proximity between people in urban environments matters. Initial studies assumed a high correlation between population density and the number of infections. Scholars perceived density as a motive for the migration of city dwellers to suburban areas (Scott, 2020). They pointed out that density should not be blamed without a more comprehensive analysis that includes possible confounding factors. Hamidi et al. (2020) studied 913 US metropolitan counties and found that larger metropolitan areas indeed have higher infection and higher mortality rates. However, density is not a strong predictor, but rather connectivity: in metropolitan areas, cities are interdependent, and people travel for work, education and daily activities, crossing paths and increasing the chances of transmission. Hong et al. (2021) provided further evidence for this by tracking the anonymised smartphone geolocation data of more than 12 million unique users in the New York area. The proposed ‘exposure density’ measure captures the hourly number of unique devices in a 250 m grid cell and shows that areas marked by an increase and decrease in people’s flows correspond to higher and lower infection rates, respectively, as opposed to population density. Moreover, Adlakha and Sallis (2020) have also pointed out that density benefits are likely to play out in the long run, because denser areas tend to offer pedestrian-friendly streets, access to transit and mixed-use areas at walking distances that bring healthier habits.
In contrast, Jia et al. (2020) used data obtained from more than 11 million geo-located mobile phone records to measure population flows from the city of Wuhan to other Chinese cities, to capture the spatiotemporal dynamics of the spread of the novel coronavirus. The results show that population flows from the epicentre of the novel coronavirus can predict local outbreaks in other cities better than the population density of the cities where the outbreaks occurred. Zhang et al. (2020) provide further evidence showing that reducing interaction with people outside one’s household led to a corresponding dramatic reduction of coronavirus transmission. The prominent role of connectivity and human mobility dynamics is also attested by Kraemer et al. (2020) and Chinazzi et al. (2020).
Drawing on the research mentioned above on COVID-19 and the city, three aspects stand out. First, city form matters for public health both in the short and long term. Second, while data-driven research has helped us understand the COVID-19 crisis and its relation with the city, literature about how it might change the way we use and live in cities is inevitably speculative (Honey-Rosés et al., 2020; Mehta, 2020). Finally, there is a gap between our understanding of COVID-19 and its relation to the built environment. This article complements the existing literature by providing a methodology that can be useful for city managers looking to assess the risk associated with the use of city streets by pedestrians. Importantly, our approach focuses on characterising urban form and its use, which can provide valuable insights both in the short and long term. In the short term, our methodology can help planners and policy makers understand how to minimise potential exposure to virus transmission while maintaining the liveliness of the city. In the long term, our approach can help cities to secure healthier urban environments against future airborne contagious diseases.
Constructing the multi-component risk score
This section outlines how we construct and combine the four components comprising our risk scoring method for assessing how city streets can lower the potential exposure of pedestrians to airborne viruses. To define a consistent unit of analysis across the four components, we aggregate data for each component at the street-segment level, using OpenStreetMap (OSM) – an open-source mapping platform that collects geographic information. We filter the OSM street segments and keep only those segments that are accessible to pedestrians. In particular, we use the OSM street category that outlines the use of the street to exclude from the analysis streets categorised as motorways, service roads and cycleways, among other categories unrelated to pedestrian movement. In total, our resulting sample includes 56,904 street segments usable by pedestrians within the municipal boundaries of Amsterdam. 1 In addition to street network data, our multi-component risk score includes data on points of interest (POIs), land use and population statistics, which are used to calculate each of the four components outlined in the following paragraphs.
Pedestrian infrastructure: Pavements
The first component measures how easy or difficult it is for pedestrians to safely navigate street pavements using the available pedestrian infrastructure. The rationale is that when pavements are wider, it is easier for pedestrians to walk past each other at a safe distance. To calculate the average width of pavements, we extend a method developed by Harvey (2020), which classifies urban streets according to their average width. The assessment of available pedestrian infrastructure in terms of its capacity to provide safe physical distancing is carried out in three steps. First, we extract streets where pedestrians have priority from the open Dutch land use dataset Basisregistratie Grootschalige Topografie (BGT) (Kadaster, 2020a). These include footpaths (on stairs), pedestrian areas and living streets. Excluded are, for example, adjacent vegetation and parking spots. Second, we calculate the average width of each pavement by computing the street space that is perpendicular to the centreline of each street within the boundaries defined by the pavement. 2 Finally, we calculate the pavement width for each street segment by taking the average width of all pavements in direct proximity (within a radius of 5 m of the street segment) and normalise it by the sum of the corresponding pavement lengths. 3 This approach allows us to calculate the average pavement width for 94% of street segments within the Amsterdam municipal boundaries. 4
Street integration
The second component assesses the extent to which the relative position of the street in the network facilitates access to and from various areas of the city. In particular, we assess this by measuring integration– a graph-based network centrality metric – using Amsterdam’s street network obtained from OSM. The integration measure describes how close each street is to all other ones and describes how likely it is for people from different areas of the city to encounter one another on a given street. We compute a street’s integration as the total metric distance required to reach all streets in a network from any given street. That is, we quantify the minimal distance separating each street, measured through the street network. 5 We specify an infinite search radius to reach all streets in the street network of the city and its direct surroundings.
Activity exposure
The third component is the activity exposure score that measures the presence of businesses that could result in a higher chance of spreading COVID-19 along street segments. When people move through the city after being in specific locations, they are more likely to carry and spread COVID-19 to other places (Jia et al., 2020); this exposure score is a proxy of such potential spread. To construct this metric, we first query the Foursquare API (Foursquare, 2020) and retrieve 42,698 business-related POIs within our study area. We then assign each business in our sample to an activity exposure score. To do this, we employ the ‘Cumulative Danger Due to the Proximity Index’ introduced by (Benzell et al., 2020), which uses 47 million smartphone devices in the United States to infer an associated risk of 26 business categories. This measure captures the risk of transmission and considers the total number of visits, the social-demographics of visitors, the time of day of visits and the length of visits. Each business category is assigned a risk score, which ranges from 1 to 25. For example, the highest risk score (25) represents businesses such as sit-down restaurants with a higher risk of COVID-19 transmission. Conversely, office supply stores are examples of lower-risk businesses. We then match each POI in our sample to one of these risk scores using their business category. Overall, we matched 18,935 out of 42,698 POIs. We assign a conservative score of 1 to the remaining POIs (mostly office spaces) to account for the fact that these establishments attract more than one person and, therefore, pose transmission risk. The resulting data contain each business in our sample and its corresponding risk score.
Finally, to aggregate the assigned risk of each business to the street segment (i.e. our unit of analysis), we match each business and its corresponding score to its nearest OSM street segment, and then sum the total score for each segment. We then normalise it by dividing the total activity exposure risk score by street segment length. The resulting activity exposure score measures low and high risk based on the type of business that the streets hold.
Estimated pedestrian flows
The fourth component estimates the number of pedestrians that will pass through each street segment when moving from one place (i.e. residence) to another (i.e. place of interest). Contrary to street integration, which is used as a proxy for people flows at the urban level, the pedestrian flows component captures the estimated local pedestrian traffic, by incorporating a distance decay effect. 6 We estimate pedestrian flows per street segment by constructing a measure that captures the number of pedestrians that are likely to pass through a street segment at location i when walking from their origin to their destination locations. To construct this measure, we use the Urban Network Analysis (UNA) toolkit (Sevtsuk and Kalvo, 2015). In particular, this toolkit calculates pedestrian flows using the following equation:
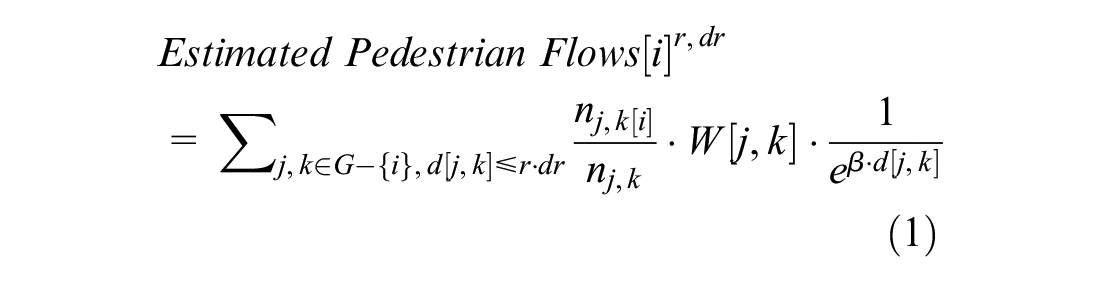
For each location i, this equation sums over all potential origins j and destinations k such that i lies within an admissible path between j and k. Admissible paths are those whose distance is, at most, a factor of dr (the detour ratio) from the shortest path between j and k (the radius r). The formula then accounts for the share of admissible paths between j and k that pass through i (the term nj,k[i]/nj,k) multiplied by the total number of commuters of origin j and destination k (the W[j,k] term) and discounted by the distance between j and k, using an exponential specification with decay β 7 (Sevtsuk and Kalvo, 2015).
We estimate the pedestrian flows for two scenarios: the weekday, which includes businesses that are open at least one day between Monday and Friday; and the weekend, which includes businesses that are open at least one day between Saturday and Sunday. To make the estimation more realistic, we weigh origins and destinations. In particular, we weigh origins using the number of residents leaving an origin and weigh destinations by their attractiveness, based on establishment-level attributes that we obtained from Foursquare, as further explained in the following paragraphs.
To define the residential origins and their corresponding population, we follow a series of steps. First, we use the Dutch open cadastral dataset Basisregistratie Adressen en Gebouwen (BAG) (Kadaster, 2020b) 8 to obtain a full list of all the residential buildings and addresses in our study area. 9 In total, our study area contains 436,295 residential addresses located across 111,533 buildings. Then, we obtain population data from the Dutch population statistics dataset by the Dutch Central Bureau of Statistics (CBS) containing the number of residents for 457 neighbourhoods in our study area. 10 To assign each address to its corresponding population, we first calculate the number of inhabitants per address by dividing the total neighbourhood population over all addresses within that neighbourhood, weighted by address floor area. Then, we sum up the values of all addresses within a building into an estimated number of inhabitants per building. We use this sum as the population weight for the origins.
To define the destinations, we use information from the 42,698 POIs obtained from Foursquare, including category, opening hours, location (i.e. latitude and longitude) and review attributes such as score, photo score and tip score. We construct an attractiveness weight for each POI destination by combining three Foursquare review attributes: likes score, photos score and tip score. Here, we follow previous work documenting that these three attributes combined provide a good indication of the attractiveness of a place (Luca, 2016). The resulting score captures POIs that generally attract human activity within the city. For example, POIs with the highest weights include popular places such as the Heineken Experience, Amsterdam Central Station, Rijksmuseum and Van Gogh Museum. Conversely, POIs with the lowest attractiveness weights include dentists, driving schools and tourist information centres. These weights are mapped to the number of pedestrians going to destination k by raising the attractiveness weight to the alpha power, where alpha equals 0.37, validated in the retail context (Sevtsuk and Kalvo, 2018).
Combination of components
To finally produce our multi-component score for each street segment, we combine the various components described in the previous paragraphs. We first normalise the scores from all the components so that each component is scaled between 0 and 1. We then bin the data into quartiles: the lower quartile of values is mapped to a score of 0, the upper quartile to 1 and the remaining values to 0.5. Contrary to the other components, the pavement width-related risk score corresponds to high risk when the pavement width value is low. Therefore, the corresponding normalised score is inverted so that a high value corresponds to high exposure, as is the case with the other components. We combine each of the four risk components according to the following equation:

Where iPW denotes the inverse pavement width, AE the activity exposure score, I the street integration metric and EPF the estimated pedestrian flows. To account for temporal variations, we calculate two exposure risk scores: one for weekdays and one for weekends. This time differentiation is achieved by filtering business venues (used as destinations) according to their opening hours. In this model, we use equal weights (i.e. 0.25), which assumes that all of the four components are equally important in determining exposure risk. These weights could be altered to account for the possibility that some of these components may be more important than others. For example, if one assumes that the risk of transmission due to narrow pavements is small, one should lower the pavement width’s weight relative to the other components.
The calculation of the multi-component score can be replicated in cities worldwide, where these data sources are available – and most of them are widely available. Foursquare POI data, for example, is available in more than 190 countries around the world, 11 and the OpenStreetMap street network covers more than 40% of all countries worldwide (Barrington-Leigh and Millard-Ball, 2017). The only data source that is not widely available is land use data, including pavements – although this data can often be found directly at municipal planning departments in several countries worldwide.
Assessing exposure of pedestrians to virus transmission along the streets of Amsterdam
This section provides an overview of the application of our proposed multi-component risk score in Amsterdam. Figure 1 illustrates the spatial distribution of each component.
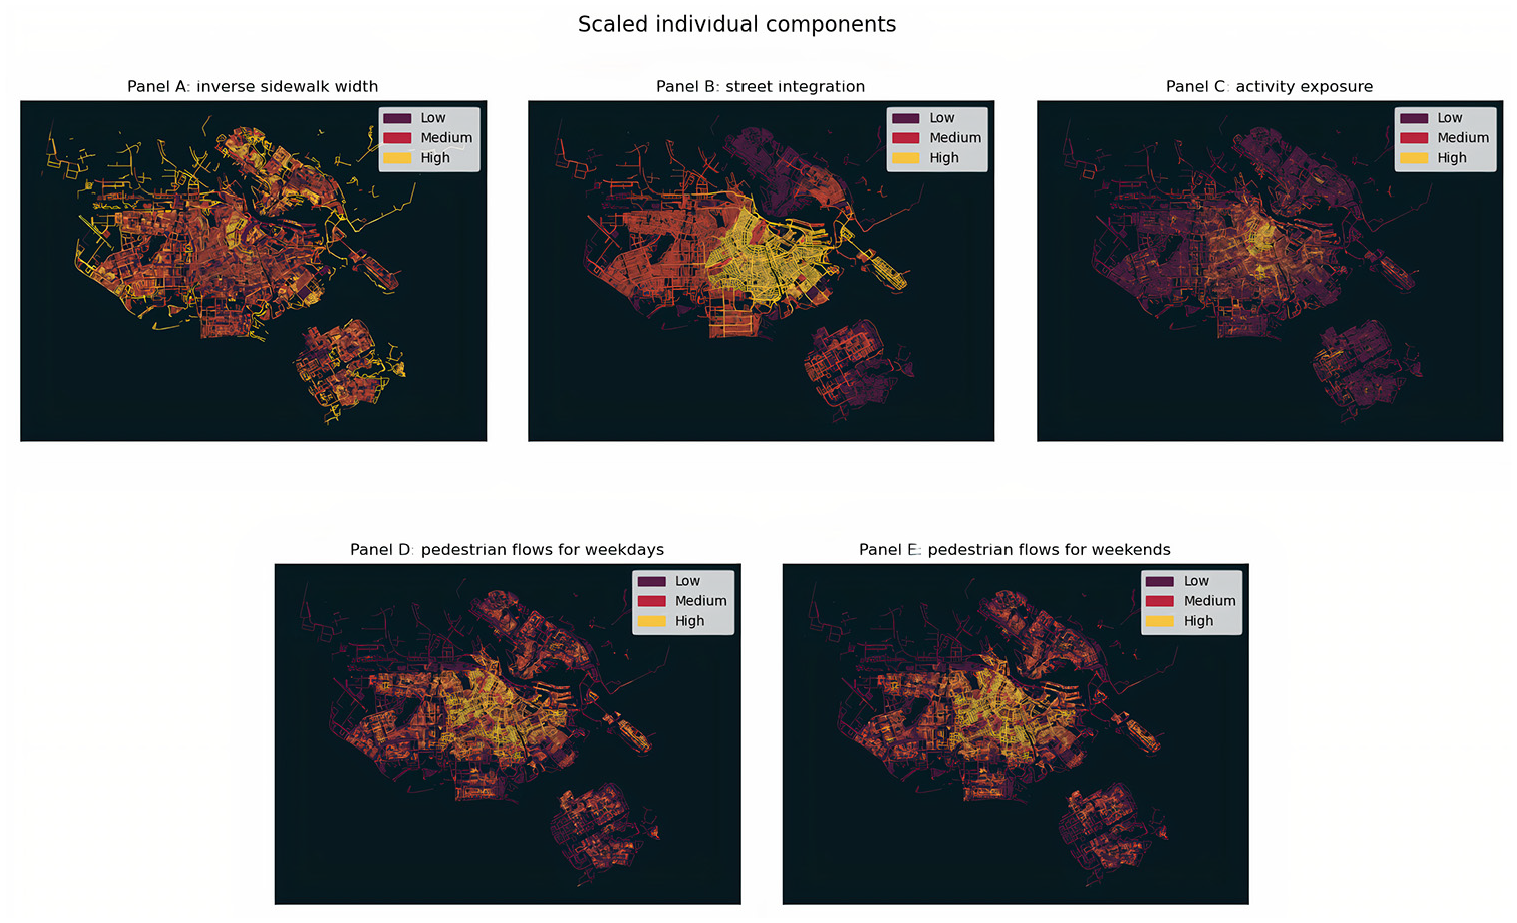
Individual components, scaled between 0 and 1. (A) Inverse pavement widths. (B) Street integration. (C) Activity exposure. (D) Estimated pedestrian flows for weekdays. (E) Estimated pedestrian flows for weekends.
Panel A shows that the pedestrian infrastructure varies widely throughout the city. Panels B and C show that streets with higher street integration and activity exposure are more likely to be found in the centre of the city and in adjacent areas in the South and East – where recent residential development has taken place. Finally, Panels D and E show the pedestrian flows estimated for the weekdays and the weekends, respectively. As previously explained, time differentiation was done by filtering businesses (used as destinations) according to their opening hours. Together, the two panels illustrate that the estimated number of pedestrians tends to be higher towards the city centre, relative to the outskirts of the city. However, there is also variation found in the North and South East parts of the city.
Figure 2 maps the resulting estimated exposure risk score for weekdays and weekends.
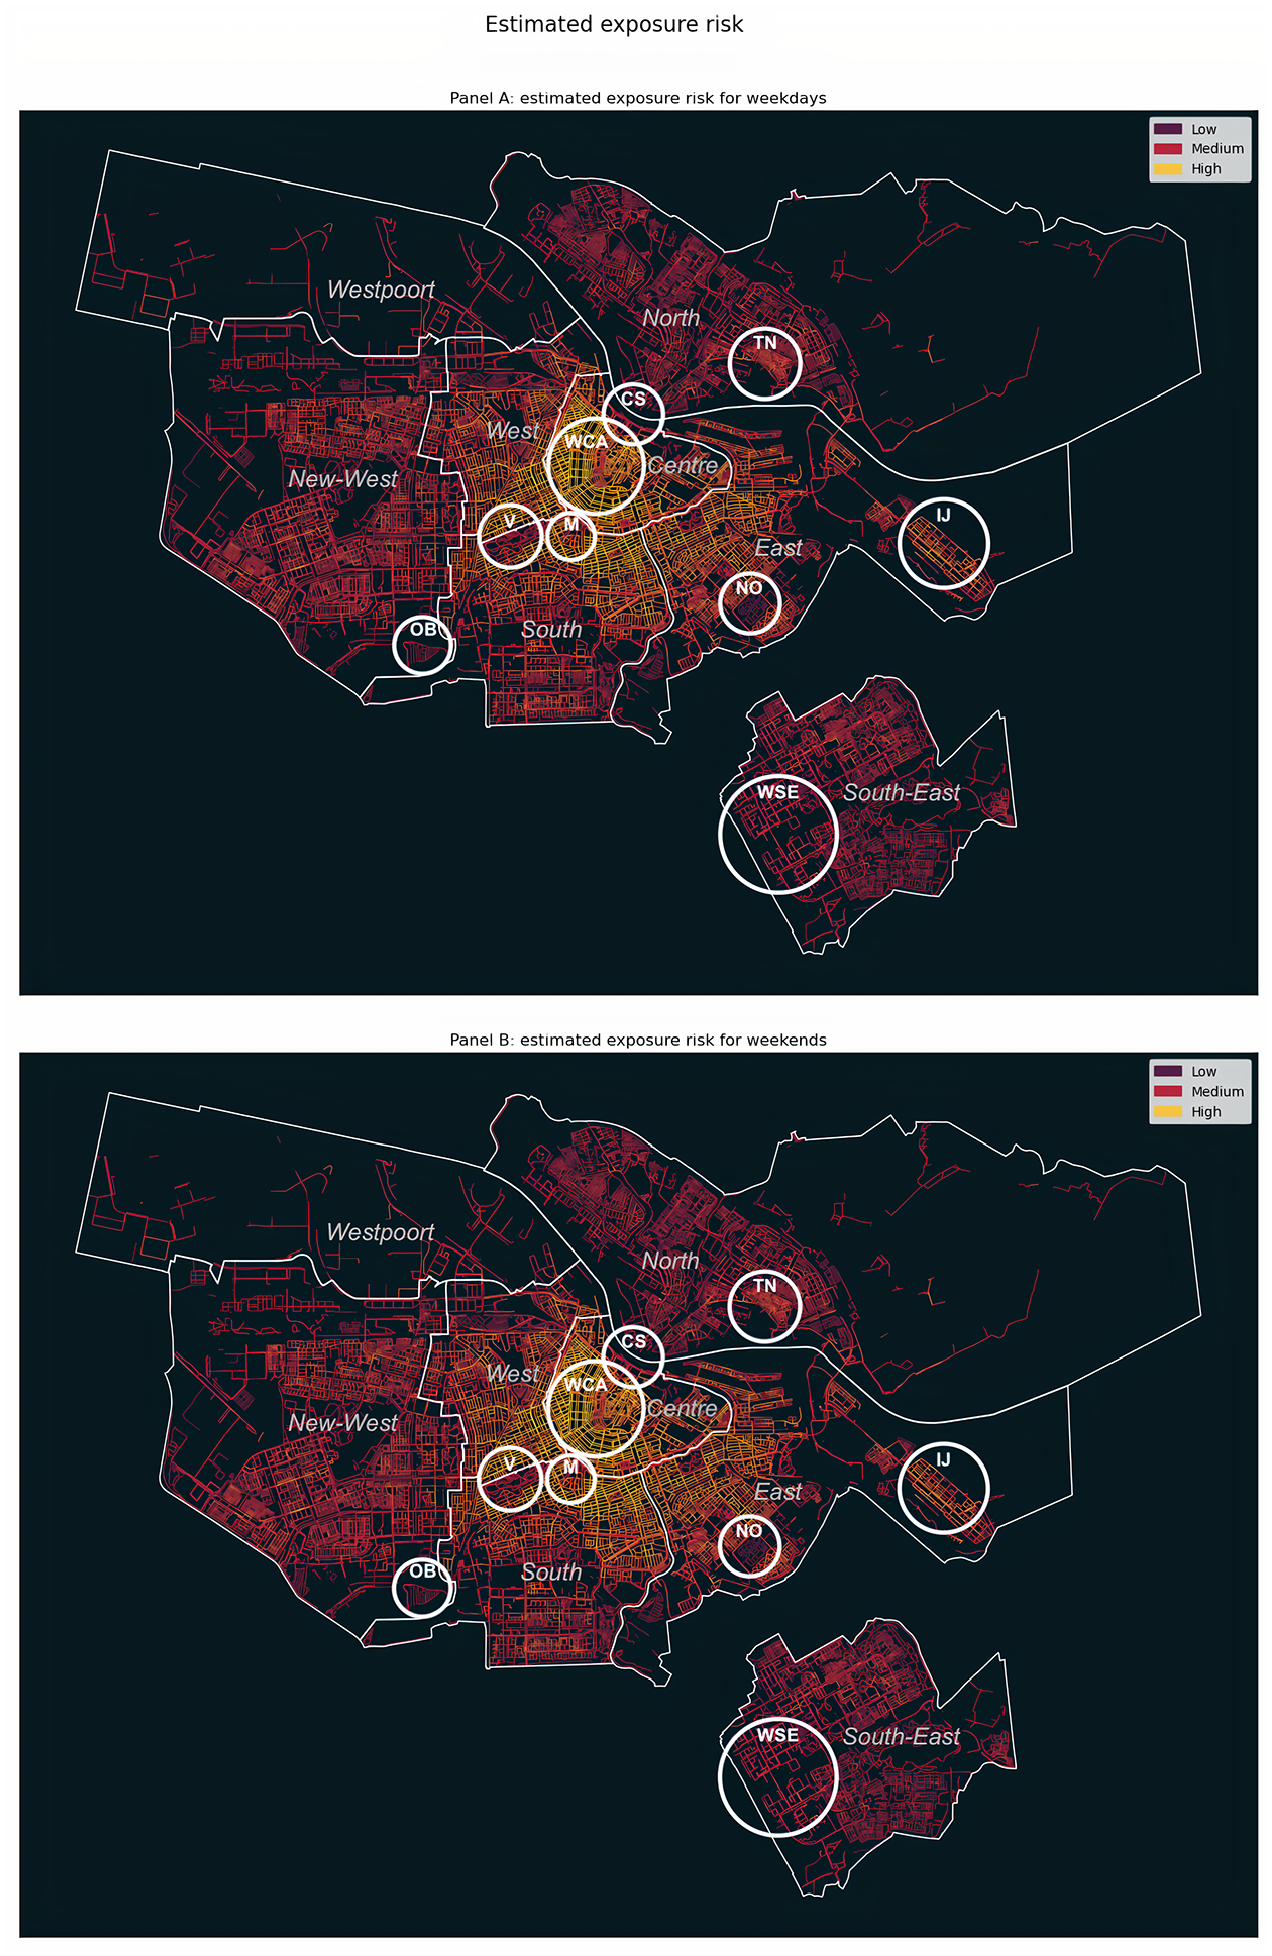
Estimated pedestrian exposure for weekdays (A) and weekends (B). Focus areas are represented in white circles reflecting the neighbourhood extents, and the Amsterdam administrative boundaries are represented in thinner white lines.
The figure shows that street segments with the highest score, for both scenarios, concentrate in the centre of Amsterdam and, more specifically, in the Wallen and the Canal Area (WCA). In several streets in these areas, the estimated weekday exposure risk is lower than the weekend one. The high-risk score in these areas can be explained by the high attractiveness of the area relative to its existing infrastructure. Although this area has plenty of streets with adequate pavements that allow for physical distancing, the high street integration, in combination with the concentration of highly attractive business venues (high activity exposure), can lead to increased pedestrian flows over time and, subsequently, to the observed high exposure risk. Areas of the city adjacent to the centre, specifically the West, South and East parts, show relatively high risk as well, which can be explained by streets being very connected (high street integration), subsequently attracting a large number of pedestrians – as revealed by the high estimated pedestrian flow in these areas. Another notable example of high exposure risk is IJburg (IJ), a newly created island on the East side of the city, where high street integration and pedestrian flows cannot be compensated for by its wide pavements. The patterns of risk in the North, New West and South East parts of Amsterdam, developed primarily for residential purposes, are also high but more geographically clustered relative to all other areas. In particular, exposure risk scores are high in street segments where most of the business activity is concentrated (high activity exposure).
Areas around city parks and large outdoor public spaces, such as Oosterpark (O) and Vondelpark (V), rank medium-to-low with respect to exposure risk. Despite being adjacent to high-risk neighbourhoods, the activity along the Oosterpark and Vondelpark streets is low compared to their surroundings. Similarly, the Museum Square (M) and the Central Station (CS) areas also rank low, owing primarily to wide pedestrian areas and limited estimated activity exposure and pedestrian flows.
Areas that rank relatively low concerning our score are found in the North, where street integration, activity exposure and the estimated pedestrian flows are low. An exception is Tuindorp Nieuwendam (TN), which is characterised by a dense network of narrow streets that substantially limit the number of pedestrians that can use them. Other examples of low-risk neighbourhoods are found in the South East parts of the city. a notable case is the Western neighbourhood of the South East part of the city (WSE), where large venues, such as sport parks, large furniture malls, hotels and event locations (i.e. Arena football stadium and the Ziggo Dome concert hall) are located. Although the estimated number of pedestrians is low in these areas, the medium-to-high street integration in combination with the narrow pavements result in an average exposure score.
Finally, Amsterdam’s lowest risk score values concentrate in non-residential areas, such as the Harbour (Westpoort city part) and other industrial areas. Other apparent examples of low risk are found in semi-public spaces that have limited connection to the surrounding street network, such as cemeteries (e.g. De Nieuwe Ooster (NO), scoring low in terms of all risk components) and allotments (e.g. Ons Buiten (OB)).
Discussion
The application of our model in Amsterdam and the obtained results illustrate how local differences in the urban built environment and pedestrians’ use are associated with spatiotemporal variations of potential exposure to virus transmission. We show that neighbourhoods with high exposure risk are mainly characterised by streets with high street integration (i.e. high connection to the surrounding street network) and high estimated pedestrian flows. Conversely, streets characterised by low street integration, combined with a limited amount of estimated pedestrian flows and attractive businesses, yield a lower exposure risk score. The contribution of narrow pedestrian infrastructure to an overall high-risk score only occurs sporadically across the geographic area under study. We also show that, on several occasions, the different risk components we consider tend to complement each other. That is, high values of one component may be compensated for or reinforced by the other ones. In practice, this would mean that policy aiming at mitigating the exposure risks associated with pedestrian movement should not only provide more space to pedestrians (e.g. by expanding pedestrian infrastructure through temporary street closures, such as the case discussed later on in this section), but also reroute pedestrian flows across the different neighbourhoods, while further considering activity-related characteristics (e.g. type of businesses). These results provide complementary evidence emphasising street configuration and pedestrian movement as crucial factors when studying the impact of the urban environment on the spread of airborne diseases, such as COVID-19 (Oosterlee et al., 1996).
To qualitatively showcase the utility of our exposure score in terms of risk assessment, we juxtapose the obtained risk estimates with several additional socioeconomic and demographic risk factors in Amsterdam, which recent literature considers as some of the core factors underlying risk of COVID-19 hospitalisation and death (Caul, 2020; Docherty et al., 2020; Dowd et al., 2020; Verhagen et al., 2020). These factors concern public health indicators that could increase risk exposure. Thus, an analysis of their relationship with our risk score highlights opportunities for utilisation of our method in complex, multi-layer assessment of COVID-19-related risks. Drawing on literature, we specifically employ (1) the deprivation index, (2) residents’ diabetes (type II) records, (3) residents’ asthma records and (4) intergenerational households, focusing specifically on residents above 60 who share housing space with people aged between 18 and 40. We use the online hospitalisation pressure risk dashboard of the Amsterdam Health and Technology Institute (AHTI, 2020) to extract these additional risk factors. The dashboard provides risk information at the neighbourhood level, whereas our risk estimates are at the street-segment level. To ensure a common unit of analysis, we aggregate our obtained street-based risk estimates from the multi-component score into the 479 neighbourhoods of Amsterdam.
We observe that medical risk factors of residents’ diabetes (type II) and asthma, combined with the deprivation index, appear to co-occur with our risk estimates in specific areas of the city, as indicated in Figure 3.
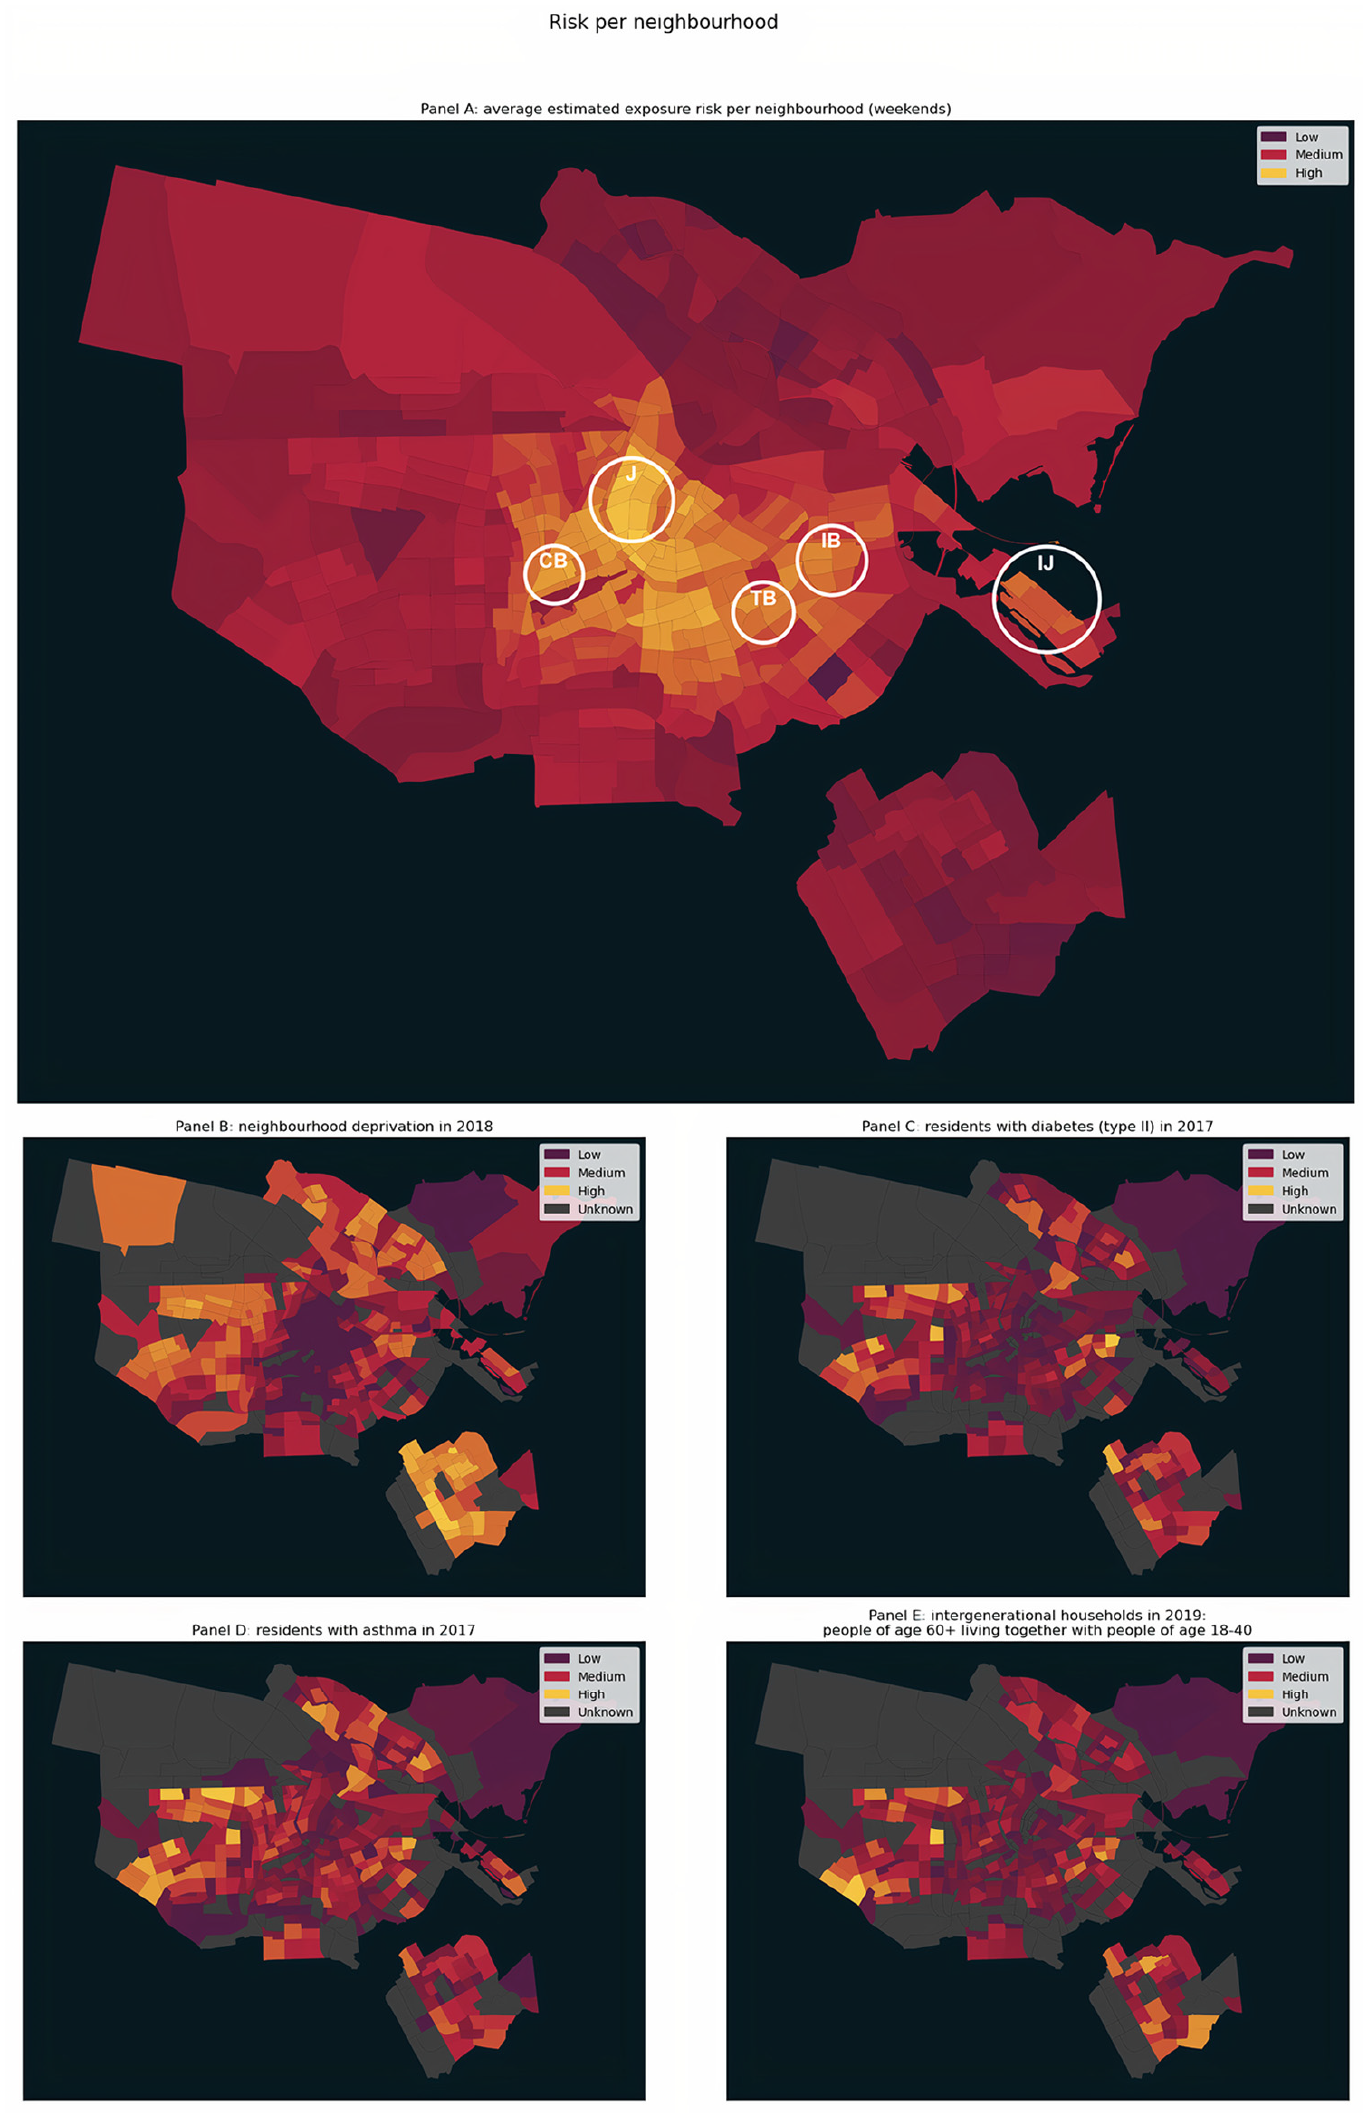
(A) COVID-19 related risk per neighbourhood: average estimated risk. (B) Neighbourhood deprivation. (C) Residents with diabetes type II. (D) Residents with asthma. (E) Intergenerational households where people aged 60+ live together with people aged 18–40.
One example is the Jordaan (J) area, which is centrally located and is further characterised by narrow streets and several popular businesses. Jordaan is amongst the areas with the highest risk score values in the city. At the same time, it shows a relatively high number of asthma records. The co-occurrence in this area of a high exposure risk score with risk factors is an indication of potentially increased levels of infection risk, that might require targeted policy interventions. Other examples include the IJburg (IJ) area, a relatively new human-made island in the East of the city, and the surroundings of Cremerbuurt (CB) in the old Western part of the city, which is recently gaining in popularity. Similarly, Indische Buurt (IB) and Transvaalbuurt (TB) are both characterised by relatively high-risk score values and records of asthma and diabetes, as well as an increased number of intergenerational households and neighbourhood deprivation. It is interesting to also observe the presence of areas, like the New West, South East and North parts of the city, where there are relatively high asthma, diabetes and intergenerational households’ records, but our estimated risk score values are either average or low. In these areas, interventions on streets might still be needed due to the health-related risks, but are less urgent given their spatial properties.
An advantage of our methodology is that it enables the characterisation of streets and their use by pedestrians at a very granular level (i.e. street segments), as opposed to approaches examining exposure risks at the neighbourhood or regional level. This can be particularly useful when designing policies and interventions for slowing the spread of infectious diseases such as COVID-19. These policies can be refined according to the characteristics of streets, such as their geometry and position in the street network and the type of business venues they hold. Moreover, the granularity of our approach can enable planners and policy makers to easily target specific street segments that are at high risk. Identifying street segments with common characteristics across different neighbourhoods can assist governments in the implementation of interventions that prioritise street use while minimising exposure risk. Lessons learned from successful interventions can be extended to those streets sharing similar characteristics.
We qualitatively evaluate our risk score, in terms of its potential to inform urban design interventions, by assessing local interventions implemented by the municipality of Amsterdam in July 2020. In Amsterdam, as well as in the rest of the Netherlands, interventions in public outdoor space focus on securing physical distance between people, rather than, for example, obliging face masks. The interventions implemented in Amsterdam concern specific crowded streets and are aimed at facilitating pedestrians and cyclists to better conform to the physical distancing rules (Gemeente Amsterdam, 2020b). In particular, bicycle traffic moved to car lanes so that pedestrians could use both pavements and adjacent bicycle paths, and restaurants and cafes could use pavement spaces as terraces. The municipality identified two high-risk streets and temporarily implemented these measures over the summer of 2020. The streets are, namely, Jan Pieter Heijestraat and Eerste van Swindenstraat. They are characterised by a series of local shops and restaurants. Jan Pieter Heijestraat lies on the border of Cremerbuurt (CB) and the Eerste van Swindenstraat lies directly west of Indische Buurt (IB), both highlighted in Figure 3. The interventions along these streets provided pedestrians and visitors with more space to keep distance from each other. However, their temporary character sometimes resulted in chaotic situations for other street users, such as cyclists, when traffic increased by the end of summer. Our multi-component score estimates that the exposure risks during the weekend are 0.85 and 0.94 on average, respectively for Jan Pieter Heijstraat and Eerste van Swindenstraat. Moreover, 39% and 53% of the segments comprising these streets, respectively, are estimated to score the maximum risk value (i.e. 1). This example illustrates that our method can capture and identify areas with high-exposure risk at a very granular level.
There are several limitations in this study that could be addressed in future research. First, in measuring the accessibility of each street segment based on its relative position in the street network, we only considered street-based connections. However, in the case of Amsterdam, the connection between the South and North parts of the city is primarily carried out using ferry connections, which we did not consider in this work, due to lack of available data. Second, the risk score used to calculate the activity exposure component was not available for every business category (we eventually matched 44% of total businesses in our sample). This resulted in us having to impute a risk value of 1 to the remaining business categories (e.g. offices). We expect that some of these business categories might have a risk score higher than 1 but we could not assess this due to limited empirical evidence linking exposure risk to different types of establishments. Third, we defined a set of proxies (i.e. likes score, photos score, tip score) to estimate the attractiveness of a business, based on existing literature (Luca, 2016). However, some business categories, such as dentist offices and schools, often lack these attributes on Foursquare. Fourth, we observed limited temporal variation between weekdays and weekends, even though this may be related to the lack of accurate Foursquare data on visitation patterns. In reality, we expect that this temporal variation would be higher than the one documented in this article. Fifth, due to a lack of related data, we did not take into account the effects of national and local measures to curb the spread of COVID-19 or changes in visitation patterns during the pandemic on the attractiveness and (adjusted) opening hours of POIs. The POIs were collected from Foursquare in July 2020. During this period, most POIs in Amsterdam – including restaurants and shops – were open, though under physical distancing restrictions. However, the multi-component risk score could be further improved by allowing for variation in the considered POI types, their associated attractiveness and their visitation patterns adjusted to the situation at hand, should related data be made available. Lastly, granular data at the household or neighbourhood level on actual infections and human behaviour (e.g. the use of masks) were not publicly available to inform our score. In practice, this means that we consider every potential movement from a residence (origin) to a POI (destination) equal, in terms of the risk it entails. Access to data on actual infections and footfall would allow future work to weigh pedestrian flows from high-risk areas to POIs differently from those originating from low-risk areas. Moreover, incorporating these data could extend our methodology by capturing temporal changes that go beyond weekday and weekend variation. Finally, future work could incorporate other risk factors such as population demographics (e.g. age, income, employment status, household formation) and seasonal changes in our multi-component scoring method.
Conclusion
In this article, we leveraged a combination of high-resolution geospatial data to explore how the form, structure and dynamics of the urban built environment could be integrated to understand risk factors for airborne diseases, such as COVID-19. We developed a methodology comprising several metrics that capture potential risks associated with pedestrian movement along street segments, considering the available pedestrian infrastructure, the concentration of POI venues along the street network and their interconnectedness. Our methodology has practical value for city officials, who can use it as a tool to assess potential exposure to airborne viruses at the street level, and ensure safe physical distancing, both in the short and long term. By providing insights into the urban form and its use, it can facilitate identifying areas at risk and, correspondingly, the implementation of customised physical distancing policies and interventions according to different city settings, at the neighbourhood and street-segment level. Having a more thorough understanding of the urban street network and of how people move along streets could help keep the city lively and active, while potentially curbing the spread of infectious diseases. The method developed in this article can be replicated in other cities facing a similar challenge of bringing life back to the streets while minimising exposure risks. For this reason, we aim to strengthen the generalisability of our approach by extending our experiments to other cities.
Footnotes
Declaration of conflicting interests
The author(s) declared no potential conflicts of interest with respect to the research, authorship, and/or publication of this article.
Funding
The author(s) received no financial support for the research, authorship, and/or publication of this article.