
Abstract
In March 2020, many workers were suddenly forced to work from home. This brought into stark relief the fact that urban economic activity is no longer attached to specific workplaces. This detachment has been analysed in research on organisations and workers, but has not yet been incorporated into concepts used to document and plan the economic geography of cities. In this article, three questions are explored by way of an original survey: first, how can a shift in the location of economic activity be measured at the urban scale whilst incorporating the idea that work is not attached to a single location? Second, what is the nature of the shift that occurred in March 2020? Third, what does this tell us about concepts that have underpinned the study of urban economic form by geographers and planners? Applying concepts developed in organisation studies and sociology, we operationalise the idea that economic activity happens across multiple spaces: it occurs within a probability space, and since March 2020 it has shifted within this space. To better understand and interpret the longer-term impact of this shift on cities – downtowns in particular – we draw upon interviews with people working from home.
Introduction
Although there is a long tradition in organisation studies, sociology and social geography of examining the mobility (or not) of workers as they work (Felstead et al., 2005; Laurier, 2001), in economic geography and planning this been downplayed, with a few exceptions associated with transport (e.g. Dijst, 2004; Mokhtarian, 1998; Schwanen and Kwan, 2008). When economic geographers and planners conceptualise the location of economic activity, they focus on place-of-work, that is, the usual place (such as a shop, factory or office) where a worker works most of the time (e.g. Florida and King, 2018; Monkonnen et al., 2020; Pan et al., 2020). By extension, it is assumed that economic activity can be mapped, and urban form depicted by aggregating these usual places-of-work.
This approach underpins concepts such as central business districts (CBDs), suburban edge cities and industrial parks – all are locations within cities where economic activities are assumed to occur because employers’ premises are there (Shearmur, 2018). It also underpins ideas that straddle geography and economics such as clusters and buzzing neighbourhoods – identified as spatial concentrations of workers (located at their workplace) within which interactions and collaborations are purportedly facilitated by geographic co-location (Florida and King, 2018; Zandiatashbar and Hamidi, 2018). Dijst’s (2004: 28) observation that ‘a growing number of economic […] activities are no longer linked to fixed geographic locations’ has not been incorporated into these mainstream concepts or into studies of urban form.
In this article, we adopt the assumption, common in economic geography and planning, that the geography of economic activity can be proxied by the location of work activities. However, we argue that concepts developed by organisation scholars and sociologists should inform this assumption. More specifically, we operationalise Shearmur’s (2020) suggestion that planners and economic geographers should view work location as a probability space, an idea that builds upon earlier work in organisation studies (Felstead et al., 2005; Taskin, 2010; Thomsin and Tremblay, 2008) and on more recent survey approaches (EWCS, 2015). This approach is applied in a population-wide survey of Montreal workers, conducted in June and July 2020.
The article has three main goals. The first is to show how concepts such as workscapes (Felstead et al., 2005) and management despatialisation 1 (Taskin, 2010), developed over the last two decades, can be usefully and practically applied to questions commonly explored by economic geographers and planners. The second is to use these tools to decipher how the location of economic activity shifted in Montreal between March and June 2020. The third is to use these results, in combination with office-worker interviews, to reflect upon some of the concepts and assumptions that underpin current understandings of the urban space-economy, and to interpret the changes in work location that have occurred as a consequence of COVID.
In particular, we highlight questions that surround agglomeration effects and local interactions within urban clusters and neighbourhoods. Such questions, already posed by some economic geographers (e.g. Huber, 2012), have gained salience with the advent of COVID: understanding how the location of economic activity has been affected by COVID, and deciphering what this means for the spatial concepts that underpin our current understandings of the urban economy, will help us piece together a post-COVID geography of the urban economy.
Why study the location of work? Workers, organisations and urban form
There are, broadly speaking, two approaches to the study of work location, each focusing on it for different reasons and from different perspectives. On the one hand, economic geographers and planners examine work and workplaces to decipher the spatial structures of urban economies. They observe CBDs (Murphy, 1971), edge cities (Garreau, 1992), business parks (Oh and Jeong, 2007), innovation districts (Katz and Wagner, 2014) and clusters (Florida and King, 2018), measured as spatial concentrations of jobs or establishments. Fixed points in space, such as home and place-of-work, are aggregated to describe urban form, the spatial framework across which processes linked to commutes (Gubins et al., 2019), agglomeration economies (Monkonnen et al., 2020; Pan et al., 2020) and access to opportunities (Zhang and Price, 2020) – for instance – deploy.
Understanding these spatial structures is important from a planning perspective because they connect economic activity with specific places, which can then be planned for or planned around (Pan et al., 2020). Furthermore, spatial behaviours are inferred from these structures: for instance, dynamic interactions between workers and industries are inferred from the spatial agglomeration of economic activities (Pan et al., 2020; Puga, 2010); however, when researchers try to directly observe such intra-cluster interactions they are not always present (Huber, 2012).
On the other hand, and under the impulse of the sociology of mobility (Bauman, 2000; Urry, 2000), organisation studies (Taskin, 2010) and social geography (Laurier, 2001), work has been approached as an activity that deploys across space, occurring in many different places such as cars (Jeyasingham, 2019), trains (Axtell et al., 2008), public spaces (Ng, 2016), semi-public spaces (Ananian et al., 2018), homes (Tremblay, 2002), combinations of these (Lachapelle et al., 2018; Thomsin and Tremblay, 2008) and – of course – places of business (Wheatley, 2020).
Considerable research exists on work–life balance (Felstead and Henseke, 2017), on different ways people combine work and travel (Axtel et al., 2008), on how to manage a mobile workforce (Taskin, 2010), on travel time as a period of social activity (Urry, 2000) and on the geographic instability of gig work (Stevens and Shearmur, 2020). Felstead et al. (2005) encapsulate this in their concept of workscape, the complex landscape of work activity that emerges as work locations interweave with communications technologies. This approach observes the behaviour of workers and of organisations directly, in view of uncovering the managerial and social implications of multi-locational work (Taskin, 2010).
There has not, so far, been much cross-pollination between research that maps and deciphers the geography of economic activity and research that explores how the workplace is evolving; but overlap is occurring as sociologists explore the population-wide incidence and consequences of mobile work (Felstead and Henseke, 2017; Ojala and Pyöriä, 2018) and as geographers become less satisfied with their way of approximating the location of economic activity (Dijst, 2004; Shearmur, 2018) and begin to explore the geography of new workspaces (Ananian et al., 2018; Moriset, 2013).
The advent of COVID has accelerated this overlap. Economic geographers and planners seeking to understand how economic activity deploys across urban space can no longer maintain their approximations. Conversely, the massive changes in workplace organisation mean that organisation and workplace studies now deal squarely with questions of economic geography and urban planning (Pajevic, 2021).
In different ways, therefore, each is called upon to adjust the way they think about and interpret the location of work. The next section briefly outlines how economic geographers and planners could reconsider some of their assumptions and methods.
The impact of COVID on measuring the location of economic activity
Rethinking the homology between usual place-of-work and location of economic activity
Many studies still examine the geography of economic activity through the lens of a usual place-of-work (e.g. Monkonnen et al., 2020; Rammer et al., 2020; Saker, 2020; Sum, 2020). However, it has become clear even to casual observers that economic activity does not necessarily occur at a usual place of business such as a factory, shop or office (Berry, 2020; Thomas et al., 2020): an employer’s address does not provide sufficient information about where work activities are performed.
One of the reasons economic geographers and planners have not incorporated work multi-location into concepts and studies of urban economic form is that, pre-COVID, multi-location remained marginal (Felstead and Henseke, 2017; Putri and Shearmur, 2020). Associating each worker with a usual place-of-work, then aggregating these into maps of economic activity, yielded results congruent with observation and urban economic theory. COVID has revealed this approximation to be tenuous.
From a methodological perspective, a key question relates to how multi-locational work can be conceptualised and measured. Indeed, the measurement of work location in cities remains important for urban planners and geographers: it is not because work is increasingly mobile that it is a-spatial (Jewson, 2007).
We outline below an approach to measuring the location of work recently suggested by Shearmur (2020). It builds upon Felstead et al.’s (2005) concept of workscape, extending the approach adopted by researchers such as Ojala and Pyöriä (2018), Wheatley (2020) and Burchell et al. (2020), and implemented in the European Working Conditions Survey (EWCS, 2015) as well as in some case studies (Thomsin and Tremblay, 2008). These researchers posit a series of locations from which people can perform their work activities: workscapes or trajectories, understood as a mix of locations from which work is performed, are approximated by combining the locations from which people declare that they work.
An alternative to place-of-work: Work location as probability space
Shearmur (2020) suggests that work location should be approached as a probability space. This concept, which does not add much conceptually to the ideas of workscape or multi-location, is useful because it is immediately understandable by statisticians and economists who can envisage ways of measuring and manipulating it. Furthermore, usual places-of-work can easily be incorporated into the concept of probability space.
Indeed, in mathematics a probability space is a set of possible outcomes (e.g. numbers 1–6 for a dice throw). Whilst it is not possible to know the outcome of any specific throw, it is possible to establish the probability of a specific outcome. Likewise, when work is mobile, it is not possible to know exactly where economic activity occurs, but it should be possible to estimate the probability that it is performed at a specific location. If one obtains such information across a population, then it is possible to ascertain, for each location, the probability that economic activity is performed there. In a universe where only usual places-of-work are considered, each worker’s work probability space has only one possible outcome.
In the EWCS (2015: 18), for example, workers are asked about the frequency with which they work at five specific locations. The frequencies are ‘daily’, ‘several times a week’, ‘several times a month’, ‘less often’ and ‘never’. From this it is possible to approximate a probability space: frequencies can be transformed into approximate probabilities, and the five specified locations are the space to which probabilities are assigned.
Shearmur (2020) suggests that, by asking workers to estimate how much time they spend working in each location, a more direct measure of probability can be obtained: the probability that a worker performs work in a specific place is simply the proportion of total worktime spent there (over a predetermined period – a week for instance). This shift in the type of information gathered provides a more direct bridge between usual place-of-work (i.e. a location where it is assumed 100% of work activity occurs) and probability space (i.e. a series of locations where a proportion of work activity occurs, summing to 100% for each worker).
A wide variety of possible probability spaces can be imagined: for instance, the city can be broken down into neighbourhoods (respondents estimate the proportion of worktime spent in each neighbourhood), into different types of workplace (worktime spent at home, in an office, on transport, in cafes …) or into types of neighbourhood (worktime spent in clusters, residential districts, transport networks, parks …).
This approach is particularly useful for understanding the impact of COVID on where people work, because this impact can be conceptualised as a shift of probabilities within a work probability space rather than as an ‘all-or-nothing’ shift from, for example, offices to homes. Even though the change was abrupt for some individuals, at the scale of the city – that is, when aggregating all individual experiences – the change may be more continuous and nuanced.
Data and methods
In March 2020, we (the authors) were about to launch a population-wide survey exploring the variety of different places from which residents of the Montreal CMA (Census Metropolitan Agglomeration) work. Approaching this as economic geographers and planners, our motivation was to better integrate insights from organisation studies, sociology and social geography into our empirical work, and to assess – at the level of the city – how workers combine various work locations. The survey was modified in May to take COVID into account. Responses were gathered between 23 June and mid-July 2020 by a survey firm. The stratified random survey was conducted by telephone, with stratification by economic sector and by age. Half the respondents were contacted by landline, the other half by randomly generated mobile phone numbers (using the Montreal 514, 438 and 450 area codes). Respondents were screened for residence within the Montreal CMA.
The population studied is ‘Montrealers who are employed at the time of the survey in the same job as they had in February 2020’. The restriction is imposed because it is changes in job location that are of interest, not unemployment. Workers who worked fewer than three hours a week (i.e. less than about half a day) have been excluded from the analysis: their time spent in any work location will be small, yet may represent a large proportion of their total worktime. Future analysis will consider this group of low-hour workers separately.
The precise profile of the population from which the sample is drawn cannot be determined because, even in periods of stability, monthly employment estimates derived from the Labour Force Survey are subject to considerable uncertainty (https://www150.statcan.gc.ca/n1/pub/71-543-g/2012001/part-partie7-eng.htm). Were the period stable, this would not be a major issue; however, our study covers an unprecedented shock which hit workers, sectors and localities in different ways (Parker et al., 2020): detailed and reliable local statistics profiling Montreal’s working population in June 2020 do not exist.
Notwithstanding the absence of reliable profiles, by using data from the June 2020 Labour Force Survey (three-month moving averages) and from the 2016 census, we can compare the profile of our sample to some benchmarks. The sample’s composition across economic sectors (June 2020 Labour Force Survey) and sex (2016 census) resembles the benchmarks, with some underrepresentation of the retail, warehousing and transport sector (Table 1). Workers with lower academic qualifications and trades qualifications (2016 census) are considerably underrepresented (Table 1): we will return to this in the analysis because this underrepresentation cannot simply be treated as sampling bias (although this no doubt plays a role). Since our analysis is descriptive, with results disaggregated by group, such bias principally skews aggregate results. The direction of the skew can be assessed by considering the disaggregated results: indeed, since less qualified workers tend not to have shifted towards working from home (WFH), our aggregate results overestimate this shift.
Representativity of sample: Comparison of Statistics Canada data (a) with survey (b).
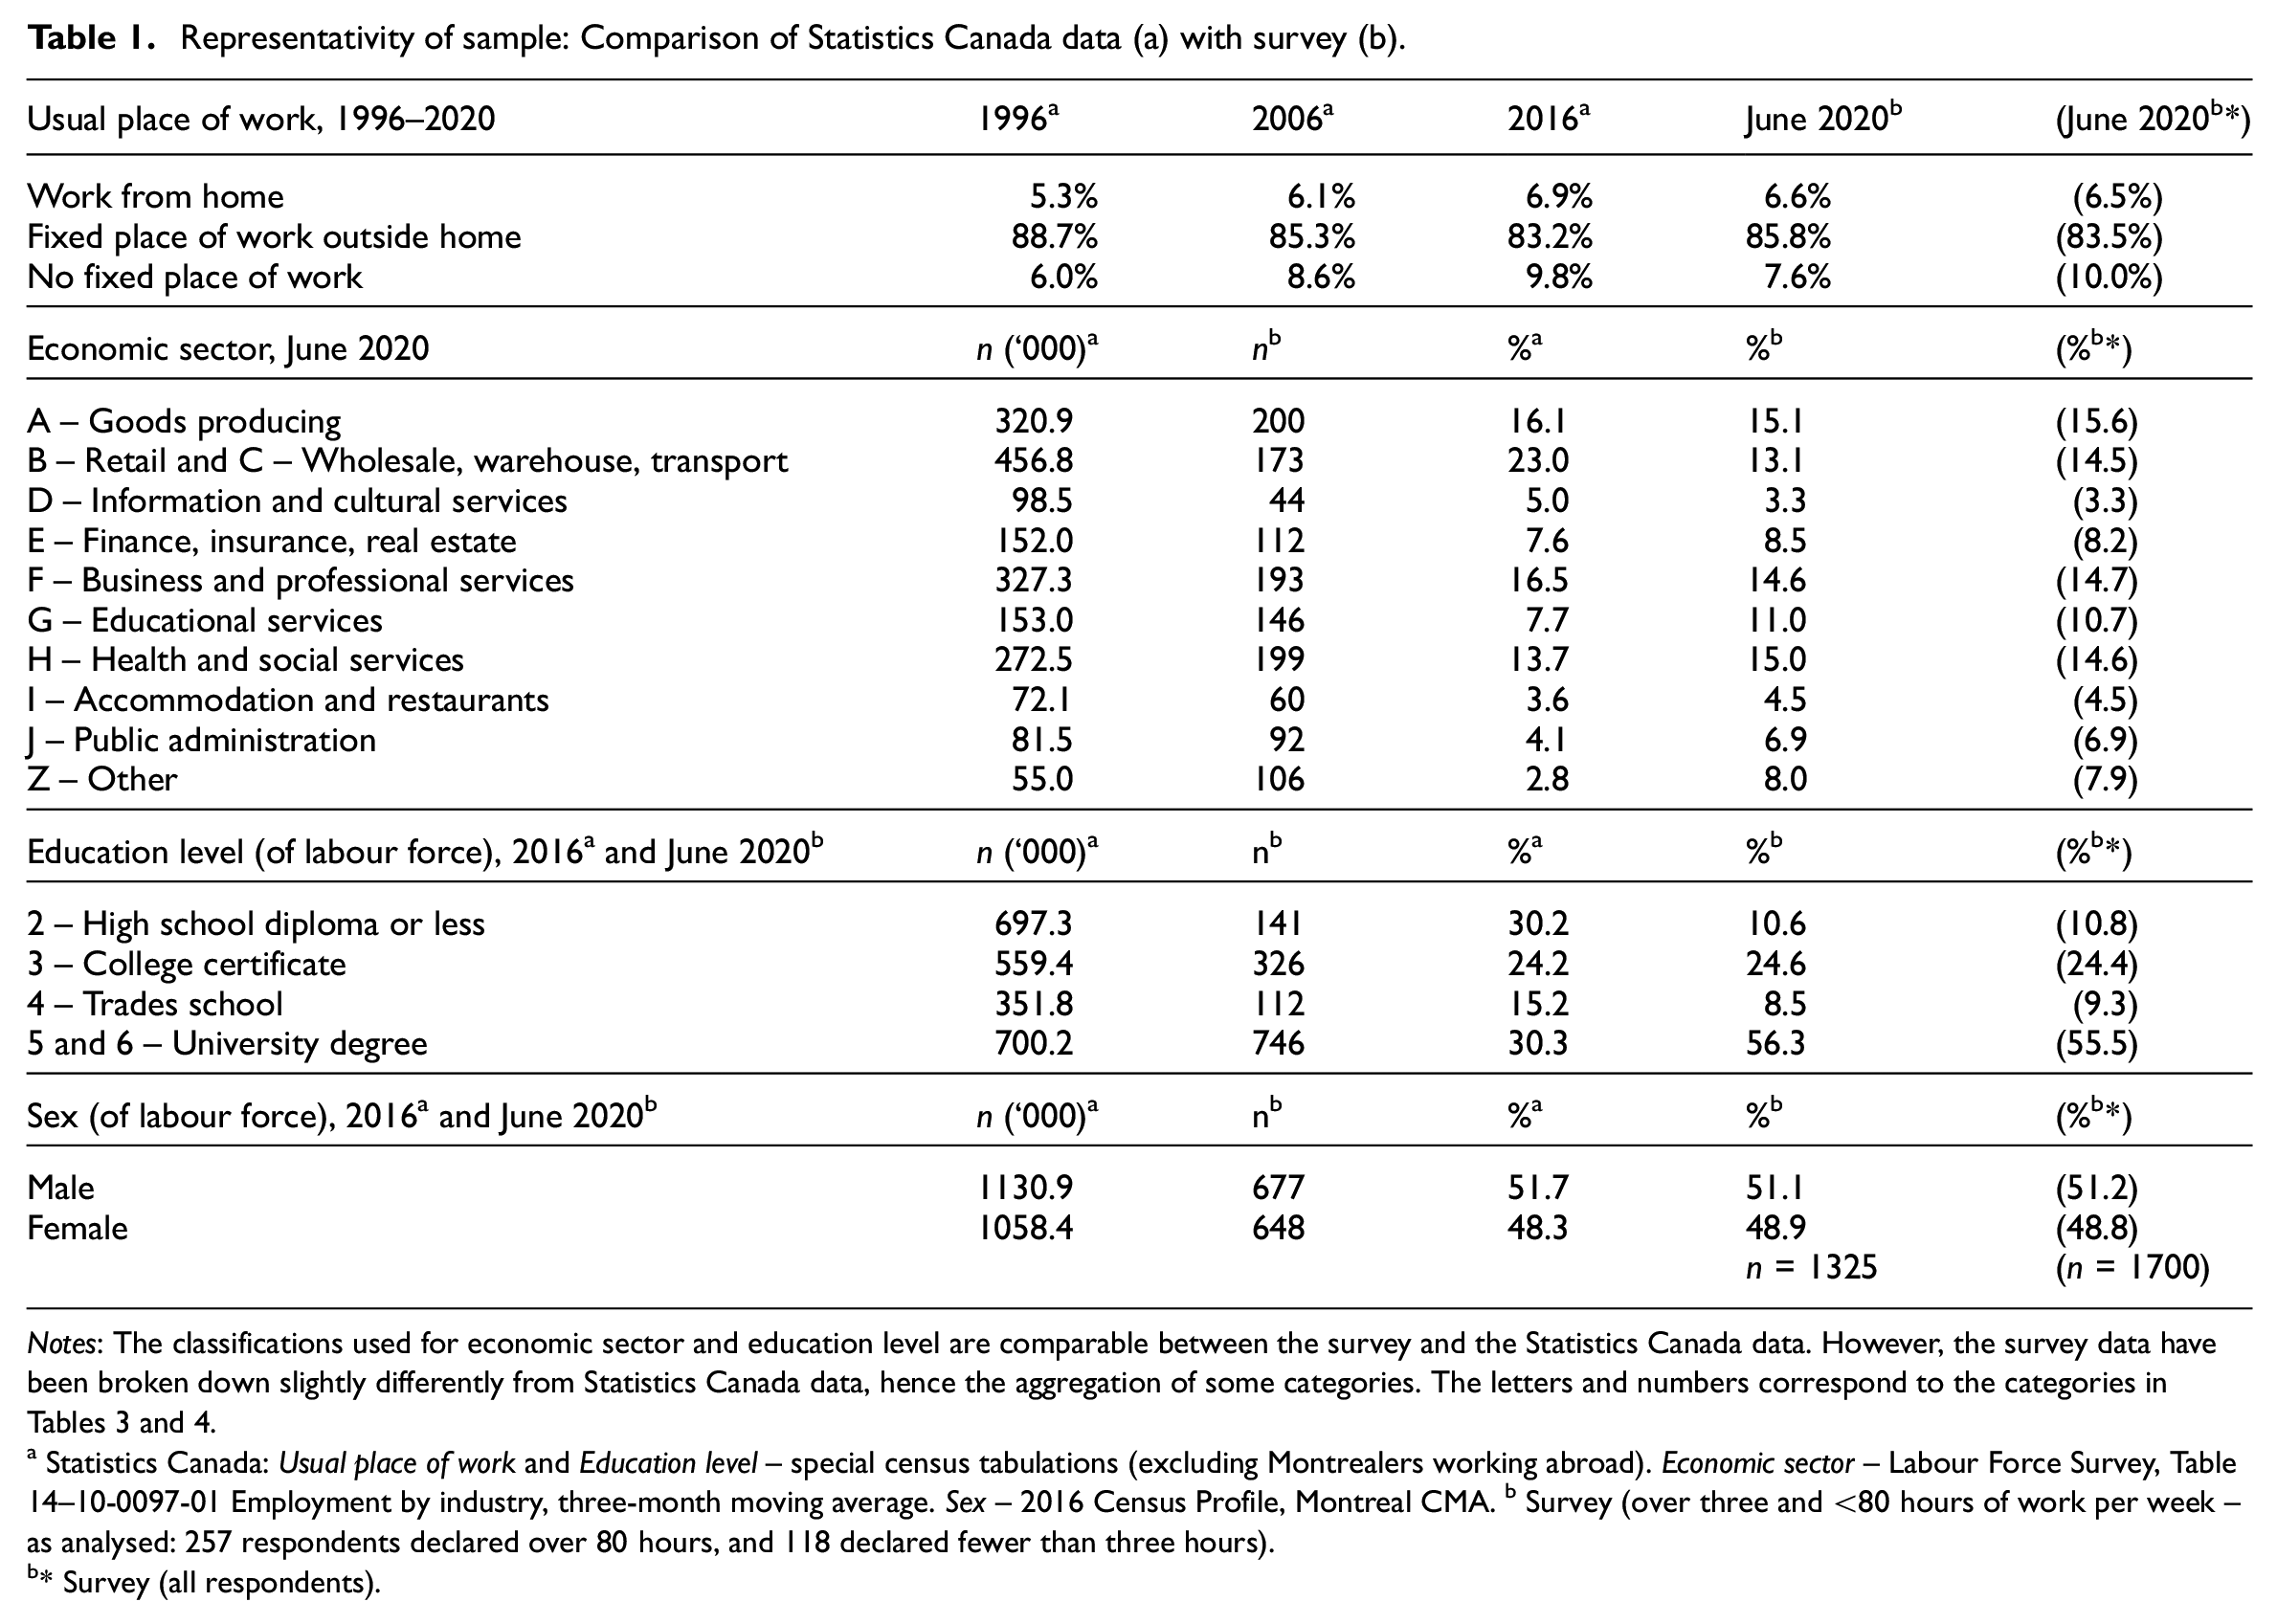
Notes: The classifications used for economic sector and education level are comparable between the survey and the Statistics Canada data. However, the survey data have been broken down slightly differently from Statistics Canada data, hence the aggregation of some categories. The letters and numbers correspond to the categories in Tables 3 and 4.
Statistics Canada: Usual place of work and Education level – special census tabulations (excluding Montrealers working abroad). Economic sector – Labour Force Survey, Table 14–10-0097-01 Employment by industry, three-month moving average. Sex – 2016 Census Profile, Montreal CMA. b Survey (over three and <80 hours of work per week – as analysed: 257 respondents declared over 80 hours, and 118 declared fewer than three hours).
* Survey (all respondents).
A total of 1700 responses was obtained, of which 1325 are used: the profiles of these two sets of respondents are compared in Table 1. Observations are excluded for two reasons. First, 118 workers declared fewer than three hours work per week. Second, 257 responses were excluded because total hours worked – the sum of time spent in each type of work location – was greater than 80 hours per week (either before or during the pandemic).
This second exclusion reveals a weakness in the data, attributable to rapid adaptation of the questionnaire in less than ideal circumstances: 2 whereas Shearmur (2020) envisages work probability spaces as non-overlapping (i.e. work takes place from one location at a time), we suspect that some respondents did not understand it this way, conceiving their work locations as overlapping. This leads to double counting of some work periods (e.g. working at a cafe close to home may also be counted as working from home).
By only analysing respondents who declare fewer than 80 hours work per week, we reduce the impact of this issue without resolving it. The distribution of total worktime, and the mean observed worktime for the retained observations, suggest that major issues of overlap have been resolved (Table 2). However, our results should be treated as approximations – they provide a good indication of the shift in work location due to COVID (especially since we can assume that respondents are consistent in their overlaps) without being strictly precise since the analysis assumes there is no overlap.
Total hours worked per week February 2020 and June/July 2020, survey results.
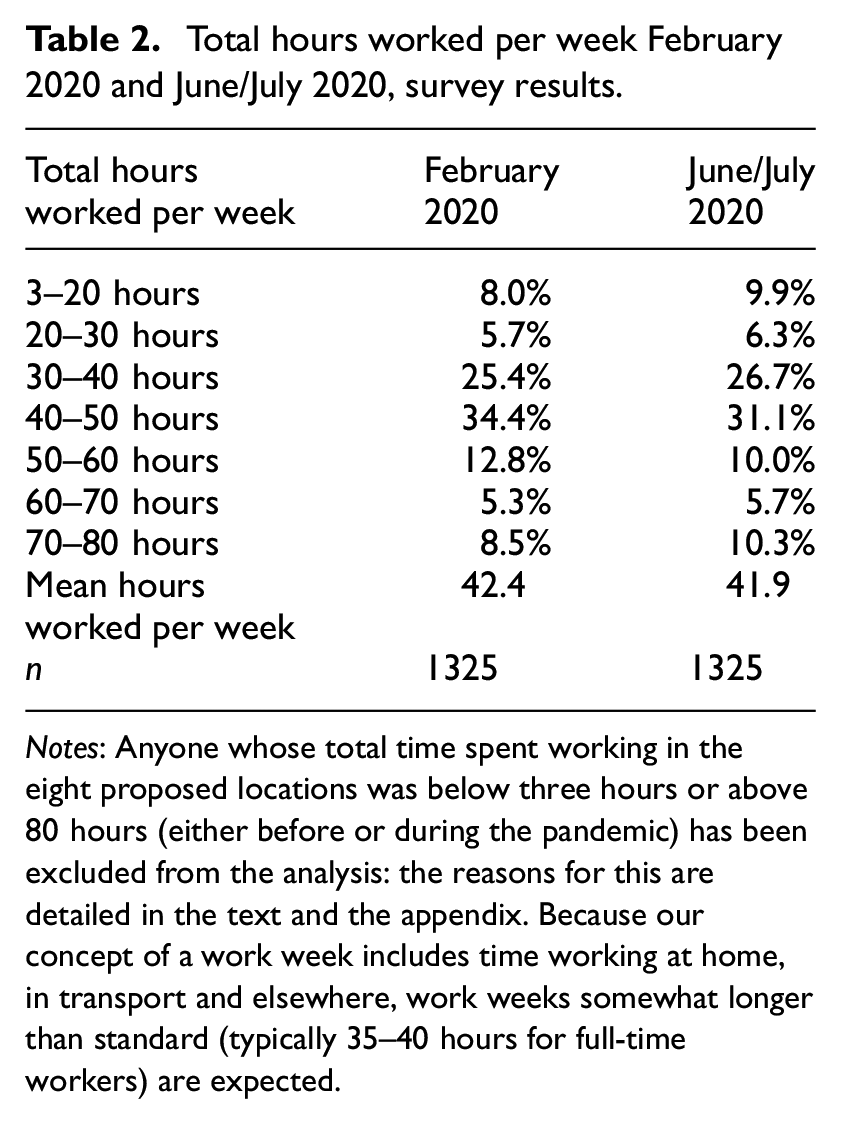
Notes: Anyone whose total time spent working in the eight proposed locations was below three hours or above 80 hours (either before or during the pandemic) has been excluded from the analysis: the reasons for this are detailed in the text and the appendix. Because our concept of a work week includes time working at home, in transport and elsewhere, work weeks somewhat longer than standard (typically 35–40 hours for full-time workers) are expected.
Respondents are asked to estimate the time they spent working at each of eight locations in a typical week of February 2020, and in June/July 2020 (during their latest working week). The eight locations that form the probability space are as follows: (i) usual place-of-work outside of home; (ii) at home; (iii) doing micro-work in various places (i.e. texting, phone calls, diary …); (iv) in cafes, lobbies, restaurants; (v) in co-working spaces; (vi) at clients or in related establishments; (vii) in a mode of transport or waiting for transport; (viii) in other places (see Appendix 1). The proportion of worktime spent in each type of location measures the probability of working there.
In May and June 2020, in parallel to this survey and in order to better interpret it, 40 in-depth interviews were performed with people working from home in Montreal and Calgary. The selection criterion was ‘to have been working at home since the start of the pandemic’. Interviewees were contacted by snowballing. Respondents are not representative of any particular population, but cover a wide variety of profiles, from recently recruited young workers to senior managers. These interviewees provide an indication of the perceived advantages and disadvantages of working from home – from the point of view of people who had not chosen to do so and are accustomed to working at a usual place-of-work – and provide insight into the likely future of office work once the pandemic has subsided.
These interviews were formally coded after close (re)readings of the transcripts by three researchers (the two who conducted the interviews and the first author), and after discussions identifying key themes. In the empirical section below, reference is made to some themes in order to shed light on the survey results, but we do not present a full analysis. Likewise, we present an overview of the principal survey findings, in view of documenting the unprecedented shift in work location and of demonstrating how the concept of place-of-work (as deployed by economic geographers and planners) can incorporate insights from organisation studies and sociology: in-depth analysis of the data will proceed in future studies once the basic contours of the COVID-related shift in workplace location are understood.
Results
How did work location change between February and June 2020, and for whom?
Since the mid-1990s, there has been a steady, but not overwhelming, move towards working from home and from non-specified locations. This is reflected in the survey, which – in order to establish overall validity of the instrument – asked respondents a census-type question about their pre-COVID workplace. In Table 1 the slow progression, between 1996 and 2016, of people who declare home as their work location is evident, as is the growth in non-specified work locations. Our survey results are commensurate with the 2016 census.
Table 3 reports how work location changed for respondents between February and late June 2020, broken down by economic sector. On average, in February, these respondents spent 68.4% of their worktime in a usual place-of-work outside the home (UPOW), 12.0% working from home (WFH), 7.9% in co-working spaces or cafes, 4.3% at clients and the rest in diverse other places. Four months later this had shifted, proportions now being, respectively, 47.7%, 35.7%, 5.7% and 2.9%.
Mean proportion of worktime spent in different work locations by economic sector, Montreal.
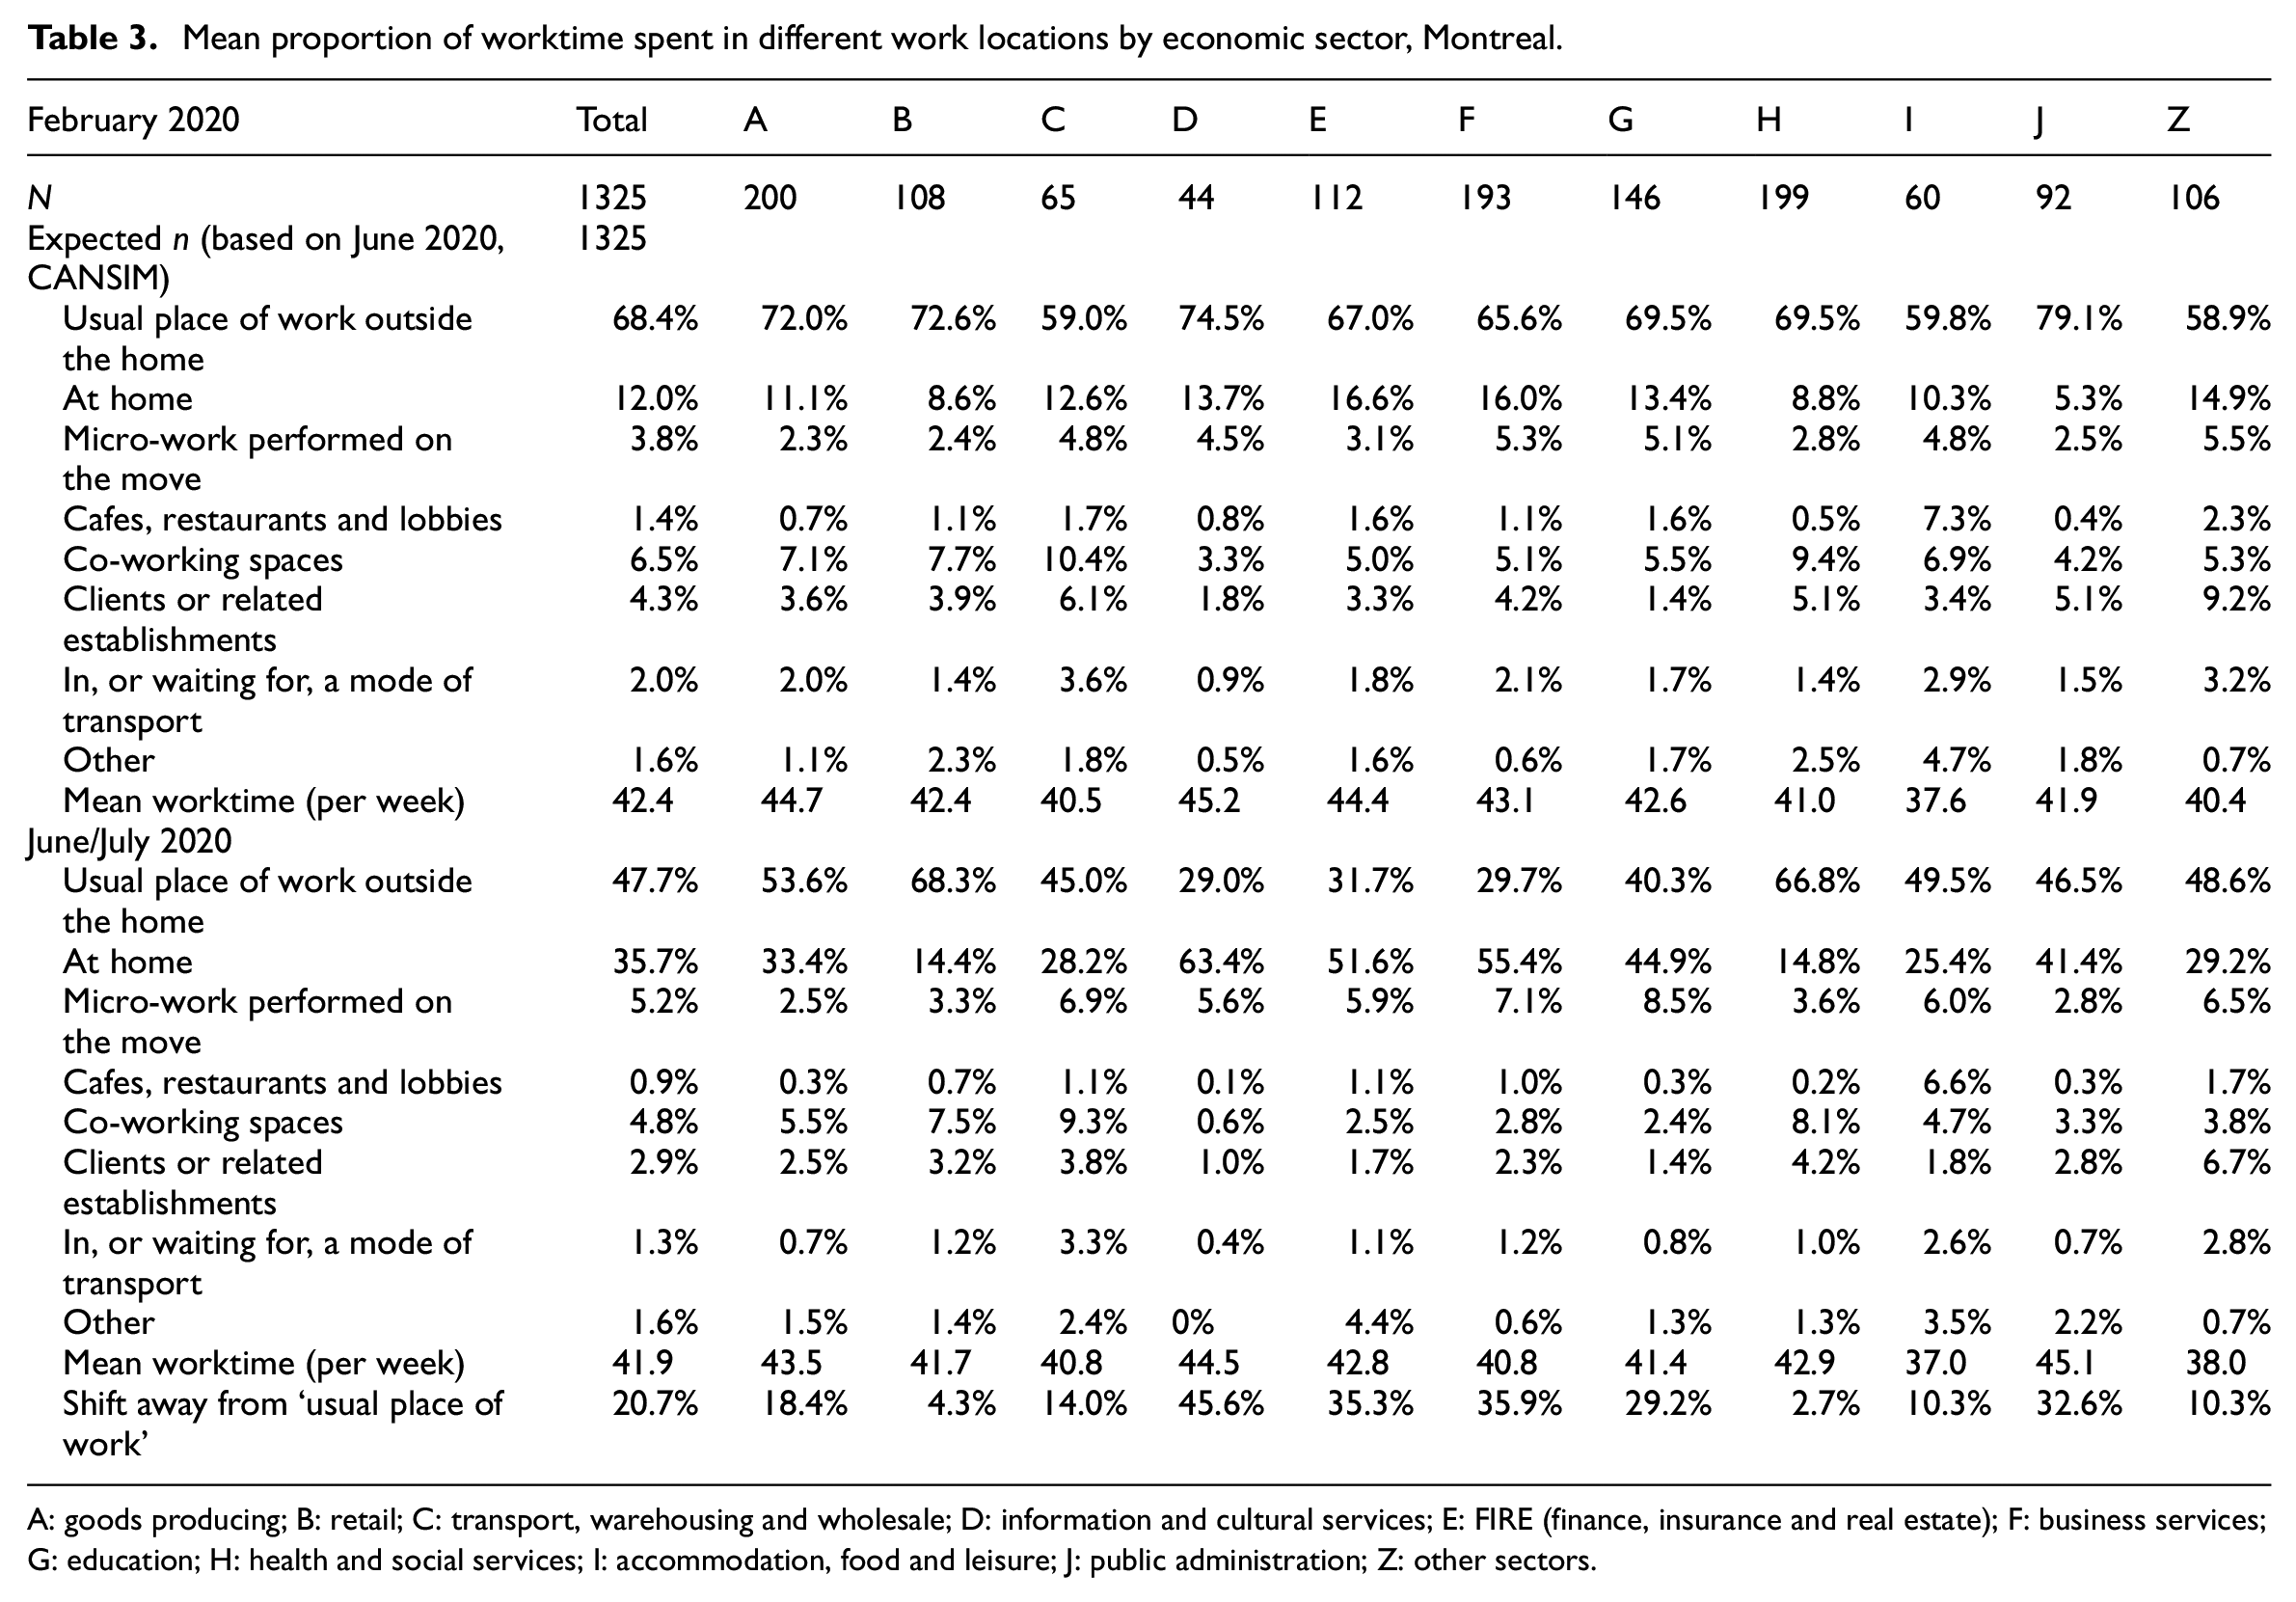
A: goods producing; B: retail; C: transport, warehousing and wholesale; D: information and cultural services; E: FIRE (finance, insurance and real estate); F: business services; G: education; H: health and social services; I: accommodation, food and leisure; J: public administration; Z: other sectors.
These results are revealing for two reasons. First, there was not an absolute shift towards working at home. Even in sectors where this shift is considerable (such as information and cultural services, FIRE (finance, insurance and real estate), business services and public administration), on average 30%–47% of worktime is still spent at a UPOW in June. Furthermore, prior to the pandemic at least 20% of worktime (31.2% on average) was spent in a place other than a UPOW, in all sectors. Work activities were not confined to the office (or UPOW) before the pandemic, but the pandemic has markedly shifted the probability of working away from UPOWs and towards WFH.
Second, in some sectors, the shift away from a UPOW has been less marked. In retail, transport, accommodation and restaurants, and health and social services the shift is either imperceptible (4% or less for health and retail) or moderate (<14%). The move towards WFH mainly affects high-order services and the cultural industry: the ‘workplace revolution’ touted by some commentators (e.g. Berry, 2020; Thomas et al., 2020) only touches office-based employment.
As noted by Felstead and Henseke (2017) and Wheatley (2020), pre-pandemic changes in workplace have been occurring in a gradual fashion. Whilst the COVID lockdown accelerated the trend, Table 3 confirms that WFH (and from other locations) was common before the pandemic. Our survey also reveals that 39.3% of respondents performed some WFH prior to the pandemic, a proportion that reached 48% in the FIRE sector, 51% in high-order services and 62% in education. Thus, many people who shifted to WFH already worked from home part of the time: the smooth shift towards WFH that occurred in March 2020 rests upon this pre-pandemic trend. A key question is whether the shift is reversible or whether it will be maintained after the pandemic subsides.
Table 4 presents data identical to that of Table 3, broken down by education level, sex, establishment size and (for a subset of respondents 3 ) location of their UPOW prior to the pandemic. The shift away from UPOW increases with formal qualification. Whilst there has been virtually no shift for workers with low formal qualifications or trades certificates, workers holding university degrees, who in March 2020 spent about 70% of their worktime at a UPOW, only spend 40% of it there in June: the shift towards WFH for college or university graduates is between 30% and 40%.
Mean proportion of worktime spent in different work locations by education, sex, establishment size and location in the city, Montreal.
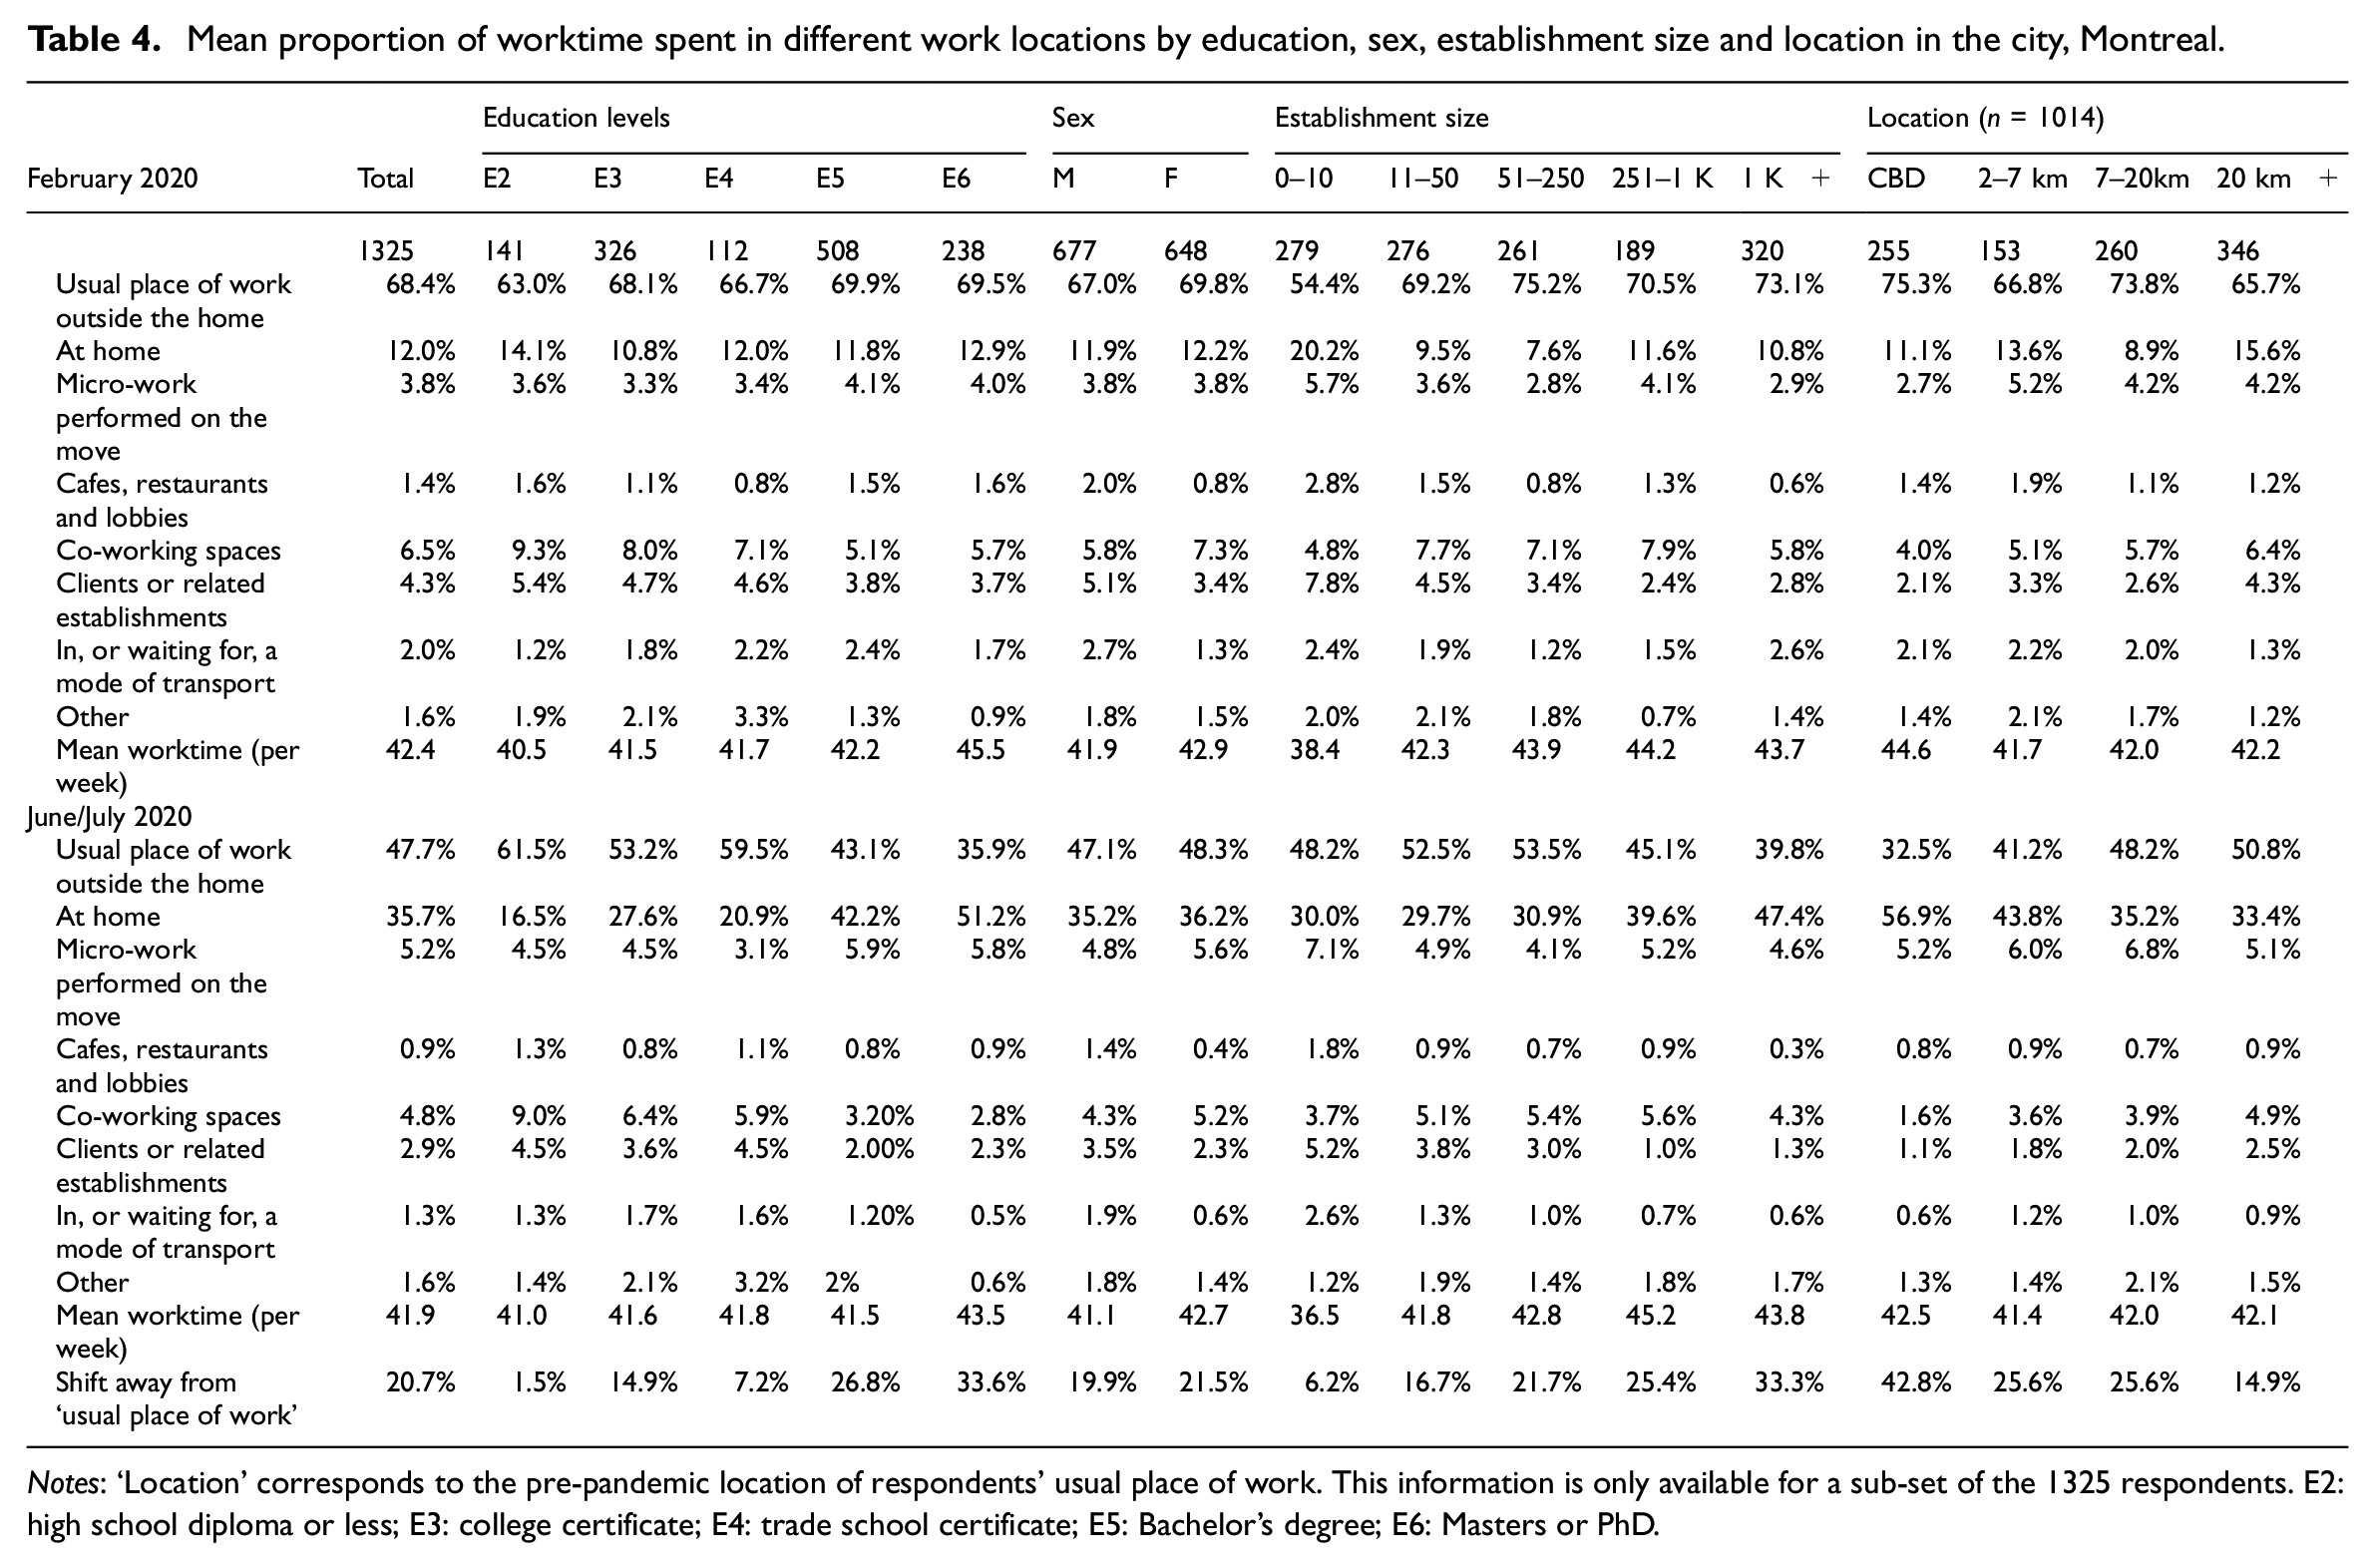
Notes: ‘Location’ corresponds to the pre-pandemic location of respondents’ usual place of work. This information is only available for a sub-set of the 1325 respondents. E2: high school diploma or less; E3: college certificate; E4: trade school certificate; E5: Bachelor’s degree; E6: Masters or PhD.
As shown in Table 1, people with higher levels of formal education are overrepresented in the survey relative to the 2016 census. Three factors, which are not solely methodological, could have caused this. First, between March and June 2020, a higher proportion of less qualified people in personal service jobs may have lost their jobs (Parker et al., 2020). Second, these jobs are less stable, so more may have changed jobs (thereby being excluded from our population). Third, it may be more difficult for these workers to respond to surveys. The survey firm randomly contacted respondents by telephone: as evidenced by Table 3, workers with more formal qualifications were more available (since they were working from home) than those with less formal qualifications (more likely to be working outside the home, presumably in jobs where picking up the phone is difficult or not permitted). This response bias reveals another way the COVID crisis may exacerbate inequality: by virtue of not being available, the voices of less privileged people are underrepresented even in random surveys, unless an active effort is made to include them. Furthermore, university-educated people – authors of, and audiences for, analyses about the future of work (e.g. Berry, 2020; Thomas et al., 2020) – may overemphasise the predicament of people in their own entourage at the expense of less visible and less voluble workers, shaping how the impact of COVID on work is represented.
The shift away from UPOW is larger for larger organisations, and is substantially larger for workers who previously worked in the CBD. For these people, the proportion of time spent working at their UPOW has plummeted from 75% to 33%. There is little difference between men and women with respect to the shift towards WFH.
In Table 5, the results of an unweighted 4 ANOVA analysis are presented: the dependent variable is the shift away from UPOW (measured as % of total worktime), and each of the effects in Tables 3 and 4 is entered as an independent variable. Since detailed information on the shifts is provided in Tables 3 and 4, only the significance of each effect is reported, though coefficients are available upon request.
Shift away from UPOW by sector, sex, education, establishment size and location, ANOVA.
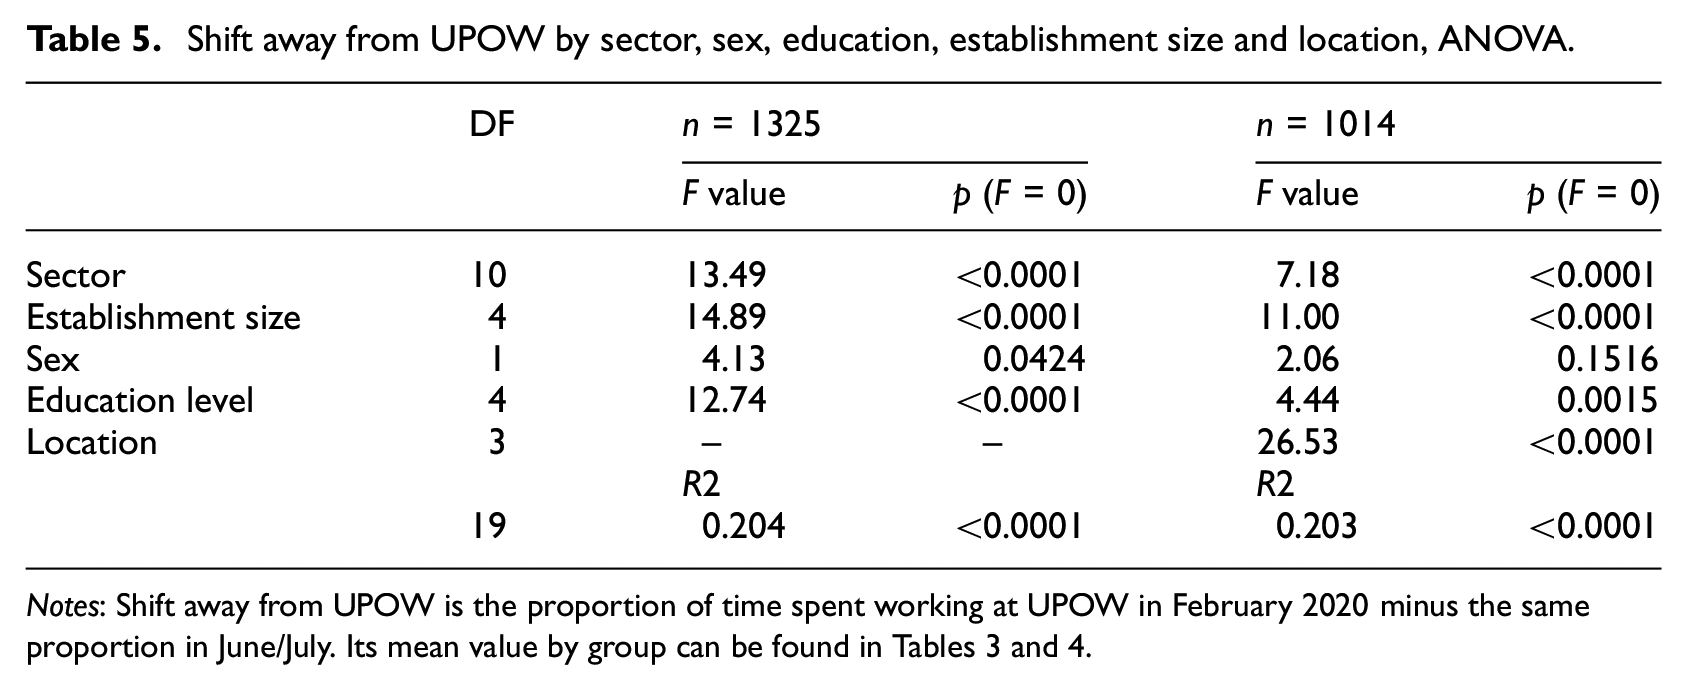
When all responses are analysed, each of the four effects (excluding location, which is only analysed for a subset) is significantly connected to the shift away from a UPOW. Sex, however, is only just significant at the 95% level. For the subset of respondents who declare that, in February, they worked most of the time from a UPOW, the location of their UPOW plays a dominant role in explaining the amplitude of the shift: people working downtown are significantly less likely, in June 2020, to have returned to their UPOW.
Respondents were also asked whether, after the pandemic, they expect to work more or less than they did before the pandemic from each of the eight work locations. Of the 1315 respondents who worked at least some of the time from a UPOW, 64% expect no difference after the pandemic, 29% expect to work there less and 8.3% expect to work there more. However, 36% or more of workers in high-order services (FIRE, business services, and information & culture) expect to work less at their UPOW, and 40% or more expect to work more from home. Workers with lower qualifications expect little change in the time they spend at their UPOW (74% expect no change, 11% expect to work there more, 15% expect to work there less), whereas the most qualified workers expect substantial change (52% expect no change, 3.8% expect to work there more, 43.8% expect to work there less). It is workers based in the CBD who have the highest expectation of change and who expect the largest shift away from their UPOW.
These expectations of change can be read in two ways. On the one hand, even in the CBD and amongst the most highly qualified workers, over 55% of workers expect no change (or to work more) in their UPOW after the pandemic. Thus, most workers, even in the most affected locations and sectors, expect a return to normal. On the other hand, a sizeable minority of workers, especially amongst more highly qualified office workers, expect a shift towards WFH.
To better understand why workers may return to the office, we now turn to information derived from qualitative interviews.
The advantages and problems of working from home
The previous section documents the nature of COVID-induced shifts in work location, but provides limited information about how this could affect cities over the longer term. In this section we draw upon qualitative interviews, from which themes relevant to the future of office work and to the future configuration of CBDs emerge: the lived experience of workers who shifted to WFH, and who, by June 2020, had settled into a new work regime, provides insights into the advantages and disadvantages of long-term WFH, and therefore into factors that may motivate workers to return to office work (or not) after the pandemic subsides.
In keeping with the ambient discourse during the first months of the pandemic, many interviewees view WFH in a positive light, notwithstanding obstacles and problems that many face in terms of ergonomics, child-minding and coordinating noise levels and workspaces with family or roommates.
Two key reasons are given for this positive outlook. First, workers feel just as, or more, productive: You’re more productive when you’re working from home, to be honest. (R1 – project manager); All of the things I would do, including committee meetings, are just as achievable based on … remote or virtual meetings. (R21 – senior physician); I think at home I am a little bit more productive … there’s not … people bothering you. (R25 – senior manager)
Second, and probably the main reason for preferring WFH, is time saved by not commuting: And, quite honestly, I feel I’m more productive because there’s no wasted time getting to work (R9 – business development coordinator); So, working from home does take off about an hour and a half of travel, and ‘get-ready’ time. (R32 – digital publisher)
Another theme that bears upon the future of remote work is the changing attitudes of managers. Many managers are reported by our interviewees (some of whom are managers themselves) to be pleasantly surprised by how well offices function remotely: … staff have … been really reliable and have … stepped up to the plate in terms of getting work done. (R25 – senior manager); … it will accelerate the process [of remote work] because there are many companies and sectors that are realising that it’s possible, it’s efficient, that there are many positive aspects to remote work. (R17* – college director);
5
… [being] more home during COVID made it easier, because sometimes, if I’m physically present, even if I believe in the power of delegation and responsibility and whatnot, if I hear something I might want to get involved and put [in] my two cents, right. Being home, I just wasn’t in the way of my team, […] I think the delegation part was easier. (R12 – company owner)
Notwithstanding these positive remarks about remote work, almost all interviewees identify problems with WFH. In contrast to claims made about productivity, interviewees – sometimes the same ones who feel more productive – report inefficiencies, often associated with difficulties in communication: [Each week] there was one major meeting. That’s it. Now … there’s meetings every single day, they’re repetitive meetings … (R1); I’ve never functioned well on video-conferences. (R21); I found it hard not to be physically present in the same room with the team. It’s not the same vibe. (R12) … on Zoom it was a little bit confusing. We tried that. But I could have gone to her desk and talked with her for 15 minutes … and … we could have quickly worked through it. And instead, it took me 45 minutes to type the email … (R25)
As one respondent pithily remarked: ‘We work more to obtain the same result’ (R19* – community development adviser).
Creativity, on-boarding new team members, interacting with new clients and getting a ‘feel’ for what is happening in a group are all more difficult when working remotely. Only one example will be given for each, but these are important dimensions that inform our discussion of the possible future of office work and the CBD: Mentally, it seems we’re more isolated. So, the amount of ideas that pop up in one’s head is certainly less because there’s a lot less brainstorming happening. (R15 – research assistant); We have been finding training and development hard. We had a new team member come on before COVID, but it’s hard to build that relationship when it’s online. (R38 – development coordinator) Lack of face-to-face client interaction. That’s a big thing for us, you don’t get the sense – you’re not able to read the situation the same. You can’t tell body language, you can’t tell those intimate factors that you would normally see in-person. (R22 – accountant) … it’s missing … being with everyone. There are [fewer] informal encounters. [Usually] you go to the machine for a coffee and you meet someone that you don’t often see. You know, there are many people who, when we return to work, it will be six months that I haven’t spoken to them. (R14 – manager, software design)
Thus, despite the overall positive impression of WFH, limitations emerge as interviews delve deeper. Indeed, increased productivity mainly applies to tasks that require focus, linked to reading, programming or report writing. Almost all other office functions – including information exchange and the communication of more complex, tacit information – appear to be less effective when conducted remotely.
This is probably why most respondents, when asked what their ideal balance would be between WFH and UPOW, say that it would be two (maybe three) days at home, with the remainder in the office. Given that our survey reveals that most office workers spent 30% of their worktime outside their office pre-COVID, with over 20% of this time at home or in cafes (for FIRE and business services), the responses suggest interviewees would appreciate maybe half a day per week – roughly an extra 10%–15% of their time – working away from the office. This would be a significant shift, but not a complete revolution, in the geography of work.
Discussion
In this article, we document how the locations from which people perform their work activities shifted during the COVID-19 pandemic, specifically between March 2020 and late June, and show how concepts developed in organisation studies and sociology can be applied in economic geography and planning. We conceptualise work as taking place from numerous locations (Burchell et al., 2020; Felstead et al., 2005; Taskin, 2010; Wheatley, 2020): this conceptualisation, operationalised as a probability space (Shearmur, 2020), allows a nuanced description of the shift in workplaces. We juxtapose these survey data with an overview of the advantages and challenges of WFH as they emerge from in-depth interviews with people working from home during the pandemic, which allows us to speculate about how the observed shifts could affect cities – downtowns in particular – over the longer term. In Montreal, downtown is the hardest hit location in terms of transfer away from office work, and CBD workers have the lowest expectation of returning to their normal place-of-work after the pandemic.
Despite the widely reported shift of work towards the home, this shift principally affects the most highly qualified workers, those working in high-order services and those based in the CBD. Many workers in the hospitality, health care, social services and transport sectors, particularly those of low socio-economic status (education levels being a proxy for this), continue to work outside the home. These sectors are often client-facing and are considered ‘front-line’: as the Canadian Broadcasting Corporation reported in May 2020, ‘Front-line workers, including grocery store workers, transit and taxi drivers, are a group that has been hit hard by the COVID-19 pandemic’ (CBC, 2020). Our results confirm that changes in workplace were structured by social status, feeding inequalities of exposure to COVID: broadly speaking, whilst workers of higher socio-economic status retreated to their homes (often maintaining their jobs), workers of lower status continued working in the same locations as before, mainly outside the home (or lost their jobs).
This means that, despite the sizeable shift in work location for some types of worker, the shift in work location across Montreal was not as large as may be expected: approximately 88% of total worktime was spent outside the home in February 2020, and 64% was still spent outside in June 2020 – an underestimate given that workers of lower social status are underrepresented in the survey.
The generally positive view of WFH expressed by interviewees reflects three things. First, it reflects a real increase in productivity – mainly for tasks that require concentration. Second, it reflects the substantial time savings that WFH implies. The third item that explains this positive attitude is one we infer: many interviewees express gratitude that they still have a job and awareness that people around them have lost theirs. Thus, we suspect that part of the positive attitude towards WFH reflects that interviewees were loath to complain. Notwithstanding this generally positive outlook, many workers – particularly younger workers and those sharing accommodation with family or friends – detail considerable challenges linked with ergonomics, finding a quiet space, internet connection and other such issues. The social cleavage, along education lines, evident in the survey is mirrored in the interviews by differences between respondents based on housing and family status.
The positive attitude towards WFH is belied by many examples of office work’s efficiency. Informal communications are easier, allowing complex information and instructions to be exchanged rapidly. Conversely, remote communications are often described as slow and unwieldy. Whilst strong workplace ties with close collaborators have been maintained during the pandemic, weaker workplace ties are disappearing as WFH continues, with possibly negative consequences for the cohesion of organisations (Granovetter, 1983). Creativity and idea generation are harder, getting to know new colleagues is difficult and many aspects of communication that are hard to pinpoint (but that interviewees suggest are linked with ‘feel’, body language and social interaction) are missing.
This evidence suggests that congregating in one place to perform work – offices in particular, but the same is probably true for factories, workshops and other work locations – is not an anachronistic foible. It brings about real efficiencies that, a few months into the remote work experiment, are beginning to disappear. Thus, the suggestion made by most interviewees, that working away from the office a couple of days a week would be ideal, may also correspond to what is efficient for most employers. However, for employers to benefit from the efficiencies of co-located workers, workers would presumably need to be at the office at the same time, introducing limits to the freedom of workers to choose when they work from home.
From a wider perspective, our results raise some questions about the nature of clusters and of dynamic agglomeration economies, and about the scale at which dynamic interactions occur. Workers describe a series of interactions within the workplace that lead to collaboration, efficiency and creativity. Despite the open-ended nature of our interviews, no evidence was forthcoming that workers (or, indeed, the managers we interview) miss informal work-related interactions beyond the confines of the firm, except interactions with clients: the idea that working in an urban cluster, whether the CBD or elsewhere, necessarily enhances collaborative interactions with people beyond the confines of the firm is not supported by our interviews (Huber, 2012), though it can of course occur (Florida and King, 2018).
Our results corroborate a market-access explanation of agglomeration (Puga, 2010): certain locations provide better access to markets by way of co-location with clients, suppliers and labour, and also by way of convergent transport and communication networks. Collaborative interactions are not necessarily tied to location, often occurring across multiple places – through communities of practice (Jewson, 2007) and along global production networks (Dickens, 2015) or inter-city pipelines (Bathelt et al., 2004) – reinforced by occasional socialisation in specific places (Bathelt and Turi, 2011; Jewson, 2007).
So long as firms and companies compete (and therefore have boundaries and proprietary information), physical co-location will not be sufficient to bring about meaningful collaborations and exchanges between them (Boschma, 2005). Yet this does not mean that dynamic agglomeration effects do not exist; rather, our evidence suggests that dynamic interactions occur primarily within offices rather than between them: indeed, some companies (such as Google, Apple and Yahoo) choose to build remote campuses, relying solely on within-office agglomeration effects and dispersed networks. However, many companies still require physical access to markets, clients, competitors and labour within cities – access to all of which is facilitated by congregating in a small number of accessible locations.
Finally, the article presents a new methodology for measuring work location. The methodology provides results that are consistent with wider understandings of what occurred during the first months of COVID, and that reveal some of its complexity. Somewhat unusually in the context of quantitative research, the object of the survey (i.e. the rapid change in work arrangements brought about by COVID, and the uncertainty that the pandemic provoked) fed back into the survey itself: the nature of what was being studied altered at the very moment the study was being launched. Furthermore, all members of the research team were caught up in these changes (both professionally and in their personal lives). Therefore, rapid decisions were taken in uncertain personal and empirical circumstances about whether or not to run the survey and about how to re-write the questionnaire – itself a first attempt to operationalise the novel idea of work probability spaces.
Thus, three elements have impacted the quality of the data, making them less precise and more impressionistic than typical survey data: (i) the rapidly evolving nature of work arrangements – that is, of what was being studied – just as preparations for the survey had been finalised; (ii) the personal and empirical uncertainty, as well as the time pressure, that prevailed as decisions were postponed then taken, and as the survey instrument was re-written; (iii) the new way that work location was being broached: respondents were not all familiar with the idea of sub-dividing their work activities into discrete space-time components.
The survey results are therefore less precise than desired: however, they provide a good impression of what occurred between March and June 2020 – the best possible given the circumstances – and show how the idea of probability spaces can be applied. These data limitations must be borne in mind when considering the results. Despite these limitations, the results are broadly accurate (they are validated by many other disparate sources) and have the merit of providing a systematic – if fuzzy – appraisal of the complex changes in work location brought about by COVID. It should be noted that these issues do not affect prospective elements of the survey (workers’ post-COVID expectations) nor the qualitative interviews.
Conclusion
In this article, we document how the location of work changed in Montreal between March and June 2020, implementing a novel way of conceptualising work location: work is conceptualised as taking place across various locations – Felstead et al.’s (2005) workscape is operationalised as a probability space (Shearmur, 2020). By applying this way of measuring work location to the situations before and during COVID, a nuanced understanding of how work location changed is obtained. However, the method requires refinement because some respondents segment their work life into overlapping space-time elements. This can partly be resolved by improving the survey instrument (Appendix 1), and will also become less problematic as respondents, and society more widely, become familiar with a vocabulary that incorporates the idea that work occurs across numerous locations.
Although work location changed between March and June 2020, it did so more for some workers (mainly highly qualified high-order service workers based in the CBD) than for others (mainly low-qualified essential service workers). Furthermore, the change in work location was not clear cut: it can better be read as a marked shift in emphasis within the field of possible workplaces rather than as an abrupt shift from one work location (e.g. CBD offices) and to another (e.g. suburban homes).
Should workers, on average, spend an extra day or so away from their usual workplace after the pandemic, this would represent an acceleration of changes already underway before February 2020. Alterations to offices’ internal layout and management are likely to continue (Dittes et al., 2019; Leclercq-Vandelannoitte and Isaac, 2016; Pajevic, 2021): organisations were already reducing their office space requirements before the pandemic, introducing shared spaces and hoteling, and will continue to do so.
This has important repercussions for the way economic geographers and planners conceptualise and identify the connection between economic activity and urban space: mapping places of business – which remains a useful approach for certain urban economic questions – is no longer homologous (if it ever was) with the mapping of economic activity. Viewing work location as a probability space is a way of reconciling current methods in urban economic geography with the changing workplace.
Footnotes
Appendix 1
Below is an extract from the instrument used to gather information for this study. The original numbering of the survey questions is maintained.
The ‘usual place of work’ of question 2.2.a is identified from question 2.1.1. Thus, for example, someone who declares that their usual place of work is ‘space at your home’ in question 2.1.1 sees their usual place of work classified as ‘at home’ in question 2.2.a. For such a respondent, all time worked at home, whether during normal working hours or not, is summed to find a total amount of time spent working at home. The same applies when the ‘usual place of work’ provided in 2.1.1 corresponds to another place specifically mentioned in questions 2.2.b to 2.2.h.
The locations listed in section 2.2 are designed to be non-overlapping; however, some respondents replied in ways that reveal this assumption to be incorrect. This issue has been mitigated, but not solved, by limiting our analysis to respondents whose total work hours are below 80 hours (84.3% of the analysed responses declare fewer than 60 hours, and 74.3% declare fewer than 50 hours – see Table 2). Note that working hours greater than the ‘normal’ 35–40 are expected given the inclusion of weekend work, micro-work, work in cafes, etc. … In future iterations of this questionnaire, the preamble to question 2.2, as well as the wording of each sub-question, would specify that time spent in one of the locations mentioned cannot be spent in another of the locations, that is, respondents will be specifically invited to think of each of the locations as not overlapping with any of the others.
--------------------------------------
Acknowledgements
We would like to thank three anonymous reviewers for engaging with the article and for providing constructive and stimulating feedback, which has greatly improved it. We would also like to thank the editor, Phil Hubbard, for his guidance throughout the process. We remain fully responsible for the final article.
Declaration of conflicting interests
The author(s) declared no potential conflicts of interest with respect to the research, authorship, and/or publication of this article.
Funding
The authors disclosed receipt of the following financial support for the research, authorship, and/or publication of this article: Social Sciences and Humanities Research Council, grant 435 2019 0815; Social Sciences and Humanities Research Council, grant 435 2017 0746.