
Abstract
This article identifies proxies which account for the impacts that the Airbnb platform is having on housing in Greater London. We identify these by analysing the relationships between possible Airbnb misuse and the attributes of housing in the same locations. We assume misuse when listings of entire properties within the Airbnb platform do not conform with local regulations and where hosts who offer such housing have multiple listings. In particular, we examine (1) the dwelling type based on building typology; (2) the type of housing tenure, whether it is owned or rented; and (3) the spatial distribution of changes in rent payable. Three important findings emerge from our analysis. First, based on 2018 data, we estimate that more than 2% of all properties in London, and up to 7% in some local areas are being misused through Airbnb as short-term holiday rentals. Second, the location of these particular Airbnb rentals is negatively correlated with the diversity of dwelling types and positively correlated with dwelling type such as an apartment (or flat) in areas of high private rental stock. Last, we show that a 100% increase in the density of possible Airbnb misuse can be associated with up to an 8% increase in unit rental price per-bedroom per-week, an equivalent to up to an average of £90 price increase per year. Finally, we discuss how this type of analysis can help build instruments to inform policies associated with the platform economy in relation to increasing polarisation in the London housing market.
Introduction
New information technologies are increasingly being used to underpin businesses and markets. The most high profile of these are those that are defined around ‘platform’ economies, typically any activities involving financial transactions that can be underpinned by the internet which bring buyers and sellers together as individuals (McAfee and Brynjolfsson, 2017; Parker et al., 2016). In the tourism sector, the best known of these is Airbnb, which puts those seeking short-term accommodation in touch with those who have housing that matches this demand using the internet as the medium of transaction and interaction. This service is distorting traditional markets for housing and tourism because of its focus on the provision of platforms that link individual demand to individual supply together, often in real-time, with the company reaping financial profits. Apart from the way Airbnb acquires its revenues, one of the biggest problems so far with these kinds of service has been their lack of collective regulation (Stone, 2017). In this article, we will explore Airbnb and measure its possible impact on the housing market of a large world city, London.
London has undergone extreme distortions in its housing market over the last 200 years or more (Edwards, 2016; Watt and Minton, 2016) and there is evidence that the housing market might be affected by the rapid adoption of the home-sharing platform Airbnb (Barron et al., 2018; Garcia-López et al., 2019; Gutiérrez et al., 2017; Horn and Merante, 2017; Lee, 2016; Sheppard and Udell, 2018). London is an unequal city with rapidly rising rents and high house prices, wide disparities in its income distribution, distinct separation of social classes and multifaceted gentrification which is evident in its urban fabric (Davidson and Wyly, 2012; Hamnett, 2004; Watt and Minton, 2016). The nature of housing in London is already complex, and Airbnb is likely to be contributing to this complexity. However, global research surrounding Airbnb is highly contested, as some commentators identify Airbnb as invading the housing market (Barron et al., 2018; Garcia-López et al., 2019; Horn and Merante, 2017; Lee, 2016; Sheppard and Udell, 2018) and hotels (Zervas et al., 2016), while others find there are no apparent significant impacts and disruptions from Airbnb in terms of detracting from permanent housing and converting them to tourist accommodations (Snelling et al., 2016). Because the impact of Airbnb varies regionally and depends heavily on the socio-economic factors pertaining to the city itself (Quattrone et al., 2016), there is a challenge in drawing general conclusions regarding how Airbnb impacts the housing market globally.
This article aims to investigate the potential disruptions caused by Airbnb to the housing market by examining the possible misuse of Airbnb properties in London, correlating this with several housing attributes, including tenure, dwelling typology and the structure of rental price changes in London. We identify the possible misuse of Airbnb by separating those Airbnb accommodations that might not comply with the city-wide regulation, which limits holiday rentals being used for no more than 90 days annually (HM Government United Kingdom, 2015a, 2015b). We examine these associations which are mainly due to affordability issues and the related housing crisis, in addition to the rapid growth of peer-to-peer holiday rentals through platform economies, given by Airbnb in the present work.
The complexity of the London housing market
The housing problem in London is a manifestation of a complex system dominated by demand and supply imbalance, issues of taxation, subsidies and credits, the influx of global investments, as well as the impact of many different policies and politics surrounding the housing system (Gallent et al., 2017; Whitehead and Williams, 2011). Housing holds a fundamental place both in the economy and in society with dual roles related to human need (for shelter) and as an asset that holds a large proportion of a person’s wealth (FTI Consulting LLP, 2012). For decades, the increase in the value of housing has been perceived as a sign of wealth, while a collapse in housing prices would indicate a significant disruption in the overall economics of how the city functions (Macfarlane, 2017). All this is particularly relevant to London. Prices continue to remain high, pricing out many Londoners, even those who receive above-average incomes. The Office of National Statistics (ONS) found that, based on the ratio of house prices compared with gross annual earnings, many young first-time buyers would need to spend close to 13 times their annual earnings to acquire properties (Bentham, 2019). Although currently growing at their slowest rate in the last 10 years, house prices in London are still the highest in the UK by far, and first-time buyers find it difficult, if not impossible, to afford to purchase and own any accommodation (Elliott, 2018).
Historically, the housing market in the UK and London has not been able to create a balanced demand and supply, as there is an insufficient quantity and quality of supply. Despite recent efforts over the last decade, there has been a prolonged decline in new houses constructed since the 1970s, leading to a continuous housing shortfall and severe supply constraints (GLA, 2015; Watt and Minton, 2016). Thus, the massive annual development of new housing is now being prioritised over the coming decades. The London-wide Strategic Housing Market Assessment (SHMA) and Strategic Housing Land Availability Assessment (SHLAA) identified that London needs around 66,000 additional homes to be built annually with a total of 650,000 new homes needing to be built by 2029 (Mayor of London, 2018). A study by FTI Consulting LLP (2012) suggests that London is experiencing an asymmetry in prices (when house price increases and supply does not necessarily increase at the same rate) and considerable house price inelasticity (where a change in price is associated with a smaller percentage change in supply). London’s population is projected to reach 10.2 million by 2039 (GLA Intelligence, Greater London Authority, 2015), and it seems unlikely that income will outpace house prices anytime soon (Macfarlane, 2017). The need for housing involves a diversified market demand as people’s preferences over dwelling type, geographical location, occupancy and affordability vary (FTI Consulting LLP, 2012).
London housing supply faces several other challenges. These include the lengthy institutional process for planned development, where objections of a political nature often occur; procedural issues in obtaining land because of the asymmetry of land availability for developers within local authorities; and fundamental challenges involving land supply constraints in addition to financial hurdles (Holman et al., 2015). These challenges have shaped the housing market structure so that large firms dominate the local housing construction, creating a barrier of entry for small firms (FTI Consulting LLP, 2012). Without the proper steps, such as making the planning process more transparent and predictable, encouraging more land to be available for housing construction, and restructuring financial programmes to include firms of all sizes to operate with developers, expanding housing investment and increasing supply remains a major challenge (Holman et al., 2015).
Two major policies appear to have further exacerbated the problem of high house prices. The first is the ‘Right to Buy’ (RTB) policy through the Housing Acts in the 1980s which allowed people to buy discounted council housing. The policy is said to boost home-ownership but it has ultimately led to rising prices (Foster, 2015). By 2014, around 1.8 million property sales had been completed under the ‘Right to Buy’ scheme (Murie, 2015). Subsequently, these properties were often rented out, contributing to a new generation of private landlord-ism (Edwards, 2016; Slater, 2016). The second policy is the ‘Help to Buy’ schemes, introduced in October 2013, requiring buyers to purchase newly built houses from certified ‘Help to Buy’ builders, with evidence that this often helps inflate the price of the property while giving significant advantages to private developers (Jones, 2019).
The growth of the private rented sector
The growing unaffordability of the owner-occupation sector further increases the demand for the private rented sector (PRS), which is defined in the UK as properties owned by a landlord (individual, a property company, or institutional investor) and leased to a tenant. It is estimated that by 2030, 40% of Londoners will be renting their homes (Future of London, 2017), a rise from 27% in 2016 (Trust for London, 2017) and 14% in 1991 (Mayor of London, 2015). The PRS is the least secure type of tenure, especially because of the UK’s assured short-hold tenancy (AST). AST gives a landlord the right to remove tenants at two months notice after a fixed term of generally 6–12 months as well as exercising sharp increases in rent without warning (Judge and Tomlinson, 2018). Housing is considered affordable when a household spends no more than 30% of its income (Williams, 1992), but a study shows that one in seven privately renting tenants are spending more than 50% of their income on housing in Britain. This rises to up to 72% in Inner London based on 2015–2016 data, while only 2% of owner-occupiers spend more than those proportions for mortgages (Collinson, 2017; Trust for London, 2017). Many more people with families are renting their homes compared with the past. Based on the Office for National Statistics data in 2016, from a total of 4.5 million households in the UK that are living in the PRS, 1.8 million are families with children (Judge and Tomlinson, 2018), a distinct difference compared with the early 2000s when there were only 600,000 of families with children living in the PRS (Judge and Tomlinson, 2018).
There was a meltdown in the UK property market in 2008, house prices plunged by 20% over 16 months, taking an average of six years for prices to return to their pre-crash levels (Morrison, 2018). Nevertheless, parts of London remained unaffected by the fall in prices. ‘Stamp duty’ levied at increased levels up to a certain level of housing price was abolished in 2010 for first-time buyers and this was meant to stimulate house sales (Morrison, 2018). What subsequently followed was a surge of foreign investors flooding the prime property market. They were attracted by reduced property prices, making London the centre of a speculative market with the emergence of global corporate landlords (GCL), who bought properties as investments in what, by then, had become a new asset class (Beswick et al., 2016; Dorling, 2014). This trend has led to a big expansion in the private rented sector, which is expected to continue to increase over the future years (Colson, 2017). The private rented sector (PRS) has experienced accelerated growth as a consequence of this global financial crisis, with the proportion of new households who are renting privately increasing substantially, while existing households in the PRS are staying for a longer period (Kemp, 2015). Greater demand on the PRS is a result of slumps in spending, marked by a prolonged fall in the housing-sector transactions, especially as financing mortgages have become increasingly more difficult to obtain. With a mortgage-tightened market, the ‘Bank of mum and dad’ or family loans act as the UK’s ninth-biggest lender, funding more than 300,000 deals worth some £77 billion in housing finance in 2016, further extending the gap between those who can buy a home and those who can not (Walker, 2017). Also, trading up in the housing market, such as moving to a bigger home, has thus become increasingly difficult (Colson, 2017).
The crisis has exacerbated the UK’s long-standing tensions in housing provision (Whitehead and Williams, 2011). Since 2008, new housing developments are facing increased risks and financial difficulties, reducing the market’s confidence, lowering the willingness to buy despite reduced mortgages, and resulting in added restrictions on commercial and government lending (FTI Consulting LLP, 2012). This has hampered the availability of new supply, pushing prices up further generally. The credit crunch has transformed the nation’s housing market, and to reach equilibrium, the UK housing market needs to increase supply by an average of 1% a year in general, and this number is higher in London (Kay, 2017).
Airbnb: An additional contributor to the housing crisis?
Even without adding Airbnb to the equation, London had undergone a long history of complex housing problems. Hilber (2015) found that for similar flats, the rental price-per-square metre in London is the second highest in the world, below Monaco and followed by Hong Kong, New York and Paris. Nowadays, the rapid growth of short-term holiday rentals such as Airbnb is feared to have worsened the housing crisis and affordability in many large cities, if not in most cities where there is a significant presence. Past research has examined Airbnb from the important perspective of exploring the effects of short-term rentals on the housing market, touching upon the possible impact of Airbnb with respect to the gentrification of neighbourhoods (Horn and Merante, 2017; Lee, 2016; Wachsmuth and Weisler, 2018). Based on the analysis by Wachsmuth and Weisler (2018), where the relationship between gentrification and short-term holiday rentals was examined, Airbnb appears to be forcing a new kind of rent gap. It allows the new revenue flow from short-term rentals through the platform, mainly in areas that are currently gentrifying or that are post-gentrified neighbourhoods.
Barron et al. (2018) analyse the overall effect of home-sharing in the USA in increasing house prices and rents by reallocating the housing supply from long-term to short-term rentals. In New York City, doubling the Airbnb activities is associated with an increase in property values between 6% and 11% (Sheppard and Udell, 2018). The trend of Airbnb as a possible contributor to the increase of rental rates is found in many international cities, such as Barcelona (Garcia-López et al., 2019), Los Angeles (Lee, 2016), Boston (Horn and Merante, 2017) and in Ireland (Lima, 2019). Moreover, there are many misuses through short-term holiday rentals in the housing market where hosts list more than one offer, for example in Berlin, as many as 0.30% of the total housing stock – some 5555 properties – are being misused as Airbnb listings (Schäfer and Braun, 2016). Other studies point out that Airbnb only comprises a small amount compared with the city-wide housing stock (Snelling et al., 2016), but these arguments do not take into account the fact that the housing stock and its occupants can be quite inert in the short term. Thus establishing causalities between rental changes and Airbnb presence is a challenging research question.
In this article, our prime focus is on assessing the scale and spatial distribution of Airbnb misuse – where Airbnb rentals do not conform to local regulations in which hosts own multiple listings. This study contributes to previous studies measuring Airbnb potential effects to the rental price increase, such as those by Barron et al. (2018), Horn and Merante (2017), Lee (2016), Sheppard and Udell (2018) and other scholars, by proposing a more targeted case of Airbnb misuse such as the analysis in Schäfer and Braun (2016). We do this by looking at the relationship between the level of misuse and the housing characteristics of the area, such as the diversity of dwelling types, the housing tenure and the rental distribution. This is especially important in a city such as London, where there is a rising urgency in developing affordable housing. Thus, any factor hindering residents from long-term housing needs to be investigated closely. To identify possible disruptions associated with the presence of Airbnb in London, we will explore a wide range of data sets:
Accommodation data from the 2011 UK Population Census that refer to the types defined by the use of the dwellings according to the typology of the buildings.
Housing tenure data at LSOA and Borough level from the Census 2011 and the Office for National Statistics, respectively, which contain a summary of areas with the proportion of the type of home tenure in 2011 (LSOA) and in 2015 (Borough).
Airbnb data from Inside Airbnb (http://insideairbnb.com) from 2015 to 2019. Listings refer to properties (including the entire property, private rooms or shared rooms) advertised on the Airbnb platform.
Housing supply data from the Valuation Office Agency (VOA). These data consist of the number of houses in each London LSOA (Lower Super Output Area), making up the total building stock available for London dwellings in 2015.
Zoopla rental price data (Zoopla Limited,© 2018 from the Economic and Social Research Council. Zoopla Property Data. University of Glasgow – Urban Big Data Centre), based on the 1.3 million available rental units at postcode level. For consistency throughout the analysis, the data have been pre-processed and aggregated at Borough level.
Net additional dwellings data from the Ministry of Housing, Communities and Local Government that calculate the addition from the new house building completions, gains or losses through conversions, changes of use (e.g. a conversion of a shop into a house or a barn), demolitions and other changes to the dwelling stock. We only incorporate data from 2015 to 2017 in this study.
Euclidean distance from Borough centroids to the city centre computed by measuring the differences in distance using the latitude and longitude of each borough centroid to the City of London (assumed as the city centre).
Possible misuse of Airbnb properties
There are different types of Airbnb rentals: an entire property – where the owners or hosts generally do not reside in the property – and a private/shared room where hosts are mostly present. Based on a study using semi-structured interviews with Airbnb hosts who use the platform, one of the most repeated extrinsic motivations for renting through this peer-to-peer market, is to supplement rent or mortgage payments (Ikkala and Lampinen, 2015; Jefferson-Jones, 2014). This is also particularly true in the case of London, in which sharing accommodation or long-term sub-letting is a common practice to lessen the burden of the cost of renting or owning a house. This might be one of the reasons why Airbnb is very popular in cities where the cost of living is relatively high, mainly because it provides a channel for extra earnings.
Figure 1 provides a series of cumulative temporal snapshots of the Airbnb listings in 2018, that is, it shows the set of listings that were available (from the currently existing ones) for booking since specific years in Central London. There are more than 69,000 observations (Airbnb rentals) in London, from which about 50,000 (72%) have at least one review, and these can be used as a proxy for active listings on the platform. Previous studies have discovered that one of the characteristics of Airbnb locations is the proximity to tourist attractions (Guttentag and Smith, 2017; Volgger et al., 2018). We thus show the key attractions in London based on Visit London 2015 Data which showcases the concentration of tourist attractions around the River Thames (far left of Figure 1). The maps show that very few Airbnb listings currently available were hosted since 2008, and they are all located to the north of the river (with a total of eight listings). The distribution of London tourist attractions is concentrated in the central areas north of the river, in alignment with the distribution of older Airbnb establishments. The previous study by Li et al. (2016) finds that the turnover of establishments on the Airbnb platform is relatively high, where 49% of the hosts exited the market after registering based on 18 months of observations of Airbnb between 2012 and 2013. They also found that non-professional hosts (those with only one listing instead of multiple listings) were 13.6% more likely to exit the market (Li et al., 2016).
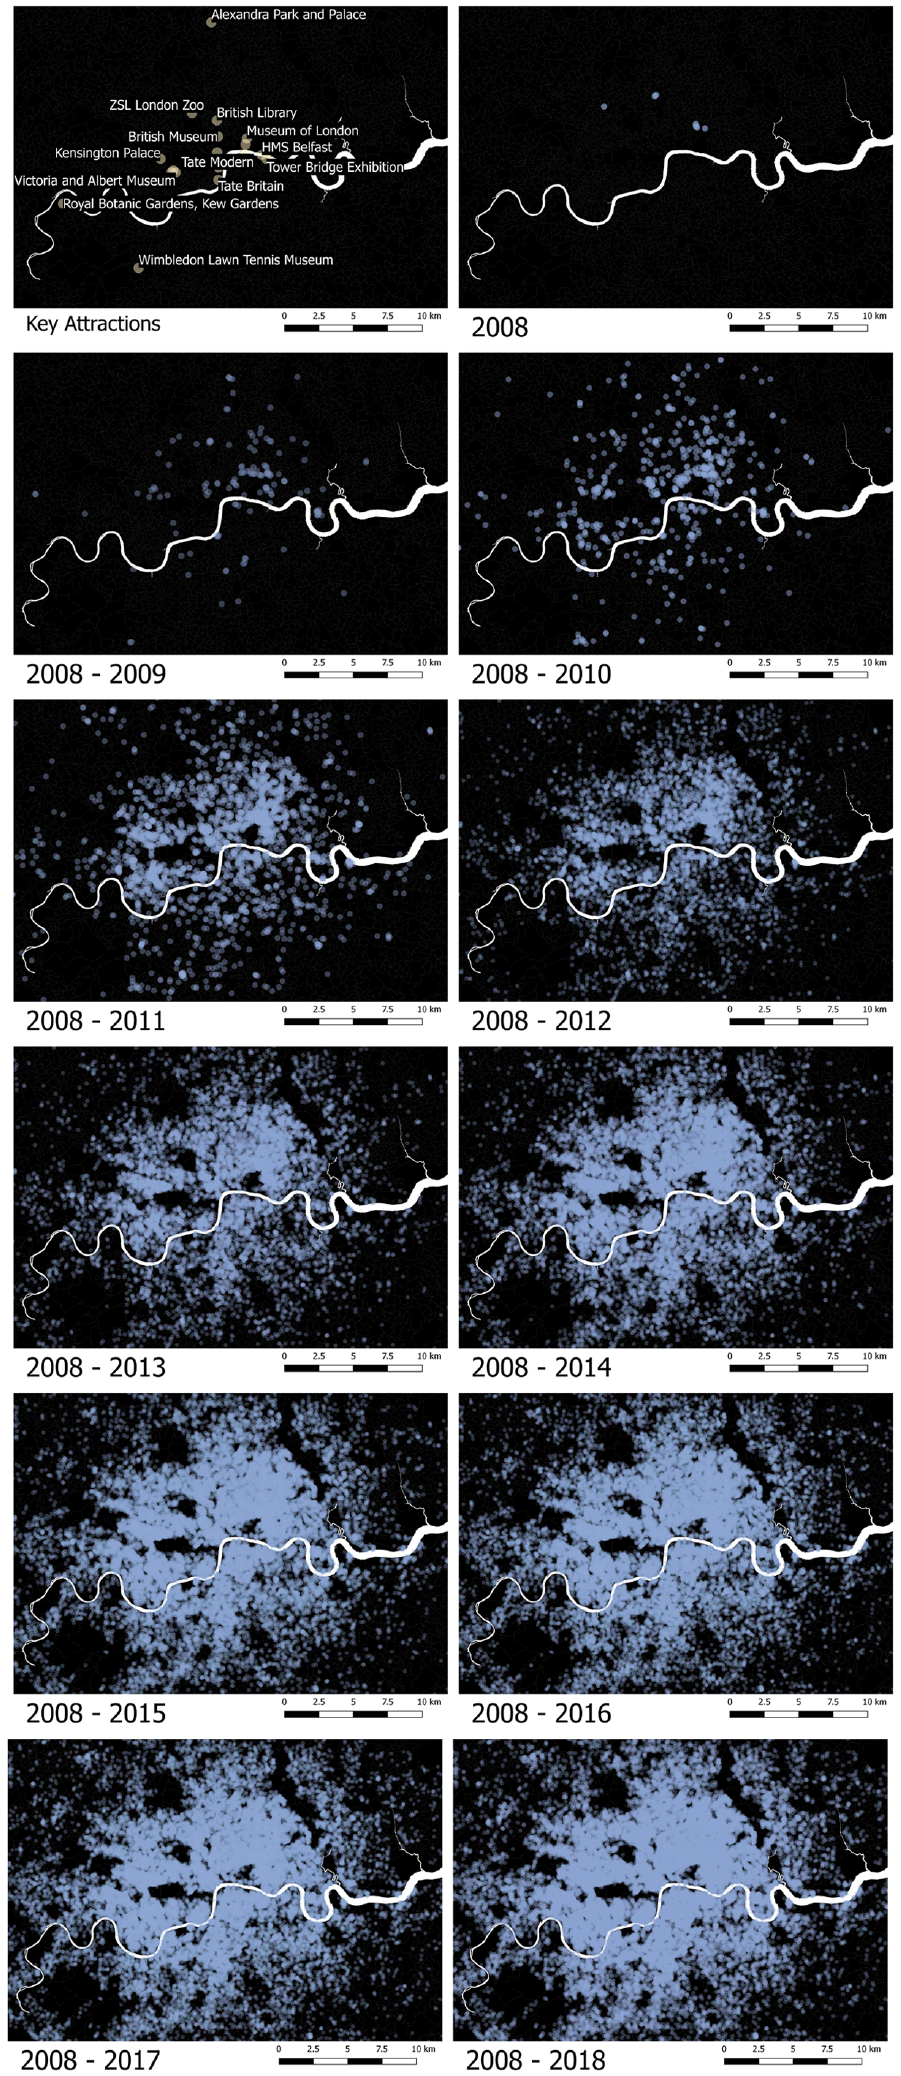
The accummulation of Airbnb listings accessible for bookings in May 2018 according to the time of first listing.
In terms of regulating the platform economy, London has implemented Section 44 of the Deregulation Act (HM Government United Kingdom, 2015a) allowing Londoners to rent out properties for up to 90 cumulative days without planning permission, provided that there is no change of use (for which planning permission would be required) (HM Government United Kingdom, 2015b). This deregulation amended Section 25 of the Greater London Council (General Powers) Act 1973 and placed a cap on the number of days people can freely short-let their properties. This deregulation has left local institutions (such as councils) the resource-intensive task of managing and enforcing the new regulation, which is challenging as there is no formal notification process for short-term letting, nor transparency of usage at the platform level (Ferreri and Sanyal, 2018). The relaxation of the deregulation related to the platform economy might be one of the reasons why Airbnb has grown uncontrollably over the years.
The study by Schäfer and Braun (2016) analysed the misuse of Airbnb in Berlin by looking at the lettings not complying with the local regulation. In this work, similarly, we identify the supply of Airbnb hosts complying with the current 90 days limit regulation and those who do not.
In the case of London, we define possible misuse using the following criteria:
Entire property listings that are offered for more than 180 days cumulatively in one year, assuming that the occupancy rate is 50%. 1 These have a higher chance of being booked for more than 90 days annually (which violates the 90 days limit for letting properties as holiday rentals in London).
Airbnb misuse are entire property listings that are offered for more than 180 days cumulatively in one year in which hosts have multiple (two or more) listings.
From Figure 2 we can see that the proportion of Airbnb compared with the total housing supply, has grown from 0.75% (25,000 properties) in 2015 to 2.38% (80,000 properties) in 2019. Such growth is continuously increasing, as Airbnb keeps expanding in terms of their supply and more people participate in the platform over the years. Figure 2 shows the proportion of Airbnb in general and the possible misuse over five years. It examines the proportion of entire Airbnb properties according to the annual availability (if listings are available for more than 180 days), as well as whether the hosts have multiple listings – indicating possible misuse. Based on the Valuation Office Agency data, there are approximately 3.4 million dwellings in London, and compared with this number, houses advertised through the platform comprise quite a small percentage of the overall housing supply. This number might not appear to be very significant. This is due to the concentration of Airbnb in some areas, leading to some regions experiencing more pressure from Airbnb conversions compared with others.
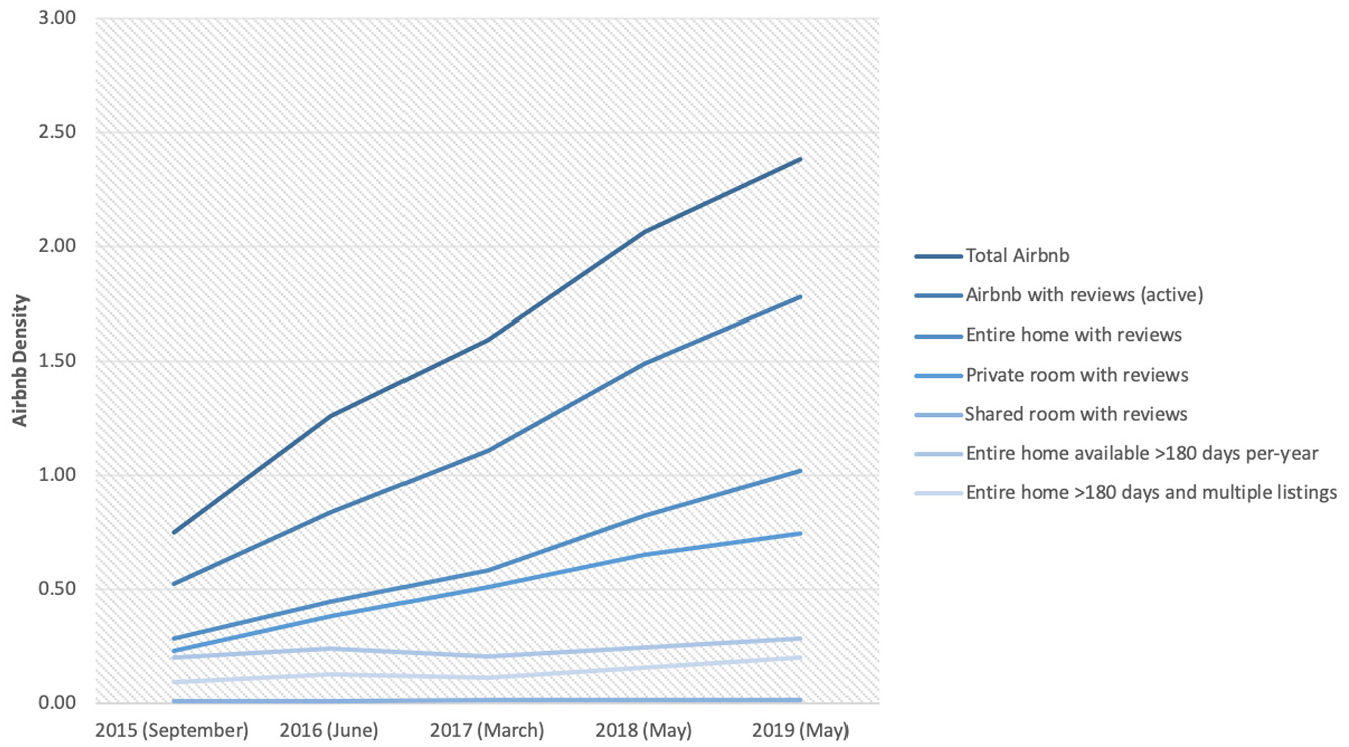
Percentage of Airbnb supply from 2015 to 2019 and possible misuse based on the number of days properties are being offered and whether hosts have multiple listings. In 2019, almost 2.5% of the housing supply has been advertised as short-term rentals. The density of Airbnb in location is calculated by dividing the total number of Airbnb with the overall number of available dwellings representing the housing supply.
To gain a finer understanding of the distribution of Airbnb listings according to their types, Figure 3a provides a snapshot of the Airbnb data for May 2018 organised into totals at the Lower Super Output Area level (LSOAs), which typically have an average population of around 1500 in London. London is a fairly mono-centric city in terms of its activities and employment centres (Buck et al., 2013), so we would wish to see if this is also the case for the Airbnb distribution. We can see that although Airbnb intensity tends to increase towards the city centre, as has been confirmed in previous studies (Dredge and Gyimóthy, 2015; Gutiérrez et al., 2017), the Airbnb phenomenon extends well beyond the central areas. We have examined the Airbnb distribution in all 4835 LSOAs and found that 82% of the areas (3982 LSOAs) have at least one active Airbnb listing. This also aligns with the findings by Coles et al. (2017) which suggest that although centrality is the main driver in Airbnb locations, Airbnb listings have become geographically more dispersed than many other comparable establishments such as hotels, guest houses and hostels. Figure 3a shows that more than 23% of available housing is being advertised through the platform. From the overall proportion, more than 16% of the dwellings are entire property listings that are being advertised as holiday rentals. The numbers for private and shared room proportions are lower than for entire property proportions at approximately 11% and 2%, respectively.
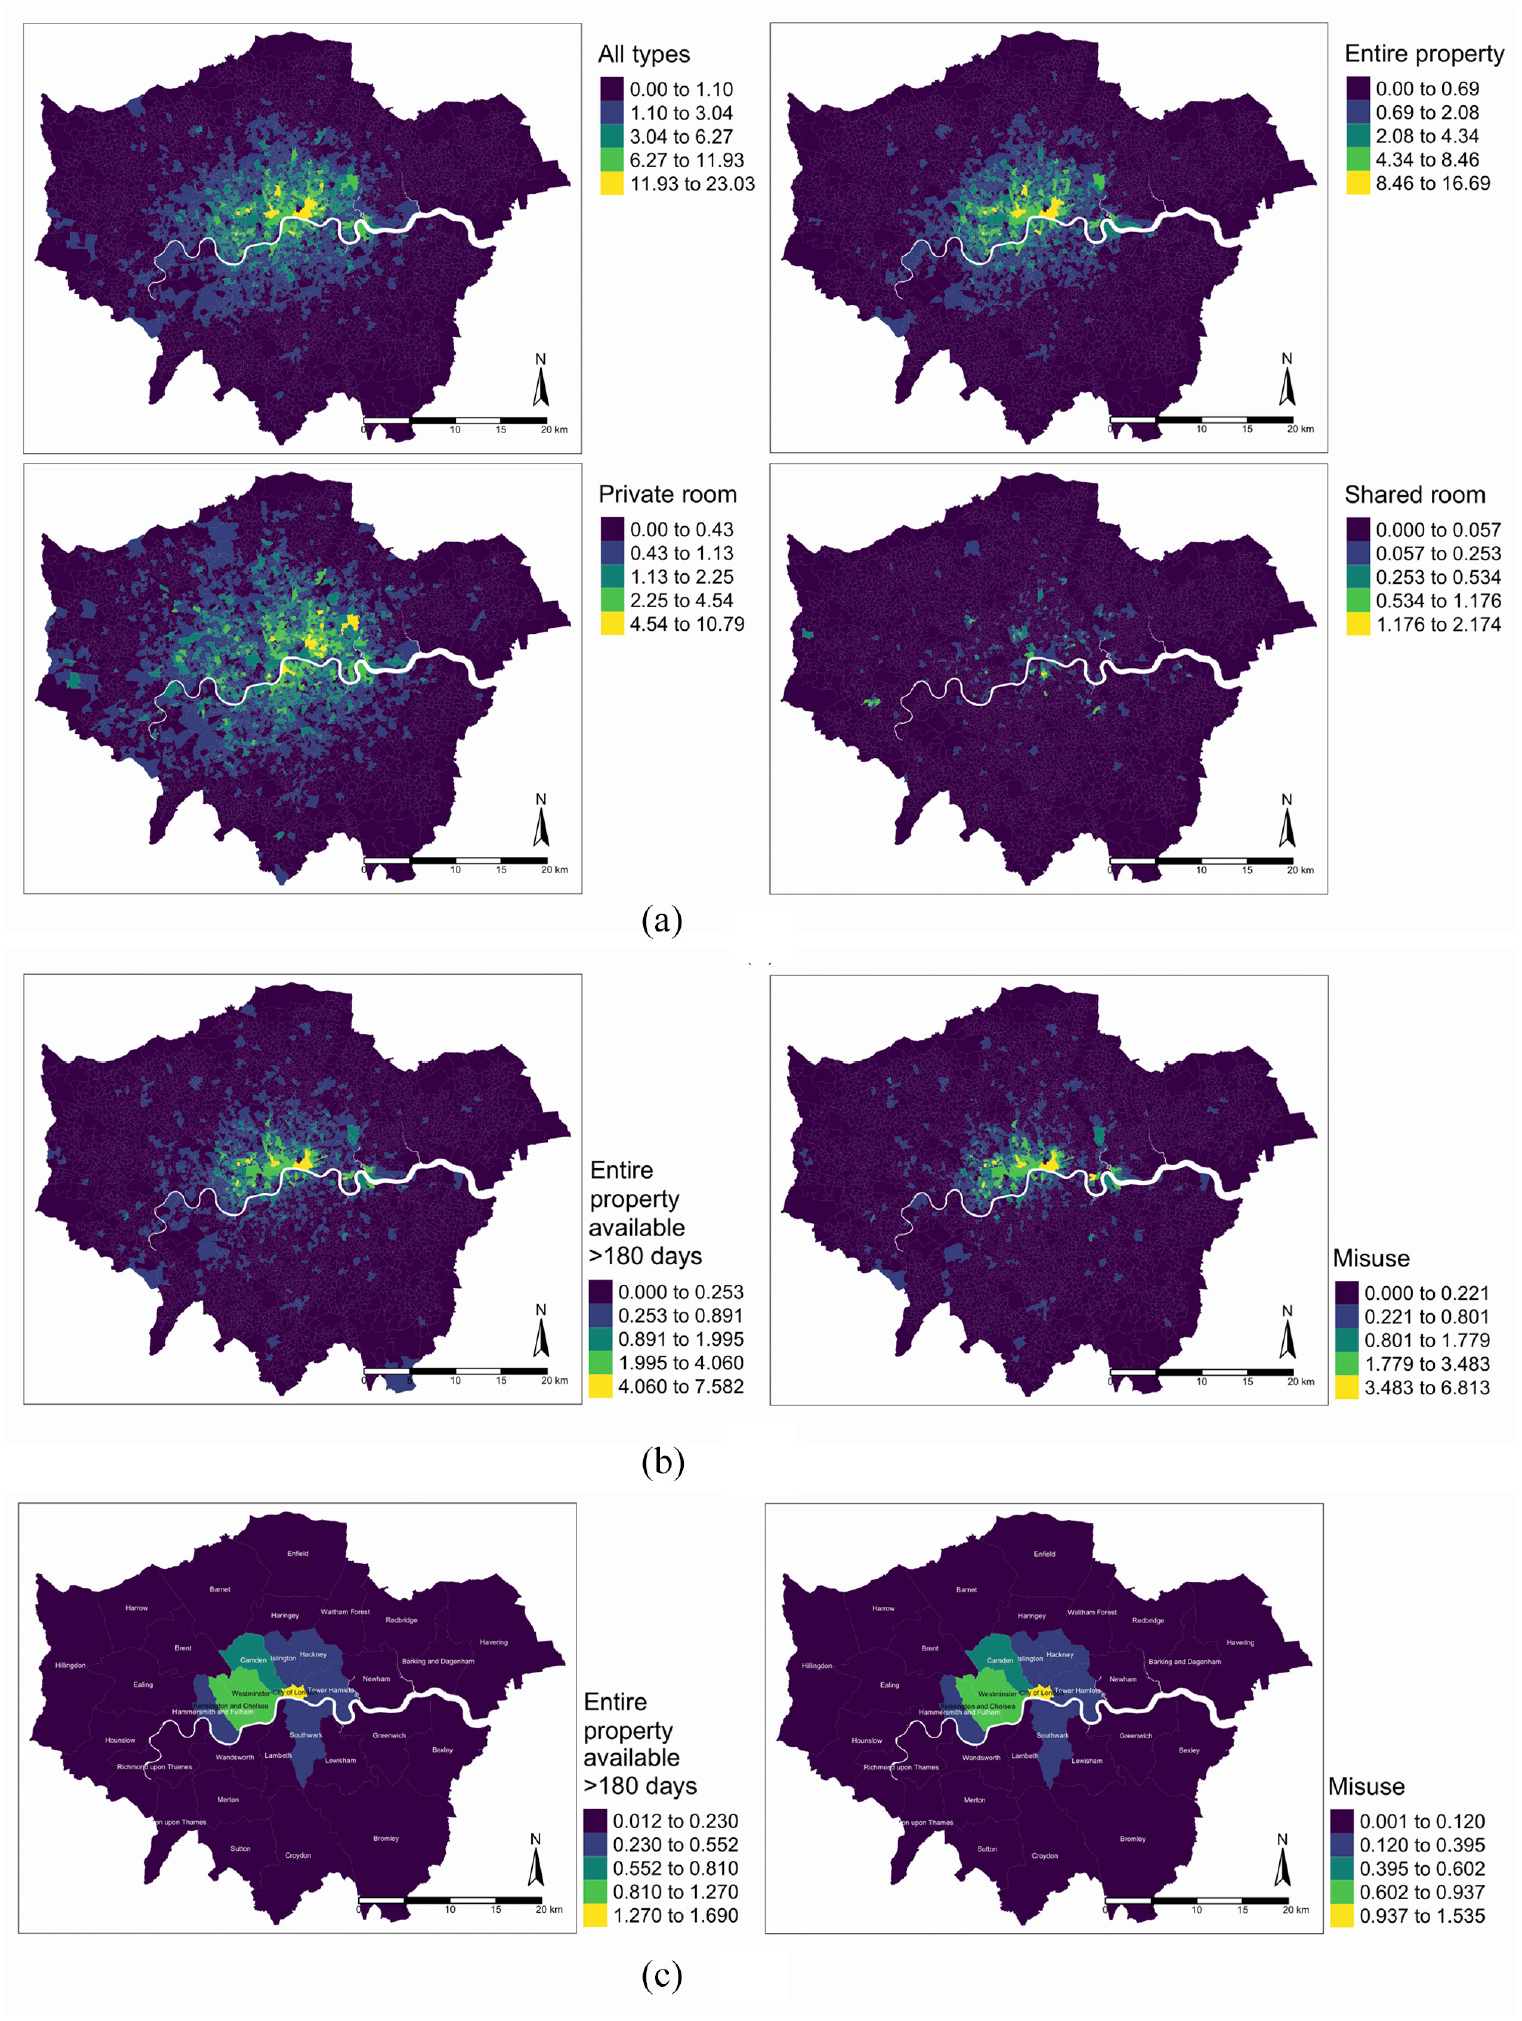
(a) Proportion of Airbnb according to room types, (b) proportion of possible Airbnb misuse at LSOA level, (c) proportion of possible Airbnb misuse at Borough level. Airbnb data are compared with the overall housing stock and shown as percentage values.
Based on our previous criteria of possible misuse, Figure 3(b) and (c) show the geographical distribution of Airbnb properties that are being advertised for more than 180 days annually and are possible misused Airbnb properties. For comparison, these spatial representations are being visualised at two different scales: LSOA level and Borough level. The purpose of displaying two different spatial scales is to emphasise the point that when looking at a finer spatial scale, Airbnb is concentrated in some small geographical locations. Here, the possible implications of how they encroach on the availability of housing for permanent residents is more apparent. In 2018, approximately 0.25% (8200 properties) of the entire housing stock in London were advertised through the Airbnb platform for more than 180 days annually as entire property listings. Meanwhile, around 0.16% (5300 properties) of those are possible Airbnb misuses. When looking at the LSOA level as shown in Figure 3(b), around 4%–7.5% of the housing stock of some LSOAs in Camden, Westminster, the City of London and Hackney contain entire property listings that are advertised for more than 180 days annually. A slightly lesser proportion, from 3.5% to 7% of the housing stock in those LSOAs falls into the category of possible Airbnb misuse. Based on Figure 3(c), at the Borough level, up to 1.5% of the housing stock in the City of London can be categorised as possible Airbnb misuse. This is followed by up to 0.9% in Westminster and Kensington and Chelsea. This number is up to 0.4% of the housing stock in Tower Hamlets, Islington, Hackney and Southwark. These are the areas where house prices have soared and the problem of affordability is critical.
In New York City neighbourhoods, Coles et al. (2017) found that Airbnb is most profitable in middle-income neighbourhoods when compared with renting for permanent residents. Areas such as Tower Hamlets and Hackney are amongst those with the highest Airbnb supply and, according to Savills (2014), these two middle-income areas have been experiencing the highest influx of affluent newcomers and creative workers over recent years (Savills, 2014). So, there is an indication that the trend in New York might also be happening in London. Since 1998, prices in the east London borough of Hackney, have increased by 568%, pushing the average cost of a flat above half a million pounds to £515,600, which is amongst the highest price increase in London during the last 20 years (Ivey, 2018). In their New York study, Wachsmuth and Weisler (2018) found that a significant Airbnb revenue stream appears in post-gentrified neighbourhoods, where the process of rent increases and displacements have happened already and neighbourhoods are transforming or have been transformed into wealthy areas. This seems to also be applicable to London in the wealthier areas in Central and West London and in those already gentrified in East and South London which are the primary areas for Airbnb.
Possible Airbnb misuse and the relationship between housing characteristics based on the diversity of dwelling types and tenure
In this section, we examine two housing characteristics, namely dwelling types and tenure and analyse their relationship with the distribution of Airbnb misuse. We employ Shannon’s entropy to measure the spatial diversity of dwelling types in London. Entropy is a prominent measure which lets us study the complexity of cities in terms of their functional mix and heterogeneity (Batty et al., 2014; Wilson, 2013). It is a measure of variance, where the maximum is reached when the distribution of types is uniform or completely heterogeneous and the minimum when the distribution is peaked around a single type thus representing extreme homogeneity. Note that heterogeneity and homogeneity pertain to each unit of space (the LSOA) over which the distribution is measured in this context. The concept of entropy has been used in geography for different research purposes ranging from measuring urban land-use change and composition (Tan and Wu, 2003; Zhao et al., 2004), to describing the geographic concentration of economic activity (Garrison and Paulson, 1973), as well as in urban spatial interaction modelling (Jat et al., 2008). In this article we use it in its statistical form as a measure of heterogeneity, employing Shannon’s entropy, where information varies inversely with the probability of occurrence.
To construct this measure, let us define the probability
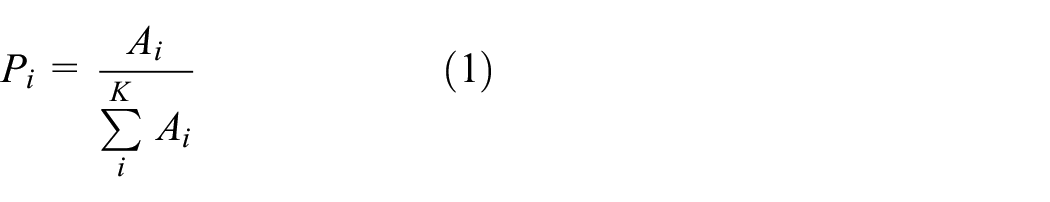
where

while its maximum

Entropy is thus a measure of heterogeneity with higher values indicating a higher number of dwelling types in an area (with more diversity or a greater mix). Using the data, we calculate the entropy for the distribution of dwelling types in each of London’s LSOAs using equations (1) and (2). Maximum entropy, defined using equation (3), is achieved when all types are equally likely, thus presenting maximum diversity (Atkinson et al., 2014). The maximum value for our case is approximately 1.94 (indicating that there are seven dwelling types (ln 7) present in that area with an equal proportion in each) while the minimum entropy is 0 (indicating an area dominated by a single dwelling type).
Figure 4 shows the correlation matrix [
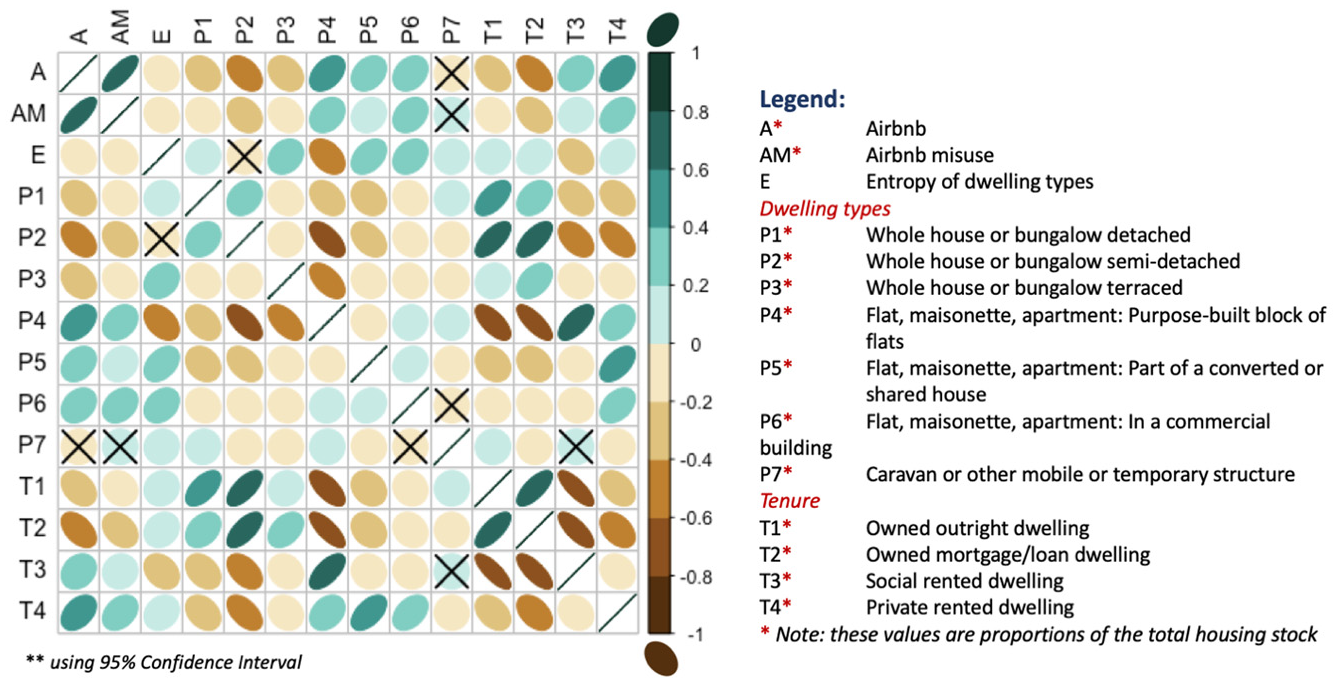
Correlations of Airbnb and dwelling types.
The variables can be visualised in the map of Figure 5. Figure 5(a) shows the entropy of dwelling types where the darker colour indicates higher entropy values, meaning that those areas have a greater diversity of dwelling types. The entropy measure negatively correlates with Airbnb misuse and from Figure 5(a) we can see that the core of inner London Boroughs seems very homogeneous (with low entropy ranging from 0.05 to 0.62), where heterogeneity filters out towards the periphery of the city. The outer London Boroughs are thus dominated by diverse dwelling types (with mid to high entropy values). Past research tends to associate the diversity of the city with its land-use mix, but this is very different from the picture we have presented in this article. We focus on the diversity of dwelling types. This finding can be linked to the history of housing in London with its concentration of purpose-built flats dominating the Central and Eastern areas from the 1980s onward. This results in low diversity (low entropy) in areas such as the City (of London), Hackney, Tower Hamlets and parts of Kensington and Lambeth, as well as a fraction of housing in Westminster. These low entropy areas happen to be prime locations for Airbnb misuse.
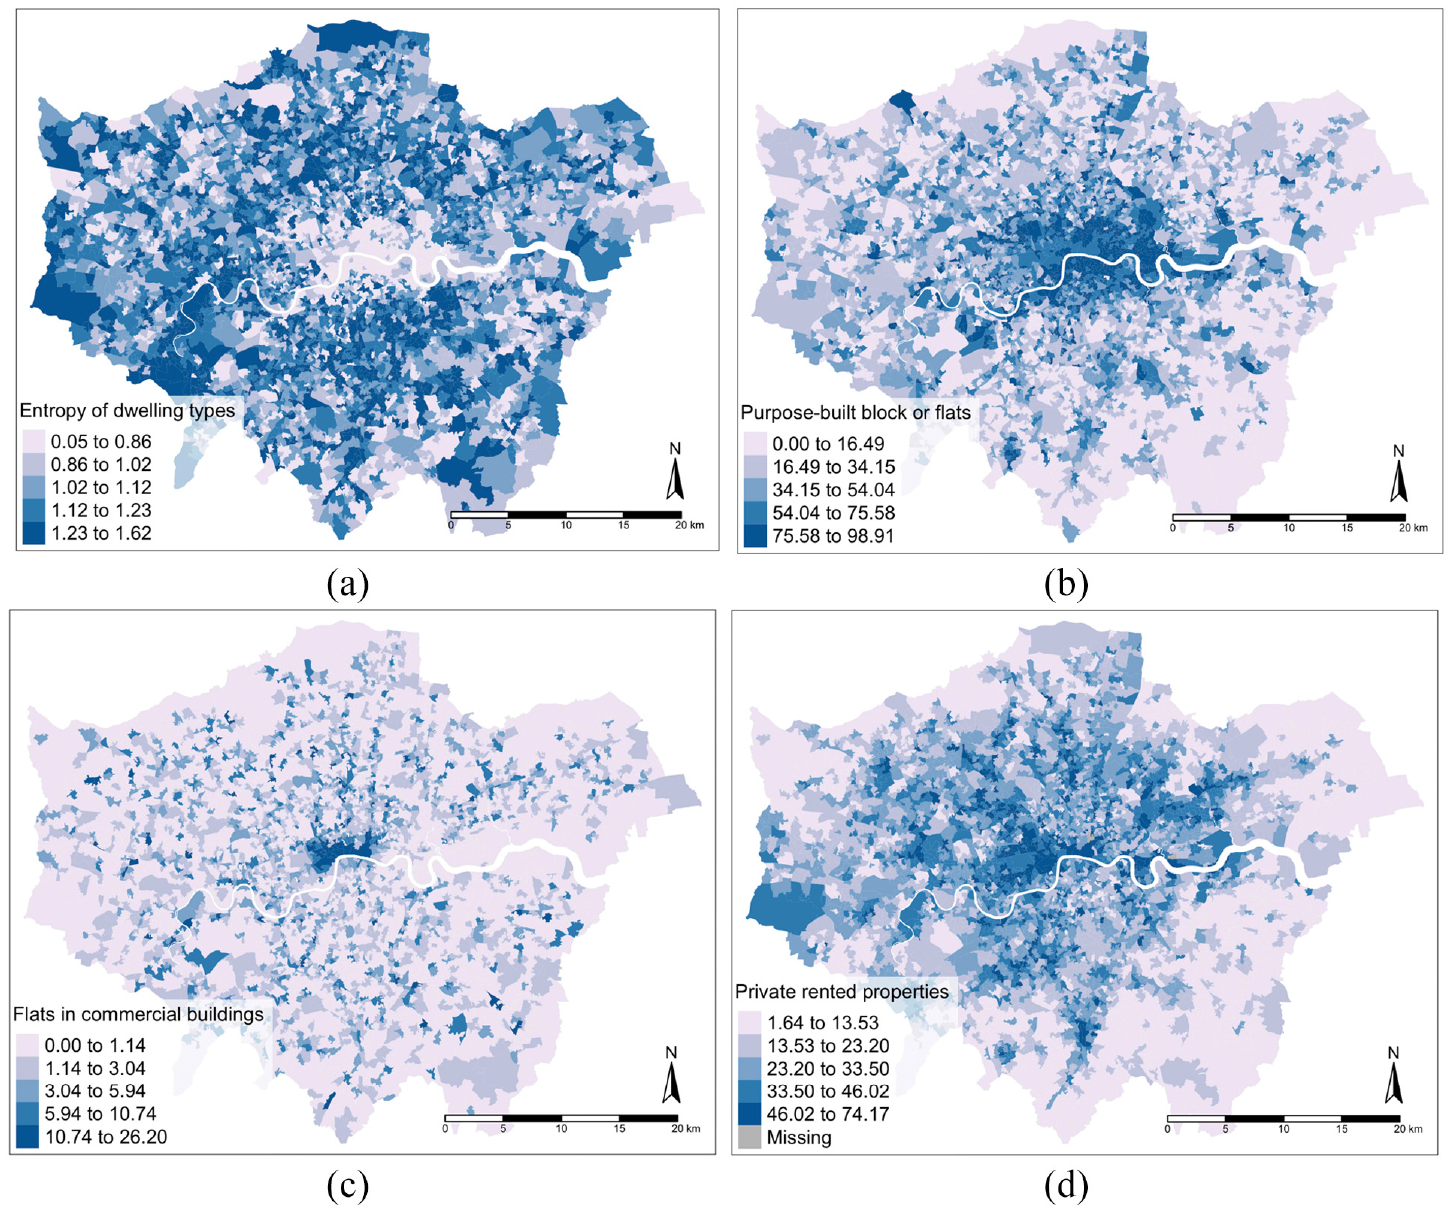
The spatial distribution of the diversity of dwelling types, proportion of purpose-built block of flats, flats in commercial buildings and privately rented properties. The sub-captions show the correlation coefficients
Figure 5(b) shows the distribution of purpose-built blocks of flats (flats that have been constructed originally as flats, as opposed to conversions from other functions). Airbnb misuse shows a positive correlation with purpose-built flat dwellings indicated by an
Figure 5(d) shows that Airbnb misuse has a positive correlation (
Modelling rental changes in London Boroughs and their Airbnb misuse associations
To complete the analysis, we model various factors that might have close associations with rental price changes in London Boroughs, through a linear model fitted using multiple regression analysis. This method allows us to examine the linearity of the relationships using multiple variables or covariates within the same model. As we focus on the price index of an area rather than on individual dwellings, we move away from LSOA to Borough scale. Thus, the rental price changes are based on individual Zoopla property data aggregated to Borough level from 2015 to 2017. Figure 6(a) shows the year-to-year variations of rent prices in each London Borough based on the analysis of 1.3 million sample asking rental price data (2010–2017). More variations can be found in areas where rent prices are higher than the rest of London, such as Kensington and Chelsea, Westminster and City of London. This is possibly due to two causes: the nature of the area and the nature of the data. First, these areas have some prime properties with very high prices that might distort the data. Any sudden spike (or drop) in prices for these properties might bring up (or bring down) the overall mean prices. Second, the property asking prices in Zoopla are used as samples in determining the rent, and these samples are geographically uneven. However, even with these limitations, our data provide an adequate snapshot of the nature of the rental price market in London.
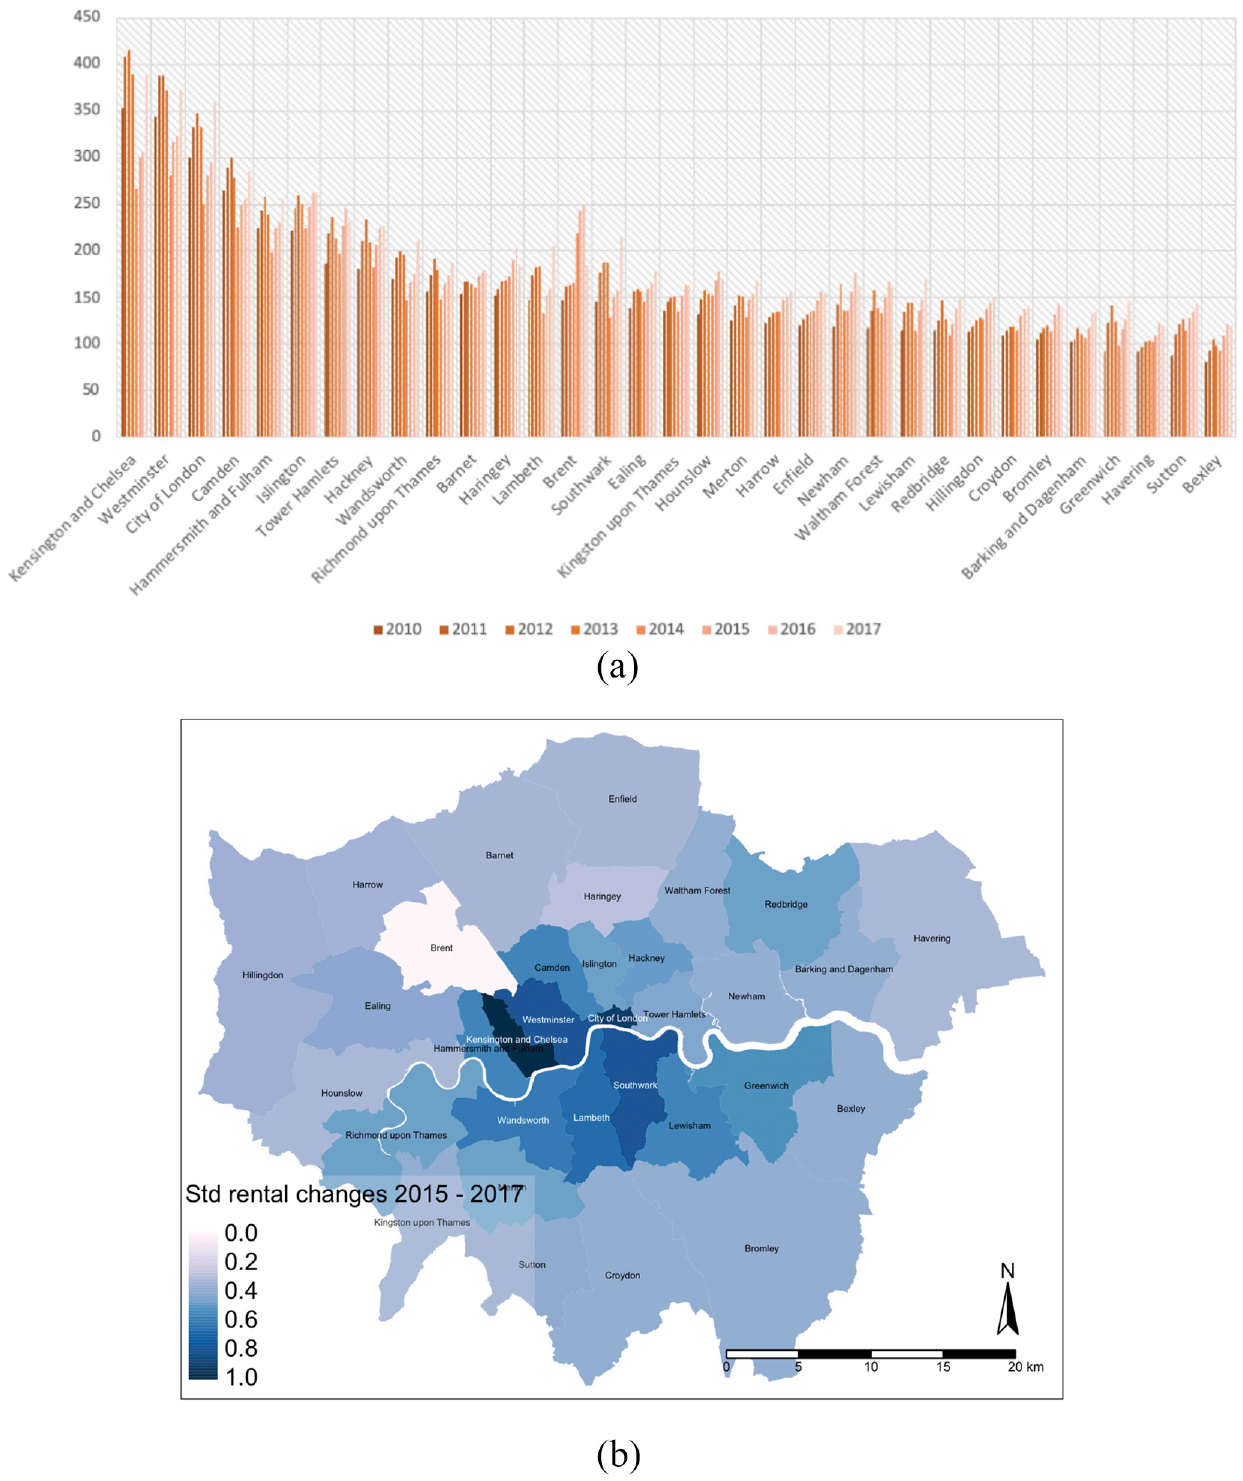
Asking rental price in London Boroughs. (a) Year-to-year variations of rental price per-bedroom per-week in London Boroughs. (b) Standardised rental changes in 2015–2017.
Figure 6(b) shows the spatial distribution at the coarser spatial scale for 32 Boroughs and the City of London. The trend shows an overall cumulative increase in all London Boroughs from 2015 to 2017. We use standardised rental change values after applying the min–max normalisation method (Jayalakshmi and Santhakumaran, 2011). The highest rental changes occur generally in areas in central London and south of the River Thames, especially in Lambeth, Southwark, Hammersmith and Fulham, Wandsworth, Camden, City of London, Westminster as well as Kensington and Chelsea where rent changes in the range of 20%–43% have occurred. To validate this finding, we compare the rent increase with the previous study by GMB London, a British Trade Union, that compares the rent increase with the rise in wages. The study shows that the overall rental price for a two-bedroom flat in London has increased by 21.7% between 2011 and 2018, while monthly earnings have increased by 9.1% (GMB London Region, 2019). The largest gap between rents and pay-rises occurs in Greenwich where rent prices have increased by 50% with only 7.2% change in monthly earnings (GMB London Region, 2019). This is followed by Lewisham, Newham, Barking and Dagenham, Waltham Forest and Croydon with more than 40% change in rent (GMB London Region, 2019). The report similarly suggests rapid rent increases, especially in South London.
We have discussed previously that the high rental and house prices in London are a product of complex and multifaceted issues. Thus, to simplify this, several important variables are examined. Let us denote by
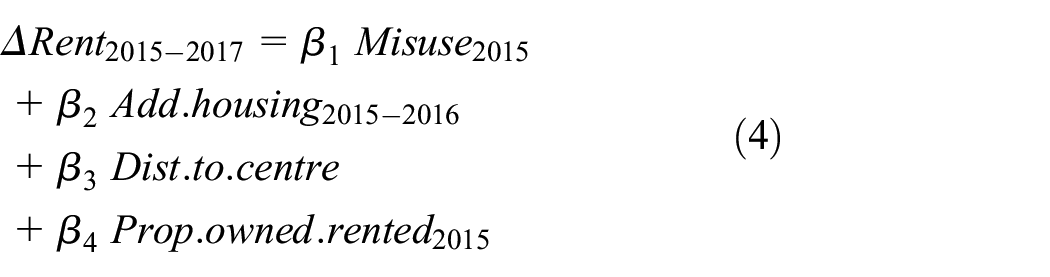
where
Descriptive statistics and VIF values for the response and explanatory variables
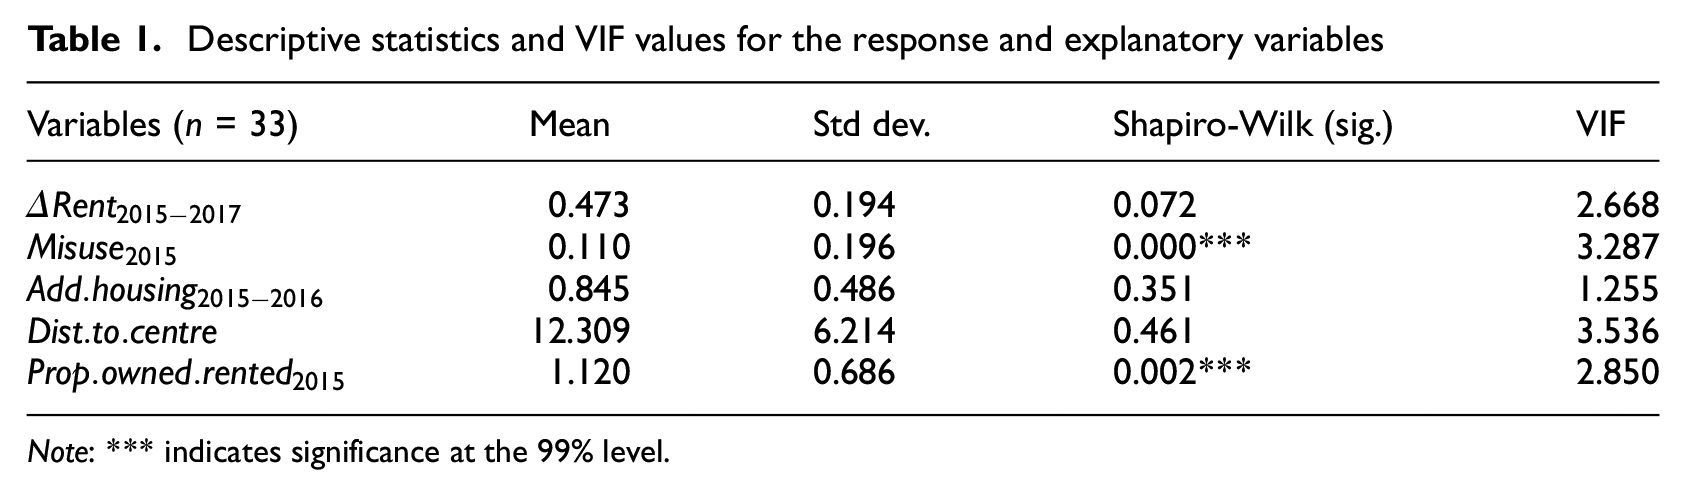
Note: *** indicates significance at the 99% level.
To ensure the validity of our multiple regression results, we compute the variance inflation factor (VIF) and examine whether multicollinearity exists within our variables, indicated by a VIF score above 5 (Wheeler, 2007; Wheeler and Tiefelsdorf, 2005). Table 1 shows low VIF values, thus multicollinearity is not a problem in our data set. Furthermore, to examine the normality of our data distribution for each variable, we apply the Shapiro-Wilk test (Shapiro and Francia, 1972). The statistical test shows a significant departure from normality for variables
We apply multiple regression to model the relationship between the rental price changes in 2015–2017 and the explanatory variables. The result is presented in Table 2. The model can explain more than 50% of the variance indicated by
Multiple regression result for rental price changes in London Boroughs.
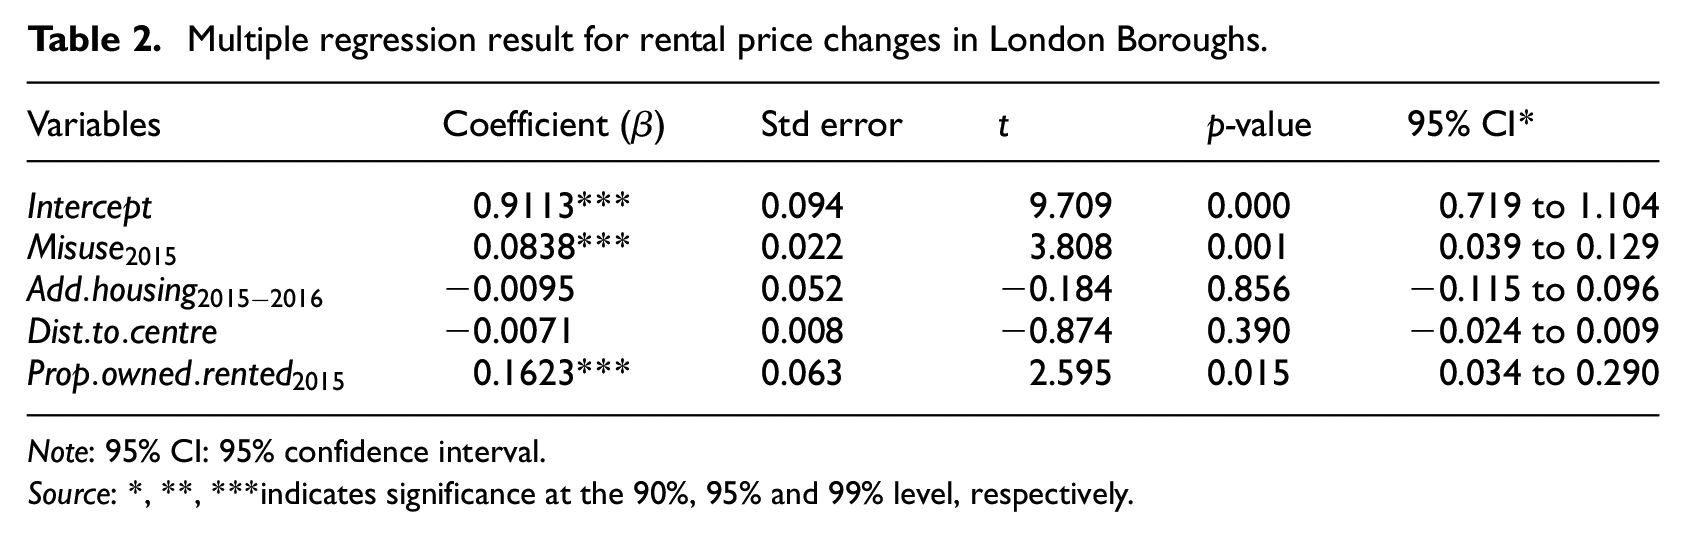
Note: 95% CI: 95% confidence interval.
Source: *, **, ***indicates significance at the 90%, 95% and 99% level, respectively.
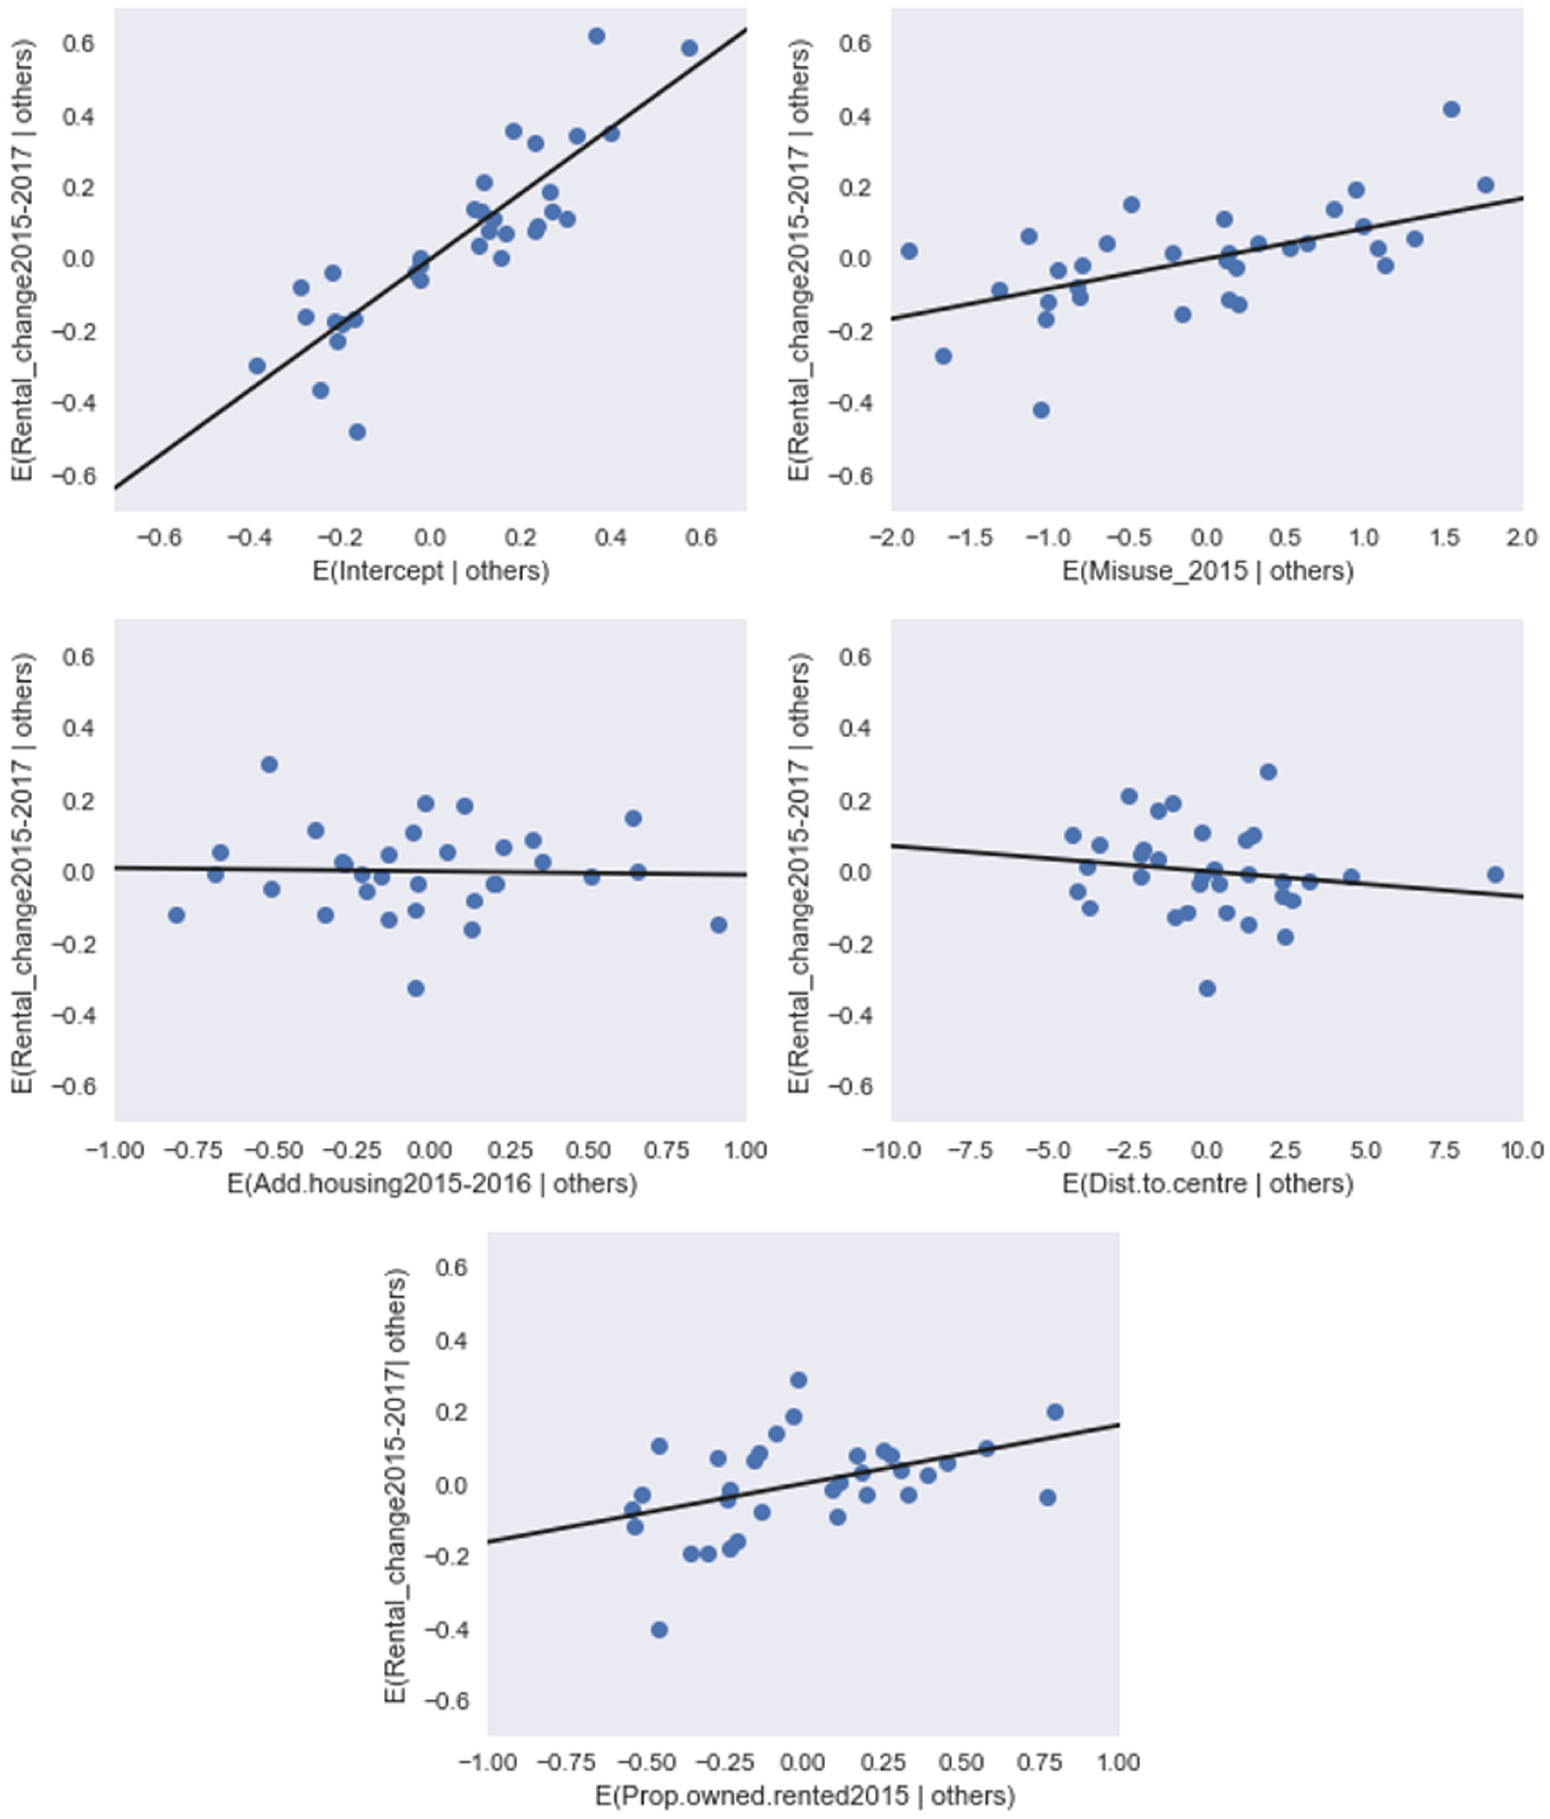
The partial regression plots show the relationships when the variables are modelled together, indicating both positive and negative relationships. The plot shows linear relationship by regressing: (1) the residuals from regressing the response variable (
As with most statistical tests, the validity of our multiple regression analysis depends on whether our data have met the underlying regression assumptions. There are four assumptions for this linear model: variable independence, linearity, normality and homoscedasticity. Violations of these assumptions could lead to bias in the results. We conduct a series of residual analysis, as a well-fitted multiple regression would adhere to the assumptions mentioned previously. The Jarque-Bera test for normality of the distribution (Jarque and Bera, 1987) shows that the residuals come from a normal distribution, indicated by the p-value of 0.8 (>0.05 significance level). We use Breusch-Pagan-Godrey test to account for the homoscedasticity of the errors assumption (Breusch and Pagan, 1979). We found evidence to accept the null hypothesis that there is no serial correlation of the error indicated by the p-value of 0.41 (>0.05 significance level). Our residuals diagnostic shows that our model has met all these regression assumptions.
Discussion and conclusion
The concept of peer-to-peer renting through the emerging online platform economy, such as that developed by Airbnb, has various implications for long-term housing supply. One of the possible implications is the risk of conversion from permanent private rented housing to short-term holiday rentals (Barron et al., 2018), creating a critical problem in a city where the housing market is as overheated and as complex as in London. However, the complexity of the housing system in London makes it very challenging to pinpoint the precise causes of several entangled problems that pervade the housing market. London is facing an extreme problem of unaffordability, supply scarcity and growing numbers of ‘generation rent’, especially for the younger adult cohorts. The presence of Airbnb in the last decade has stimulated concern that its growing usage is feared to have exacerbated the uncontrollable growth of rental prices by constraining the housing supply even further. As such, this study provides the first comprehensive set of measures that analyse the relationship between possible Airbnb misuse and the overall housing characteristics in London.
Based on our analysis, Airbnb misuse is located mainly in areas with low dwelling-type diversity, dominated by flats and apartments. Moreover, Airbnb misuse is associated with a high proportion of private rented properties. As previously discussed in the body of this article, the renting population is at the highest risk of being stuck in the precarious rental market. The assured short-hold tenancy (AST) makes them less protected in this tenure as it gives the right to landlords to (1) evict tenants with just two months notice; and (2) increase rents arbitrarily (Judge and Tomlinson, 2018). With the exponential growth of Airbnb, landlords now have the choice to advertise their properties for permanent residence or to convert their properties to short-term holiday rentals.
Considering the association between possible Airbnb misuse with rental price changes, it is plausible that our speculation that Airbnb disrupts the provision of housing for permanent residents is well-grounded. More than 2% of the total housing stock has been advertised via the Airbnb platform in 2018. Any resulting impact can be especially significant in such areas where the possible misuse of Airbnb properties (especially entire property listings where hosts have multiple listings) take a significant portion of the overall housing stock. At the LSOA level, up to 23% of the properties are advertised in the Airbnb platform in 2018. Up to 7% of these dwellings are potential misuse of Airbnbs that are available for more than 180 days, and for which hosts have multi-listings. This misuse with multi-listings comprises almost 0.15% of the overall housing stock, equivalent to approximately 5300 properties that turn into short-term rentals. Thus, an emphasis should be placed on protecting the supply of rental properties. Considering how fast Airbnb has grown, and given the deregulation and the low level of regulation enforcement encouraging more people to participate (Ferreri and Sanyal, 2018), it would appear that more proper and legitimate use of Airbnb should be enforced accordingly.
Aligned with other scholarly findings such as those by Lee (2016), Horn and Merante (2017) and Schäfer and Braun (2016), we find evidence that Airbnb might be associated with the rising rental price changes in London. Also, our result is comparable with previous research quantifying the possible effect Airbnb has on the housing market. Horn and Merante (2017) found an association of one standard deviation in Airbnb listings with 0.4% increase in asking price, this value is up to 3.1% in census tracts with a high density of Airbnb in Boston. In the USA, Barron et al. (2018) argue that 1% increase of Airbnb listings in a median owner-occupancy zipcode leads to 0.018% increase in rents. Garcia-López et al. (2019) found that in Barcelona, there is an estimated increase in rents up to 7% in areas with high Airbnb activity. Sheppard and Udell (2018) analyse the impact of Airbnb on the property market and found an increase in property values from 6% to 9% when doubling the Airbnb listings within 300 m of a property. To our knowledge, our study is the first to model the association between rental price, and specifically Airbnb misuse, as opposed to overall Airbnb activities. Thus it focuses on quantifying the possible impacts resulting from the violation of short-term rentals. In cities such as London, where the private rented sector plays a huge role in the housing market (Chu, 2018; Future of London, 2017), it is important to investigate this relationship.
This article advances knowledge towards understanding the effects of Airbnb on housing and contributes to the effort of other academics in this direction, such as Horn and Merante (2017), Jefferson-Jones (2014), Lee (2016), Quattrone et al. (2016), Schäfer and Braun (2016) and Wachsmuth and Weisler (2018) to name a few. Nevertheless, more perspectives from different cities are still needed. It is important to conduct such critical analyses to overcome the challenges that arise from rapid developments of new phenomena such as those resulting from the platform economy. Regulations need to be carefully considered in order not to stifle innovation. Platforms such as Airbnb are a key representation of the wider platform economy, encompassing mobility, retailing and capital investment such as housing. Finding the right balance between regulation and allowing innovation to thrive can only occur when these processes are better understood.
Footnotes
Declaration of conflicting interests
The author(s) declared no potential conflicts of interest with respect to the research, authorship and/or publication of this article.
Funding
The author(s) received no financial support for the research, authorship and/or publication of this article.