
Abstract
This article uses big data from images captured by Google Street View (GSV) to analyse the extent to which the built environment impacts the survival rate of neighbourhood-based social organisations in Amsterdam, the Netherlands. These organisations are important building blocks for social life in urban neighbourhoods. Examining these organisations’ relationships with their environment has been a useful way to study their vitality. To extract data on built environment features from GSV images, we applied a deep learning model, DeepLabv3+. We then used elastic net regression to test the relationship between the built environment empirically – distinguishing between car-related, walking-related and mixed-use land infrastructure – and the survival of neighbourhood organisations. This testing approach is novel, to our knowledge not yet having been applied in Urban Studies. Besides revealing the effects of built environment features on the social life between buildings, our study points to the value of easily applicable observational big data. Data captured by GSV and other recently developed methods offer researchers the opportunity to conduct detailed yet relatively swift and inexpensive studies without resorting to overly coarse or common subjective measurements.
Introduction
Neighbourhood-based social organisations are important building blocks for social life in urban neighbourhoods (Vermeulen et al., 2016a, 2016b). These formal associations represent, connect, empower and mobilise residents by providing resources and access to different domains of urban life (Marwell, 2009). They have been shown to revitalise neighbourhoods, distribute resources across them and foster social interactions and solidarity between residents (McQuarrie and Marwell, 2009). In this article, organisations are considered ‘neighbourhood-based’ when organised around a particular small-scale geographic place and generally only operating activities in this local space. Vermeulen et al. (2016b) illustrate that ‘neighbourhood-based’ is especially pronounced for organisations that provide specific leisure services for neighbourhood residents, such as sports clubs, cultural performance clubs and hobby associations. These organisations are characterised by residents’ significant participation in their daily activities.
The absence of neighbourhood-based social organisations, by contrast, undermines social integration in a neighbourhood and can lead to or reinforce problems for its residents. The personal networks of residents in poor, isolated or marginalised neighbourhoods rarely produce sufficient collective resources or social regulation for them to thrive (Wilson, 1987). Local organisations can function as substitutes for this lack of collective efficacy. Past studies have found that having a presence of a variety of neighbourhood organisations is essential for rebuilding areas after natural disasters, such as hurricanes (Sampson, 2012: chapter 7, pp. 370–371). The survival of neighbourhood-based organisations – as social infrastructure (Klinenberg, 2018) – is thus an insightful topic, worthy of attention from urban researchers (Vermeulen et al., 2016a, 2016b).
The vitality of organisations can be studied by examining their relationship with their environments. In this article, vitality is measured as organisational survival rates; the environment is the neighbourhood in which an organisation is located. Past studies permit our assumption that location impacts organisational vitality because resources are unevenly distributed across urban landscapes (Marquis and Battilana, 2009; Vermeulen et al., 2016a, 2016b). In previous research, we looked primarily at how neighbourhood demographics affect the ability of neighbourhood organisations to thrive (Vermeulen et al., 2016a, 2016b). This article seeks to understand the role of urban design – the built environment, at a finer scale – in this process. Lynch (1960) observed that a city has five essential features: paths, nodes, districts, edges and landmarks. Paths are the most profound elements as they collectively provide a foundation for an organisation and the interconnection of the other four features in a city. Not only are streets, as a type of path, a fundamental element in a city, but they also serve as a central, fixed thoroughfare for human activities. Past studies also show how a neighbourhood’s urban design is expected to affect social networks and social capital in the area. Particular infrastructure can either enhance or obstruct the ability of residents to engage in collective action, form neighbourhood networks and foster neighbourhood identification (Francis et al., 2012; Leyden, 2003; Lund, 2002; Wood et al., 2010). Leyden (2003) argues that residents living in what he defines as walkable neighbourhoods with mixed-use land are likelier to know and trust their neighbours, form networks and identify with the neighbourhood. As a result, these areas also display higher levels of political participation, social trust and involvement in local civic activities.
Our study is informed by two significant streams of research. First, we draw from research emphasising the embeddedness of non-profit and voluntary associations in macro-institutional and ecological contexts that shape their organisational viability over time (Baum and Oliver, 1991; McQuarrie and Marwell, 2009; Vermeulen et al., 2016a, 2016b). In doing so, we focus on ‘organisations’ simultaneous embeddedness in both geographical communities and organisational fields’ (Marquis and Battilana, 2009: 285) as a way to understand how neighbourhood infrastructure might matter for organisations that have a close connection with people living in the neighbourhood where the organisations are located.
Second, we look at an emerging stream of research that uses big data to quantitatively examine the relationship between a neighbourhood’s built environment and its types of social behaviour. Methodologically, our study applies contemporary machine learning – referred to as deep learning – and computer vision algorithms to automatically extract objective, detailed and abundant built environment features from street-view images. The growth of worldwide street-view services, such as Google Street View (GSV), has led to a blossoming of literature delineating and evaluating built environments with unprecedentedly detailed information (e.g. Middel et al., 2019; Naik et al., 2017). While most studies have used information derived from street-view images to understand individual-level outcomes (e.g. Gebru et al., 2017; Li et al., 2019), we expand the application to collective behaviours as manifested in the presence and survival of a neighbourhood’s social organisations. We employed elastic net regression (Bruce and Bruce, 2017) to quantify the relationship between built environment features and organisational vitality. Elastic net regression selects and ranks the importance of variables automatically, avoiding the overfitting and inefficiency shortcomings typically associated with the use of ordinary least squares (OLS) in the analysis of large multivariable datasets. While penalised regressions are becoming popular in the fields of data science and machine learning, the technique has been little used in the field of urban studies to date.
The remainder of this article is as follows. The second section provides a literature review, which also helps us formulate the hypotheses of this study. The third section introduces the study area, data and methods. The fourth section reports the results and discusses the major findings. Finally, the fifth section concludes this study and casts light on future studies.
Literature review
Exploring the spatial dimensions of neighbourhood-based organisations
Urban sociological research on the vitality of neighbourhood-based organisations primarily looks at how the local understanding of different forms of organising amongst neighbourhood residents might affect the availability of organisational resources for place-based organisations. Marquis et al. (2007), for instance, show how local understandings, norms and rules can serve as touchstones for organisational activity in a community. In their research, they argue that organisational templates vary from community to community, making some types of organisations more legitimate and, therefore, more present in one community than another. Vermeulen et al. (2016a) show how Amsterdam neighbourhoods can be spaces wherein urban residents interact, produce social norms and articulate a distinctive social order that then affects opportunities for neighbourhood organisations to thrive. Vermeulen et al. (2016b) found that for recreational neighbourhood-based organisations, certain neighbourhood demographics, such as percentages of immigrants or children in the neighbourhood, affect organisational survival rates. The authors accounted for this by referring to the neighbourhoods’ deeper set of shared frameworks on particular legitimate organisational forms and behaviours at the local level, which accumulate through everyday interactions with other neighbourhood residents. These deeper sets of shared frameworks preferred particular types of organisations over other, perhaps more informal, forms, or types.
On the other hand, most voluntary organisations seem to lack such a tight link with neighbourhood constituency (McQuarrie and Marwell, 2009). When that is the case, we find no correlation between the presence of local neighbourhood networks and organisations’ ability to thrive (Vermeulen et al., 2016a). However, that does not necessarily mean that the local environment is irrelevant for the organisation; it matters, albeit in different, less social ways. McRoberts (2005) found that the relationship between one type of organisation and the neighbourhood is more structural and, specifically, infrastructural. In his study, we see how black, mainly immigrant churches in an economically marginalised Boston neighbourhood had members who came from outside the neighbourhood. These organisations served as places where social cohesion was cultivated within affinity groups, sometimes ethnicity-based, rather than related to the organisation’s immediate environment. Moreover, the black churches themselves were communities, seemingly distinct from the neighbourhood. However, McRoberts (2005) also noted the relevance of other local non-social characteristics of the neighbourhood: affordable rents and easy access to outsiders. The presence of major roads and car parks largely explained the churches’ location and ability to thrive as a religious organisation.
This article’s interest lies in organisations that do have a tight link with people living in their surrounding areas. Voluntary leisure organisations are prime examples of such types of social organisations because they create opportunities for local residents to enjoy their free time with others (McPherson, 1983; Van der Meer and Van Ingen, 2009; Vermeulen et al., 2016a). The organisations we discuss here can be broadly categorised according to their main activities: sports, cultural performances and hobbies. Leisure organisations are empirically recognised as the most heterogeneous type of voluntary organisation because their members come from different backgrounds in terms of socioeconomics and sociocultural categories (McPherson et al., 2001; Vermeulen et al., 2012).
Effects of walkable neighbourhoods, an absence of cars and mixed-use land on social capital
The academic literature has consistently described how the structure of neighbourhoods can enhance or obstruct social networks and urban vitality. The classic idea holds that the design of streets, parks and squares has a strong influence on urban neighbourhood residents. Specifically, it impacts their ability to develop social capital, place-based networks and cultural-cognitive collective frames. In her seminal book The Death and Life of Great American Cities, Jacobs (1962: 66) underscored how cities could provide opportunities for different types of social interaction. For instance, pavements help create public spaces by bringing strangers together in socially intimate proximity. These informal interactions encourage activities that can create a collective sense of belonging. The built environment – or ‘life between buildings’ as Gehl (2011) named it – fosters this process by providing opportunities for low-intensity informal social interaction and information-sharing. This is accomplished through urban design that creates accessible, attractive public spaces and, insofar as possible, limits physical obstacles to interactions. In their article reviewing numerous studies within the new urbanism paradigm, Mazumdar et al. (2018: 120) concluded that social capital could be enhanced ‘through the creation of pedestrian-friendly, walkable neighbourhoods with easy access to parks, public transportation and retail outlets, which may also require a high density of dwellings’. Francis et al. (2012) referred to this as the features of neighbourhoods that create such an environment; they cite on the consequences of built environment design for traffic volumes, public aesthetics, public health and neighbourhood interaction as repeatedly demonstrating that physical space and street layout are the cornerstones of street activities and urban neighbourhood life. Neighbourhoods that have these features – usually labelled ‘traditional’– are typically found in older cities (Leyden, 2003: 1546), where religious buildings, community centres and small shops are within walking distance for the local constituencies, and local parks or green spaces are present (see also Kuo et al., 1998; Lund, 2002; Maas et al., 2006; Mazumdar et al., 2018; Sampson, 2012: 44).
As for mixed-use land’s effects on place-based networks, the literature cites two opposing theories. On the one hand, scholars have found that the suburban monotone version of a neighbourhood is unconducive to neighbourhood networks or a sense of belonging. Such neighbourhoods are only composed of residences, offering very few services or public places that spark connections between residents. In these neighbourhoods with low mixed-use land, daily needs are not locally fulfilled because residents encounter each other irregularly, and neighbourhood-based networks are not fostered (Leyden, 2003). Many older, non-suburban and more diverse traditional neighbourhoods do, however, have mixed-use land, combining houses, schools, small shops, religious buildings, parks and neighbourhood centres. These are all places where neighbours can come across one other, which means that daily conversations, unplanned encounters and network formation are likelier to occur. This encourages a sense of trust in and belonging to the local community (Leyden, 2003; Lund, 2002). In these neighbourhoods, the built environment is more diverse and allows for more people’s presence on the streets. The urban design is conducive to people encountering one another, but also provides an attractive physical setting for such interactions (Gehl, 2011).
On the other hand, other studies argue that greater mixed-use land leads to a higher density of commercial enterprises, which also attracts people from outside the neighbourhood. The high presence of outsiders makes it more challenging to create a sense of neighbourhood community, which diminishes the chances for the development of neighbourhood-based networks (Francis et al., 2012; Wood et al., 2010). Studies finding a positive correlation between neighbourhood mixed-use land and sense of neighbourhood community mostly use subjective measurements for mixed-use land, such as perceptions held by neighbourhood residents (Leyden, 2003; Lund, 2002); studies finding a negative relationship primarily use objective measurements (Francis et al., 2012; Wood et al., 2010). More research applying different types of objective measures for mixed-use land and different types of neighbourhood-based collective action is needed to interpret these varying results better (Wood et al., 2010).
In their literature review on the built environment and social capital, Mazumdar et al. (2018: 150) find significant methodological limitations and gaps, such as the absence of longitudinal studies and the use of surplus measures. Some studies measure the built environment objectively using statistical measures based on a geographic information system (GIS). This strand involves analysing the presence of physical barriers and the accessibility of rivers, parks, industrial areas and motorways, or determining population density via census data. However, these objective measures are often crude proxies of the built environment, unable to capture its more fine-grained elements and details. Furthermore, most studies have tended to use subjective measurements through survey data for both the built environment (e.g. perceived distance to closest public open space, type of neighbourhood or walkability of the neighbourhood) and social capital (e.g. perceived social network, neighbourhood contacts or levels of neighbourhood trust). The big data we obtain from GSV images provides objective indicators that have not yet been used to examine the relationship between car- and walking-related infrastructure and mixed-use land at the street level. Nor has it yet been applied to understand the survival rate of neighbourhood-based organisations as an operationalisation of neighbourhood-based social networks and forms of placed-based collective action.
Understanding built environments from street-view images
Streets serve as a central, fixed thoroughfare for human activities. Understanding the characteristics of a built environment from the street view can potentially inform us about individual and organisational outcomes. Unlike satellite or airborne remote sensing, street-view images provide a 360-degree panorama from the perspective of a pedestrian or a car on the street. They can show the road, the pavement, the built environment, street life and part of the sky. In the last decade, a growing number of neighbourhood-scale urban studies have obtained detailed information about the built environment by analysing street-level images. While most empirical studies apply GSV, which since its inception in 2007 has developed the most comprehensive street-view service worldwide (now scoping 83 countries), open-source alternatives exist, such as Mapillary and OpenStreetCam. These services collectively provide analysis-ready global data at fine spatial granularity in a cost-effective manner.
There are at least three ways that studies apply street-level images in empirical analysis for urban studies. First, street-level images have been used for virtual visits to sites (Curtis and Fagan, 2013; Hanlon and Airgood-Obrycki, 2018), as they are low-cost, time-efficient and user-friendly. In a seminal article on gentrification in Chicago, Hwang and Sampson (2014) explained how GSV could be used to detect cues of neighbourhood changes. This study builds on methods developed in the Project on Human Development in Chicago Neighbourhoods. Observers in this project slowly drove a car with a pair of video recorders capturing all social activities and physical features down every street within a stratified probability sample of 80 neighbourhoods. This provided reliable, replicable observational data of sights and sounds, and a sense of everyday street life, which could be generalised according to forms and processes (Sampson, 2012: 88–90). Street-level images have been similarly applied in other studies to validate key built environment parameters manually (Pearson et al., 2019). When official statistics are unavailable or inaccessible, street-view images may serve as the only alternative data source for the built environment (Rambaldi et al., 2013).
Second, street-view images have been used in conjunction with machine learning and computer vision algorithms to extract built environment compositions automatically. With the maturation of deep learning techniques (LeCun et al., 2015) over the past years, detecting everyday built environment features in a street scene has become much more efficient, fast and inexpensive. For example, to identify everyday objects in a street scene, Zhang et al. (2018) applied a deep learning framework in the form of the pyramid scene parsing network (PSPNet) (Zhao et al., 2017). Middel et al. (2019) adapted a fully convolutional neural network (FCN) to delineate urban form and composition through grouping GSV images into six categories: sky, trees, buildings, impervious surfaces, pervious surfaces and non-permanent objects. Other studies have extracted specific urban features from street-level images, such as building facades (Kang et al., 2018), tree inventory (Branson et al., 2018), shade provision (Li et al., 2018) and traffic signs (Campbell et al., 2019). More recently, Ibrahim et al. (2020) reviewed how different deep learning methods can be applied to understand the built environment, noting a surging number of works that classify and segment GSV automatically into several built environment categories. Furthermore, it has been shown how built environment components derived from street-level images enable quantification of human perception of streets (Naik et al., 2016), the visual quality of cities (Ye et al., 2019), the level of light pollution (Li et al., 2019) and the pedestrian-related built environment (Aghaabbasi et al., 2018).
Third, a street-view image-derived measure has been correlated with individual-level outcomes. For example, Rzotkiewicz et al. (2018) demonstrated how built environment data captured by GSV (e.g. walkability, bikeability, obesogenic features) could be linked to human health outcomes (e.g. physical activity, mental health, traffic injury). Built environment features obtained from street-view images have also been used in crime studies (He et al., 2017; Langton and Steenbeek, 2017).
In sum, our work contributes to the second strand of literature and enhances the third strand explicitly by investigating collective behaviours. Using DeepLabv3+, one of the latest deep learning algorithms (Chen et al., 2017b), allowed us to extract 17 built environments objects (for details, see data and methods section). We were interested mainly in the presence and abundance of car-related and pedestrian-related built environment features surrounding leisure organisations. Relatedly, using computer vision algorithms, we analysed street-view images’ predominant colours and salient regions. This revealed how the colourscape of street-view images not only reflects the built environment aesthetics but also indicates levels of mixed-use land (Stamps, 2013). To elaborate, if a single colour dominates a street-view image, the street is likelier to have a single type of land use; therefore, the land use pattern is less mixed. While street-view image-derived measures have been primarily tied to individual-level urban outcomes in the third strand of studies, we explored their possible application to organisation-level urban studies. Compared to traditional built environment features derived from a survey (which is highly subjective and labour intensive) or a census (which is either aspatial or of very coarse spatial resolution), the application of street-view images with deep learning techniques offers a solid objective framework for efficient environmental auditing at fine spatial resolution. Crucially, street-view images offer a closer approximation of humans’ perceptions of the built environment because the camera’s perspective is that of a pedestrian or a car passenger. This contrasts with observing the built environment from a bird’s view, as is the case in most remote sensing. Nevertheless, while applying street-view images in urban studies has gained some momentum, most empirical work so far has been conducted in North American and East Asian cities with a focus on the individual level. The present study, therefore, enriches the current body of research by focusing on both a European urban context and collective outcomes on the organisational level.
Hypotheses
Neighbourhood-based organisations rely on strong neighbourhood social and civic networks that provide legitimacy, and the members they need to survive. The built environment is known to impact these networks; we see these networks enhanced in traditional neighbourhoods where walking is encouraged by the absence of major roads, intersections and car parks as well as the presence of pavements, green spaces and parks. Based on our literature review, we formulate the following refutable hypotheses:
Hypothesis 1: the presence of cars and trucks and car-related infrastructure in an organisation’s proximity will decrease the likelihood of organisational survival.
Hypothesis 2: the presence of pedestrians and walking-related infrastructure in an organisation’s proximity will increase the likelihood of organisational survival.
Hypothesis 3a: the presence of mixed-use land in an organisation’s proximity will increase the likelihood of organisational survival.
Hypothesis 3b (the outsider- or stranger-focused hypothesis): the presence of mixed-use land in an organisation’s proximity will decrease the likelihood of organisational survival.
Data and methods
Study area and data
Our research drew from a unique dataset combining information on the activities of leisure organisations in Amsterdam during 2002 and 2017 (Vermeulen et al., 2012, 2016a, 2016b). The starting point for our analysis was a 2002 database that contains information about all 17,540 non-profit organisations operating in Amsterdam in that year (Tillie and Slijper, 2007), including each organisation’s foundation year, name, address, mission statement and board members’ names, countries and dates of birth. This study utilised a subset of the database above, which consists of 1671 neighbourhood-based leisure organisations. We further categorise these 1671 leisure organisations into four broad types according to their main activities, namely sports, cultural performance, hobbies and other (leisure organisations) (see also Vermeulen et al., 2016a). We operationalised our dependent variable, organisational disbanding as a dummy variable indicating whether a leisure organisation identified as active in 2002 was still active in 2017, where 0 refers to the organisation still surviving in 2017 (i.e. not disbanded) and 1 denotes the organisation being inactive in 2017 (i.e. disbanded).
Addresses played an important role in our analyses. We used the address that an organisation gave to register itself in the Amsterdam Chamber of Commerce, as this is the only publicly available address. For the neighbourhood-based leisure organisations that existed in 2002, we searched for the availability of GSV images according to their addresses. We found that of the 1671 organisations, 1568 had at least one GSV image taken in the proximity. We then narrowed the sample down to this total, which is equivalent to 94% of the original sample (1568/1671 = ∼94%). Figure 1 shows the spatial distribution of these organisations.
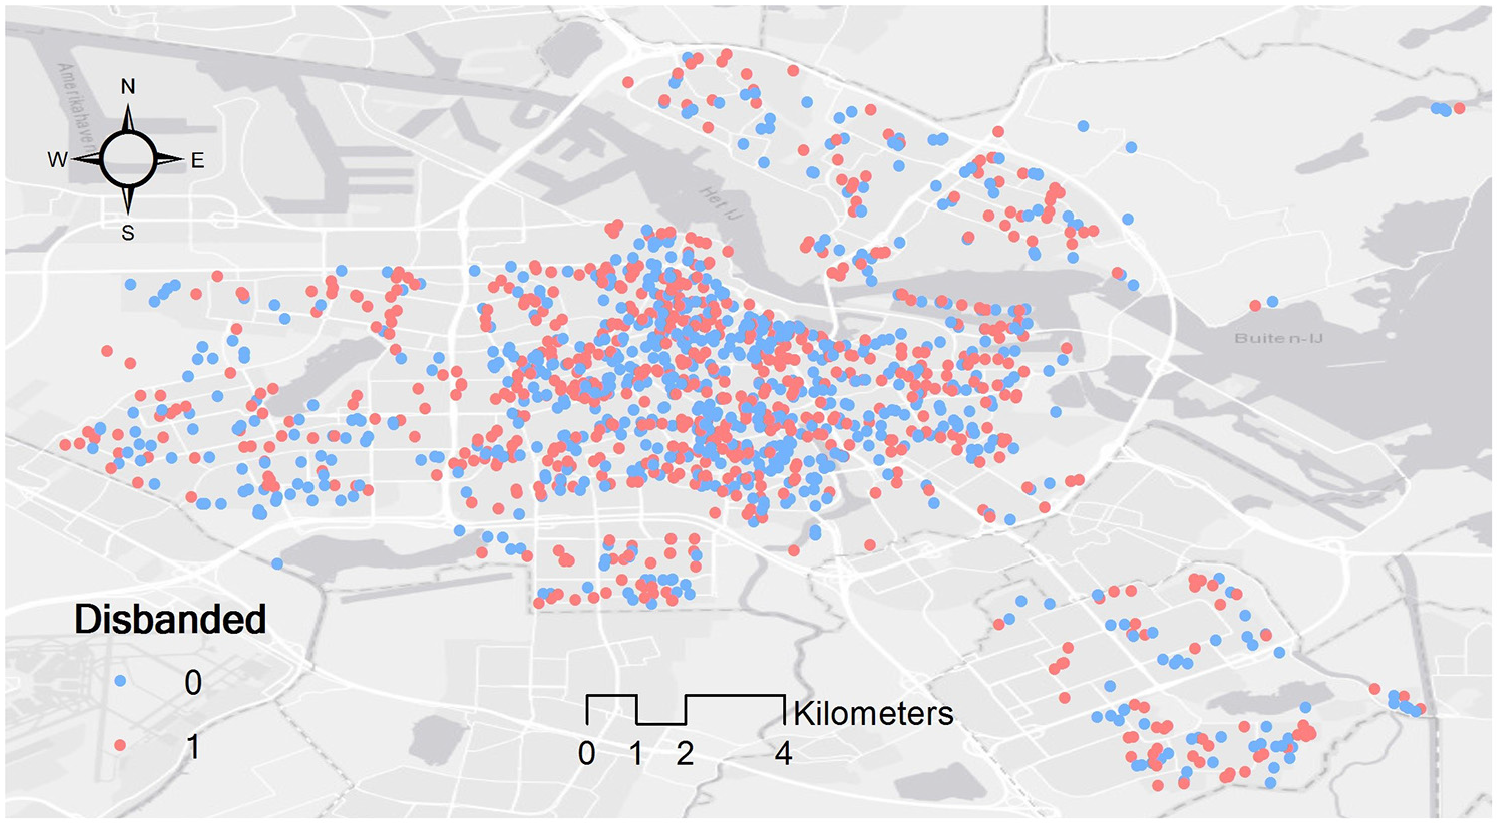
The spatial distribution of voluntary leisure organisations in Amsterdam (N = 1568). All dots represent organisations that existed in 2002. ‘0’ indicates an organisation that had not been disbanded in 2017; ‘1’ indicates an organisation that had been disbanded by 2017.
Google Street View panoramas
To construct key predictors regarding built environments surrounding the organisations, we used the GSV panoramas given as results when searching the organisations’ addresses. GSV provides a continuous series of 360-degree panoramas. Each panorama is constructed by stitching multiple overlapping images together. For each organisation in our study, we used Google’s Geocoding application programming interface (API) to convert the address to latitude and longitude. With the coordinates of each voluntary leisure organisation, we obtained the GSV panoramas through Google’s Street View Static API, which provides the latest image. For each pair of coordinates, we acquired four GSV photos with the headings of 0, 90, 180 and 270, referring to the camera’s compass degrees, where 0 indicates North and 90 denotes East. For all the photos, we used the default pitch of 0 – meaning the camera was held flatly horizontal to the GSV vehicle – a field of view of 90 and width and height both in 640 pixels, which is the maximum resolution for non-premium users. One drawback to this approach is that the year of the latest image may vary within a city, although we found that most of our panorama images were captured in either 2017 or 2018.
Methods
Extracting built environment features from GSV panoramas
The first set of explanatory variables is the abundance of car-related and pedestrian-related built environment features, which are related to H1 and H2, respectively. We applied the DeepLabv3+ algorithm (Chen et al., 2017a) to segment GSV panoramas. DeepLabv3+ was recently released as an extension of DeepLabv3 (Chen et al., 2017b) with an encoder-decoder structure. In the encoder module, the pooling layer and convolution layer are consecutively combined to generate feature maps with different resolutions, where the resolution decreases with the increasing depth of the network. Therefore, it gradually captures the semantic information and high-level features. While its detailed algorithm is documented in Chen et al. (2017a), we find it worth mentioning that DeepLabv3+ achieves excellent performance on PASCAL VOC 2012, with the mean Intersection over Union (mIoU) of 89.0. For each GSV panorama, we used DeepLabv3+ to segment the image into 17 classes, which could be categorised as car-related infrastructure (road, traffic sign, car, truck, bus); pedestrian-related infrastructure (pavement, terrain including playgrounds and urban grassland, person); other infrastructure (building, wall, fence, pole including street light); vegetation (tree, urban forest); sky; bicycles, motorcycles and riders (people who ride a bicycle/motorcycle). We then calculated the proportion of every class in each image. Figure 2 is an example of a segmented GSV panorama in our study, showing eight built environment infrastructures, where the major features include building (38.81%), road (33.22%), sky (14.27%) and car (10.77%). Finally, for each organisation, we took the average of the proportions of built environment features across the four images.
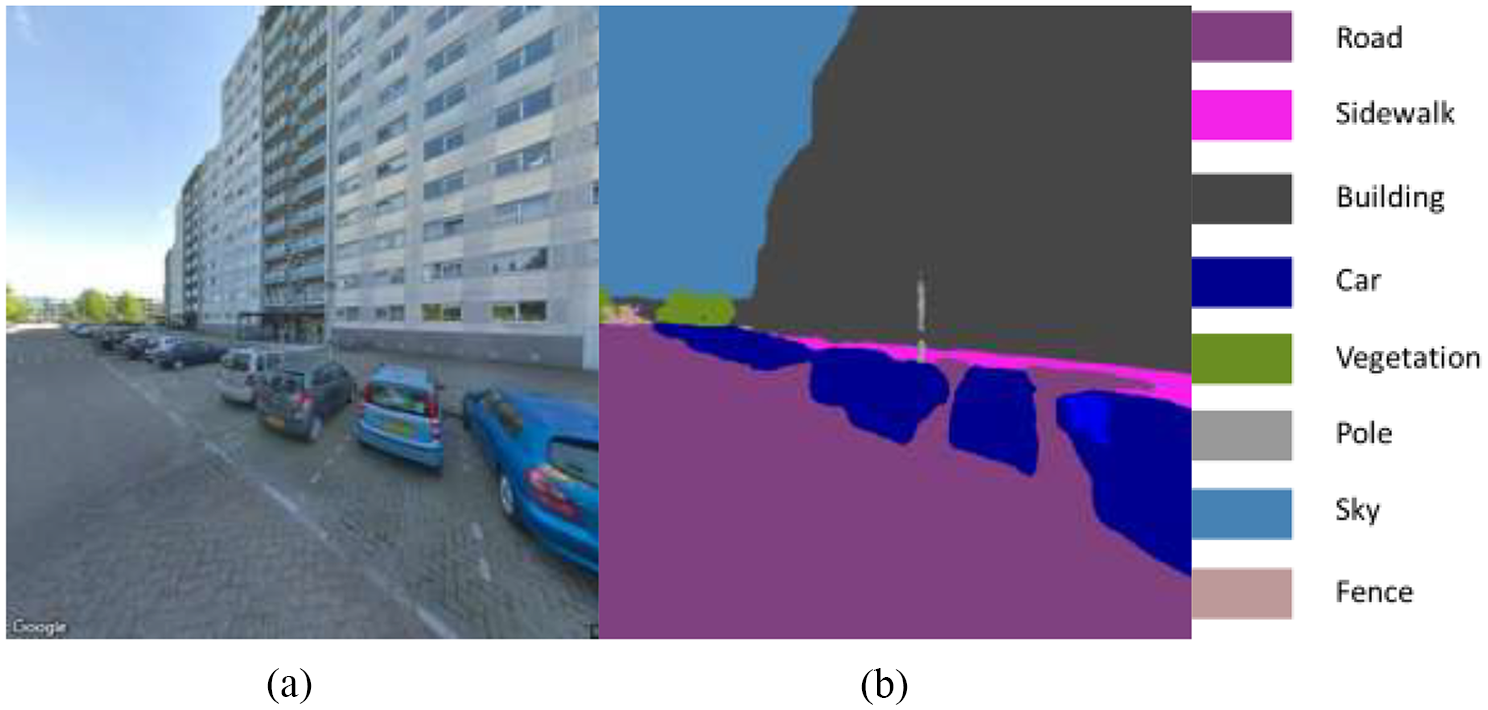
An example of GSV panorama segmentation from DeepLabv3+: (a) original GSV panorama and (b) segmented image.
The second set of explanatory variables is related to mixed-use land, which we have included as variables derived from colour analysis and salient region. First, we extracted the major colours using the colorgram package (https://github.com/obskyr/colorgram.py), where a major colour is defined as any colour with at least 1% occupancy of the whole image. Therefore, the proportion of the most dominant 1st_colour_prop) and the total number of major colours (num_major_colour) are calculated by averaging the values of all four GSV panoramas. A higher value of 1st_colour_ prop correlates with a lower degree of mixed-use land, as the built environments are likelier to be dominated by a single object. Conversely, a higher value of num_major_colour corresponds to a higher degree of mixed-use land, as the built environments are likelier to be composed of different objects. Second, we extracted the salient region of each GSV panorama. While no universal definition yet exists, an image’s salient regions can be defined as spaces with semantic contents. In street-view images, they are usually mobile and immobile foreground features, rather than background features, such as open space or sky. While no uniform saliency measure can be applied to all the images, we have adopted Otsu’s efficient and easily implemented thresholding method (Otsu, 1979) after Gaussian filtering. As such, the salient region ratio (srr) is defined as the ratio between salient regions and total areas of a given image. The srr ranges from 0 to 1, where the higher the srr is, the more foreground features are in the image. Conversely, a lower srr suggests the presence of more background features (e.g. open space and sky), which indicates a higher likelihood that the scene consists of mixed-use urban land. Figure 3 shows examples of GSV images with a high value and a low value of the proportion of the dominant colour (1st_colour_prop, Figure 3a and b, respectively) and those with a high value and a low value of the salient region ratio (srr, Figure 3c and d, respectively).
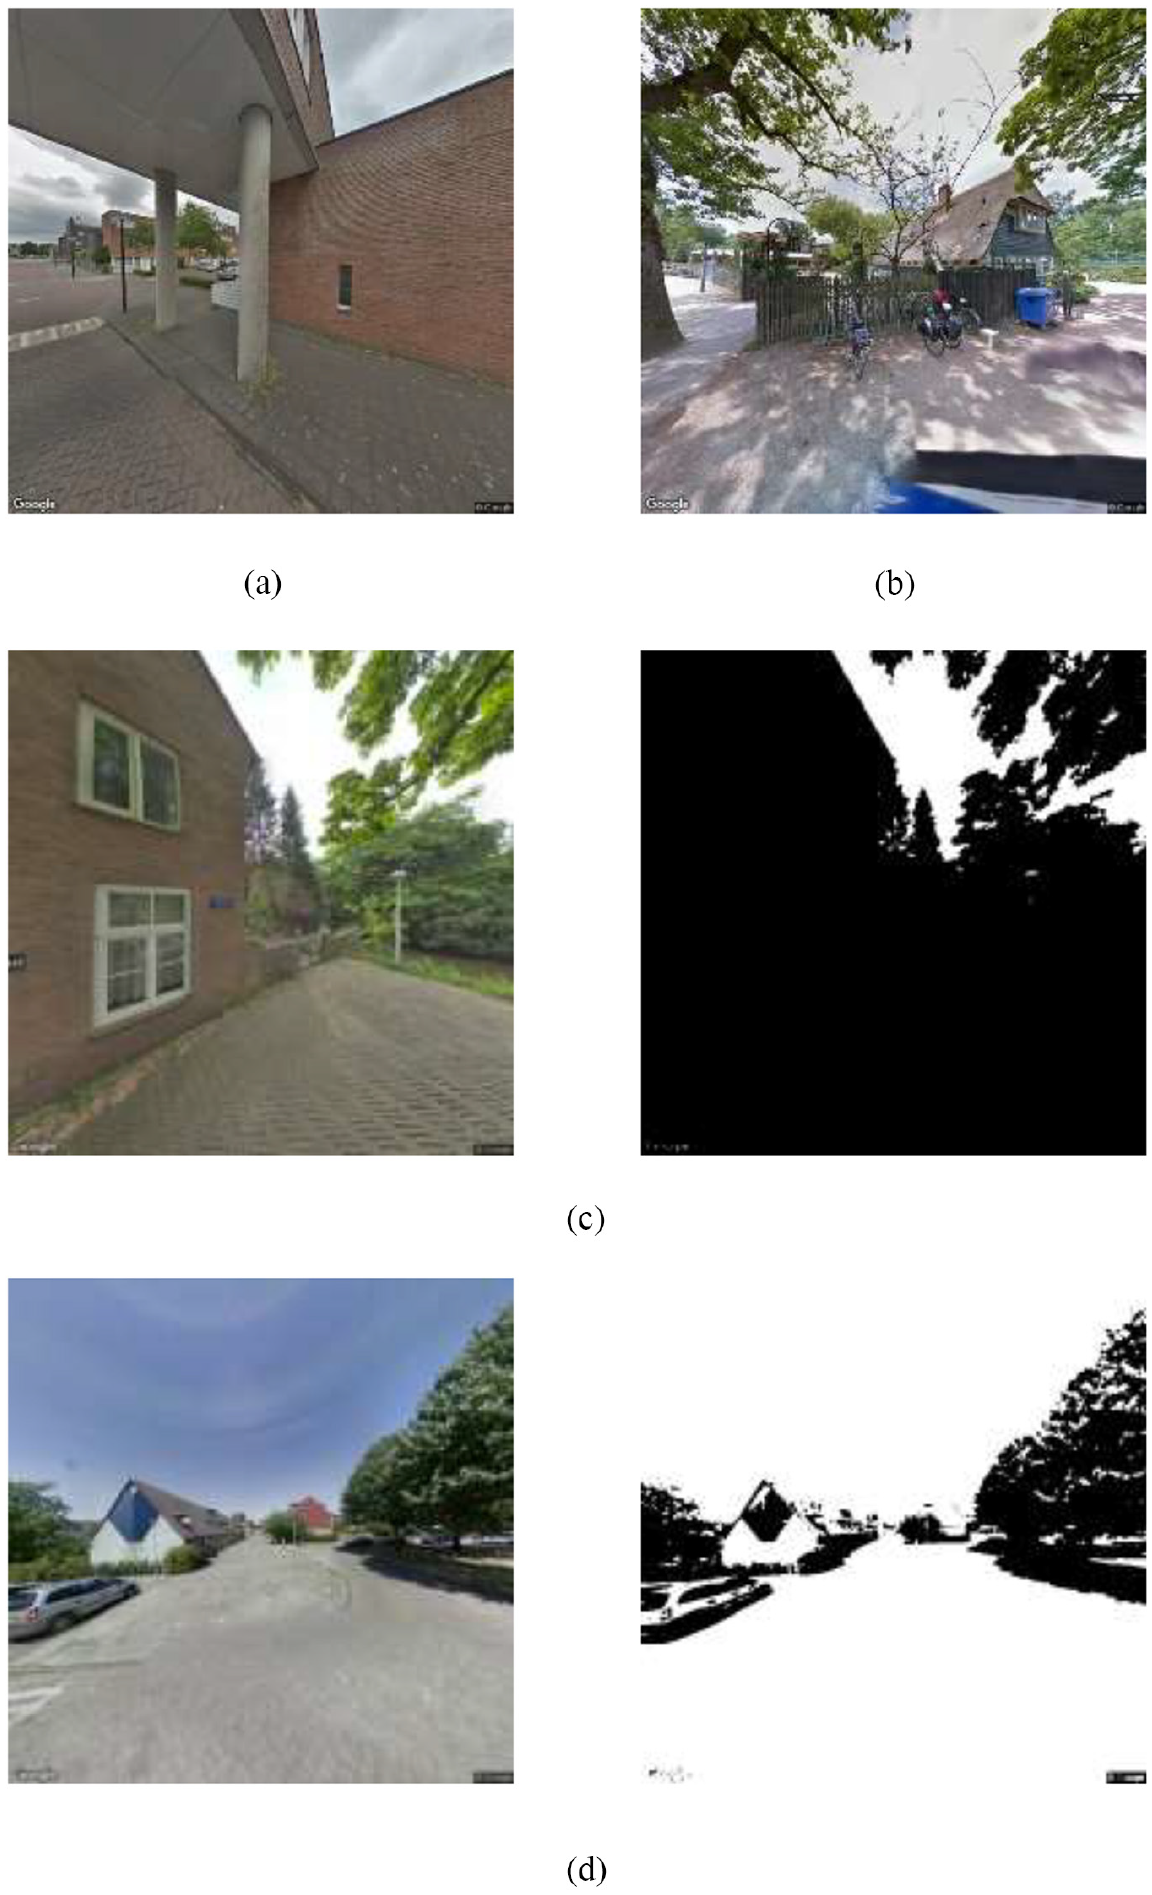
Examples of colour analysis and salient region analysis: (a) an example of high value of the proportion of the dominant colour (1st_colour_prop = 0.806), (b) an example of low value of the proportion of the dominant colour (1st_colour_prop = 0.115), (c) an example of a high value of the reliant region ratio. The left panel shows the original street-view image; the right panel shows the salient regions of the image (in black) (srr = 0.903) and (d) an example of a low value of the reliant region ratio. The left panel shows the original street-view image; the right panel shows the salient regions of the image (in black) (srr = 0.178).
Organisation-level control variables
Besides relevant covariates at the street level, we also controlled for several organisation-level characteristics that have been found to influence organisational survival (Vermeulen et al., 2016a, 2016b). These characteristics include linear and quadratic measures for organisational age; a dummy variable measuring whether the organisation was an association (as opposed to a foundation); a dummy variable measuring whether an organisation had any overlapping board membership with another organisation (interlock); whether the organisation is located in the city centre of Amsterdam; and a suite of dummy variables measuring whether a leisure organisation was a sports club, a hobby association, or a cultural performance club (as opposed to `other' type).
Penalised regression
Our dataset includes multiple predictors regarding the built environment and organisations. While OLS can perform poorly with a large multivariable dataset, a penalised regression creates a linear regression model that discourages complexity by penalising having too many variables in the model (Bruce and Bruce, 2017; James et al., 2013). Penalised regression adds a constraint to an equation to reduce the coefficient values towards zero, which allows the less contributive variables to have a coefficient close to or equal to zero. It helps solve the overfitting problem that an OLS model often suffers. Penalised regression is, therefore, also known as a shrinkage or a regularisation method. It is recommended when there is a large number of variables, or the ratio between the numbers of observations and variables is low, and when the variables are highly correlated.
There are three most commonly used penalised regression methods, namely ridge, lasso and elastic net. A penalised regression requires an explicit level of penalty, which is determined by a tuning parameter (
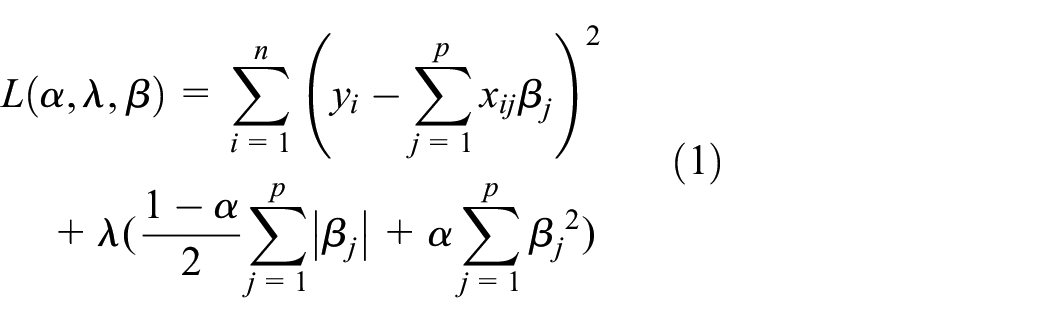
where
A ridge regression model can generally yield better prediction than the OLS model through a better compromise between bias and variance. However, a ridge regression model may end up having all the coefficients or none of them because it keeps all predictors but lacks a feature selection function. In contrast, a lasso regression performs both parameter shrinkage and variable selection (Tibshirani, 1996). Nevertheless, lasso regression has three deficits. First, it will not produce accurate results when multicollinearity is present. Second, although impertinent to our present study (we have much more observations than the number of predictors), a lasso regression is not uniquely determined when the number of variables is higher than the number of observations. Third, a lasso regression tends to select only one variable amongst a group of predictors with high pairwise correlations, which may lead to the loss of important information. However, the elastic net regression can achieve both shrinkage and automatic feature selection by combining L1 and L2 penalties (Zou and Hastie, 2005). With these considerations in mind, we applied elastic net regression as our empirical model. We also divided the data into training (70%) and test (30%) sets randomly. For the former, we trained the model using tenfold cross-validation by splitting the training set into 10 randomly sampled folds, where nine folds were used to train the model, and the tenth was used to test the accuracy.
Results and discussions
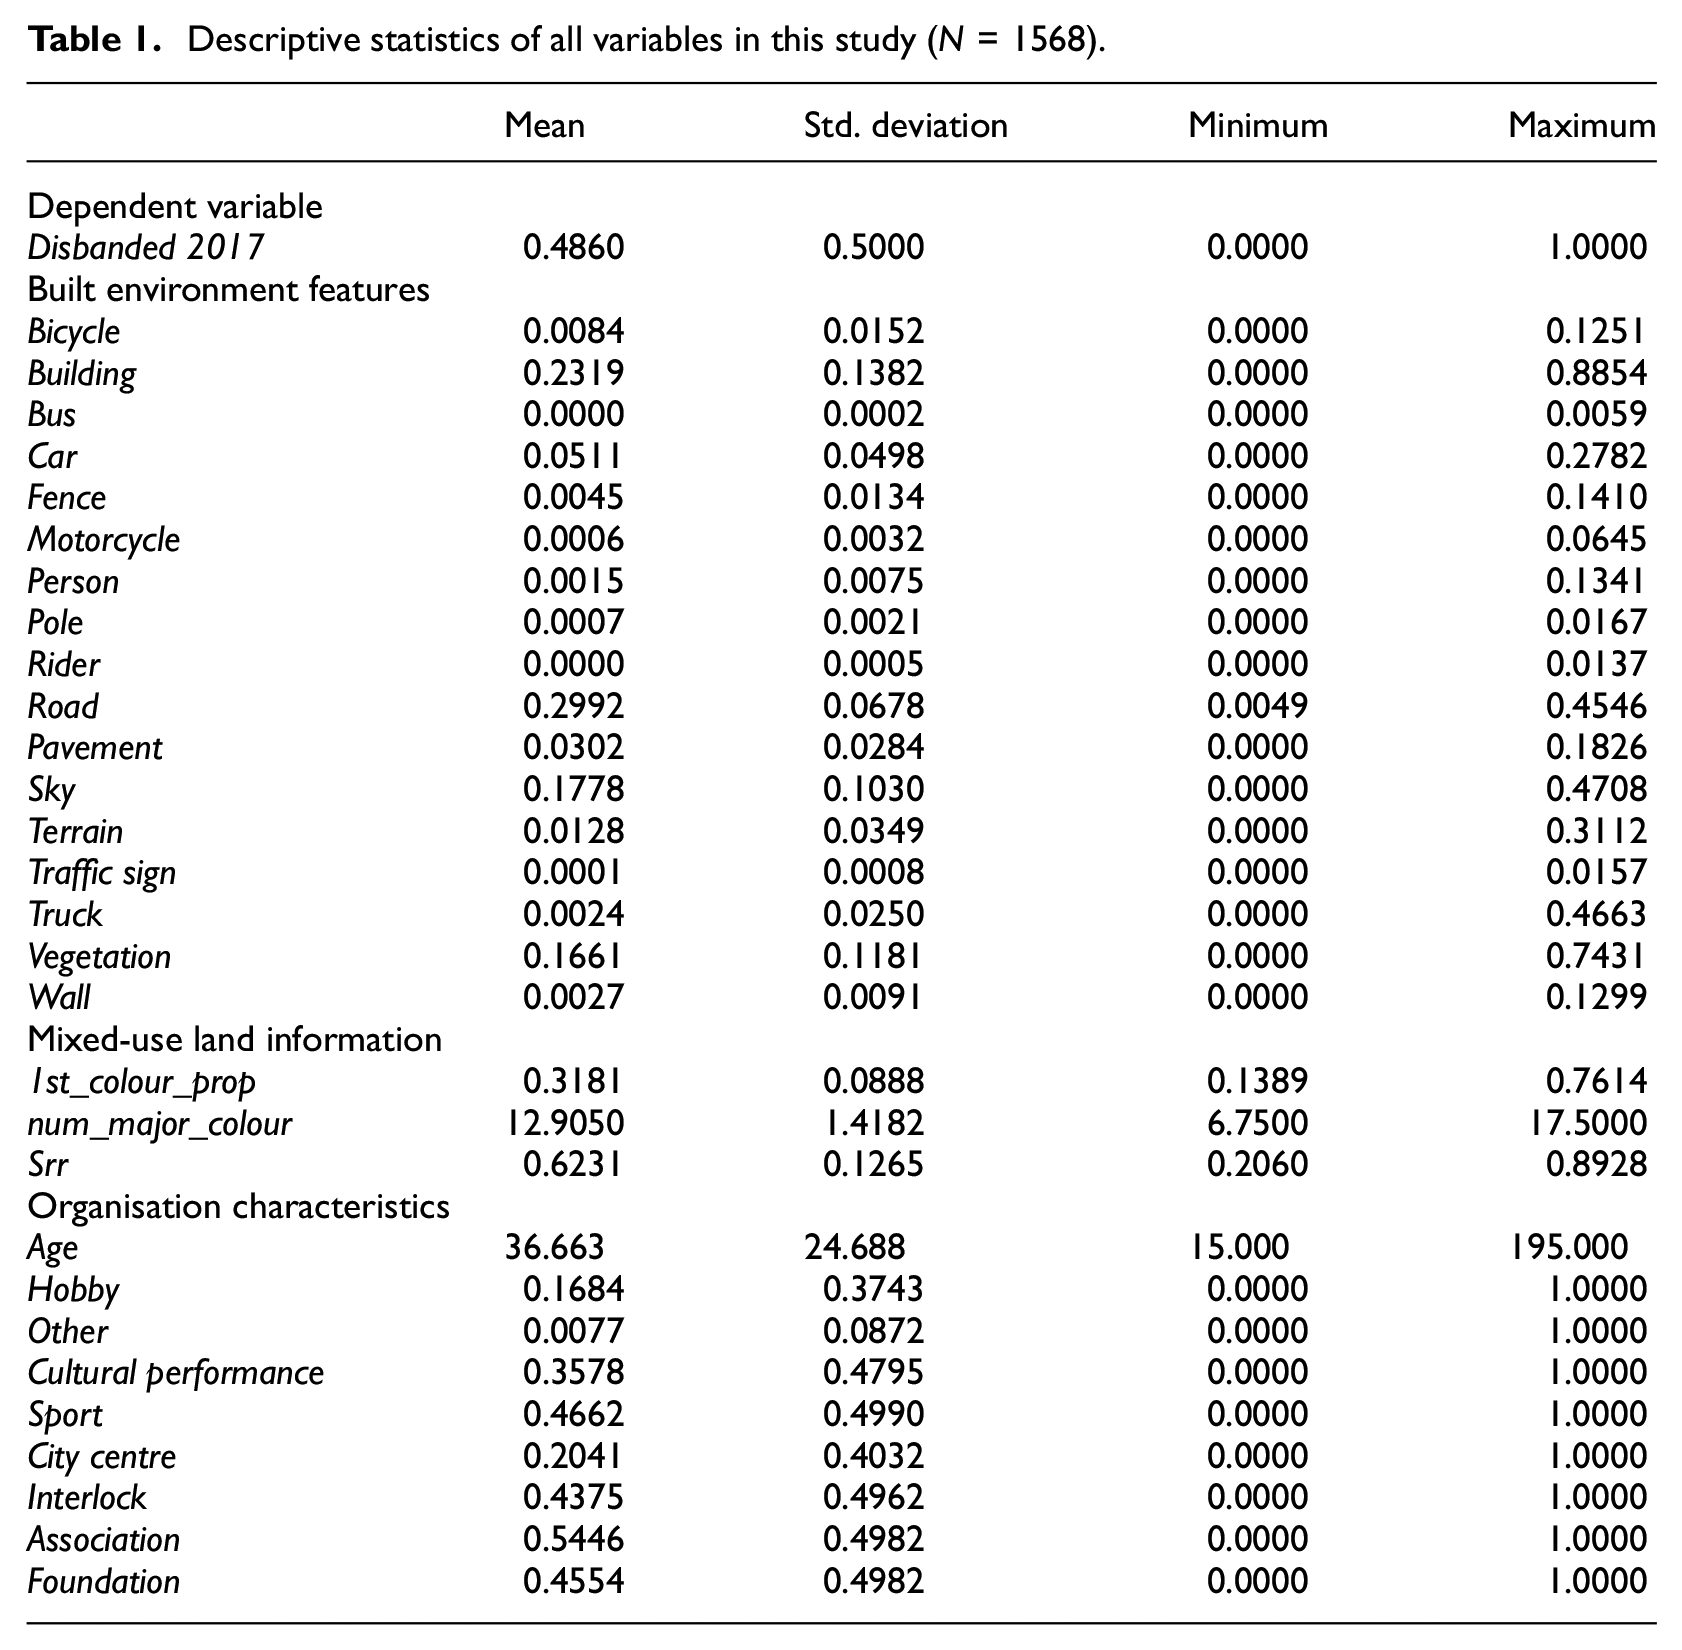
Descriptive statistics of all variables are given in Table 1. We specified 17 built environment features from DeepLabv3+, three measures associated with mixed-use land from computer vision algorithms and 10 features related to organisation-level controls. Based on the mean values, these built environment features constitute about 99% of a street-view image in the surroundings of the organisations. The most common features include road (29.9%), building (23.2%), sky (17.8%) and vegetation (16.6%). Additionally, the colour analysis reflects the level of mixed-use land, being highly heterogeneous concerning different organisations. The dominant colour in the surroundings (1st_colour_prop) ranges from 13.9% to 76.1%; the number of major colours in the surroundings (num_major_colour) varies from 6.75 to 17.5.
Descriptive statistics of all variables in this study (N = 1568).
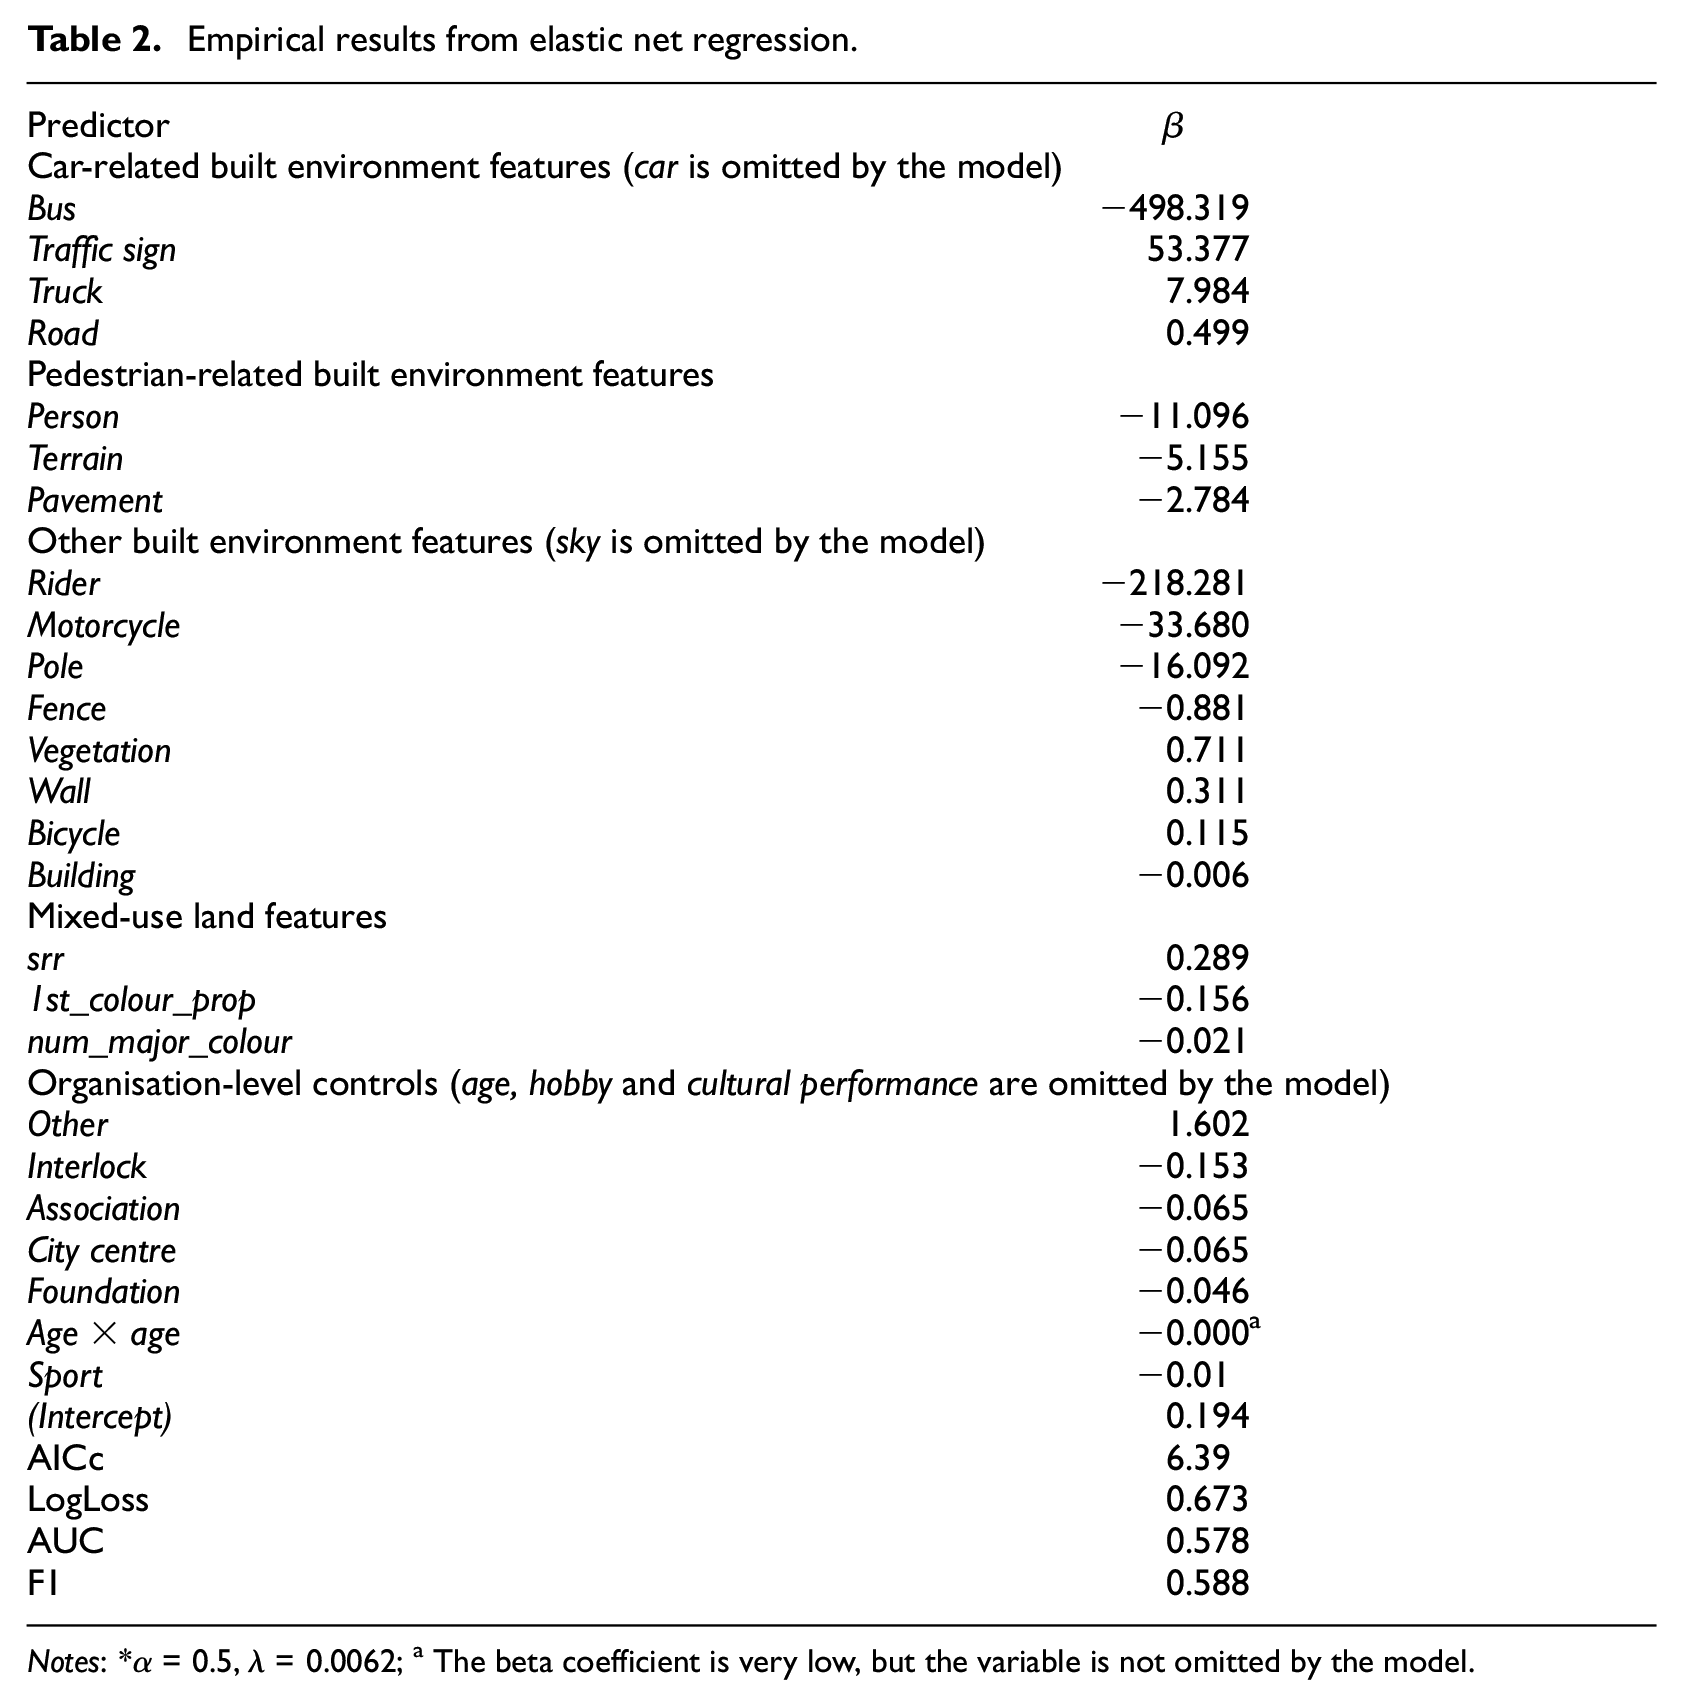
Empirical results from elastic net regression are shown in Table 2. We grouped predictors based on the three hypotheses. Also, we grouped other built environment features because they were neither car-related nor pedestrian-related. Within each group of predictors, we ordered further according to relative levels of influence (using the absolute value of beta coefficients). Figure 4 maps the spatial distribution of the abundance of typical built environment features that are car-related (road), pedestrian-related (terrain) and other (pole).
Empirical results from elastic net regression.
Notes: *
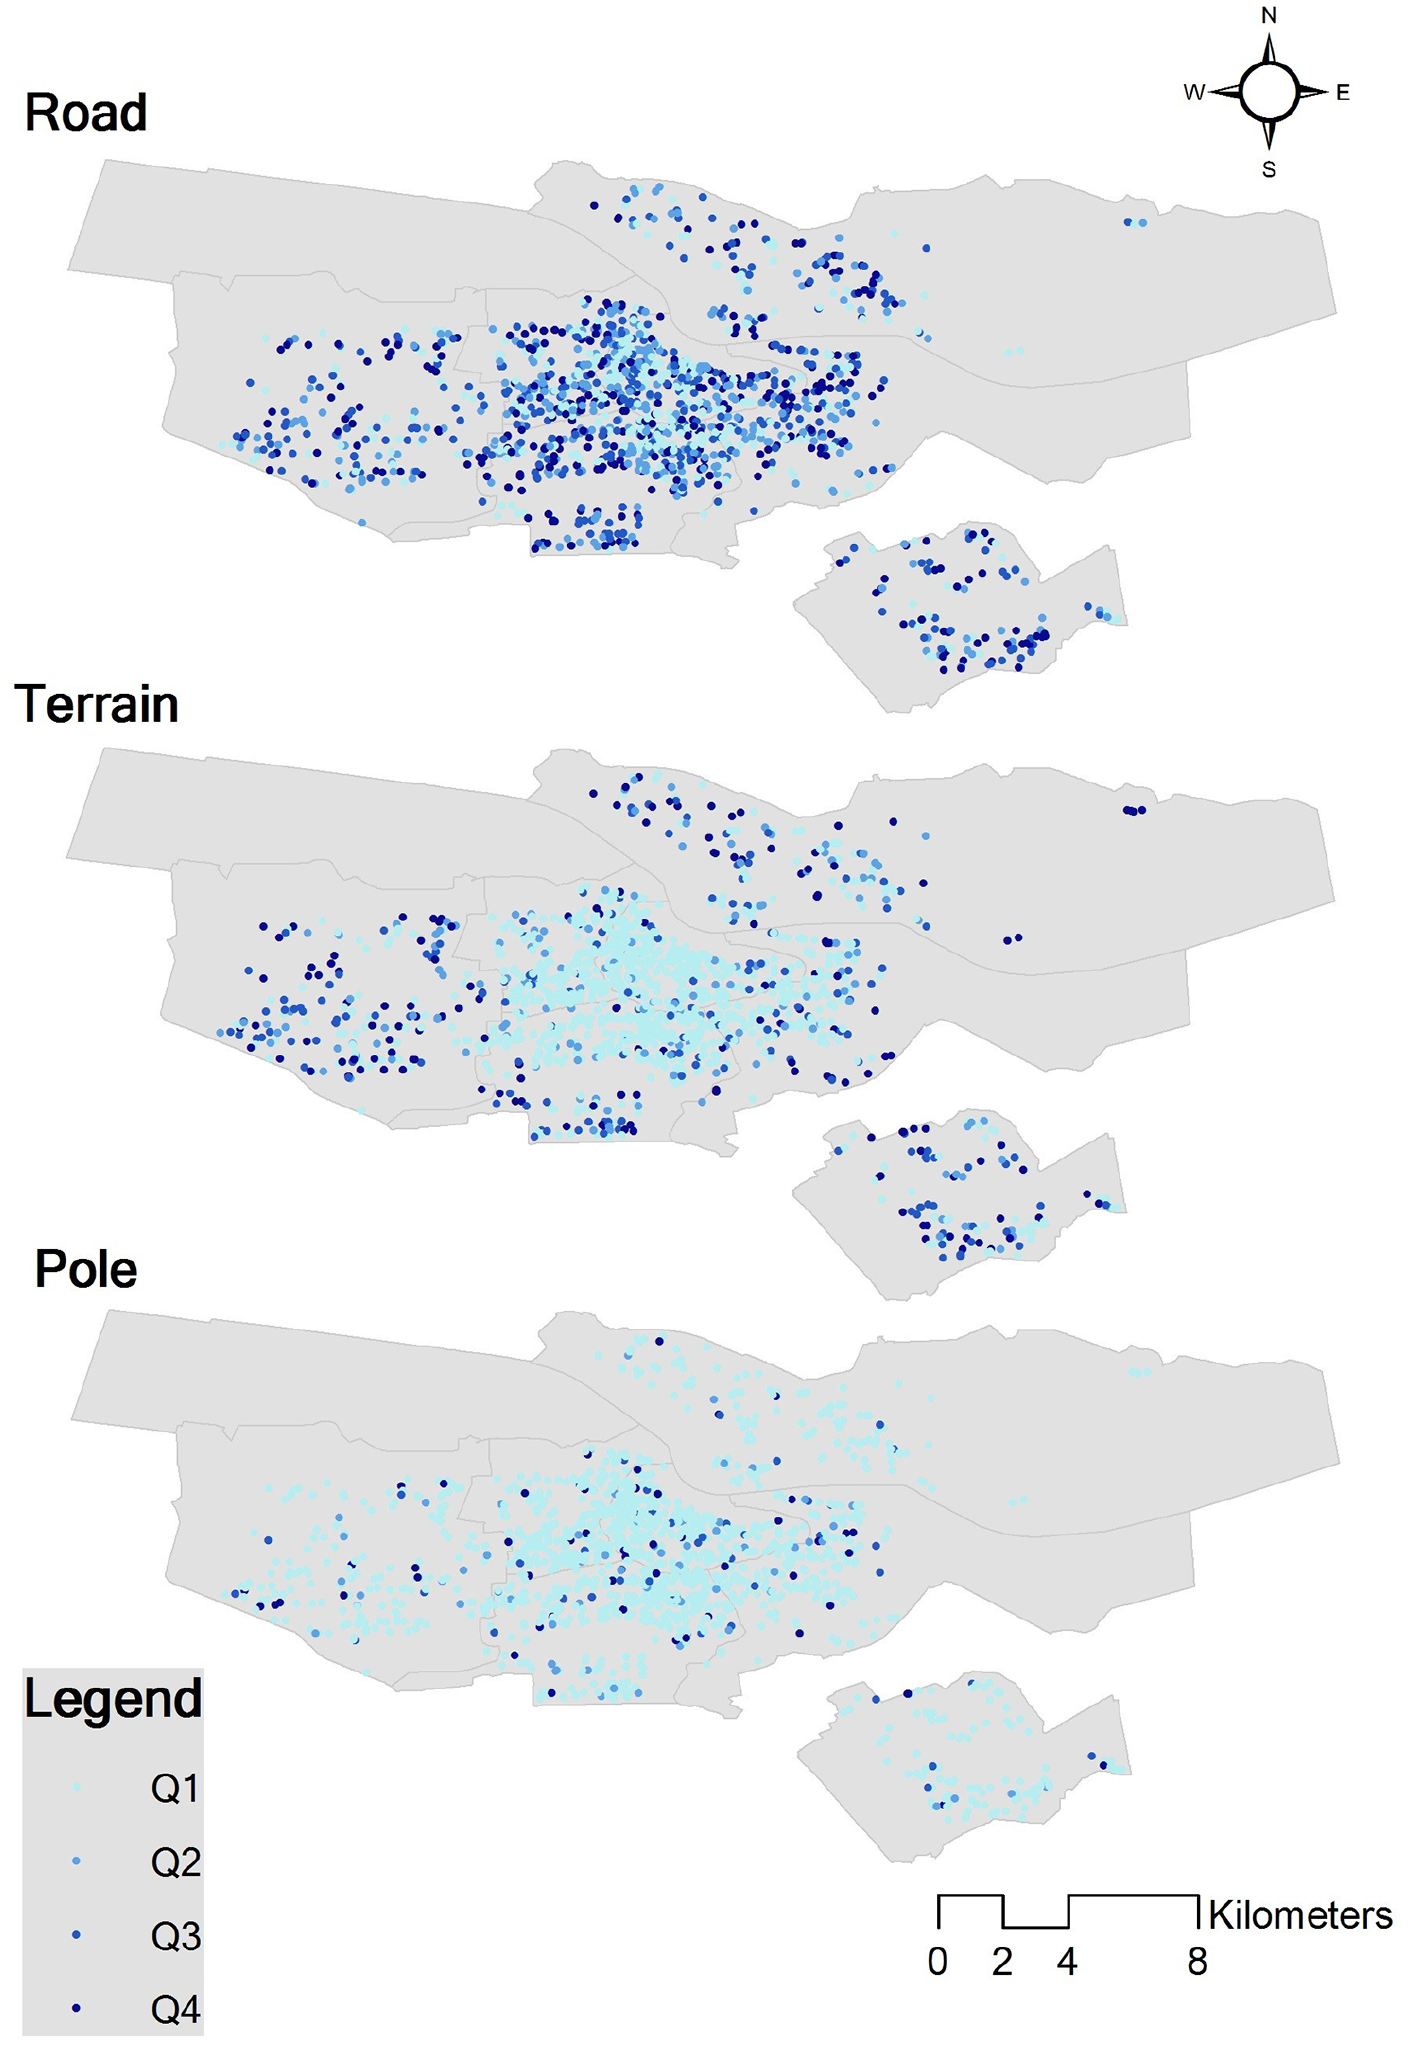
The spatial distribution of the abundance of car-related (road), walking-related (terrain) and other (pole) built environmental features. Q1, Q2, Q3 and Q4 refer to the first, second, third and fourth quantiles for the proportion of the corresponding feature. The base map of Amsterdam is from the City of Amsterdam (https://maps.amsterdam.nl/open_geodata).
First and foremost, we found that an abundance of traffic signs, trucks and roads correlates with a higher likelihood that a voluntary leisure organisation will be disbanded. We thus accept H1 because the presence of car-related built environment objects decreases the likelihood of organisational survival. Oppositely, an abundance of buses correlates with a higher likelihood of organisational survival. Notably, the bus beta coefficient has the highest absolute value of all predictors, making it the most influential predictor of organisational survival in Table 2. The presence of buses suggests that a place is accessible by public transportation. An organisation accessible in this way encourages more people to spend their time there with others (Leyden, 2003). From an urban design perspective, a place that is accessible by public transportation creates more opportunities for low-intensity social interaction (Gehl, 2011). The new urbanism paradigm also points out that the creation of neighbourhoods with easy access to public transportation can enhance social capital (Kamruzzaman et al., 2014; Mazumdar et al., 2018). On the contrary, traffic signs are usually situated at busy intersections or major arteries, which are less pedestrian-friendly. Relatedly, the presence of trucks also correlates with heavy traffic. Indeed, a neighbourhood in which people can readily see traffic signs and trucks does not facilitate street activities or urban neighbourhood life (Francis et al., 2012). That, in turn, discourages people from enjoying their free time together with others. Furthermore, an abundance of roads corresponds to a high likelihood of organisational disbandment, although its predictive power is far less than all those predictors above. Lastly, the model omitted the abundance of cars. Indeed, compared to cars, the presence of trucks and buses is a more symbolic icon of, respectively, a heavy traffic road and a pedestrian-friendly one.
Second, based on those pedestrian-related built environment features derived from DeepLabv3+, we found that an abundance of people, terrain (e.g. green spaces and grass) and pavements surrounding an organisation corresponds to a higher likelihood of survival. As such, we accept H2 because the presence of pedestrian-related objects in the proximity of organisations increases the likelihood of their survival. Indeed, an abundance of pedestrians shows how the built environment and neighbourhoods enhance social networks and urban vibrancy. Furthermore, urban green spaces and pavements have critical roles in facilitating social interactions, as they bring people who do not know each other together in an intimate social fashion (Jacobs, 1962), which is a fundamental requirement for a social organisation to thrive. Urban parks, green spaces and pavements provide opportunities for ‘life between buildings’ (Gehl, 2011), as they are typical public spaces for informal social interaction and information sharing. Additionally, the presence of pedestrians, pavements and green spaces is a classic example not only of a ‘traditional neighbourhood’ (Leyden, 2003) in which urban socio-cultural activities are concentrated (Lund, 2002; Maas et al., 2006) but also of a walkable neighbourhood with easy access to parks, as described within the new urbanism paradigm (Francis et al., 2012; Mazumdar et al., 2018). Nevertheless, the predictive power of the presence of actual pedestrians is much stronger than those of terrain or pavement (pedestrian-friendly urban infrastructures).
Third, many other built environment features that can be categorised neither as car-related nor pedestrian-related in the surrounding areas of an organisation show different predicting powers of organisational survival. For example, an abundance of riders, static motorcycles and poles correlates with a higher likelihood of organisational survival. Similar to pedestrians, the presence of riders is direct evidence of the vitality of the built environment. Poles are usually streetlights, which also create the semblance of safety in a neighbourhood. Overall, public spaces with these features are more accessible and attractive, which encourages the development of social capital amongst neighbourhood residents (Gehl, 2011). Relatedly, the abundance of fences and buildings correlates with a higher likelihood of organisational survival, although their predicting power is much lower than all the ones above. Fences are usually an indicator of urban parks, and the presence of buildings suggests a high density of dwellings. Within the new urbanism paradigm, such elements strengthen social capital in the neighbourhood (Francis et al., 2012; Mazumdar et al., 2018). Additionally, the model shows how the abundance of vegetation, walls and static bicycles in the proximity of an organisation correlates with a higher likelihood of organisational disbandment. However, this prediction power is marginal compared to that of riders, motorcycles and poles.
Fourth, the empirical results show that mixed-use land in proximity to an organisation increases the likelihood of its survival. We, therefore, accept H3a and reject H3b. Such a finding is generally in keeping with studies using subjective measurements of mixed-use land based on perceptions of neighbourhood residents (e.g. Leyden, 2003; Lund, 2002), where a positive correlation exists between neighbourhood mixed-use land and sense of community. On the one hand, a higher srr value correlates with a higher likelihood of organisational disbandment. As mentioned earlier, a salient region in a street-view image is usually composed of foreground features (see Figure 3c and d). A higher srr value reflects the lack of open space or sky surrounding an organisation. In an urban context, the lack of open space or sky indicates less mixed-use land. Open space in a neighbourhood with mixed-use land encourages more people to be on the street, fostering an environment for social capital accumulation. On the other hand, we found counterintuitive results from the colour analysis. Namely, a larger proportion of the dominating colour in proximity to an organisation correlates with the organisation being less likely to disband; more major colours in its proximity, however, correlate with less likely disbanding. As a single colour often represents one type of object, an image dominated by one type of object indicates less mixed-use land. Conversely, a scene dominated by multiple major colours often includes different types of built environment features, reflecting more mixed-use land. Such seemingly contradictory findings from the colour analysis may reflect what Minah (2008) pointed out – that the choice of colours often results from urban designers’ inconsequential colour choices; for example, urban designers may use the same colour for different types of urban objects. Furthermore, the group of features regarding mixed-use land from computer vision algorithms shows much less predicting power than the car-related or pedestrian-related features. This finding thus also contributes to the literature’s patchiness and inconclusiveness on the relationship between neighbourhood mixed-use land and sense of community (Wood et al., 2010). Paradoxically, it is precisely these patchy, inconclusive results that make the quest for different measures and methods an appealing topic in the field.
Finally, as noted by previous studies (e.g. Vermeulen et al., 2016b), organisation-level characteristics affect the likelihood of an organisation’s survival. Amongst all four categories of neighbourhood-based leisure organisations, while sports clubs are less likely to be disbanded, other category leisure organisations are likelier to be disbanded. Additionally, an organisation that is considered as an association, a foundation or an interlocked organisation, or that is located in the city centre, is also less likely to be disbanded. An interlocked organisation is more embedded in a city’s organisational population, thereby gaining resources from other organisations. Lastly, we observed a weak sign of liability of newness. As Table 2 shows, the age of an organisation non-linearly influences its survival in an inverted-U shape. A generic inverted-U curve like this suggests that either very young or very old organisations are likelier to survive. Nevertheless, the empirical result more reflects how older organisations are less likely to be disbanded; this is because we took a subset of organisations existing in 2002 (Tillie and Slijper, 2007) and investigated the likelihood of their survival 15 years later.
Limitations and future work
A limitation of this study is that we used organisational addresses registered in the Chamber of Commerce because they were the only publicly available sources for that information. These addresses were valid for the larger organisations (all the sports clubs, cultural clubs and hobby associations). However, many smaller voluntary leisure organisations lacked their facilities, thus often being registered under the personal address of a board member. Still, these smaller organisations mostly offered activities in the neighbourhood in which they were located, reflecting a proven strong link between offered leisure activities and demand for them (Vermeulen et al., 2016a, 2016b). Relatedly, we used the most recently available GSV images to predict the likelihood of organisational survival, even though all the organisation-level characteristics were based on their situations in 2002. Inevitably, this imposed uncertainty and possible errors in predictions. Also worth mentioning is that street-view images often have heterogeneous spatial and temporal availability, where data availability and granularity are lacking in developing and underdeveloped countries. Nevertheless, street-view services are a promising source for understanding the relationship between built environment features and urban social and behavioural issues.
Conclusions
In this article, we looked at the extent to which the built environment impacts the survival rate of neighbourhood-based social organisations. These organisations are known to have a strong link with the neighbourhood in which they are located and with its residents. They can play a vital role in representing, connecting, empowering and mobilising neighbourhood residents, especially in deprived areas, where few other actors can do this and the residents lack resources to do it themselves.
Consistent with past studies, we observed how elements of the built environment that encourage walking increase the survival rates of organisations; elements that discourage walking – by encouraging heavy car usage – decrease these rates. A pedestrian-friendly built environment enhances daily encounters and conversations between neighbourhood residents, which increases the formation of neighbourhood-based social networks known to underpin the vitality of neighbourhood-based organisations (Sampson, 2012; Vermeulen et al., 2016b). This, in turn, has positive effects on neighbourhood social life as well. Mixed-use land has a positive, albeit less strong, effect on the survival rates of neighbourhood-based organisations as well.
This research points to the need for urban planners and local policymakers to accommodate pedestrians in their designs. An infrastructure that encourages the use of cars and long-distance mobility jeopardises the ability for neighbourhood-based social organisations to make contact with neighbourhood residents; this is, after all, for whom they organise activities and through whom they gain legitimacy and increase their survival rates. In line with other research, our study shows how the presence of public spaces, notably green spaces, in the built environment without the domination of cars has a positive correlation with the vitality of neighbourhood social life. As Maas et al. (2006) noted, because these public spaces appear to serve as more than just a luxury for residents, their development should be allocated a more central position in spatial planning urban policy.
We applied an elastic net regression to establish the relationship between detailed built environment features and organisational survival with big data extracted from GSV. Street-view services provide a unique perspective to mimic human perception about the built environment as if pedestrians or cars were in the road taking pictures of the streets. With the aids of deep learning techniques and computer vision algorithms, we extracted built environment features automatically and objectively at a finer spatial granularity. Elastic net regressions not only overcome some drawbacks of OLS but also accomplish variable selection and ranking at the same time. Altogether, our work presents a fine-resolution, low-cost (when compared to surveys), efficient and potentially globally replicable analytical framework.
A better understanding of the associations between the urban built form and the vitality of neighbourhood-based social organisations contributes more generally to our understanding of urban well-being. This article shows that big data offers opportunities to reassess or extend that understanding in previously unachievable ways. This article points to big data’s hitherto limited use in neighbourhood vitality studies and explores its potential. Although we have put forward our arguments through a case study in Amsterdam, we are confident that examining the survival of a specific type of neighbourhood-based social organisation in connection with neighbourhood accessibility can be accomplished for anywhere that street-view image technology is available.
Footnotes
Acknowledgements
We thank Prof. Jon Bannister, Prof. Tony O’Sullivan and two anonymous reviewers for their insightful comments. We would like to thank Mr Zenglin Shi for his assistance during the research. We would like to thank the 2019 Urban Studies Network Day, hosted by the University of Amsterdam’s Centre for Urban Studies, Amsterdam Centre for Cultural Heritage and Identity (ACHI) and the Amsterdam Centre for Urban History (ACUH).
Declaration of conflicting interests
The author(s) declared no potential conflicts of interest with respect to the research, authorship and/or publication of this article.
Funding
The author(s) received no financial support for the research, authorship and/or publication of this article.