
Abstract
Study of the relation between urban density and social equity has been based mostly upon comparative analysis at the city level. It therefore fails to address variations in intra-urban experience and sheds no light on the process of urban densification. Incremental residential development is particularly poorly recorded and under-researched, yet cumulatively it makes a substantial contribution to the supply of dwellings. The article presents a detailed examination of this form of development in England between 2001 and 2011, and considers its impact on urban spatial justice. We find that the incidence of soft residential densification was very uneven. It had disproportionately large effects on neighbourhoods that were already densely developed and that were characterised by lower income households with access to relatively little residential space. It thus contributed to an increase in the level of inequality in the distribution of residential space, increasing socio-spatial injustice.
Introduction
Urban densification policies have been widely adopted in developed countries (Breheny, 1997; OECD, 2012). Such policies have in common a combination of measures that constrain the expansion of urban areas, restrain development in rural areas and maintain the separation of settlements, thereby preventing urban sprawl and focusing resources on the re/development of existing towns and cities (Burton, 2002; Lee et al., 2015; Nelson et al., 2004; Pinnegar et al., 2015). Differences in the tightness of the urban envelope, in the means used to contain the urban area and in the strictness with which extra-urban development is controlled all result in local variation in processes and outcomes (Millward, 2006; Westerink et al., 2013). However, the shared aim is to produce ‘… a relatively high-density, mixed-use city, based on an efficient public transport system and dimensions that encourage walking and cycling …’ (Burton, 2000: 1969).
Such a compact, dense urban form is the result of urban ‘intensification’, ‘consolidation’ or ‘densification’ (Burton, 2000), and is claimed to result in a more environmentally, economically and socially sustainable city (Vallance et al., 2009). This equation of density with sustainability has been the subject of vigorous debate for decades (see e.g. Boyko and Cooper, 2011; Jenks et al., 1996; Neuman, 2005). Gradually, a more nuanced understanding has developed of the complexity both of the concepts involved and of their interrelations. Denser urban environments are considered to offer contrasting benefits and disbenefits to their inhabitants. Depending on the dis/benefit that is the subject of analysis and the context within which it is being examined, ‘high planning densities can be helpful, problematic or unimportant’ (Forsyth, 2018: 350). Thus, for example, the social advantages of higher urban densities may include greater diversity, vitality, accessibility and social interaction, but these must be balanced against the disadvantages of an environment that is more crowded and cramped, overshadowed and stressful, and more competitive (Boyko and Cooper, 2011; Holman et al., 2015; Waters, 2016).
One of the most contentious claims for the compact city is that it promotes social justice. Debates about justice have been pursued for millennia (Harvey, 2003). However, the notion of urban social justice – rooted in Lefebvre’s (1996) argument that space, because it is constituted by social relations, cannot be a mere physical backdrop to a consideration of those relations – began its rise to prominence relatively recently (see Castells, 1977; Harvey, 1973). That rise was reinforced by the propositions that all social groups have the right to contribute to the re/production of the city (Purcell, 2002) and that justice rather than economy or efficiency should be the key criterion for evaluating urban policy and its outcomes (Fainstein, 2014). ‘[T]he values of equity, democracy and diversity … constitute the basic elements of justice’ (Fainstein, 2014: 13). From this perspective, the achievement of spatial justice (Soja, 2010) in a just city (Fainstein, 2010) depends upon maximising participation (diversity) in open and meaningful political-economic processes (democracy) and ensuring that the benefits and costs of urban re/development are distributed fairly between social groups (equity). Because of the variation in different social groups’ ability to pursue their competing needs and wants, just means may not produce just outcomes. In these circumstances, Fainstein (2010, 2014) argues that priority should be given to social equity.
Research that focuses specifically on the relation between urban density and social justice – as opposed to work that makes generalised claims for this relationship or that considers social sustainability – is very rare (see reviews by Ahlfeldt and Pietrostefani, 2017; Boyko and Cooper, 2011). Burton (2000) is the main substantive example. Her focus is on distributional justice: on ‘… the fairness of the intended end-result of the compact city proposition’ (Burton, 2000: 1971). To examine this, Burton (2000) identifies the potential social benefits and costs of compactness (as summarised earlier), and develops indicators of their impact on social equity (e.g. access to facilities, services, amenities and employment). She then undertakes a comparative analysis of 25 medium-sized English cities to explore the relations between their density and their performance against these indicators. Finally, a list of those features of denser areas that contribute to or detract from social equity is presented (see Burton, 2000: 1981, Table 4).
While much useful information on the potential social effects of densification is provided, determining the implications for spatial equity is problematic. The dearth of detailed empirical evidence on the matter (Bibby et al., 2020; Burton, 2000) prevented analysis of the relative distribution of the benefits and disbenefits of compactness between the different social groups within the subject cities. Consequently, while a particular dis/benefit may become more or less marked as density increases or decreases, there is no measure of the unevenness of its impact on richer and poorer socio-economic groups; that is, of the related degree of social equity. Also, because the study is cross-sectional, it cannot examine the redistribution of resources between richer and poorer groups over time. Instead, the argument is made that because denser areas produce conditions that benefit or disbenefit poorer groups – along with all other groups – then further densification will result, respectively, in an increase or decrease in social equity. But this proposition confuses overall outcomes with group outcomes and ‘… the justness of a distribution at the aggregate … level may bear little relation to its justness considered at a disaggregate … scale’ (Pirie, 1983: 469). In order to address these points, what is required is an examination of (a facet of) social equity at a high level of spatial disaggregation and over time. Only this combination will determine whether a particular policy regime aimed at achieving more compact, denser cities is increasing or decreasing urban spatial justice.
Jehling et al. (2020) engage with some of these issues in their study of densification in the Frankfurt region between 2012 and 2017. Using an automated GIS approach, they produce a spatially fine-grained analysis of change in building coverage – their selected measure of density – within existing urban areas over that period. However, the measure does not capture the physical form or the use of the buildings in question. Consequently, Jehling et al. (2020) could draw only broad conclusions about the extent to which the revealed pattern of densification has contributed to utilitarian justice, libertarian justice and social justice. They were unable to ‘… address the societal and environmental consequences of densification for different groups of actors and spaces’, which would require ‘more in-depth research’ (Jehling et al., 2020: 235).
We are engaged in such research. Our application of spatial analytical techniques to relevant data sets allows changes in physical land uses in England arising from development to be identified at the hectare cell (100 m × 100 m) level (see Bibby et al., 2020, and below). The cells may be aggregated to match other geographies, such as those based on census output areas (OAs), administrative areas and so on. This enabled analysis to be pursued at a detailed level for the period 2001–2011. It also enabled us to distinguish between new-build and dwelling conversion and subdivision, and between incremental or ‘soft’ densification and ‘hard’ or larger-scale densification (Pinnegar et al., 2015; Touati-Morel, 2015, 2016). The former is pursued by actors of limited resource operating only locally, such as individual owner-occupiers and property owners, local contractors and others in related businesses or professions. It is largely outside the purview of planning strategies. The latter is undertaken by ‘external’ actors such as large property developers and volume house builders who work with planners within formal planning frameworks.
A rich picture emerged of the effects of the UK’s long-established strategy of urban containment (Hall, 1974), reinforced more recently by policies to encourage the re-use of brownfield land (Bibby et al., 2020). This approach was largely successful – at least in relation to the spatial pattern of development – between 2001 and 2011. Over that decade, the number of dwellings in England grew from 21.0 million to 22.8 million, an increase of 1.8 million or 8.8%. The number of those additional dwellings that were accommodated in England’s existing urban areas – that is, settlements with a population of 10,000 or more – was 1.1 million, or 60% of the national total. Urban residential development occurred predominantly in suburbs, with activity split two thirds to one third between hard and soft densification. Thus, the latter proved to be an important source of additional dwellings. These trends resulted in increases in densities of 0.33 dwellings per hectare across urban areas overall (0.32 dwellings per hectare in suburbs and 0.46 dwellings per hectare elsewhere in urban areas).
Within that general picture, there were wide regional variations. Soft densification accounted for almost half (48.5%) of additional dwellings in the North-West, but for little more than a fifth (21.7%) in the Eastern region. The micro-scale processes underlying these variations in the intensity of soft densification also differed greatly. In London, subdivision and conversion of existing buildings accounted for more than twice as many additional dwellings as did infill construction. In the North-West, these two forms of incremental development were roughly in balance. In all other regions, infill construction was the dominant form of soft densification: markedly so in the South-East and the South-West. Using the example of the London region, Bibby et al. (2020) also illustrated the substantial intra-urban variation in soft densification. Some of the conurbation’s inner suburbs were obvious foci of soft densification: densification primarily achieved through the subdivision of dwellings. Other, more central, areas were little affected. In contrast, small-scale action at the local level led to decreases in density in many outer suburbs.
Bibby et al.’s approach offers the opportunity to examine the implications of (soft) densification in detail and over time. A major concern relates to crowding – the reduction in the amount of living space available to residents –‘perhaps the single most direct effect of compactness on social equity’ (Burton, 2000: 1983). The supply constraints that are a consequence of compaction policies result in higher house and housing land prices (Anthony, 2003; Dawkins et al., 2002; Hilber and Vermeulen, 2016). This prompts shifts in relative housing space consumption by different socio-economic groups that were examined by Tunstall (2015). She found that, after a long period of improvement, housing space inequality in England began to increase again in the 1980s ‘… and, by 2011, by some measures, this new trend had wiped out a century’s worth of reductions in inequality’ (Tunstall, 2015: 119). Johnston et al. (2016) added a spatial dimension to this type of analysis. Using data from the 2001 and 2011 censuses for the OAs of London, they found strong ‘circumstantial evidence that BME members in London on average lived at (increasingly) greater housing densities than their white counterparts’ (Johnston et al., 2016: 370). However, the lack of empirical information about small area physical change prevented them from pursuing the issue.
This is the starting point for the article. We build on our recent work (Bibby et al., 2020) to analyse the pattern of physical change in urban residential areas in England between 2001 and 2011 and to consider the implications for the equity dimension of spatial justice (as defined by Fainstein (2010, 2014) above). We do this in a way that captures inter- and intra-urban variations in experience. The focus is on soft densification. The research is reported in five sections. First, we outline the definitions, data sources and analytical methods underpinning the work. Next, we describe how soft densification has played out across individual urban areas and the wide differences in its form and effects. In the third section, we examine the distribution of soft residential densification across different social groups, the impact that this has on the consumption of residential space and the consequences for spatial justice. Then we present detailed examples of the intra-urban patterns of densification and de-densification that result from these processes. Finally, we discuss the implications of our findings.
Definitions, data sources and methodology
The empirical work of this article depends initially on identifying the detailed components of change that directly increase or decrease the dwelling stock and that underlie phenomena such as densification that are evident at larger scales. Here we describe how specific data sources are used to generate proxies for these components and the approach taken to aggregation (to produce outcome indicators for areal mosaics at different scales and complementary measures of social characteristics) before setting out the approach to analysing the changing shares of residential space that result.
The most obvious events that alter the housing stock involve either building new dwellings (B) or demolishing existing ones (D). Subdivision of residential properties into flats (S) provides further dwellings, but amalgamation that produces larger, higher-value single-family accommodation (R) reduces the stock. Further dwellings are gained through conversion of non-residential buildings (C), but conversion of dwellings to other uses (L) results in losses. For the period 2001–2011, two data sources allow proxies for these events to be constructed at a very fine scale. 1 The Land Use Change Statistics (LUCS) provide an estimate of the number of dwellings constructed on each developed parcel of land (together with their size and centroid). Royal Mail’s Postcode Address File (PAF) indicates the number of dwellings and non-residential units at each postal address at a particular time. In principle, these elementary data may be aggregated to any scale.
This article is concerned only with events within suburbs styled ‘single-family residential neighbourhoods’ (SFRNs). SFRNs are defined by reference to OAs whose housing stock comprised whole houses or flats converted from such houses at the time of the 2001 Census. Those OAs and parts of OAs falling outside physical urban areas’ boundaries in 2001 are excluded from the definition of SFRNs. Here we aggregate the elementary data within SFRNs to individual OAs and to individual physical urban areas. The net change in dwellings for any area (Gk) over the period is obtained by subtracting the total number of dwellings identified in PAF for April 2001 (Hk,2001) from the corresponding number for April 2011. Total new build is derived directly from LUCS. For any area k, the growth in the dwelling stock, Gk, is equivalent to

and the rate of growth of the dwelling stock is given by gk = Gk/Hk,2001. As the analysis is restricted only to development within physical urban areas on their 2001 limits, Gk is also the growth of the stock due to densification, and the rate of growth of the dwelling stock (gk) is also the rate of densification (RD).
Further outcome indicators may be estimated for any area to capture the relative importance of the components above and the extent of soft densification. The events which underlie soft densification represent ‘minor developments’ within English planning administration (HMG, 2015). Such events account for more than 90% of planning applications but lie largely outside the purview of planning strategies. Events that involve building out residential sites of more than 0.4 hectares or that require the creation of a new unit postcode are excluded from our operational definition of minor development. By restricting attention solely to minor development, the growth of the stock due to soft densification (GSD) may be defined and hence the rate of soft densification (RSD) (i.e. GSDk/Hk,2001). RSD is a principal indicator in the analyses that follow. Because it combines many minor effects, RSD may be negative, as discussed below. It is also useful to distinguish soft densification due to infill construction (RSDI, which must be positive) from soft densification due to subdivision (RSDS). The ‘crowding effect’ of soft densification is measured simply by its contribution to change in ambient density 2 between 2001 and 2011 (i.e. GSD/Ak,2001 where Ak is the area of unit k in hectares).
Having defined indicators of soft densification at the OA level over the period from 2001 to 2011, the next step is to ascertain how they vary between areas of different social character. The OA classification generated for the Office for National Statistics (ONS) by Vickers et al. (2005) is used for this purpose. It groups OAs into clusters based on similarity of scores on 41 indicators from the 2001 Census. It is entirely empirical, using k-means clustering to identify clusters in a multi-dimensional space defined by the indicators. The classification is structured as a three-level hierarchy involving seven named supergroups, 21 named groups and 52 subgroups, each of which is attributed key characteristics (see Table 2).
The final step in the analysis is to examine the effect of soft densification over the period on changes in the inequality of shares of ‘residential space’ available to residents of SFRNs in each of these 52 subgroups of OAs. Residential space is a proxy for living space and is defined as the area of the footprint of domestic buildings together with domestic gardens. It is based on Generalised Land Use Database (GLUD) statistics for England estimated at the OA level by Ordnance Survey in 2005 for the then Department of Communities and Local Government. Consequently, no account can be taken of any differences that may have existed in the aggregate areas of residential space in SFRNs between 2001 and 2005 or between 2005 and 2011.
Inequality in shares of residential space is measured by T, the Theil index (Theil, 1967), which is typically used in exploring income inequality. It is constructed by first estimating the ratio of the share of England’s residential space accorded to each subgroup of OAs to that subgroup’s share of households. This ratio stands as a Location Quotient (LQ; Miller et al., 1991) for each OA subgroup, indicating the extent to which the amount of residential space enjoyed by households in that subgroup is above or below average. The Theil index is then calculated by multiplying the logarithm of this ratio (LQ) for each OA subgroup t by its share of England’s residential space, s t , and summing the values over every OA subgroup, (i.e. T = Σ s t .l t ). The value of T may vary from 0 (where shares of residential space and of households are everywhere proportionate) to 1 (where they are maximally unequal). The measure ct = st.lt captures the contribution of OA subgroup t to inequality in the distribution of residential space.
Inter-urban variation in soft densification
Inter-urban variation in the extent and form of soft densification is considerable. The experience of individual towns and cities is illustrated in Table 1. It covers those settlements in England with more than 40,000 dwellings in SFRNs in 2001, 3 the largest of which is London, followed by Manchester and Birmingham (see column [1]). An indication of the relative strength of demand for housing in relation to supply is given by average house prices between 2001 and 2011 (column [2]) that are, unsurprisingly, positively correlated (r = 0.542) with the rate of net growth in settlements’ total housing stock (g and RD; column [3]). The rate of soft densification (RSD) is given in column [4]. It averaged 1.58% between 2001 and 2011. The larger part of the growth was attributable to infill construction (RSDI; column [5]), but unusually high values of RSD tended to reflect high values of conversion and subdivision (RSDS; column [6]).
Soft densification in English urban areas, 2001–2011; key measures.
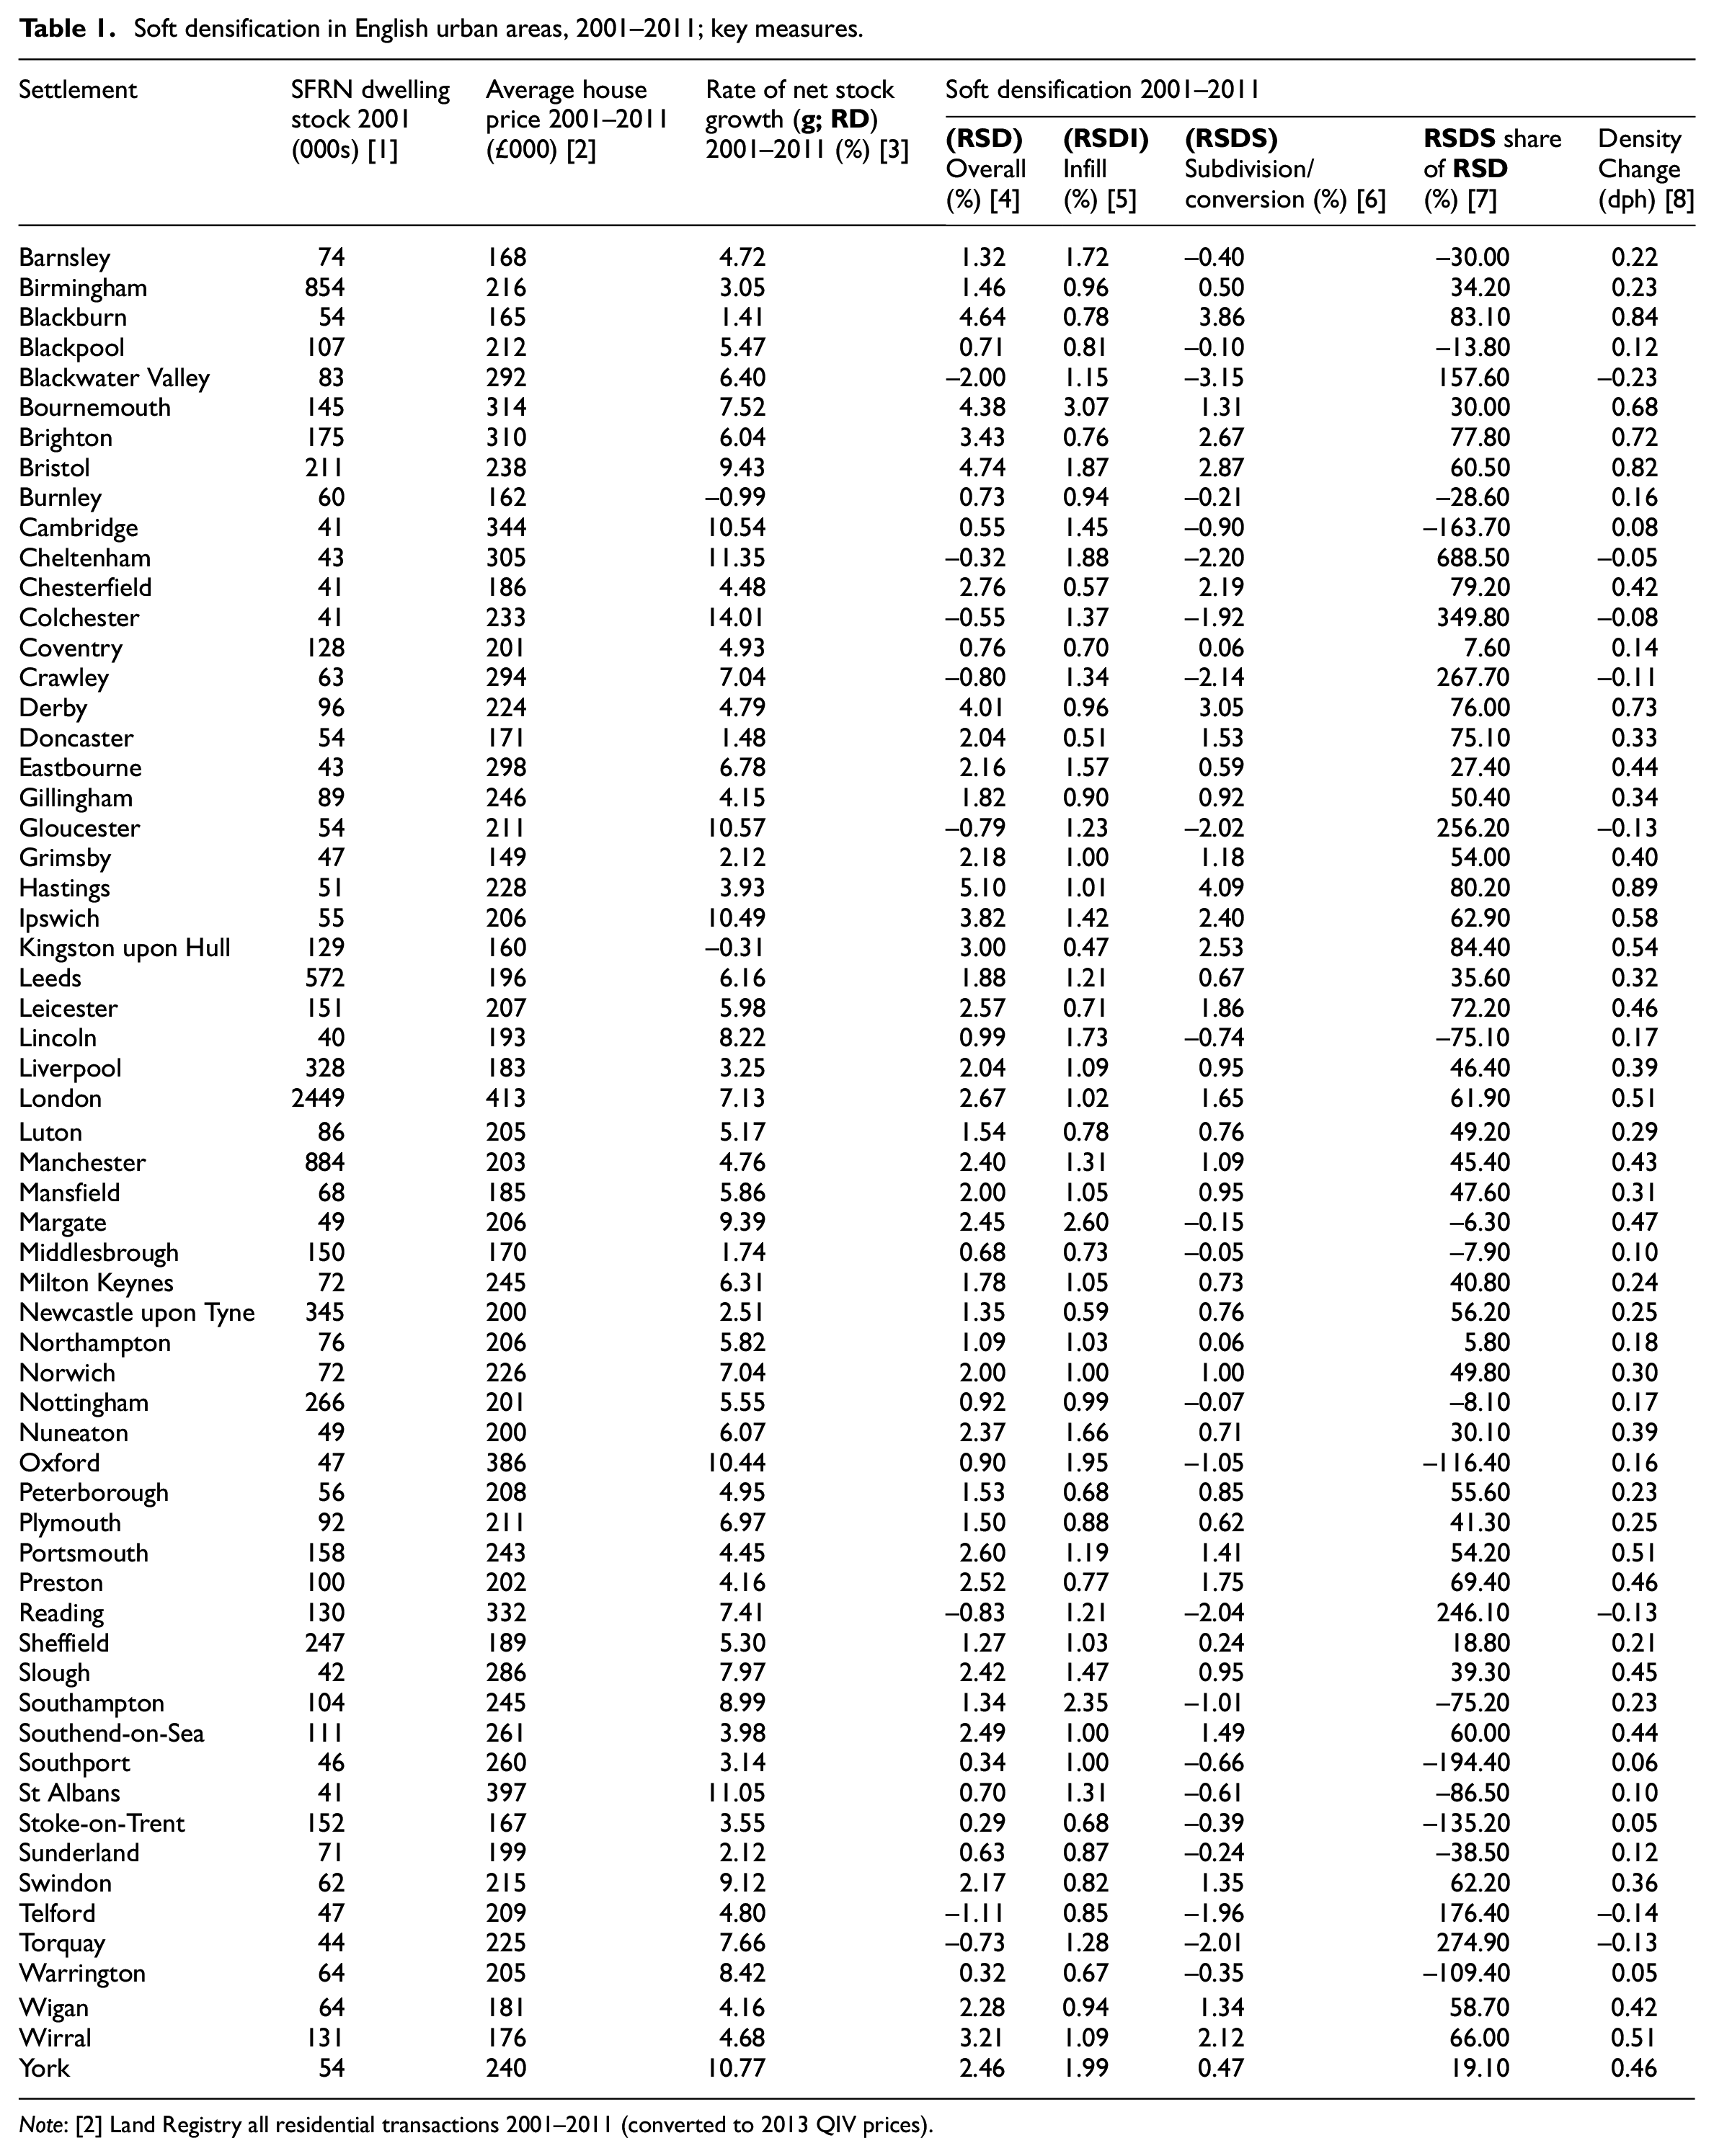
Note: [2] Land Registry all residential transactions 2001–2011 (converted to 2013 QIV prices).
Settlements that experienced high rates of infill construction (RSDI; column [5]) were predominantly buoyant towns with house prices at least as high as the national average, including Southampton, York, Oxford, Cheltenham, Bristol and Lincoln. Amongst these towns, only Bournemouth and Bristol had an unusually high RSD overall. In other such towns, the activities of householders and small developers designed to create larger single-family dwellings from the existing stock through amalgamation (R, indicated by negative RSDS, column [6]) offset gains through infill (RSDI, column [5]), and in towns such as Cheltenham negated them entirely. Other areas of high demand, such as the Blackwater Valley towns (Farnham, Aldershot), showed negative RSD because they were subjected to ‘tear-down’ or ‘knockdown’ that involved 20th-century houses on large plots being demolished and rebuilt at similar or lower densities (Thorpe, 2014).
In contrast, high RSD in less buoyant towns such as Hastings, Blackburn and Derby (column [4]) was largely the result of the subdivision of houses (RSDS; column [6]). In Hastings and Blackburn, the proportions are extreme. In both towns, the number of dwellings that were created through subdivision of existing property exceeded the overall net increase in the dwelling stock. The resulting dwellings took the form of ‘poor quality private rented sector accommodation’ (Hastings Borough Council, 2017: 3), many of which were ‘houses in multiple occupation’ (Blackburn with Darwen Borough Council, 2012). These two cases highlight how provision of cheap, low quality accommodation has produced a particular form of soft densification. In Blackburn, in particular, RSDS was much faster than growth in the housing stock as a whole, as the broader housing market stagnated. Variants of this situation marked a number of other northern settlements, such as (Kingston upon) Hull.
Variation at the neighbourhood scale: The socio-spatial impact of soft densification
In this section, we consider how neighbourhoods of different types have been affected by soft densification using the three-level OA classification discussed above. Table 2 describes, for each of the 52 clusters of OAs, their SFRN dwelling stock in 2001 (column [1]), ambient density (column [2]), growth of the stock due to soft densification (GSD; column [3]), rate of soft densification (RSD; column [4]) and the proportion of GSD resulting from subdivision (column [5]). The OA clusters are presented in descending order of their contribution to accommodating dwellings by soft densification (share of total GSD; column [6]), with the cumulative contribution given in column [7].
Measures of soft densification 2011 for output areas, 2001 area classification, England, single-family residential neighbourhoods; urban areas with 10,000 or more population.
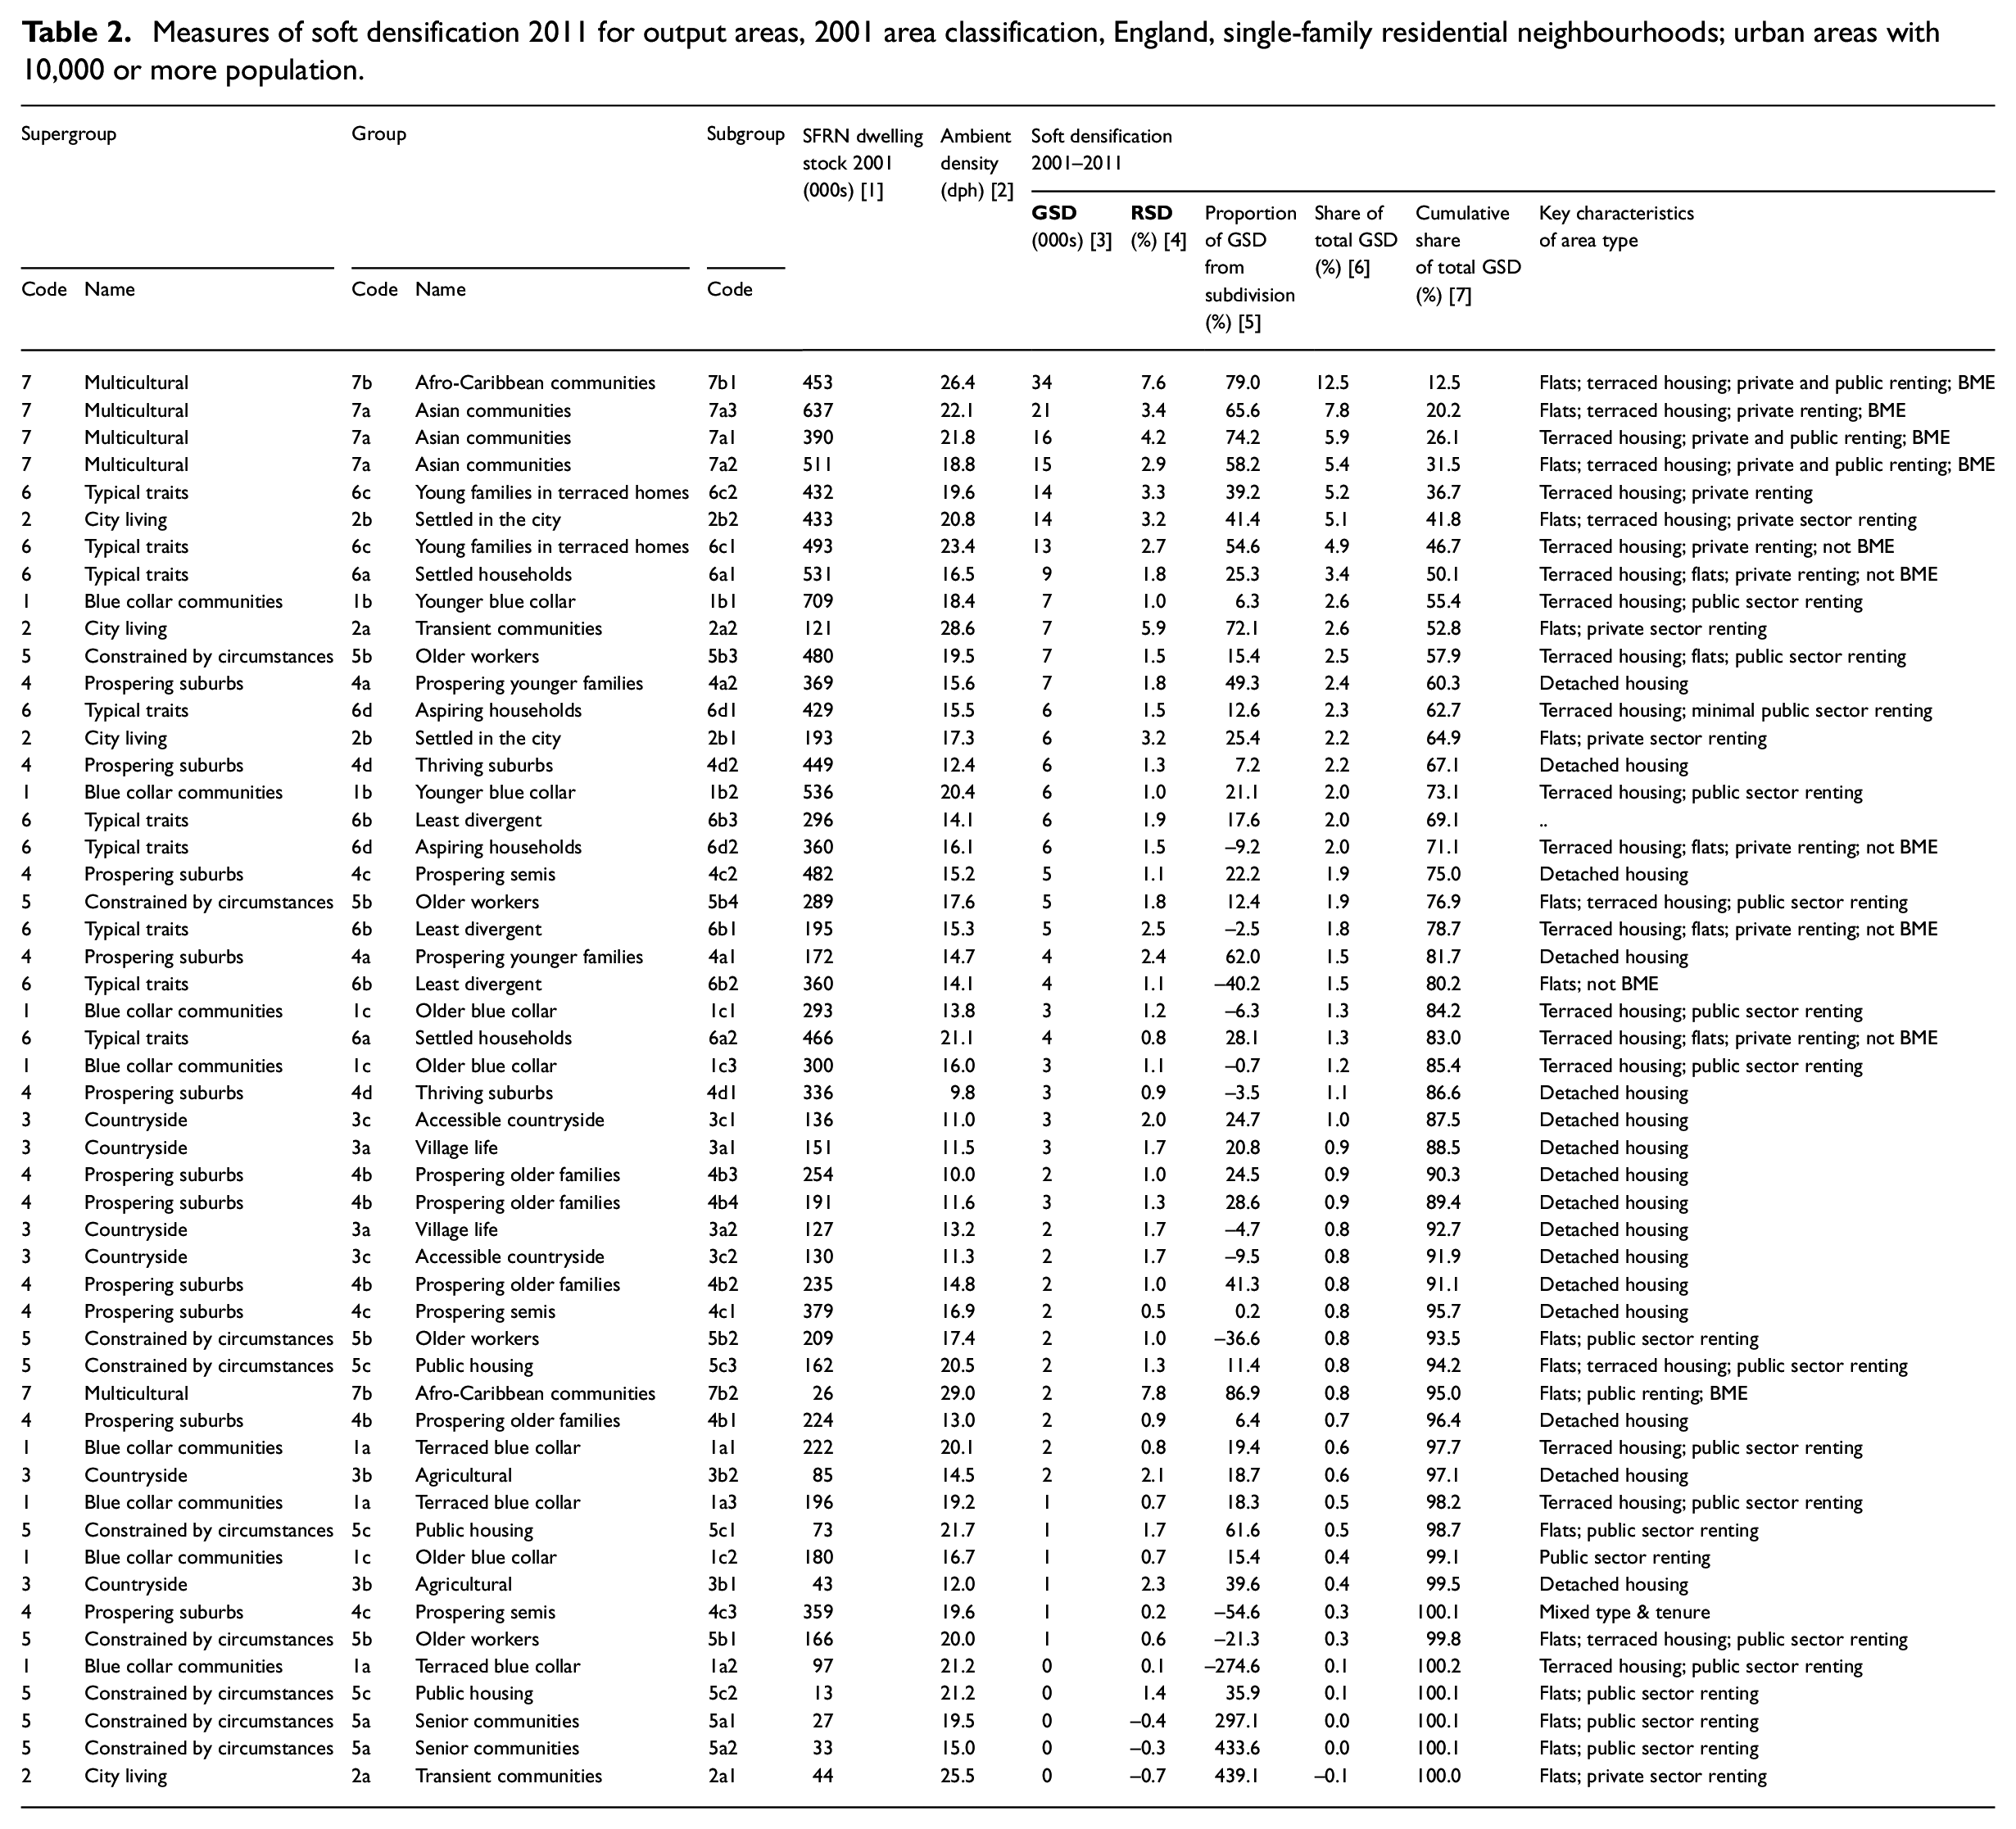
Viewed through the frame of this classification, two striking findings emerge about soft densification. The first is its extremely uneven incidence at the neighbourhood scale. Just eight of the 52 subgroups accommodated half of the additional dwellings attributable to soft densification over the decade (column [7]). The second is that at the neighbourhood level the shifting balance between the processes leading variously to increases or reductions of density (described in Table 1) is largely obscured. Only three subgroups of neighbourhoods show negative RSD and these are not high-status clusters.
Four of the eight subgroups that together accommodated roughly half of all the units attributable to soft densification belong to Supergroup 7 (‘Multicultural’), with populations disproportionately drawn from Black and Minority Ethnic (BME) groups. OAs within Subgroup 7b1 alone accommodated one eighth of all such dwellings (column [6]). These neighbourhoods were found mainly within London, and were marked by a very high overall ambient density in 2001 (26.4 dph; column [2]). Gains due to soft densification amounted to 34,000 units over the decade (column [3]), equivalent to 7.6% of their stock in 2001 (column [4]), and were predominantly the result of the subdivision of houses (the source of 79.0% of GSD; column [5]).
The second cluster (7a3) has strong similarities with 7b1. Combining high ambient densities in 2001 (22.1 dph) and high rates of soft densification (3.4%) arising mainly from subdivision (65.6%), these neighbourhoods were found almost entirely within London. A third group of neighbourhoods (7a1), again marked by initially high ambient densities (21.8 dph) and high RSD (4.18%), was particularly strongly focused on Birmingham and northern cities. These characteristics are reproduced through subdivision of terraced housing (74.2%), creating further private lets. It was this process which within a sub-regional context of low demand and shrinking dwelling stock created the circumstances of Blackburn (discussed above). The fourth subgroup of OAs (7a2) was concentrated around Birmingham and London. It is again marked by coincidence of terraced housing and converted flats that were the subject of further densification through subdivision (58.2%). Taken together, these four subgroups accounted for 31.5% of dwellings added to England’s SFRNs by soft densification over the decade. 4
Consideration of soft densification of OAs within a further set of four subgroups (6c2, 2b2, 6c1 and 6a1) covers half (50.1%) of all dwellings generated through such processes in urban SFRNs. One of these clusters (2b2) belongs to the ‘City living’ supergroup, marked at the time of the 2001 Census by private renting, converted flats and a social mix in which single-person households (other than pensioners) and individuals born outside the UK feature relatively highly. OAs in this subgroup are found within cities, particularly London. The other members of this set (6c2, 6c1 and 6a1) belong to the ‘Typical traits’ supergroup that is ‘characterised by its averageness’ (Vickers et al., 2005: 57). SFRNs within these subgroups, in reflecting national averages at the micro-scale, rarely impinge on areas developed as large-scale social housing estates and, in the case of 6c2, 6c1 and 6a1, show an over-representation of terraced housing. Moreover, these ‘mixed terraced’ areas are characteristic of northern urban areas whose physical structure intermingles residential, non-residential and undeveloped land, in which small new developments are fairly easily accommodated. Consequently, soft densification of neighbourhoods of this type was less dependent on subdivision of existing houses than the forms typical of Supergroup 7 (see column [5]).
In contrast to the above neighbourhoods, areas characterised by high proportions of detached housing were little affected by soft densification. Within the OA classification, these correspond to Supergroup 4, ‘Prospering Suburbs’, and Supergroup 3 that, although styled ‘Countryside’, includes suburban neighbourhoods developed at low density across England away from major cities. These OAs are characteristic of the suburbs of a number of major towns, especially in the South-West region, including Cheltenham, Swindon, Bournemouth and Exeter.
While there is a clear tendency for additional dwellings attributable to soft densification to be disproportionately concentrated within OAs in categories near the head of Table 2, it is more difficult to grasp the differing contributions to and effects of soft densification in the other neighbourhood types. There is little clear relationship between the specific characteristics of subgroups within the detached housing supergroups (3 and 4) and the pattern of soft densification that occurred within them. The tendency towards negative RSD in particular areas of high demand is not reflected in distinctions between different subgroups of neighbourhoods on the OA classification. Although, in aggregate, the sets of neighbourhoods characterised by detached houses did not show negative values of RSD, in many high-status neighbourhoods any additional dwellings arising from soft densification were entirely offset by losses.
The effect of soft densification on neighbourhood shares of residential space
The effect of soft densification between 2001 and 2011 on the inequality of the distribution of residential space between subgroups of OAs remains to be examined. Table 3 allows the basic indicators of soft densification (i.e. total net additional dwellings and RSD) to be located relative to overall change in households in areas with different social characteristics.
The impact of soft densification on the inequality in the distribution of residential space, 2001–2011.
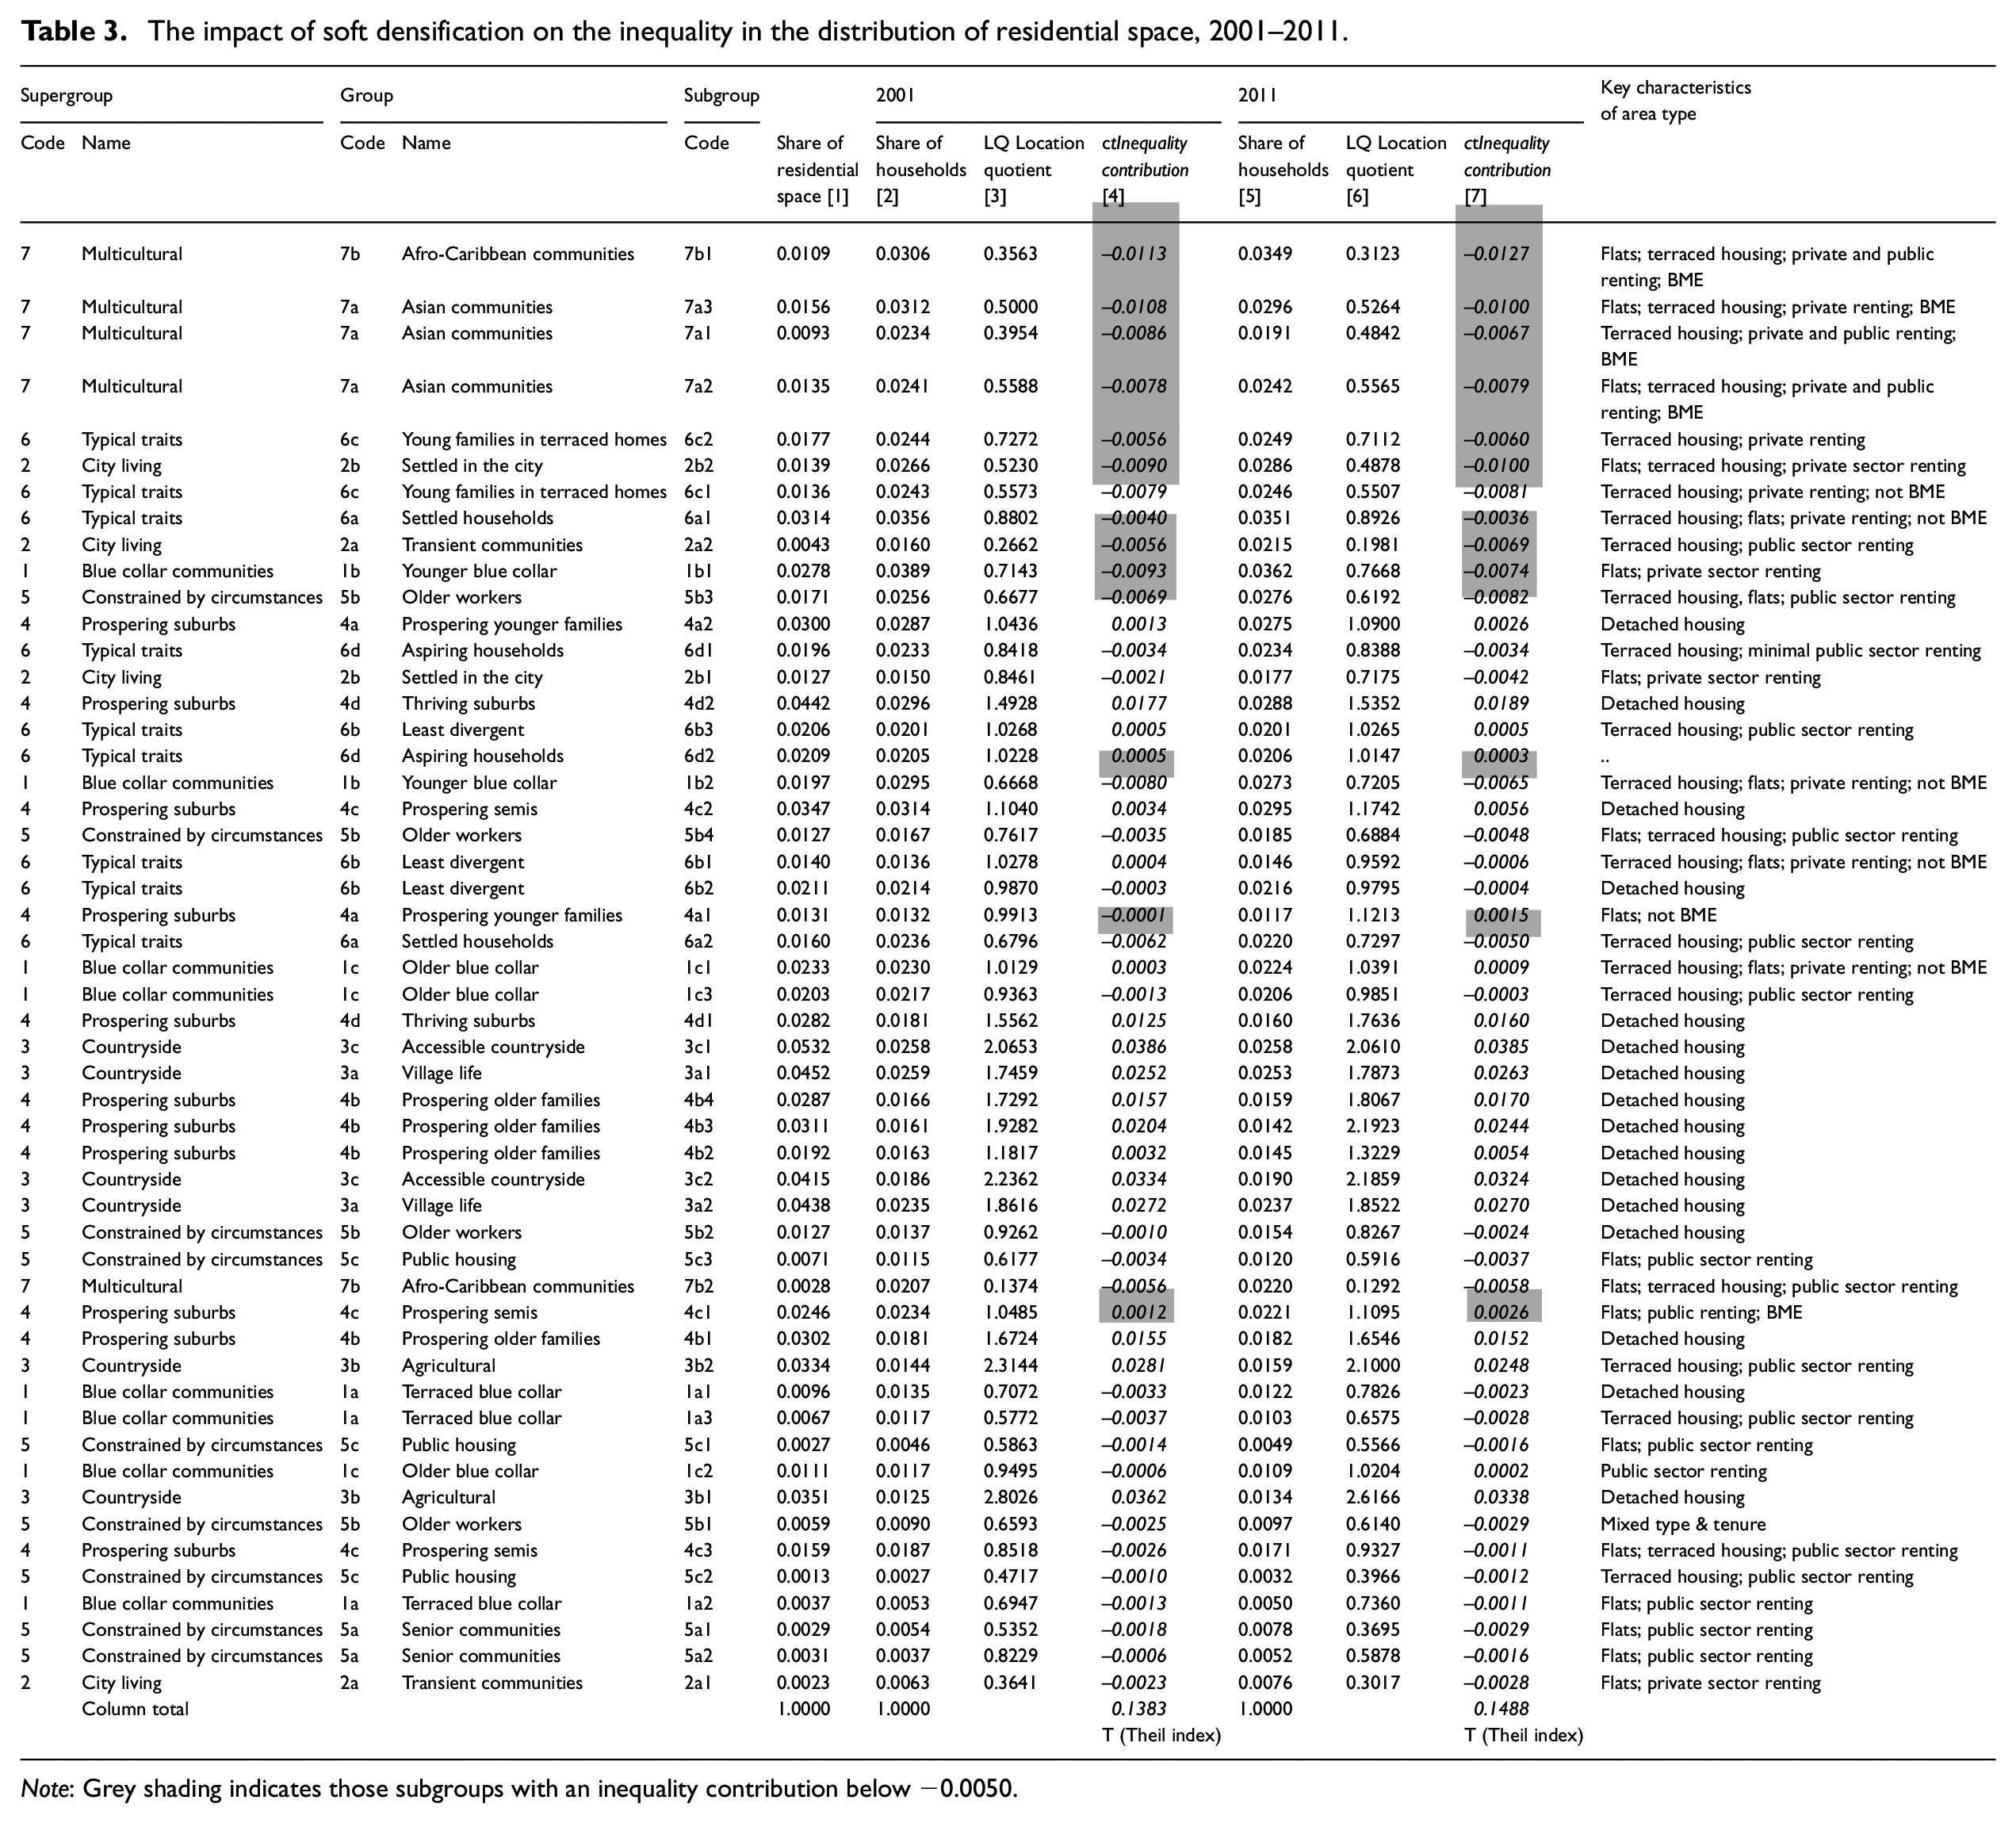
Note: Grey shading indicates those subgroups with an inequality contribution below −0.0050.
Each OA subgroup’s share of England’s residential space is shown in Table 3 (column [1]) alongside its share of households (column [2] for 2001 and column [5] for 2011). The ratio of share of residential space to share of households or LQ is shown in column [3] for 2001 and column [6] for 2011. An OA subgroup whose share of residential space is the same as its share of households would have an LQ of 1: the average. Values much greater than 1 indicate lavish shares of space, while values significantly less than 1 indicate cramming. The measure ct captures the contribution of a particular OA subgroup to inequality in the distribution of residential space (Table 3, column [4] for 2001 and column [7] for 2011).
On this basis, the Theil index (T), the measure of inequality of shares of residential space, is 0.138 for 2001. Because of the manner in which it is constructed, ct, the contribution that any subgroup makes to overall inequality (or the impact of inequality upon it) may easily be assessed. Positive values for ct in 2001 (column [4]) show that a group secured a disproportionately large share of residential space, while negative values indicate that a group’s share is disproportionately low. Because the table is ordered by decreasing significance of soft densification (i.e. in the same order as Table 2), it is immediately clear that the incidence of soft densification over the inter-censal decade was greatest in those areas that already had the least favourable shares of residential space in 2001 (subgroups whose inequality contribution is below −0.0050 are shown with grey shading). It is also clear from the values of ct in 2011 (column [7]) that the pattern of soft densification over the decade has intensified this aspect of disadvantage; those living in OAs in group 7b1 fare worst. Overall, inequality of shares of residential space increased and the Theil index (T) for 2011 was 0.149.
More generally, it is clear that the burden of securing a more compact city was disproportionately borne by the ‘Multicultural’ communities in Supergroup 7. In contrast, the two supergroups characterised by detached housing (3 and 4), and that have the highest endowment of residential space relative to their shares of households, have accommodated far fewer units through soft densification. Consequently, they made little contribution to the retention of a compact urban form, and their relative space advantage was for the most part sustained (although some subgroups, e.g. 4b1 and 4c3, faltered in this respect).
Between these two extremes are neighbourhood subgroups whose share of England’s households in 2001 was broadly similar to their share of the country’s residential space. These subgroups – amongst whom social housing tenants (subgroups within Supergroup 5 ‘Constrained by circumstances’) figured prominently – were little affected by soft densification. Soft densification was minimal in OAs in subgroups 5a1 and 5a2, where the unusually large share of elderly households might imply less concern to densify even where units on estates have been sold to occupiers.
Intra-urban patterns of soft densification and de-densification
Finally, we consider how the process of soft densification has played out in individual urban areas. Every settlement, whether the overall trend was for density to increase or to decrease, contained areas both of densification and of de-densification. Each settlement’s unique extant urban form reflects both the historical development of its housing stock and the different opportunities afforded more recently to its constituent social groups within prevailing political-economic circumstances. Figure 1 illustrates this. It describes the patterns of soft densification across the SFRNs of three cities at the hectare cell level (1 km moving average). Coventry and Leicester in the English Midlands both show marked soft densification in certain inner suburbs, the peak in Coventry being in 19th-century terraces to the east of the centre focused on Middle Stoke, and in Leicester around Highfields immediately to the south-east of the centre where student demand has added to pressure for subdivision. In the outer suburbs of both cities, relatively few units were gained through soft densification, and affluent residential areas of Leicester – most notably Oadby and southern Wigston – saw de-densification. Oxford exhibited a much starker contrast of outcomes, with amalgamation leading to de-densification in Summertown (the city’s most expensive residential area), and the East Oxford suburbs showing marked soft densification. In all three cities, there was a tendency for the extent of soft densification over the decade to reflect neighbourhood social mix in 2001. In particular, there is a clear coincidence between neighbourhoods with high rates of soft densification and the four OAs whose residents already had the lowest shares of residential space (indicated by the stippled shading in Figure 1).
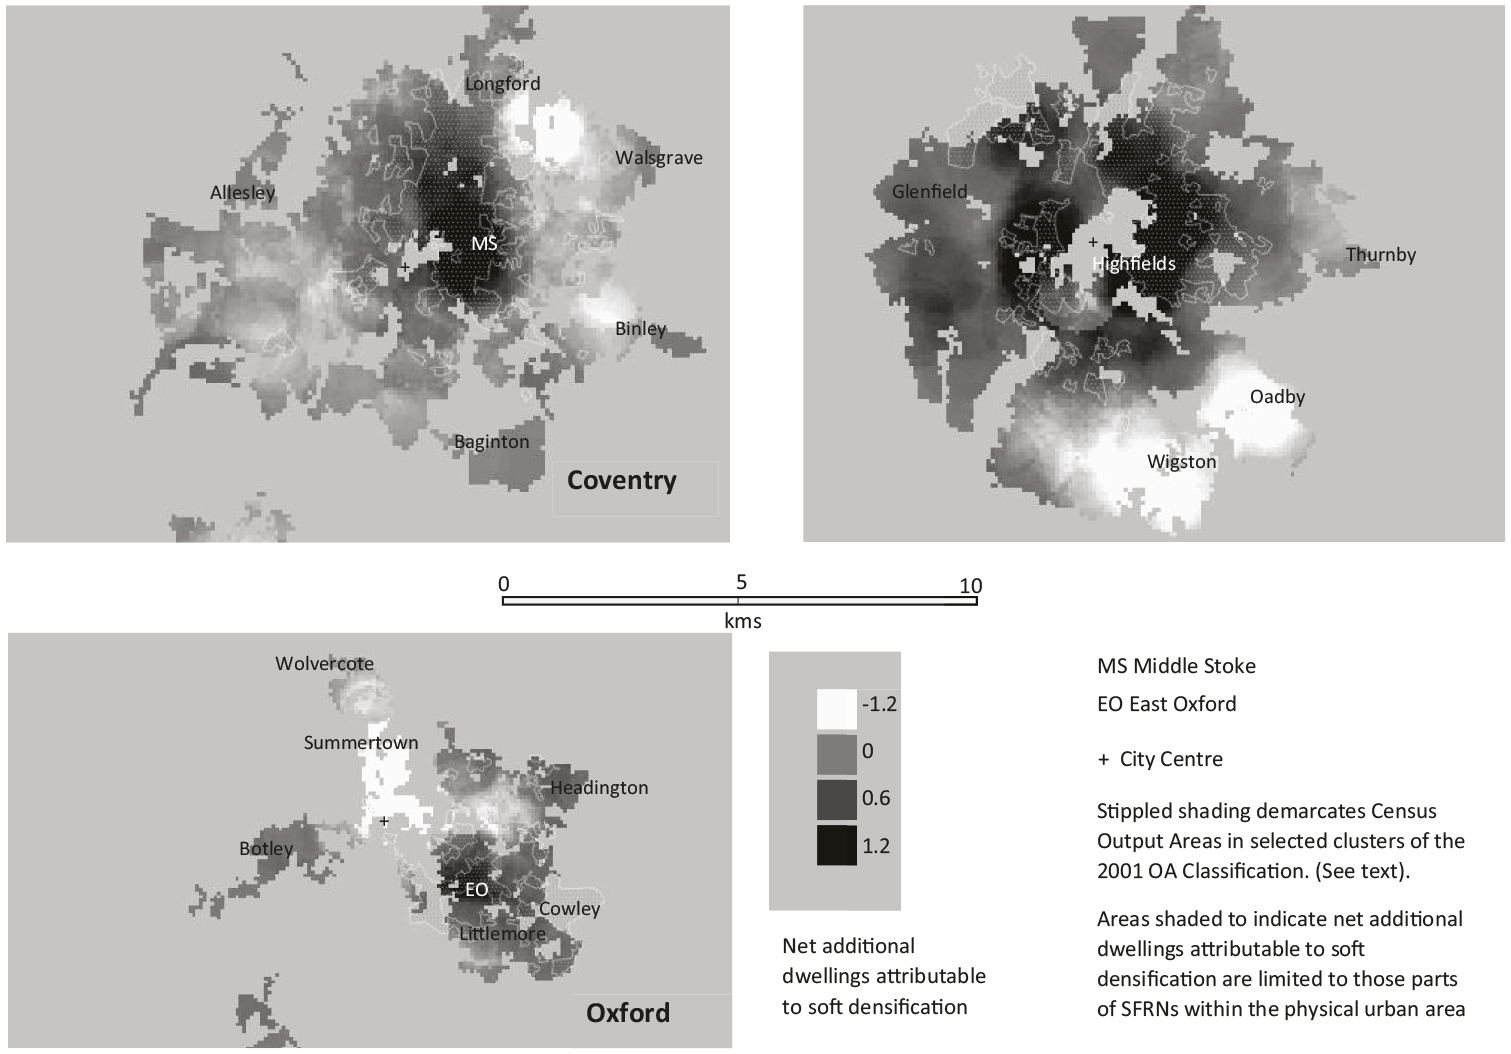
Intra-urban variation in soft densification of SFRNs in three English cities, 2001–2011.
Conclusion
Cities are continually developing and evolving. Consequently, urban form is ‘both the structure that shapes process and the structure that emerges from process’ (Neuman, 2005: 22). The present character of a city is no more than a snapshot of the cumulative results of a continuous process of urbanisation; it is not a fixed condition. This poses problems for the analysis of the relation between urban density and spatial justice. Until recently, such analysis has been undertaken at the city level that, because it is cross-sectional, sheds no light on the processes of densification. In addition, it fails to address variations in the intra-urban experience of densification and the redistributive effects to which they give rise.
Detailed case studies of particular parts of particular cities and/or of particular forms of residential densification have begun to address these shortcomings. However, the complex, contingent nature of densification that is revealed by in-depth analyses cautions against any wider conclusions being drawn from them. Additional challenges are posed by incremental residential development. Most metropolitan planning strategies focus on the large-scale activities of substantial actors. Small-scale, more informal, gradual, fragmented change ‘… slips through the cracks …’ (Pinnegar et al., 2015: 281). This is because, by its nature, such change is difficult to monitor and control. Nevertheless, its cumulative impact on urban form is considerable.
This was the context for our analysis. Our approach was comprehensive, covering all urban residential areas (SFRNs) in England. It was detailed, incorporating the various forms of densification and de-densification at the hectare cell level and aggregations thereof. It focused on soft residential densification, a poorly recorded and under-researched process but one that accounted for one third of net additional dwellings produced between 2001 and 2011.
The heterogeneity of the inter- and intra-urban experience of soft residential densification was considerable. In most urban areas, soft densification contributed to growth of the dwelling stock. However, the mix of infill construction and subdivision and conversion varied enormously, as did the offsetting effect of amalgamation. Overall outcomes thus mask significant differences in the behaviour of the constituent elements of change. Despite the heterogeneity of the processes and forms of soft densification, its implications for one aspect of urban spatial justice – the equitable distribution of residential space – are clear.
Fainstein (2010: 3) argues that ‘Our knowledge of what constitutes injustice is virtually instinctive – it consists of actions that disadvantage those who already have less …’. This is precisely the outcome of the process of soft densification. Its incidence was markedly uneven at the neighbourhood scale. Just eight of 52 OA types accounted for half of all soft densification between 2001 and 2011. These neighbourhoods were already densely developed and were characterised by lower income households that occupied significantly less residential space than the average. Subdivision and conversion were the dominant forms of densification in these areas and contributed to a further loss in their shares of residential space. This resulted in an increase in the level of inequality in the distribution of residential space between different social groups in England between 2001 and 2011.
These findings constitute a significant addition to the debate around the interrelation between urban densification and socio-spatial justice. They also raise questions about the recent management of urban development in England. By the millennium, the possibilities for densification were framed by institutional structures with established predispositions towards both corporatist intervention and neoliberal laissez-faire. The former was articulated through continuing urban containment and a focus on the re-development of brownfield land; and the latter through increasing reliance on private sector provision of owner-occupied and rented accommodation (Bibby et al., 2020). These factors reinforced the supply-constrained nature of the market. Without the mitigating effect of the substantial provision of affordable social housing developed by local authorities during the post-war long boom, this is a market where everyone gets only what they are able to pay for. In these circumstances, subdivision is the most efficient way that small-scale developers can produce additional dwellings affordable for those on lower incomes. By its very nature, this reduces the share of space available to the less well-off. Incremental development by way of infill, amalgamation and ‘knockdown’ produces larger and more expensive dwellings. Further inequality in access to residential space is the result.
These circumstances have major social implications, not least because changes in government planning and housing policy since 2010 have made it more regressive in nature. Urban constraint and the reliance on the private sector for housing supply have continued. Notwithstanding the recent focus on increasing the rate of new house building, under-supply remains a significant problem (Wilson and Barton, 2020). Demand-side support (provided, for example, by Help to Buy) is preferred to supply-side restructuring (such as a substantial increase in the construction of social housing), further raising house prices (NAO, 2017). Cuts in welfare provision in general and housing benefit in particular, combined with additional de-regulation of the private rented sector, have further weakened the housing position of those on lower incomes (Stephens and Stephenson, 2016). The re-casting of planning as a market-driven system has been pursued with renewed vigour (Ferm and Raco, 2020). It seems likely, therefore, that the tendency for the distribution of residential space between social groups to become more unequal has continued since 2011.
Housing policy is a core constituent of social policy. The character of housing and of its immediate environment has a significant impact on residents’ quality of life, on their physical, mental and social health (Bonnefoy, 2007; Brindley et al., 2018) and on their educational attainment (Friedman, 2010). It also affects residents’ access to facilities, services and employment, and their labour productivity. Consequently, the contribution of soft densification to increasing inequality in the distribution of residential space is a matter of concern. Local small-scale developers are making decisions that collectively reshape cities, and are complicit in adaptive responses to structural constraint. At the same time, analysts and administrators are unaware of the significance of the actions of such developers. Hence further research is needed into soft densification and related policies.
Footnotes
Acknowledgements
The research for this article was undertaken in the context of an international research consultation on ‘Towards “soft” densification and intensification policies? Interests, limitations and opportunities’ that was managed by PUCA (Plan Urbanisme Construction Architecture). The authors are grateful for PUCA’s support.
Data sources
This article is based on the analysis of data drawn from the following sources: the Land Use Change Statistics (LUCS), managed by the Ministry for Housing, Communities and Local Government (for details, see https://www.gov.uk/government/collections/land-use-change-statistics); and the Royal Mail’s Postcode Address File (PAF) (for details, see ![]() ).
).
Declaration of conflicting interests
The author(s) declared no potential conflicts of interest with respect to the research, authorship, and/or publication of this article.
Funding
This research received financial support from the French Ministry of Planning (Ministère de la Cohésion des territoires (Ministry of Territorial Cohesion) – Ministère de la Transition écologique et solidaire (Ministry for the Ecological and Inclusive Transition)).