
Abstract
Today, over half of the world’s population lives in urban areas and it is projected that, by 2050, two out of three people will live in a city. This increased rural–urban migration, coupled with housing poverty, has led to the growth and formation of informal settlements, commonly known as slums. In Mexico, 25% of the urban population now live in informal settlements with varying degrees of deprivation. Although some informal neighbourhoods have contributed to the upward mobility of the inhabitants, the majority still lack basic services. Mexico City and the conurbation around it form a mega city of 21million people that has been growing in a manner qualified as ‘highly unproductive, (that) deepens inequality, raises pollution levels’ (available at: https://www.smartcitiesdive.com/ex/sustainablecitiescollective/making-way-urban-reform-mexico/176466/) and contains the largest slum in the world: Neza-Chalco-Izta. Urban reforms are now aiming to improve the conditions in these slums and therefore it is very important to have reliable tools to measure the changes that are underway. In this paper, we use exploratory factor analysis to define an index of shelter deprivation in Mexico City, namely the Slum Severity Index (SSI), based on the UN-HABITAT’s definition of slum. We apply this novel approach to the Census survey of Mexico and measure the shelter deprivation levels of households from 1990 to 2010. The analysis highlights high variability in housing conditions within Mexico City. We find that the SSI decreased significantly between 1990 and 2000 as a result of several policy reforms but increased between 2000 and 2010. We also show correlations of the SSI with other social factors such as education, health and fertility. We present a validation of the SSI using Grey Level Co-occurrence Matrix (GLCM) features extracted from Very-High Resolution (VHR) remote-sensed satellite images. Finally, we show that the SSI can present a cardinally meaningful assessment of the extent of deprivation compared with a similar index defined by Connolly (Connolly P (2009) Observing the evolution of irregular settlements: Mexico city’s colonias populares, 1990 to 2005. International Development Planning Review 31: 1–35) that studies shelter deprivation in Mexico.
Introduction
In the 21st century, the urban population continues to increase rapidly, driven by rural–urban migration. It is estimated that over the next three decades more than 60% of the world’s urban population will live in mega cities in emerging economies such as Asia and Latin America (UN-HABITAT, 2003). Mega cities such as Mumbai and Mexico City are home to the largest slums (Dharavi and Neza-Chalco-Izta) in the world. However, the growth and formation of slums need not be an inevitable consequence of rapid urbanisation. Such an argument appears to be contradicted by evidence of large populations living in slums, particularly in rapidly urbanising regions such as Mexico City. Historically, urban poverty in Mexico City began as a result of colonial land use and topography, with the flood-prone areas to the east of the city being occupied by the lower income group (UN-HABITAT, 2003). With high rural–urban migration and fertility during the 20th century, the city’s population grew to 18 million, of which ‘over 60 per cent are considered to be poor or moderately poor’ (UN-HABITAT, 2003). The built-up area increased from 23 km2 to 154,710 km2 between 1900 and 2000, expanding into nearby towns and invading steep hillsides and dried-up lake beds on which slums developed (UN-HABITAT, 2003). Today, around two-thirds of the population in Mexico City live in slums and exhibit social heterogeneity and varying degrees of shelter deprivation (UN-HABITAT, 2003). Once established, a slum typically lacks basic infrastructure and services depending upon the terrain, the location and the political climate. Since 2001, the federal district government has provided credits for home improvements and extensions to households in impoverished slums (Foster, 2010). In July 2015, a press release from the governmental institution in charge of measuring poverty in Mexico (CONEVAL) (Foster, 2010) stated that urban poverty increased from 40.6% to 41.7%, which equates to around 35.4 million people living below the poverty line. Therefore, evidence indicates that urban planners confronted with rapid urbanisation struggle to cope with the diverse demand for basic services of the urban poor. It is evident that lack of quantitative tools and targeted policy interventions are major issues in the agenda to manage rapid urbanisation (Turok and Borel-Saladin, 2018).
In Mexico City, policies have evolved and urban authorities have adopted different strategies ranging from in situ development in slums, relocation to resettlement colonies and forced evictions. However, one of the key difficulties in measuring the success of these interventions is the lack of a multidimensional index which comprises aspects related to living conditions that define a slum. Therefore, the objective of this paper is to develop a multidimensional slum severity index (SSI) in Mexico City using exploratory factor analysis. We rely on the more general definition of UN-HABITAT which defines a slum household as a group of individuals living under the same roof in an urban area, who lack one or more of the following conditions (UN-HABITAT, 2003): (1) durable housing of a permanent nature that protects against extreme climate conditions; (2) sufficient living space, which means not more than three people sharing the same room; (3) easy access to safe water in sufficient amounts at an affordable price; (4) access to adequate sanitation in the form of a private or public toilet shared by a reasonable number of people; and (5) security of tenure that prevents forced evictions. Further, UN-HABITAT recommends that ‘only the first four contribute to a definition of those who suffer from shelter deprivation’ (UN-HABITAT, 2003). Though lack of security of tenure is one of the conditions in most slums, it should not be used to measure shelter deprivation (UN-HABITAT, 2003). Since the objective of this paper is to develop a continuous index of shelter deprivation based on the definition of slums, we have not included security of tenure in our analysis.
Slums are heterogeneous and each slum in a city suffers from varying degrees of deprivation. The degree of physical deprivation depends on how many of the conditions that define slums are prevalent within a slum household (Roy et al., 2014). Therefore, the importance of a multidimensional SSI is highlighted at several levels. In the Millennium Development Goals (goal 7, target 11), the UN has set out to achieve ‘a significant improvement in the lives of 100 million slum dwellers by 2020’ (Castello et al., 2010). In Mexico, a law, Ley General de Desarrollo Social (LGDS), was approved in 2004 to guarantee social development across all sections of society. It states that national policy should protect individual and collective social rights, including housing rights of the urban poor.
Since the mid-1970s, empirical analyses have considered various non-economic deprivations that are experienced by the urban poor, complementing the economic measures. Conceptually, many analyses were motivated by the basic needs approach, the capability approach and the social inclusion approach. A number of methodologies have emerged to assess poverty from a multidimensional perspective, such as the dashboard approach (Alkire et al., 2011), the composite indices approach (Sen and Anand, 1997), Venn diagrams (Decancq et al., 2015), the dominance approach (Batana and Duclos, 2010), statistical approaches (Krishnakumar and Nagar, 2008), fuzzy sets (Appiah-Kubi et al., 2007) and the axiomatic approach (Chakravarty and D’Ambrosio, 2013). A comprehensive review by Alkire et al. (2015) indicates that a model-based statistical technique is most appropriate when deprivation is considered to be a latent phenomenon and the observed indicators partially and indirectly measure the abstract latent concept. Furthermore, statistical techniques can be used with ordinal as well as cardinal data. In Mexico, CONEVAL defined a fuzzy-set-based index (Consejo Nacional de Evaluación de la política de desarrollo social, 2014) to measure social development to serve the Mexican government as an indicator of poverty. However, an index to measure shelter deprivation in slums is rather new and in its infancy. Patel et al. (2014) developed a dashboard-based SSI for two Indian cities: Kolkata and Mumbai. However, the index has three major drawbacks. First, the index is discrete and denotes the number of attributes (defined in UN-HABITAT) lacking in a household. This makes it impossible to compare different households (or cities) which have the same index, as deprivation could be due to different attributes. Therefore, to compare various neighbourhoods (or cities), the index needs to be decomposed, which defies the purpose of creating an index in the first place. Second, the framework operates at a household level, which seems irrelevant for slum management policies, which are largely implemented at the scale of neighbourhoods. Finally, in different cities, the attributes mentioned in UN-HABITAT should be weighted according to the context of the city. For example, if water scarcity is persistent across the city, then it should carry less weight in the calculation of SSI as the underlying cause is likely to be something else. Recent studies have employed remote sensing in the identification of slum areas using important landmarks and land use criteria in an index that reflects the physical deprivation of a geographical zone (Khadr et al., 2010). The composite index developed consists of four main dimensions characterising physical attributes, sources of pollution, available services and security of each area (Khadr et al., 2010). However, the drawback of using proxies such as ‘presence of security’ or ‘available services’ is that they are not universal and may not be applicable in several developing countries such as India and Mexico. Similarly, factor analysis has been applied to differentiate the physical conditions among urban blocks in Colombia. The objective was to stratify urban blocks in six different categories or ‘strata’, one being the poorest conditions and six representing the best conditions. However, such stratification leads to loss of information and makes it difficult to understand intra- and inter-strata variance (Yunda, 2019).
In this paper, we apply a model-based statistical technique, namely, exploratory factor analysis (EFA), to move beyond the traditional discrete categorisation of shelter deprivation and project physical deprivation in a spectrum using the novel SSI. The value of the index ranges from 0 to 1, where 0 indicates low shelter deprivation and 1 highlights the poorest living conditions. The SSI is calculated based on census data of Mexico City from the years 1990, 2000 and 2010. This paper produces three key insights with respect to the deprivation in slums. First, we provide a framework to validate SSI using Grey Level Co-occurrence Matrix (GLCM), a textual feature extracted from Very-High Resolution (VHR) remote-sensed satellite images. Further, this indicates the transferability between image-based features and socio-economic conditions. Second, we generate a better understanding of the heterogeneity in slums of Mexico City. We analyse the association of SSI with other material indicators such as employment, education and health. Finally, the results show that the SSI proposed in this paper is able to present a cardinally meaningful assessment of the extent of the difference in deprivation at a block level. The paper is further organised as follows: first we provide a description of the methodology (factor analysis model) and the data. In the following section we present the result of SSI and its comparison with the Connolly index. Further, we present an analysis of the results and the association of SSI with other socio-economic indicators. Finally, the paper concludes with a discussion of the results and a way forward.
Methodology
In this section, we elaborate on the data and statistical model employed to calculate the SSI in Mexico City.
Data
Here we describe the census data from the National Institute of Statistics, Geography and Informatics (INEGI), the official government institution in Mexico responsible for population enumeration. Although general census data have been made available every five years, we have studied the data from 2010 since they contain data at four levels of aggregation (Municipal, Locality, Group of Blocks and individual Block) and cover an extensive set of attributes regarding individuals (age, education, gender distribution, work, health, migration, indigenous origin, disability, religion), houses (construction material, number of rooms, services (such as electricity, water) and type (uninhabited–inhabited, communal–individual)), and household structure. The data consist of 157,017 samples and 198 attributes. The data from 1990 to 2000 were further used to exemplify the application of SSI and do not contain data at the level of blocks. As described in the previous section, we define the SSI based on the UN definition of slums, and therefore use the following indicators from the data. The values for the indicators have been chosen based on the ‘Urban Indicators Guidelines’ published by the United Nations Human Settlements Programme for monitoring the Habitat Agenda and the Millennium Development Goals- Slums Target (UN-HABITAT, 2009). Figures 1 and 2 show the spatial distribution and the probability density distribution of the four indicators in Mexico City respectively.
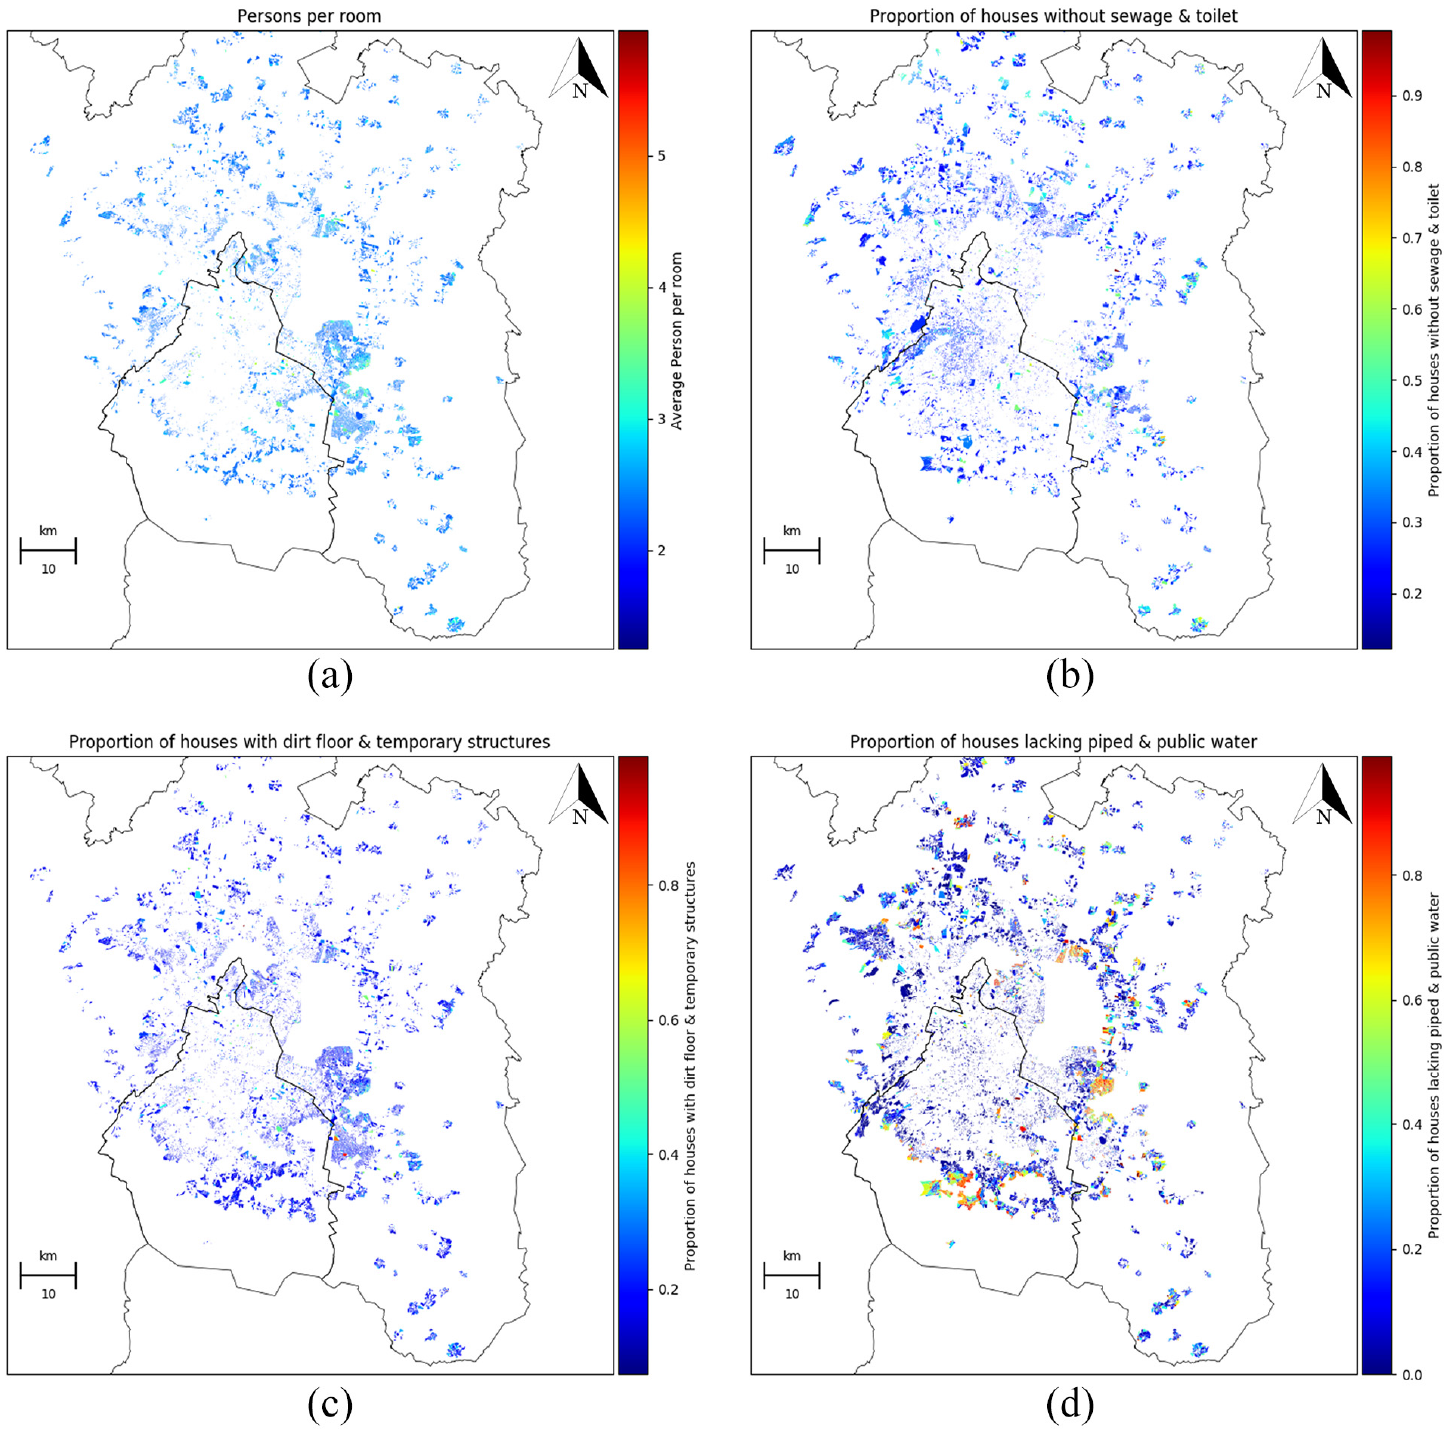
Spatial distribution of the four attributes in urban blocks of Mexico City, 2010. (a) Spatial distribution of person per room. (b) Spatial distribution of proportion of houses without sewerage and toilet. (c) Spatial distribution of proportion of houses with dirt floor and temporary structures. (d) Spatial distribution of proportion of houses lacking piped and public water.
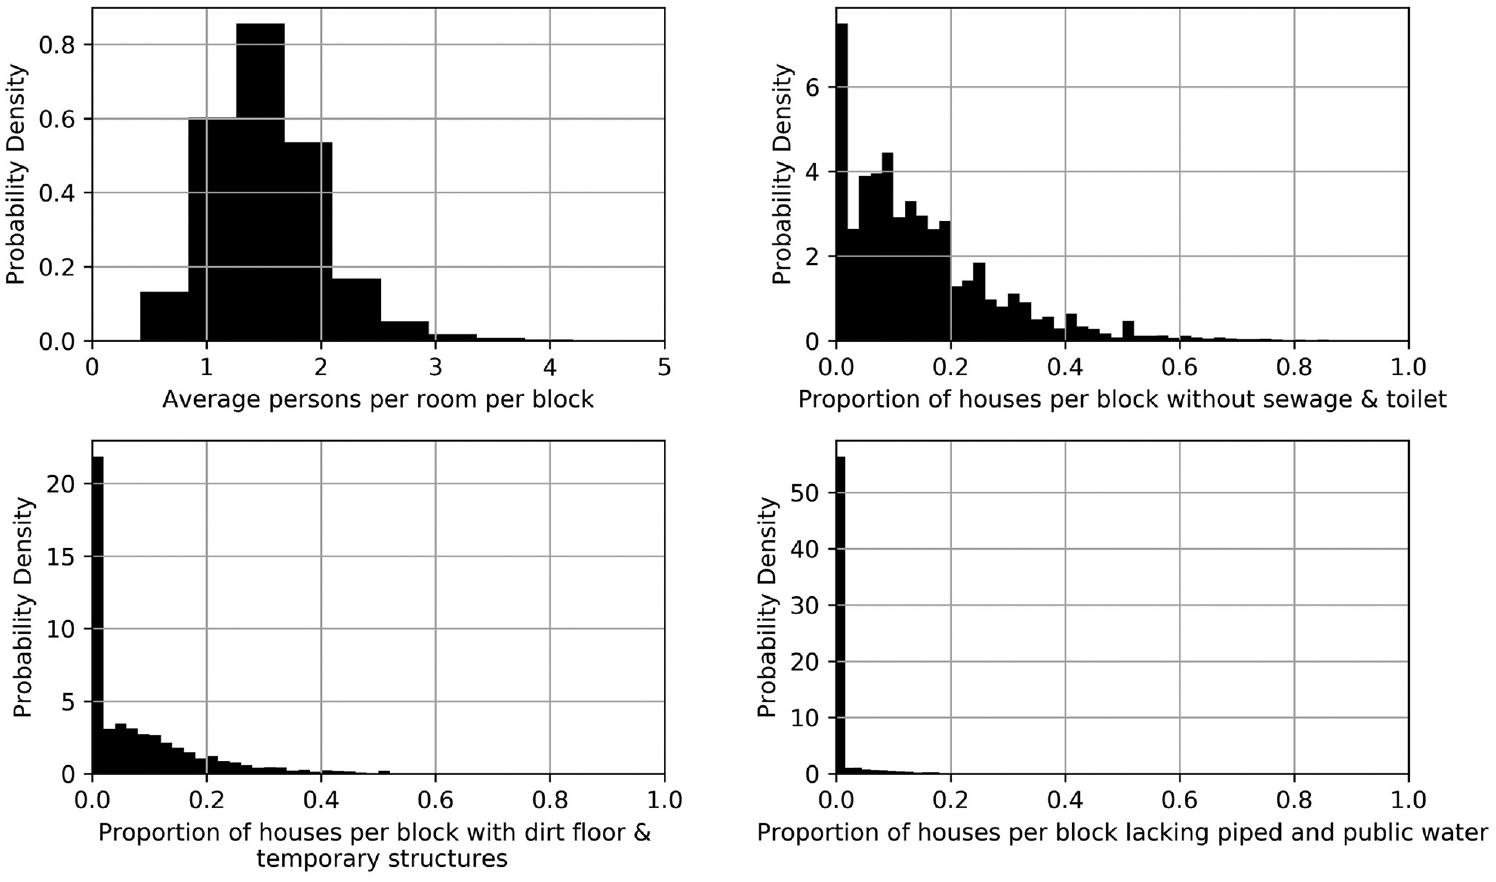
Distribution of density, sanitation, structure and water in urban blocks of Mexico City, 2010. The y-axis (labelled as Probability Density) represents the density estimation of the probability density function of the random variable mentioned in the x-axis.
Sufficient living space
UN-HABITAT defines sufficient living space as not more than three people sharing the same room. Therefore, we use density (d) defined as the number of people in one room. We find that most houses in Mexico City have around 1.5 persons per room. Figure 1a shows that south-east of Mexico City there is reasonable overcrowding (more than three people sharing the same room) as compared with the rest of the city. Generally, the lack of sanitation and of water in slums are compounded by insufficient living space for households and inadequate, makeshift housing (UN-HABITAT, 2003).
Access to sanitation
According to UN-HABITAT, access to sanitation should be computed as the proportion of the population with access to an excreta disposal system, either in the form of a private toilet or a public toilet (UN-HABITAT, 2009). In this section we use the proportion of houses without sewerage and toilets (private or public) to measure access to sanitation. Figure 1b shows that this is a more prevalent condition. It amounts to 4% of the total houses and appears in almost 27% of the blocks. Inadequate sanitation remains a leading cause of diarrhoeal disease and mortality among children, particularly in urban slums (Buttenheim, 2008).
Structural quality and durability
According to UN-HABITAT, structural quality and durability should be computed based on the non-hazardous location and quality of construction (e.g. materials used for wall, floor and roof) (UN-HABITAT, 2009). In this study we use the proportion of houses with dirt floor and temporary structures to measure structural quality in a block. Figure 2 shows that this is a more prevalent condition, since almost 30% of the blocks have dirt-floor houses and it amounts to around 5% of the total houses in Mexico City.
Access to safe water
According to UN-HABITAT, access to safe water should be computed as the proportion of the population with access to piped water, protected well or public tap (UN-HABITAT, 2009). In our study, we use the proportion of houses lacking piped and public water to measure ‘access to safe water’. Most of the city area appears in white, since there is no deprivation of water (evident in Figure 2). The median value for proportion of houses lacking piped and public water across the blocks of the city is zero. Figure 1d shows that high levels of water poverty are concentrated towards the periphery of the city.
Exploratory Factor Analysis (EFA) model
In this section, we briefly explain the EFA (Fabrigar and Wegener, 2011) model we implement to calculate the SSI. In the past, EFA models have been used to calculate various poverty indices (Marí-Dell’Olmo et al., 2011; Mezzetti and Billari, 2005). The EFA model is generally formulated in matrix form as:

where X is the matrix of observable random variables (described in sections ‘Sufficient living space’, ‘Access to sanitation’, ‘Structural quality and durability’ and ‘Access to safe water’), µ is the mean matrix, c contains the unobserved stochastic error terms with zero mean and finite variance, F matrix contains the factor(s) (shelter deprivation in slums), and L is the loading matrix. In this model, the factor loadings serve as weights. The weight represents the amount of variability, which each of the variables represent out of the total variability in the data. This overcomes the weakness of assigning an arbitrary weight to all the variables. Instead, the weights are unique to each variable and each data set (context) (see Supplementary Information, available online, for details).
As discussed in the Introduction, the objective of SSI is to provide a context-based measurement of shelter deprivation in slums. The SSI is an indicator or a factor that points us to the blocks that need more attention. In this paper, we assume that the lack of water, quality of materials (specifically floor), sewerage and space (overcrowding) in the houses of a certain block are related and can be explained by the value of one factor, that is, the SSI. This assumption is based on the definition of ‘slum’ by the UN (see Introduction). The SSI is the dot product of the normalised communality 1 and the values of four attributes in each block (in our case since there is only one factor, the communality is the square of factor loadings).
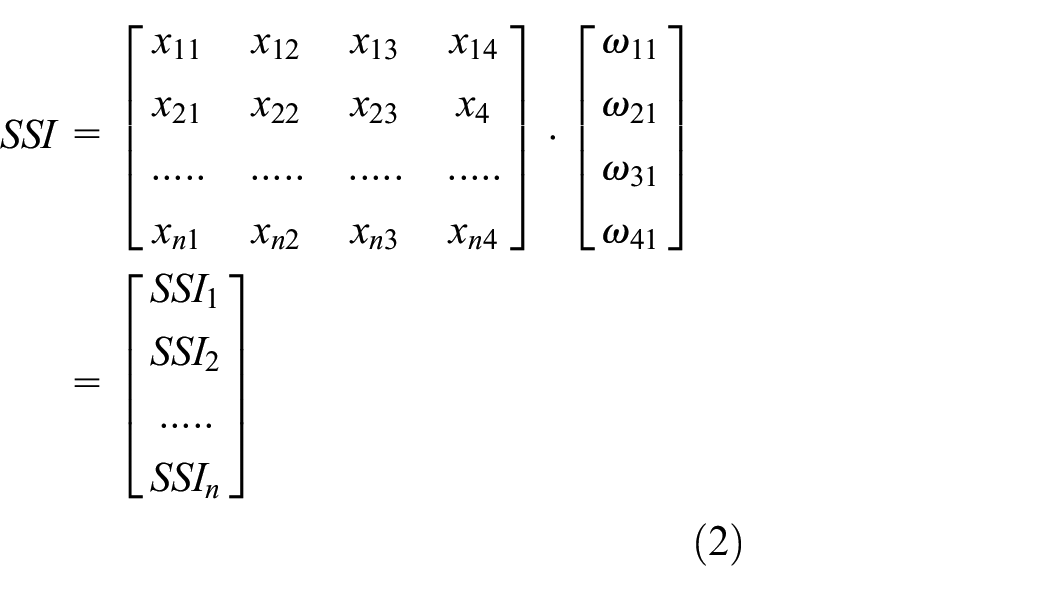
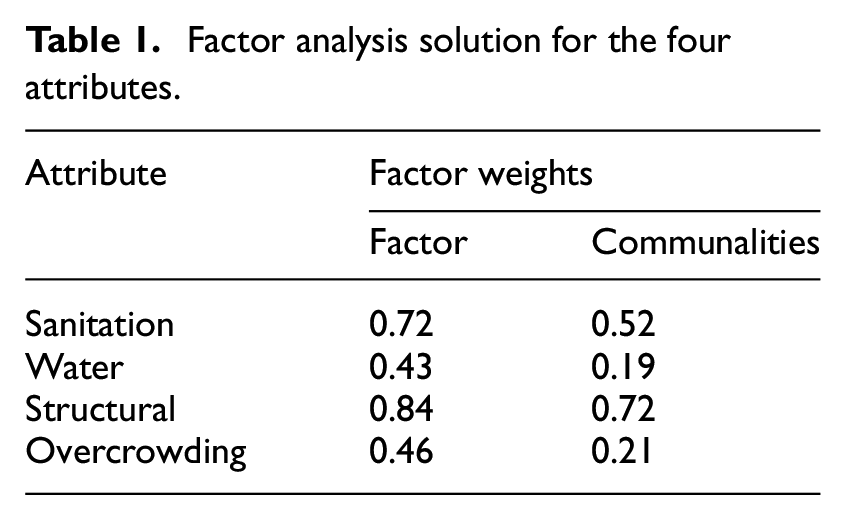
where n is the total number of blocks in Mexico City and ω11, ω21, ω31 and ω41 are the communalities (see Table 1).
Factor analysis solution for the four attributes.
Results
Here we provide the results for model adequacy using the Kaiser-Meyer-Olkin (KMO) test (Cerny and Kaiser, 1977). Further, we provide the estimation of the factor loading and model adequacy tests. Finally, we validate the SSI using the GLCM features extracted from VHR remote-sensed satellite images. Qualitative validation is also conducted by comparing the SSI with a similar index defined by Connolly (Connolly, 2009) that studies shelter deprivation in Mexico.
Estimating the EFA model
Before applying the exploratory factor analysis model to the data, the correlations in the data were checked for multicollinearity, which could increase the standard error of factor loadings, making them less consistent and also hard to label. In the present study, the KMO test, a Measure of Sampling Adequacy (MSA) was used to detect multicollinearity in the data so that the appropriateness of carrying out a factor analysis can be measured.
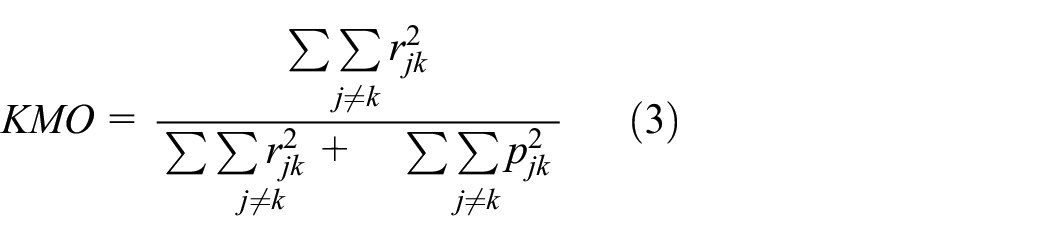
where rjk is the correlation between the variables, and pjk is the partial correlation.
More specifically, sampling adequacy predicts if data are likely to factor well, based on correlations and partial correlations. The KMO statistic is a measure of the proportion of variance among variables that might be common variance. The lower the proportion, the more suited are the data for Factor Analysis. KMO returns values between 0 and 1, where values ranging from 0.6 to 1 indicate that the data are suited for Factor Analysis (Cerny and Kaiser, 1977). The KMO statistic returned a value of 0.77, indicating that we can use Factor Analysis on the Mexico data. In Table 1, considering the factor loadings in the second column, it is evident that the factor has a strong association with the four attributes used to calculate the SSI. The communality shows how much of the variance in each of the attributes is explained by the one factor and is therefore used as weights of individual attributes in the calculation of SSI.
The bimodal, two-humped distribution for the SSI shows that the living conditions in Mexico City are clearly divided into rich and deprived neighbourhoods. Recent studies have demonstrated a strong correlation between shelter deprivation and income in Mexico City (Battiston et al., 2013). Figure 3 shows a marked bimodality in the distribution of SSI with a higher peak near 0.15 indicating the size of middle-class households in Mexico City. A second peak around 0.6 represents the slum areas. Bimodal densities for income distribution are well documented in the literature and, to our knowledge, this is the first time it has been observed in shelter deprivation. Monitoring the distribution over a period of time can give insights to inequality in the context of a city. For example, a transition from bimodal to unimodal distribution can indicate that inequality in living conditions between rich and poor is decreasing.
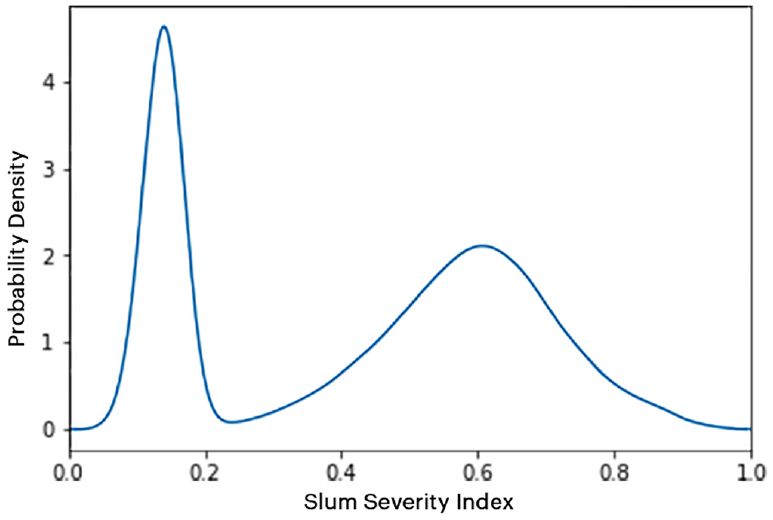
Distribution of SSI in Mexico City for the year 2010 at the block level. The y-axis (labelled as Probability Density) represents the kernel density estimation of the probability density function of the SSI.
Validation of SSI
Comparison with the Connolly index
In order to test the reliability of the SSI, it is important to evaluate its performance in differentiating between the different types of shelter deprivation. A four-means cluster analysis was conducted using the methodology described in the Connolly index (Connolly, 2009). The k-means clustering was performed based on the proportion of dwellings (in each block): (1) with dirt floor and temporary structures; (2) comprising only one room; (3) without access to a private toilet or a public toilet; (4) with no drainage connection; (5) without access to piped water, protected well or public tap; (6) with no telephone; and (7) with no water-heater. Table 2 shows that based on the cluster analysis of the Connolly index, four significant (average silhouette score is 0.681) distinct categories are produced. Connolly uses four categories – very bad, bad, good and very good, indicating the extent of shelter deprivation in various neighbourhoods of Mexico City.
Comparison between the four derived categories based on Connolly (2009) and the EFA-based SSI.
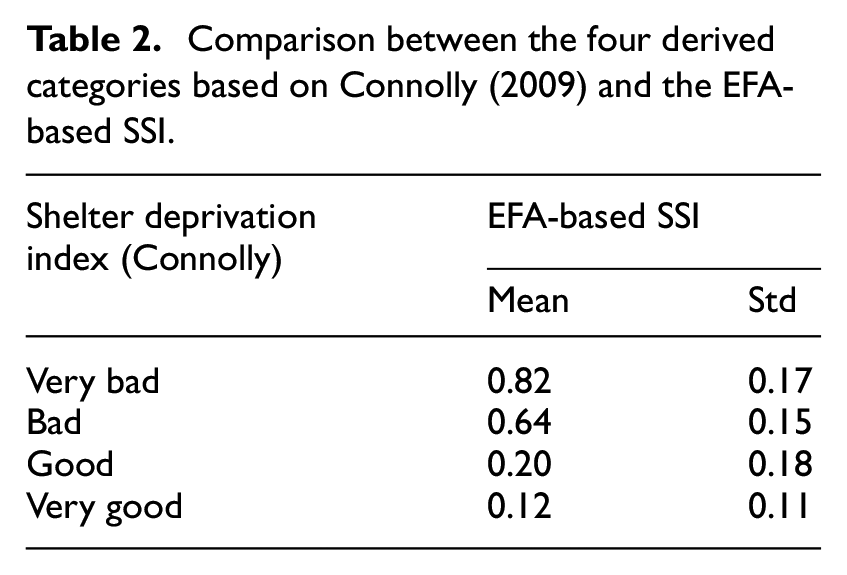
Connolly uses four categories – very bad, bad, good and very good, indicating the extent of shelter deprivation in various neighbourhoods of Mexico City. Therefore, ‘very bad’ refers to the most physically deprived cluster or slum-like conditions, while the ‘very good’ refers to the least shelter deprivation in Mexico City. Table 2 indicates how the EFA-based SSI compares with each of the categories in the Connolly index. The average score for the ‘very good’ cluster was 0.12, while the ‘bad’ and ‘very bad’ urban blocks had an average of 0.64 and 0.82, respectively.
Figure 4a and b shows the comparison between the result of SSI and the k-means clustering algorithm implemented for the Connolly index (Connolly, 2009). We find that both algorithms are able to detect high incidence of shelter deprivation near the periphery of Mexico City. However, there are two important differences between SSI and the Connolly index (Connolly, 2009). First, Figure 4b fails to show the heterogeneity in deprivation within the slum areas. It categorises all blocks into four distinct classes and therefore cannot capture the intra-class and inter-class variations as shown in Table 2. As shown in Figure 4a, the EFA model-based SSI is able to capture deprivation at much finer scale. To validate the index further we compare one of the well known slums in Mexico, Neza-Izta-Chalco, using the SSI and an official poverty index developed by the National Council for the Evaluation of Social Development Policy (CONEVAL) as shown in Figure 5. The map on the right in Figure 5 is the official measure of poverty (based on economic wellbeing and social rights) published by CONEVAL. We can observe that using SSI we can identify small pockets of neighbourhoods which are missed in the CONEVAL map. Second, the SSI is context-based which basically means that each attribute (sanitation, water, structural quality and density) is weighted (see Supplementary Information, available online, for details) according to the context of the city at that particular time. Therefore, it incorporates the change in situation for a given city over time and can be used to compare slum severity among different cities in countries across the globe.
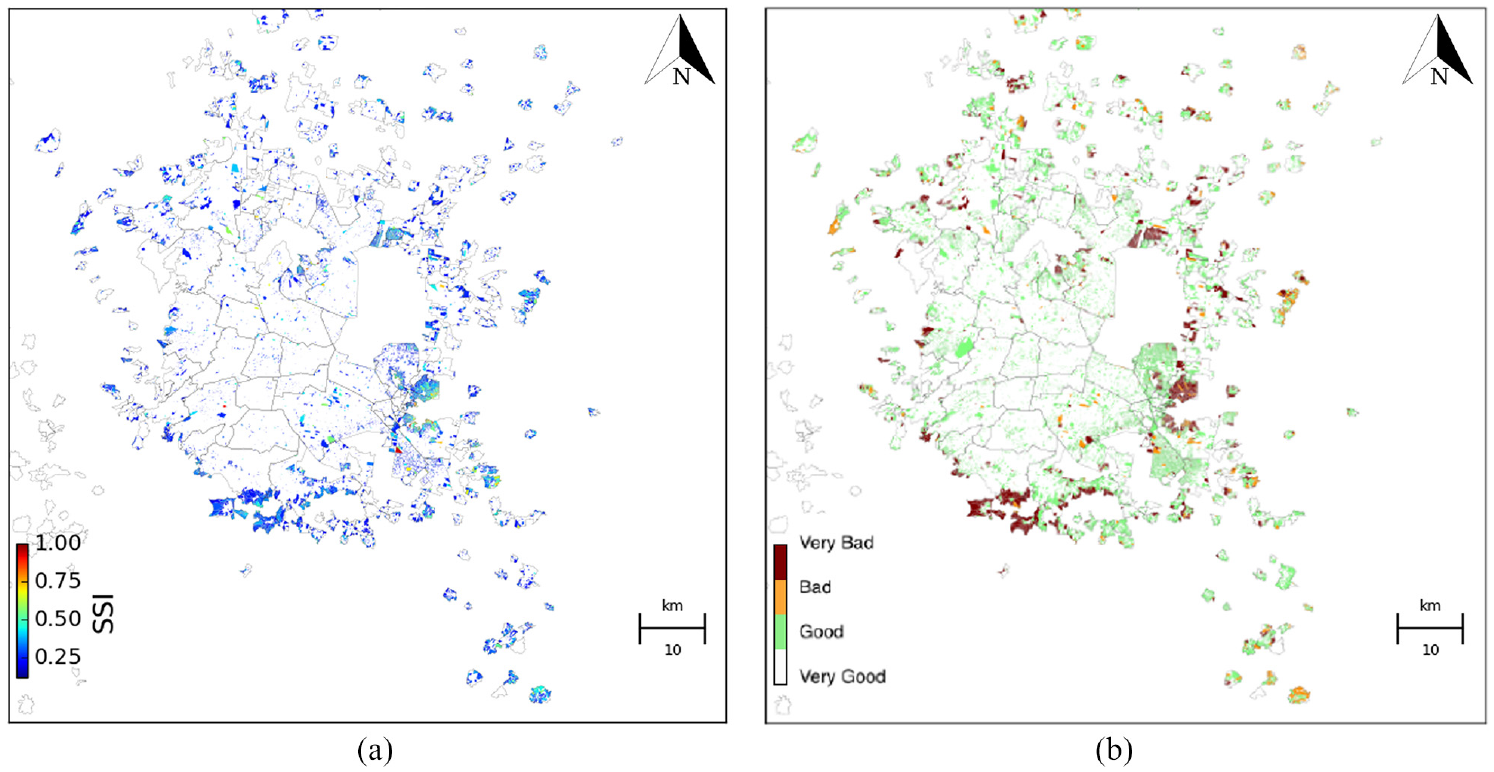
Comparison between the novel SSI and k-means clustering implemented by Connolly. (a) Spatial distribution of SSI using EFA. (b) K-means clustering by Connolly (Connolly, 2009).
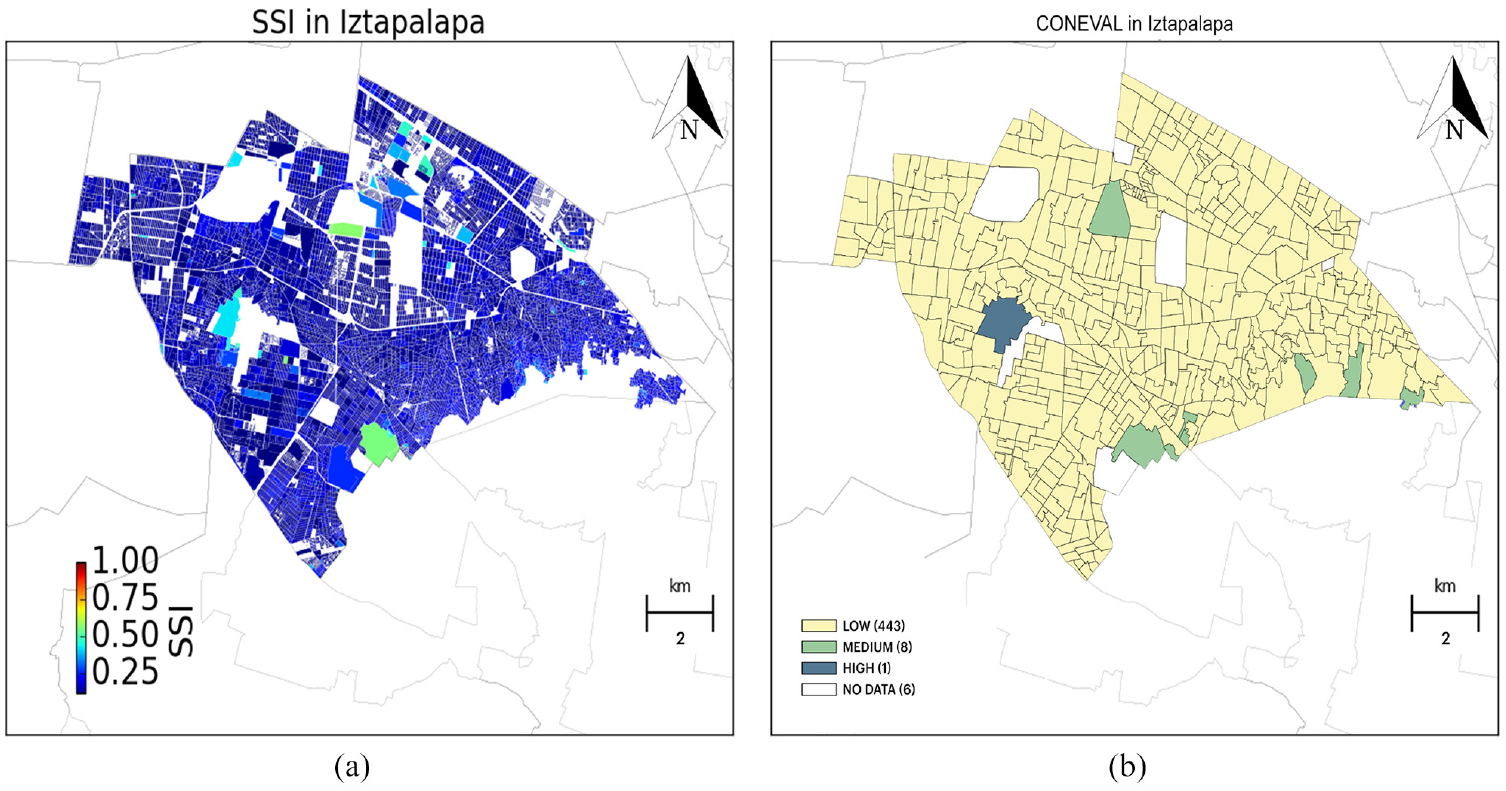
This is Iztapalapa, a part of the city commonly known to be poor, it is part of what people call the Neza-Izta-Chalco slum. Observe that in a lower level of aggregation (left) it is possible to distinguish some areas with deprivation that are not available at the lowest scale that CONEVAL’s shows results (right). At the level of locality, the SSI decreased from 0.79 in 1990 to 0.61 in 2010 – similar trends have been observed in other studies (Connolly, 2009).
Comparison with textural features of slums
In this section, we perform a quantitative validation of SSI by comparing its association with the GLCM variance extracted from VHR remote-sensed satellite images of Mexico City. Remote sensing offers an independent source of information to compare physical deprivation captured through social surveys. Textural features extracted from satellite images have been used to detect and classify levels of deprivation in a neighbourhood. In the last decade, the GLCM has been frequently used to extract building footprints that are in clear contrast with their surroundings (Arribas-Bel et al., 2017; Kuffer et al., 2016). The GLCM calculates the co-occurrences of the pixel values that are separated at a distance of one pixel inside a polygon (Kabir et al., 2010). It is calculated considering the average value of four principal orientations: 0°, 45°, 90° and 135°, to avoid the influence of the orientation of the elements inside the polygon. These texture variables include uniformity, entropy, contrast, inverse difference moment, covariance, variance and correlation (Kuffer et al., 2016). The GLCM variance depicts building structures in formally developed areas as they have high variance values, while buildings in slums are usually too small and clustered to have a clear ‘contrast’ with their surroundings. This allows the extraction of densely built-up areas with low GLCM variance values, as they have a high probability to be slums. WorldView-2 scenes (PAN: 0.5 m and MS: 2 m) from 2010 were used for covering a purposefully selected part of the city which has a good mix of slum and non-slum neighbourhoods (Ranguelova et al., 2018). In order to validate the SSI, we calculated the GLCM variance from VHR imageries for each block using an x and y shift value of (1, 1) and a window size of 21 pixels × 21 pixels, and the Pearson correlation was calculated between the SSI and the GLCM variance. These parameters were selected based on previous studies (Kuffer et al., 2016). The results indicate that as the value of SSI increases, the GLCM variance significantly decreases, indicating a negative correlation (r = −0.67, p < 0.05). This is consistent with previous findings, which show that the GLCM variance of slums is lower than that of formal built-up neighbourhoods (Arribas-Bel et al., 2017; Kuffer et al., 2016).
Discussion
In this paper, we have applied the UN-HABITAT (2003) definition to estimate shelter deprivations of households in Mexico City at a block level. We adopted the UN-HABITAT approach of defining slums because it allows researchers to develop a generic model based on which directed-data collection can be performed. Further, it allows policymakers to prioritise and apply context-based interventions based on the degree of physical deprivation (Patel et al., 2014). In the previous sections we have demonstrated that the validated SSI is able to present a cardinally meaningful assessment of the extent in deprivation at a block level. In this section, we investigate the association of SSI with other social indicators and discuss three key findings. First, as shown in Figure 6, we observe correlations between the SSI and a standard set of socio-economic indicators. In all figures the data were first sorted with respect to the SSI, then the different indicators were plotted. As observed in Figure 6, higher SSI is associated with low literacy, poor healthcare delivery and higher fertility, which indicates that shelter deprivation is associated with social and economic marginalisation of poor people and results in greater vulnerability (Arimah and Branch, 2011).
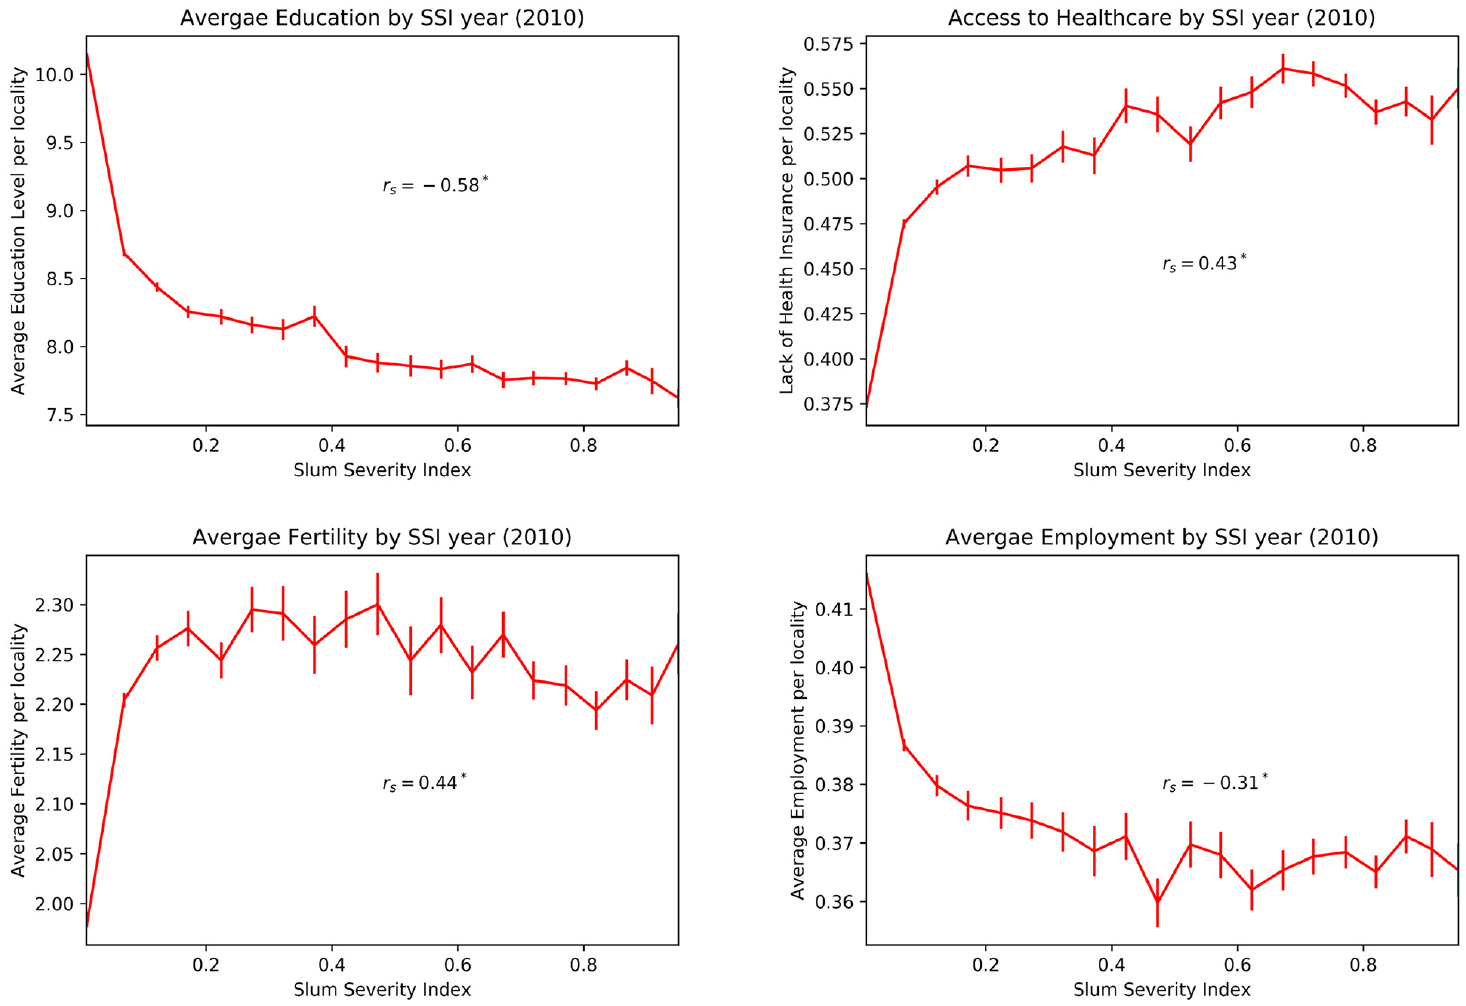
The association of SSI with education, healthcare, fertility and migration. The line plots the average while the error bar indicates the standard error of mean. rs indicates Spearman correlation. *indicates significance at α = 0.05.
Second, one of the key drawbacks of traditional discrete categorisation of shelter deprivation is that it fails to capture the improvement brought about by reducing one type of deprivation (e.g. water, sanitation) as households typically face other types of deprivation simultaneously and they would still be classified as slums (Patel et al., 2014). The EFA model-based SSI, however, could monitor the slum conditions using data collected at different time-points and spatial resolution in a continuous scale. We have estimated the SSI from 1990, 2000 and 2010 data at the level of locality for comparison, since data are not available at the level of individual blocks for the years 1990 and 2000 (discussed in section ‘Data’). Figure 7a shows the SSI in Mexico City from 1990 to 2010 based on the census performed every ten years. In the 1980s, driven by high levels of population and poverty, residents of Mexico City began to request political and administrative autonomy to manage their local affairs. In the 1990s an Assembly of Representatives was created which formulated various reforms. As shown in Figure 7a, the drop in SSI from 1990 to 2000 reflects the change in policy. The net migration rate of Mexico City proper from 1995 to 2000 was negative, which implies that residents are moving to the suburbs of the metropolitan area, or to other states in Mexico. In addition, some inner suburbs are losing population to peri-urban regions, indicating the continuing expansion of Greater Mexico City and proliferation of slums in the periphery. However, Figure 7a also indicates significant (using a two-tailed t-test, α = 0.10, 90% CI 0.13 < 0.1 < 0.08 [Wald]) rise in the SSI between 2000 and 2010. Similar observations have been made in several poverty studies conducted in Mexico. In Mexico, the poverty rate increased by 2.9% between 2008 and 2014, according to the study Social Panorama of Latin America. Previous studies have attributed this growth in poverty to increased rural–urban migration. The poverty rate declined to about 61% in rural areas but increased to 41.7% in urban areas, according to government social development agency CONEVAL. Poverty data from the World Bank show that the changes in poverty have closely followed the macroeconomic cycle and the associated rhythm of the labour market between 1990 and 2000. The crisis of 1994–1995 created an economic setback. According to the World Bank data, extreme poverty in 2001 was 16% below the 1996 level, but still only 1% below the pre-crisis 1992 level. The World Bank data between 2005 and 2010 show a 4% rise in extreme poverty levels. Similar changes are observed in the SSI, which indicates that poverty levels and SSI are positively correlated. This is further reflected in a report from the Centre of Investigation and Documentation of Housing and the Federal Mortgage Society published in 2016, which shows that the number of households lacking basic services (piped water, sanitation, etc.) and living in houses built from poor materials (such as cardboard and reeds) has increased in the past decade. The problems fuelling the crisis are manifold. For one, low-income households have little access to loans, according to the Group of Economists and Associates (GEA). The problem is further amplified by high rural–urban migration coupled with lower income jobs (Pérez-Campuzano et al., 2018).
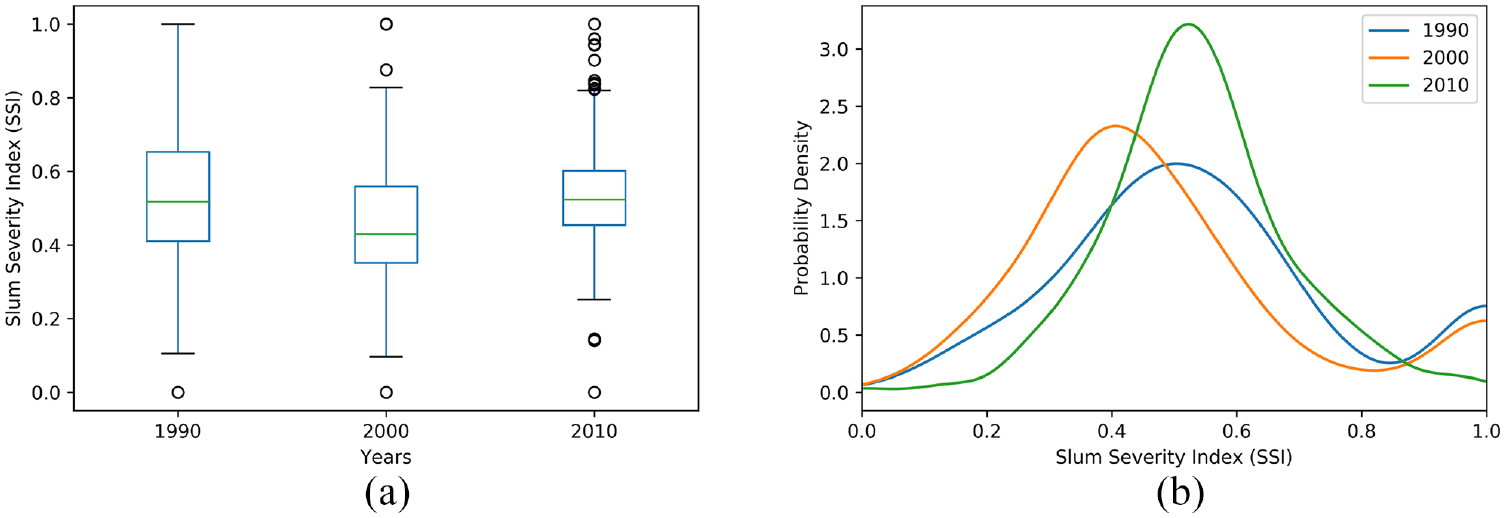
The SSI shows that physical deprivation in Mexico City has been decreasing during the period 1990–2000. Between 2000 and 2010 the SSI increased. The y-axis (labelled as Probability Density) represents the kernel density estimation of the probability density function of the SSI. (a) Box-plot of SSI during the period 1990–2010 at the Locality level. (b) Distribution of SSI from 1990 to 2010 at the Locality level. Note: the bimodality disappears from calculation of 2010 SSI from block to Locality.
Further, the results (see Figure 4a) show that as the distance from the central business district and from major roads increases, the SSI increases, a phenomenon also known as peripheralisation of slums. One of the key impacts of peripheralisation is the urban expansion in developing countries. Recently, researchers have studied peripheralisation and in general the growth and emergence of slums using spatially explicit computational models (Roy et al., 2014, 2017a). However, these models lack a robust validation framework (Roy et al., 2014). The SSI described in this paper can be used as a metric to validate the slum models against the reality as it captures many dimensions of deprivation in one index. Additionally, the SSI can be used to compare inter-temporal data at different spatial resolutions (e.g. Roy et al., 2018). Further, researchers can assess transferability of the concept of peripheralisation to different spatial patterns by considering the correlation between SSI and concepts such as segregation, polarisation, exclusion and marginality (Roy et al., 2017b).
Finally, the quantitative validation of SSI presented in section ‘Comparison with textural features of slums’ demonstrates the ability of satellite imagery to explain and successfully predict to a reasonable level of accuracy living environment deprivation. This result adds to an increasing volume of literature demonstrating the usefulness of remote-sensed data to predict and monitor physical deprivation in slums (Jean et al., 2016; Watmough et al., 2016). Although this study covered Mexico City, our approach is applicable to other cities in developing countries. However, the methodology used in this study is not applicable to scenarios where subsidies are provided to households based on their monetary income, as a way to improve individual housing conditions. In such a scenario, more detailed data about individual households is required.
Conclusion
In this paper, we have developed an exploratory factor analysis (EFA) model to calculate an index for physical deprivation in Mexico City, namely the Slum Severity Index (SSI). Although we have focused on Mexico City, the model can be applied to develop an index of deprivation in other countries. We have applied the UN-HABITAT definition on the census data of Mexico City to select the following four key attributes: sanitation, drinking facility, overcrowding and structural quality of houses. These four attributes were used in the EFA model to derive a SSI for each block in the city. The SSI will enable policymakers and urban planners to accurately measure the success of their past slum management policies. In addition, planners would also be able to design low-cost housing programmes at a spatial and temporal scale based on the needs of the population. The SSI derived in this paper can detect slums at a finer resolution compared with the existing shelter deprivation index (Connolly) being used in Mexico City and can capture inter-temporal, and cross-country comparisons. The key advantage of an EFA-based SSI is the inclusion of factor weights which determine the relative importance among the four factors based on the context. We have presented a validation of the SSI using Grey Level Co-occurrence Matrix (GLCM) variance extracted from Very-High Resolution (VHR) remote-sensed satellite images. Finally, we have shown that the SSI is highly correlated with social and economic marginalisation, which indicates that SSI could also be used as an indicator of poverty. Future research should focus on developing finer typology of slums based on the SSI and understanding how the spatial extent and ‘age’ of a slum influences the SSI.
Supplemental Material
USJ869769_supplemental_material – Supplemental material for An exploratory factor analysis model for slum severity index in Mexico City
Supplemental material, USJ869769_supplemental_material for An exploratory factor analysis model for slum severity index in Mexico City by Debraj Roy, David Bernal and Michael Lees in Urban Studies
Footnotes
Declaration of conflicting interests
The author(s) declared no potential conflicts of interest with respect to the research, authorship, and/or publication of this article.
Funding
The author(s) disclosed receipt of the following financial support for the research, authorship, and/or publication of this article: The authors acknowledge the support from the Dutch NWO, eScience project number 027.015.G05, “DynaSlum: Data Driven Modeling and Decision Support for Slums”.
Notes
References
Supplementary Material
Please find the following supplemental material available below.
For Open Access articles published under a Creative Commons License, all supplemental material carries the same license as the article it is associated with.
For non-Open Access articles published, all supplemental material carries a non-exclusive license, and permission requests for re-use of supplemental material or any part of supplemental material shall be sent directly to the copyright owner as specified in the copyright notice associated with the article.