
Abstract
Debates concerning residential population displacement in the context of gentrification remain vociferous, but are hampered by a lack of empirical evidence of the extent of the displacement occurring. The lack of quantitative evidence on gentrification-induced displacement and the difficulties in collecting it has long hampered the fight against it. Based on a systematic review of quantitative studies of the displacement associated with gentrification, this article considers how researchers have attempted to measure displacement using a range of statistical and mapping techniques reflecting the multi-dimensional character of gentrification. We note that these techniques often struggle to provide meaningful estimates of the number of individuals and households displaced by gentrification, something compounded by the lack of data available on a sufficiently granular temporal and spatial scale. Noting the limitations of extant methods, we conclude by considering the potential of more novel data sources and emergent methods involving the processing of larger amounts of (micro)data, as well as participatory GIS methods that involve affected communities themselves. This implies that whilst the quantitative study of displacement remains difficult, patterns and processes of displacement can be inferred through existing data sources, as well as data generated from those who themselves have experienced displacement.
Introduction
Debates about the effects of gentrification have always been highly polarised, with terms chosen to describe the processes involved being politically loaded: what some regard as displacement (Hartman, 1980), domicide (Porteous and Smith, 2001) or social cleansing (Cameron, 2003), others describe more benignly as replacement (Hamnett, 2003) or relocation (Kearns and Mason, 2013). Crucially, how socioeconomic change in a neighbourhood is interpreted, conceptualised and measured is critical to whether we find population displacement, how much of it we find and whether it is perceived to be problematic (Bernt and Holm, 2009). As a result, the focus on displacement (and those displaced) has a patchy history in the gentrification literature, with recent commentary lamenting the effective ‘“displacement” of displacement’ (Helbrecht, 2018: 2). In many ways, this has allowed governments, policy-makers and planners to pursue strategies of gentrification unchallenged by statistical evidence of what is often mooted as its most negative impact: the displacement of long-term residents (Atkinson, 2000). As such, ‘[t]he conceptualisation of displacement … has enormous political implications’ (Bernt and Holm, 2009: 313), as does how it is measured – its quantification.
In this article, we examine empirical research that has attempted to quantify displacement, a field dominated by studies which attempt to measure migration to or from ‘dwellings’ within given neighbourhoods across a fixed time period. Such studies are typically based on a unidimensional conceptualisation of direct, measurable displacement underpinned by a Cartesian notion of space (Davidson, 2008; Marcuse, 1986). Such an interpretation arguably fails to measure the psychosocial ties which bind people to places (Davidson, 2009), the effort or sacrifice that lower income residents may make in order to remain in their homes in gentrifying areas (Newman and Wyly, 2006) or the limitations that gentrification may place upon their future residential choices (Slater, 2009). Ignoring these dimensions means the displacement impacts of gentrification may be significantly underestimated (Millard-Ball, 2002).
Notwithstanding such conceptual issues, in this article we focus on the more practical problems bedevilling conventional measures of displacement: the lack of appropriate longitudinal data with which to measure housing turnover, rent increases, migration destinations or tenurial change at regular intervals has been a longstanding obstacle in this field (Atkinson, 2000). The purpose of this article is hence to review the quantitative methodologies deployed to measure the extent of gentrification-induced displacement. The terms of reference for the review have been restricted to residential property-led gentrification, as opposed to the displacement resulting from, for example, industrial or retail gentrification. 1 The article reviews some of the principal quantitative approaches to studying gentrification-induced displacement before exploring some important limitations of this literature relating to the choice of data sources, spatial units and time scales. While most of the relevant literature focuses on the US or UK, the review also explores more recent research undertaken in Europe and beyond.
Identifying neighbourhoods undergoing gentrification
Studies of gentrification-induced displacement often presuppose the accurate identification of neighbourhoods having experienced gentrification. This is important in relation to measuring displacement, as neighbourhoods not undergoing gentrification are frequently used as baseline comparators for displacement in neighbourhoods undergoing gentrification. Unfortunately, although the broad dimensions of gentrification are often agreed on (see Davidson and Lees, 2005, for a contemporary definition), the operationalisation of these dimensions in terms of measurable variables is far more equivocal. As an illustration, Galster and Peacock (1986) operationalised gentrification by constructing several logistic least-squares regression models using different census variables for Philadelphia (1970–1980). Their key finding was that variable selection had a significant impact on which, and how many, census tract areas were defined as neighbourhoods undergoing gentrification: Our empirical analysis of Philadelphia showed unambiguously that how one defines gentrification crucially affects which and how many tracts are identified as having undergone gentrification, and which characteristics of those tracts appear to hold the greatest explanatory power for such changes. The sensitivity of these important conclusions to both the definitional criterion used and the stringency with which it is applied is apparent. (Galster and Peacock, 1986: 333–334)
Similar tendencies are noted in Barton’s (2016) application of contrasting census-based models from Bostic and Martin (2003) and Freeman (2005) to identify neighbourhoods undergoing gentrification in New York City, comparing these with the results of a content analysis of gentrification stories in The New York Times. Perhaps unsurprisingly, these different methods identified wildly different sets of neighbourhoods undergoing gentrification.
In the light of the multi-dimensional character of gentrification, it would then seem preferable to identify neighbourhoods undergoing gentrification using a combination of variables, or at least to undertake sensitivity testing for different univariate proxies. Freeman (2005: 469–470), for example, made use of variables corresponding to:
city centre location;
relatively low income (compared with median for the metropolitan area);
older housing stock (measured through low rate of new-build – although this is not necessarily the same as old, e.g. Victorian, stock);
an increase in higher mean educational level than for metropolitan area;
a steeper increase in house (owner-occupied) prices.
Other examples of a multi-dimensional operationalisation are provided by Maciag (2015) and Desmond and Gershenson (2017), with the latter seeking to test the relationship between eviction and gentrification by studying households on a low median income at the start of the study period and exploring increases in mean educational level and median home values over time. They also included other variables that may be correlated with gentrification such as non-white population 2 and concentrated disadvantage (see also Holm and Schulz, 2018, who modelled neighbourhoods undergoing gentrification in Berlin).
Following the work of Hammel and Wyly (1996), Walks and Maaranen (2008) developed a similar method for identifying neighbourhoods undergoing gentrification using principal components analysis (PCA). They applied this to four variables (mean individual income; the proportion of tenants; socioeconomic status based on employment rate and professionals/managers; and the percentage of artists resident in an area), field-testing their results by checking with local experts in three Canadian cities. More recently, Reades et al. (2018) employed machine learning methods in an attempt to relate neighbourhood ascent in London (measured using four indicators) to 166 different variables, including environmental measures of proximity to green spaces and mean travel times to central London. Their work suggests that data-driven and probabilistic models may be more useful in the description and prediction of gentrification than the spatial, rule-based models more commonplace in urban systems modelling (see also Zhou et al., 2018). This is because there is a complex range of possible relationships between social and environmental variables that can unfold in different neighbourhoods, with attempts to predict change in a neighbourhood based on the state of adjacent ones unlikely to yield accurate prediction of change (Royall and Wortmann, 2015). Of course there is a difference between research that is trying to identify gentrifying neighbourhoods and research that is trying to predict gentrification. The implications of gentrification scholars trying to predict possible trajectories of neighbourhood change by looking at the process could well be exploited by those in search of rent gaps; indeed the ethical implications have yet to be debated.
Measures of gentrification-induced displacement
Accepting that displacement is much harder to detect than gentrification (Elliot-Cooper et al., 2019), here we consider attempts to measure displacement initially developed in the context of gentrification studies. Notably, early studies concerned with gentrification and displacement from the 1950s to the 1970s focused on post-war, state-led, slum clearance programmes. For example, estimates of the post-war slum clearances based on data from the UK Ministry of Housing and Local Government suggest that around 4 million properties, housing the best part of 15 million people, were demolished between 1955 and 1985 (Tunstall and Lowe, 2012). 3 US state programmes of urban ‘renewal’ in the 1950s and 1960s also behoved mandatory surveys of populations implicated for relocation for the purpose of relocation assistance (Hartman, 1980). However, the extent of the more dispersed gentrification-induced displacement that urban scholars began to take note of (in the UK in the 1960s and in the US in the 1970s) was not officially recorded in a similar manner. This hampered accurate enumeration of the number of households affected by gentrification-induced displacement and led to contested estimates as to its extent (Gale, 1979; Grier and Grier, 1978; Hartman, 1979; Sumka, 1979). This appeared to be related to markedly opposing views on gentrification, with those lauding the positive benefits of US inner-city ‘revitalisation’ downplaying any negative impacts. Meanwhile, Marxist researchers such as Smith (1979) were becoming increasingly concerned about the free market ideologies encouraging gentrification.
At this point in time, empirical studies into gentrification-induced displacement in the US began to emerge, mostly focused on single cities or neighbourhoods (Lee and Hodge, 1984; LeGates and Hartman, 1986). Some – including Clay (1979) and Gale (1980) – described distinct phases of early, accelerating and maturing gentrification, each associated with varying degrees of displacement. The definition of displacement used here involved the forced relocation of residents from their residential housing unit, and originated from the definition of a ‘displaced person’ used in the US Uniform Relocation Act, enacted for the purpose of state compensation (US Department of Housing and Urban Development, 2017). Referring to this conceptualisation, Grier and Grier (1978: 8) suggested that ‘displacement occurs when any household is forced to move from its residence by conditions which affect the dwelling or its immediate surroundings’, and which ‘i. Are beyond the household’s reasonable ability to control or prevent; ii. Occur despite the household’s having met all previously-imposed conditions of occupancy; iii. Make continued occupancy by that household impossible, hazardous, or unaffordable’.
The latter point was connected to the high rate of abandoned property in formerly disinvested US inner-city neighbourhoods that had been left to decay during the recession of the 1970s (Wallace and Wallace, 1990). The Griers’ definition covers failure of the landlord to provide basic amenities (maintenance, heat, light), the influence of health and safety hazards and sudden increases in rent which make the property unaffordable to that tenant – but not defaults on rent, breaches of contract or ‘voluntary’ moves. However, Grier and Grier (1978) highlighted that it is often difficult to discern the difference between ‘voluntary’ and ‘involuntary’ migration.
This noted, most early studies of gentrification-induced displacement attempted to enumerate the number of residents forced out of their neighbourhoods. These studies mainly involved gathering data about migrant (mover) characteristics through interviews (Gale, 1980; LeGates and Hartman, 1986). By way of example, Hodge (1981) combined findings from a city-wide survey in Seattle in 1978 (n = 1269) with private (Polk) US census tract data for 1973, 1976 and 1977. Hodge questioned outmigrants retrospectively about their reasons for moving, noting that gathering data from recollection can be prone to inaccuracies given the time lapsed since moving, possibly including post-move rationalisations. Moreover, the number of interviews appeared insufficient for robust statistical analysis when broken down by key variables (tenure, age, income, ethnicity and categories for moving, etc). An additional problem was gauging whether the resultant ‘displacement rate’ for Seattle was high or low as no appropriate comparator area(s) had been identified (see Freeman, 2005; Freeman et al., 2016). Indeed, studies of displacement rates between different cities have often been hampered by variation in definitions of displacement, as well as by differences in city attributes and population size (Hodge, 1981: 193–194).
Subsequently, more attention has been directed towards theorising diverse processes of gentrification-induced displacement, with the work by Marcuse (1986) especially significant in distinguishing between different forms of direct and indirect displacement (including exclusionary displacement), as summarised and updated in Table 1. Marcuse (1986: 156–157) suggested that comparison of available housing units at two time points (before and after gentrification had started) could take account of excluded properties by measuring the pool of available dwellings. However, he argued that allowance needed to be made for variation in the number of dwellings due to ongoing change in the interim period (e.g. through new-build, infill or conversion). A further implication of exclusionary displacement is that poorer households may become ‘trapped’ in their current housing as the pool of options available to them in the local area decreases. Poorer owner-occupier households such as elderly householders may also incur increased costs of residing in areas of rising house prices through tax increases for their more valuable properties (Martin and Beck, 2018).
Displacement after Marcuse.
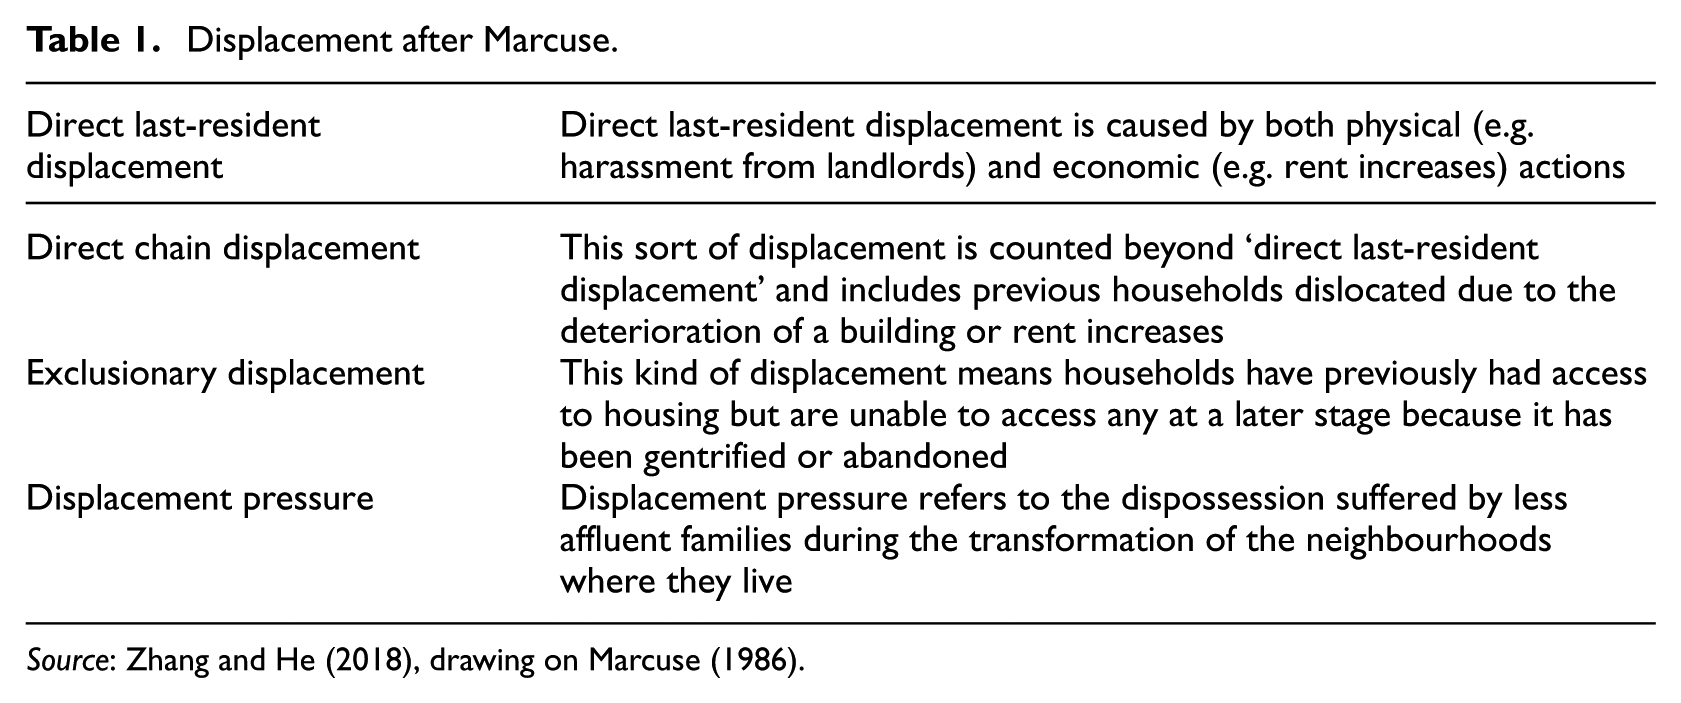
Source: Zhang and He (2018), drawing on Marcuse (1986).
Marcuse’s (1986) work also stressed the importance of measuring displacement pressure – when residents in the neighbourhood are negatively affected by the displacement occurring around them, such as the loss of outmigrating neighbours and friends, local shops changing hands to being run by or for social ‘others’, the downgrading of services, and other environmental changes. Acknowledging such factors takes fuller account of the social and psychological aspects of neighbourhood change by encompassing the perceived loss of local support networks through outmigration, as well as the disappearance of familiar local community services/facilities. Subsequent studies of neighbourhood change, especially those emphasising the impact of changes in the nature of retail and leisure facilities, identify this as a significant spur to gentrification and population displacement. Marcuse (1986) suggested that the measurement of displacement should encompass quantification at multiple spatial scales. He also recognised, however, that it would be extremely difficult for large areas. For example, in order to determine the level of involuntary migration, one must identify which outmigrations were voluntary, something that would mean tracing and interviewing all migrants/displacees, which is of course unlikely to be feasible across a large area.
In this regard, others have similarly highlighted the difficulty of trying to measure a phenomenon that may entail following up households who have disappeared from their former location, and, as noted by Baeten et al. (2017), these households may be averse to participating in official surveys: ‘The precarious housing situations of displaced people, people doubling up with others, etcetera, often exist outside official records, and, when traced, these people are not necessarily willing to “be interviewed” about their troublesome life trajectories’ (Baeten et al., 2017: 635). This serves to illustrate some of the key problems in the measurement of displacement, and the lack of comparable data which continues to plague this research area. Equally, some researchers have proceeded with notions of displacement that appear ill-suited for measuring enforced moves. For example, despite noting that ‘migration is not synonymous with displacement’, Lyons (1996: 43) proceeded to conflate the two, suggesting that wealthier households who choose to move as an economic investment strategy ‘are economically displaced in another sense because they cannot improve their circumstances within the neighbourhood’. This turns on its head the fundamental point that displacement is involuntary – a process which behoves households to move/migrate for reasons outwith their control (see Atkinson, 2000; Grier and Grier, 1978; Hartman, 1980; Marcuse, 1986). Here, it is important to stress that most migration involving ‘better-off households making housing and investment choices’ (Lyons, 1996: 44) is not displacement but outmigration motivated by financial gain.
Many authors have then sought to measure evidence of displacement by researching population and neighbourhood change. Here, differences in the demographic and socio-economic characteristics of inmigrants and outmigrants in a particular area are examined to identify instances where one (usually lower/poorer) sub-group has been supplanted by another, often younger and more advantaged tranche of the population (via a process of succession) (Van Criekingen, 2009). There are major problems here, given that a causal connection is not established – the inmigration (of younger, more educated, childless singles and/or couples) may not have caused out-migration, or displacement (of older people, poorer households and/or families). It is, for example, possible that older people are choosing to leave the inner city to move to a retirement community, and an influx of twenty- and thirty-somethings are succeeding them. Indeed, Hamnett (2003) has argued that it is population replacement rather than displacement which has occurred in London as a result of the post-industrial restructuring of employment, the economy and the housing market – a distinction that has remained extremely difficult to prove within the confines of the available data. 4 A further issue is that in the absence of longitudinal data on individual income, it is not possible to say if reductions in the numbers of the poorest are because of their outmigration or the fact they may have benefited from the general socio-economic uplift of an area (Atkinson, 2000; Ellen and O’Regan, 2011).
In contrast to studies of direct displacement, Liu et al. (2017) note that studies of indirect displacement are rare. An exception is the San Francisco City and Council Board on Displacement in the Mission District, which provides evidence of exclusionary displacement (Brousseau, 2015). The City of San Francisco has been subject to numerous waves of gentrification, from the growth of ‘gaybourhoods’ in the 1970s through to the ‘Tech Booms’ of the 1990s and contemporary gentrifications linked to an explosion of internet start-ups and relocations from Silicon Valley (Opillard, 2015). Brousseau (2015) analysed US decennial Census and American Community Survey (five-year pooled) data, estimating that the significant change in the proportion of high-income households in the Mission District in 2000–2013 was associated with a 48% increase in owner-occupation (38% more than the citywide figure) and inflated rents due to high demand/low supply, which fuelled a disparity in rent-to-income ratios favouring the top fifth of earners. It was estimated that the median citywide market rent applicable in the Mission District would be unaffordable to 81% of households in the district based on local income data (i.e. housing costs of more than 30% of the household’s income). Subtracting new-build properties, 5% of housing stock was estimated to have changed tenure from rental to owner-occupied by 2013, decreasing the pool of dwellings available to renters. Although no causal link could be established to direct displacement, a significant reduction of the Latino population (–27%) and family households with children (–26%) occurred in the Mission District during the same period, and a 28% increase in households comprising unrelated (non-Latino) individuals (the Latino population had previously comprised 60% of the Mission District in 2000, and rose by 13% across the whole of San Francisco City during this period). Although data from the American Community Survey at smaller scales (e.g. the individual census tract) is severely limited due to the nature of the survey, this suggests it can be used to estimate levels of exclusionary displacement through measures of tenurial change and affordability (see also DeVerteuil and Manley, 2017, on the exclusionary displacement caused by the super-rich in inner London).
Millard-Ball’s (2002)‘whole-market’ approach proceeds from a slightly different spatial perspective, with the impact of aggregate migration flows of displacees to destination areas also taken into account. This stresses that a sudden increase in housing demand in neighbouring low-income areas may drive rent rises, which will have the knock-on effect of displacing the poorest from those areas through both direct economic and exclusionary displacement. This type of ‘chain effect’ is described by Liu et al. (2017) following the ‘price-shadowing’ of redevelopment schemes in Shenzhen, China. Here, the construction of new, large-scale (high-rise) gated community projects on ‘village-in-the-city’ sites has displaced low-income (rural) migrant renters, which has in turn rippled out, creating a property hotspot due to the increased local housing demand from displacees who wish to continue living in the neighbourhood. This has led to increased rents and overcrowding in remaining affordable areas for migrant worker-renters and, once all their resources are exhausted, some have no option but to leave the city. This stresses that direct forms of displacement entwine with indirect forms of displacement such as exclusionary displacement. However, a ‘whole system’ approach to researching the chain effect of displacement is difficult to operationalise (Liu et al., 2017). In part, this is because of the complex choreographies of displacement: Zhang and He (2018: 135) have suggested that ‘gentrification-induced displacement not only links to the very moment when an [involuntary displacement] eviction takes place’, but also relates to the temporalities ‘before, in the midst of, and after the eviction’, providing a particular challenge for the quantification of displacement.
Time, space and displacement
The economic position of households is not static, but subject to change over time (Ellen and O’Regan, 2011; Vigdor, 2002). Poor households may cycle in and out of poverty, and household income may increase with economic upturns, individual age or household stage (e.g. young family, mature, empty nest, etc.). The reverse is also true of course – stage of life and life events such as relationship fractures, illness and unemployment may result in downward social mobility and moves to poorer areas through loss of income (Airey, 2003; Desmond and Gershenson, 2017). However, few studies of displacement incorporate life events or ‘shocks’– such as losing a job, being made redundant, or a relationship split (but see Desmond and Gershenson, 2017).
The concept of ‘duration dependence’ alludes to the relationship between the likelihood (also known as the ‘risk’ or ‘hazard’) of moving out and the duration of residence. Generally, the probability of moving may be affected by the duration of stay up to that point: the longer residents stay in a place, the more cumulative investment and commitment they might have to their neighbourhood (Gordon and Molho, 1995; Thomas et al., 2016). Although this may at first appear to apply to residents who have a choice about moving, such as owner-occupiers, the length of residence in private rented accommodation may also affect a private landlord’s propensity to inflate the rent to unaffordable levels, or to evict in cases where residents have reliable long-standing records of rent payment (Desmond and Gershenson, 2017: 369).
In such cases, the so-called ‘hazard rate’ of outmigration may increase steeply at first, peak early and then decrease over time, producing a hill-shaped distribution (Gordon and Molho, 1995; Thomas et al., 2016). This characteristic of the shape of the underlying hazard function requires the selection of a statistically appropriate model that allows for this specific form of distribution (Pryce and Gibb, 2006). Although Freeman and Braconi (2004) include ‘years in current residence’ as a simple linear variable in their logistic regression model, this fails to allow for the nonlinear relationship between length of residence and time, and may produce misleading results. A survival model based on an appropriate distribution of the hazard function of outmigration would possibly have been more appropriate.
Such issues about timing intersect with ones concerning the lack of data available at different points in time. For example, when Sullivan began to explore the mass eviction of mobile home residents from privately-owned ‘trailer’ parks in the US, she complained that ‘The lack of data makes it impossible to paint a comprehensive picture of … evictions nationwide’ (Denvir, 2015; 5 see also Sullivan, 2017a, 2017b). Sullivan (2017b) managed to use changes in land-use codes from county tax data at three-yearly intervals to identify and map mass evictions related to the closure of mobile home parks built on private land in Houston/Harris County. Using spatial analytical techniques in GIS such as Getis-Ord hotspot and nearest-neighbour analysis, Sullivan detected clusters of mobile home parks around the periphery of urban development in the county. Although she found no association with change-of-use variables such as new-build apartment blocks, mixed-use developments or condominiums that might indicate the direct impact of nearby gentrification, she identified a trend of displacement of trailer parks from the urban core to land beyond the urban periphery where land values are cheaper. This vulnerability through direct exposure to the vagaries of the land market and dispersion from city centres suggests an indirect ‘chain effect’ of displacement, which may require analysis through the framework of a ‘whole housing market approach’ (Millard-Ball, 2002).
Given the nature of gentrification-related displacement, the spatial lens (or scale) through which we view and analyse this phenomenon also determines what we see. The spatial scale used in quantitative studies of displacement 6 varies from the meso (thousands, tens of thousands) through to the macro (cities and countries, hundreds of thousands), but rarely the micro (individuals, tens). In empirical terms, Henig (1980) suggested that studies which measured displacement at the macro city scale, such as those focusing on suburb-to-city migration, risked missing critical variation occurring within cities at the neighbourhood level. Use of much larger districts (e.g. Freeman and Braconi, 2004) potentially excludes important variations at smaller spatial scales (Johnston et al., 2016a, 2016b; Reardon et al., 2008; Wong, 2004). In many cases, it appears important to measure at even higher resolutions – down to block or street level (Hammel and Wyly, 1996; Opillard, 2015). For example, Hedin et al.’s (2012) study of Stockholm was at the scale of 100 m square cells.
Aside from the difficulty of resolving within-zone displacements, there are additional well-known problems with the use of aggregate spatial data and derived statistical models. First, boundaries change over time and this precludes the simple comparison of counts of individuals, households or dwellings within these spatial areas (Openshaw, 1984). The second is that statistical relationships in spatial data vary by geographical scale, that is, according to the size of the spatial unit – the classic Modifiable Areal Unit Problem (Openshaw and Taylor, 1979). A further issue when modelling with spatial data is the fact that phenomena (people, housing stock, income) tend to be more similar the closer they are to one another. This is known as ‘within-area homogeneity’ (Tranmer and Steel, 1998), and it violates the theoretical assumption of the randomness or independence of observations underpinning the many methods of estimating regression models such as ordinary least squares. This violation of randomness is known in statistical terms as autocorrelation. One method of dealing with this is to use multilevel modelling, which takes account of statistical autocorrelation by grouping individual observations (values) at different spatial scales such as block/street, output area/tract, borough, etc. Tranmer and Steel (2001) explored the effect of failing to nest individual residents within hierarchical spatial units using UK census data at the level of individuals within enumeration districts (small areas) within wards (meso level). They demonstrated that if the middle level (ward) was excluded, effects at that level were redistributed to other levels of the model – leading to inaccurate coefficients (results). Freeman (2005) used a discrete-time binary logistic regression to model individual migration into census tracts. Like many authors working on displacement, he does not discuss the theory underpinning the choice of spatial scale at which displacement should be measured, or explore the advantages of using smaller, block-group units (Hammel and Wyly, 1996). Furthermore, although Freeman (2005: 468) uses a ‘person-year’ format, he takes no account of the clustering of individuals within neighbourhoods. In another example, Desmond and Gershenson (2017) use a discrete-time model to analyse the relationships between eviction and a range of individual, social network and neighbourhood factors. However, although time (in months) is clustered within individuals, this does not allow for the social similarity of individuals living in the same small area – i.e. the ‘block-group’ (their proxy for neighbourhood) – within census tracts (the larger unit used to represent the gentrified area). This means that the model does not take account of socio-spatial autocorrelation. Unfortunately, Desmond and Gershenson (2017) give a very limited description of their methodology and do not include the type of model estimation (which is assumed to be logistic regression as they report a pseudo-R2 and binary dependent variable). This is important because the underlying distribution should be matched to the shape of the hazard function for the risk of eviction.
Relatively few studies have employed multilevel modelling to study gentrification-induced displacement. Liu et al. (2017) used it to test the indirect ‘price-shadowing’ effect associated with the urban redevelopment of high-status gated communities in Shenzhen, China. Martin and Beck (2018) likewise used a hierarchical linear model to explore the impact of rising housing costs – such as local property taxes – on the propensity of homeowners to move or be displaced. Their study is a methodological improvement on Freeman’s (2005) in two ways. Firstly, it used a hierarchical (multilevel) model to allow for spatial autocorrelation at different scales by clustering ‘individuals within [US] Census tracts within counties within states’ (Martin and Beck, 2018: 43); and secondly, they model data for renters separately from that for homeowners, which is important because residents in these tenures are likely to have very different patterns of duration of residence and ‘risks’ of displacement over time (Withers, 1997). The close relationship between length of residence and risk of moving means that ‘survival models’ which take into account the pattern of the likelihood of moving might ultimately be more appropriate.
The problems of data availability
Most quantitative studies of gentrification-induced displacement have employed national censuses and/or local survey data – data that come with significant limitations in terms of revealing actual patterns of intra-urban migration and displacement. In some cases, these limitations cannot be easily disconnected from governmental interests, given that gentrification appears to have become an official tool of urban policy (Baeten et al., 2017; Herrera et al., 2007; Lees et al., 2016). As the majority of studies covered in this review have originated from the US and the UK, sources of data from these countries are the focus here, although the issues raised may be generalisable to other national contexts (e.g. see Bernt and Holm, 2009; Posthumus et al., 2012). The key statistical sources of data are briefly outlined below, noting their advantages and disadvantages for measuring displacement.
Census data has been the key source of demographic and housing data in many countries, including the US and UK. Invariably, the utility of such periodic data collection for inferring displacement depends on not only the currency of the data, but also the salience of the questions asked. For example, the omission of data relating to household income, rent or house prices in the UK census has long frustrated attempts to explore housing affordability. Likewise, key data sources such as the US Annual Housing Survey, described by Hodge (1981: 194) as ‘the most comprehensive source of intraurban migration’ at the time, failed to include rent increases and other housing costs (Cousar, 1978). In contrast, the American Community Survey (ACS) – a rolling sample survey – includes questions on rent and monthly mortgage payments, with a high response rate (over 92% in 2015). Irrespective, census products are typically only available in aggregate form at a range of geographies, often built up from small area building blocks such as the UK’s Output Area (OA) of 300 people (ONS, n.d.). Such aggregation presents well-known problems, as noted above.
Similarly, we have stated that when tracing displacement, tracking change over time can be important. This suggests that longitudinal data sources may be of more value than snapshots taken at a given point. The England and Wales Longitudinal Study provides an example, comprising the linked records of a 1% sample of the census population longitudinally. However, the lack of a full migration history for individuals in this dataset is a particular problem for the study of displacement (Atkinson, 2000). An alternative is the British Household Panel Study (BHPS), a longitudinal panel which began with 5050 households in Britain in 1991 (later integrated into the larger Understanding Society panel survey). However, the comparative newness of this dataset, on top of the limitations of longitudinal data where spatial extent is sacrificed for temporal resolution, means it lacks the sample size necessary for robust analysis: findings cannot be verified or tested using ground-truthing within the specific spatio-temporal contexts of gentrification (Hammel and Wyly, 1996). Nonetheless, the BHPS has been used by Freeman et al. (2016) to estimate displacement at a local authority level.
In the US, Freeman (2005) used the Panel Study of Income Dynamics (PSID), a longitudinal panel study of 5000 families which began in 1968. This included an ‘over-sample’ of 1872 poorer families, which have a known higher attrition rate from longitudinal surveys. The collection of housing data did not begin until 1986, and an over-sample from three major groups in the Latino population was added in 1990 but then dropped in 1995 due to a shortage of funding and the complexity of representativeness with regards to the Latino diaspora (McGonagle et al., 2012). Like other national panel studies, the PSID is good for studying life-course issues, but comprises such a small sample (c. 0.01% of the US population) that it does not have the statistical power to provide robust analyses at the small-area level. The American Housing Survey, which began in 1973, is a biennial sample survey of housing units (occupied or vacant) which asks occupants or landlords about the dwelling unit (size, condition etc), and household characteristics such as composition, income and housing costs (US Census Bureau, 2017). The survey is cross-sectional and does not provide data on change over time at the level of a housing unit: therefore it cannot be used to measure rent variation, length of stay, household income change, etc. The limited sample size also precludes analysis at the small-area level such as the census tract, a problem with comparable sources in the UK (e.g. the English Housing Survey, which began later in 1993).
As we move into an era of ‘open government’, there is potential for several national sources of administrative data to become available for research. In the UK, for example, those datasets collated by the Department for Work and Pensions deserve investigation, notably the Work and Pensions Longitudinal Study (WPLS), which comprises data sourced from in-house administrative systems such as Job Centres and Her Majesty’s Revenue and Customs (HMRC). This consists of multiple records per individual, which can potentially be linked to create a longitudinal record of their work, benefits and pension history. Each recorded spell contains a start and end date and the individual’s address. Although these may not always be up-to-date, this data has the distinct advantage that it covers all state benefit claimants, pensioners and people paying taxes. This longitudinal microdata on individuals could potentially provide individual histories of changing income and residential mobility, which could be used to analyse the relationship between benefits or pension status, income and potential economic displacement from homes through, for example, changes in circumstances such as job-loss. Benefit and tax credit data could also potentially be used to give insight into the proportion of income that poorer people in London are paying in housing costs, given that Housing Benefit and other means-tested benefits entail an assessment of the household’s income and outgoings, including rent. Therefore, housing benefit data, readily available at the borough level, can indicate shifts in the numbers of those in housing need, with this data suggesting patterns of movement from inner to outer London amongst those in the private rented sector (Powell, 2015). Were such data available at more granular spatial scales, it would be possible to investigate the relationship between benefit changes such as the ‘bedroom tax’, gentrification and residential displacement.
Given the limitations of national datasets, several studies have attempted to use local surveys instead. For example, Freeman and Braconi (2004) used the New York City Housing Vacancy Survey to measure displacement (noting that New York had implemented some form of rent control or ‘rent stabilisation’ since 1943). This longitudinal survey takes the dwelling as its unit of measurement on a three-yearly basis. Although Freeman and Braconi (2004) state that this measures mobility, the fact that the focus is on individual dwellings rather than households means that it cannot be used to study migration and mobility into and out of the city. Moreover, a three-year period cannot capture more rapid change. Desmond and Gershenson (2017) used the Milwaukee Area Renters Study to research associations between individual, neighbourhood and social network factors and the risk of eviction. This detailed, face-to-face household survey from 2009 to 2011 covered issues such as city living, housing and low-income groups, based on a sample of 1086 households living in the private rented sector, stratified by ethnic group. The response rate was high (over 83%), probably due to the direct contact method of administration. Homeowners were excluded and the data was supplemented with over 100 evictions, from legal cases within the previous two years. A particular strength of this survey for displacement studies is the two-year residential address history taken for each lead householder. These were geocoded and linked to 2010 block groups (a neighbourhood proxy comprising approximately 1135 residents per unit, about a quarter of the size of a US census tract).
Studies from other countries demonstrate the importance of different types of data as yet unavailable in the UK or US. Shin (2009), for example, includes a table detailing the high proportion of absentee landlords compared with (low-income) owner-occupiers in a district of Seoul in 2000, and describes how this imbalance of speculators versus local residents was critical in driving the interests of capital in the redevelopment process. Data in this case was sourced from the local government Housing Bureau in Seoul. Given the recent growth of studies of gentrification outside of the global North, it will be interesting to see what similar data sources are available to help quantify gentrification-induced displacement in other contexts.
Creative, lateral thinking may then play an important role in filling gaps in the data. For example, in the study mentioned earlier mapping the mass displacement of mobile home residents due to the closure of privately-owned trailer parks, Sullivan (2017a) noted that while these mass eviction events could not be traced through the courts (because they were not legally challenged), they were recorded in state administrative data through changes in land-use codes, which could subsequently be mapped using GIS. The use of eviction data from court case records has been a developing trend amongst housing activists, scholar-activists and concerned non-statutory organisations. In San Francisco, for example, the Anti-Eviction Mapping Project is an activist-led project which seeks to document the ongoing displacement of lower income tenants in the San Francisco area. Relevant data on evictions, rent levels, illegal holiday lets (Airbnb) and displacement practices is gathered through a range of largely unofficial sources such as the San Francisco Rent Board, provider organisations of Legal Aid and Services, public websites (e.g. Rent Jungle, 2018), online crowdsourced surveys (see Anti-Eviction Mapping Project, 2018a, 2018b), and oral histories from local residents and evicted tenants (demonstrating the importance of mixed, quantitative and qualitative methods).
In the UK, The London Tenants’ Federation, Lees, Just Space and SNAG (2014) mapped displacement from the now demolished Heygate Estate in London using their in-depth knowledge of, and contacts on, the estate. This work was advanced in the Aylesbury Estate CPO Public Inquiries in 2015 and 2018 when further quantification and mapping were undertaken using displacement data from Notting Hill Housing Association (the developer) and freedom of information requests sent to Southwark Council (see Hubbard and Lees, 2018; Lees and Hubbard, forthcoming). There are now a number of groups mapping displacement from gentrifying council estates across London using data from a variety of sources, including freedom of information requests, borough data, developer data, reports from think tanks and on-the-ground information from council estate residents and activists working with them (e.g. Concrete Action, the London Tenants’ Federation, Architects for Social Housing, etc). 7 Sharing and cross-referencing of this data is key to providing robust quantitative evidence of displacement. Indeed, organisations such as justMap (see http://justplace-londonblogspotcouk/) collect spatial justice crowdsource data online and organise ‘public workshops at community events or festivals to collect intelligence on the city directly from Londoners’.
Conclusion
The question of quantifying displacement has long vexed gentrification researchers, yet it is incredibly important in the fight against gentrification. Gentrification-induced displacement has been recognised since Glass (1964) first identified the displacement of former (working-class) residents as a defining feature of gentrification. Nevertheless, progress in quantifying its extent has been remarkably slow. This is due, in part, to the contested identification of neighbourhoods undergoing gentrification, as well as the more obvious difficulties of tracking displacees using available datasets. In relation to the former, it is evident that gentrification occurs unevenly across time and space (Lees et al., 2008, 2015, 2016), implying that its multi-dimensional complexity is best operationalised using several variables in order to distinguish it from other contemporaneous processes of neighbourhood uplift. However, ground-truthing suggests there are always problems in identifying gentrification-induced displacement at a meso level (such as the scale of individual census tracts), due to the piecemeal nature of gentrification, particularly in its early stages. Such problems are exacerbated by studying sub-neighbourhood change across spatial units that are simply too large. Such debate, however, is specific to classic gentrification that involves incremental changes over time, and ignores the increasing presence of state-led gentrification, which is more often than not at a mega scale and faster speed in both the global North and the global South (see Lees et al., 2015, 2016). Quantifying gentrification-induced displacement in cities of the global South will, no doubt, throw up the same and different issues. Quantifying displacement from slum-gentrification in the global South, for example, is difficult due to a lack of formal or robust data on who lives in informal settlements; and of course this makes it easier for the state to enact slum gentrification and obfuscate the number of displacees (see Doshi, 2015).
Our review also suggests that analysis needs to take a ‘long view’ in order to capture the accumulation of change unfolding within specific neighbourhoods (see Sims, 2016). Studies which only reference two ‘snapshots’ of an area – e.g. at timepoints a decade apart – may fail to adequately depict processes of urban change, unless these coincide with specific phases of urban development such as Tech Boom 2.0 in San Francisco (Brousseau, 2015; Opillard, 2015) or the state-led gentrification of council estates in London (Lees, 2014). Even in these cases, changes at the micro level of blocks and streets appear best ground-truthed by local experts. Given the risk of mis-identifying neighbourhoods as gentrifying, this seems to be an essential part of the analytical process, although novel use of digital data products such as Google Street View offers a less labour-intensive alternative (see, for example, Hwang and Sampson, 2014, and Ilic et al., 2019, on using deep learning computer-based vision techniques). Ultimately, visual proxies like the make and age of cars on a given street may not be the best identifier of gentrification, but the ability to automatically analyse large numbers of images compiled over a number of years seems to offer an efficient means of registering where socio-economic change is occurring.
However, most important of all in a displacement context is access to viable sources of data enabling the tracking of individuals through space and across time. Until such data are collected or made available, the extent of residential gentrification-induced displacement will remain largely unrecorded and invisible. In the meantime, we appear reliant on proxies for actual displacement, such as broad indicators of population churn, changes in owner-occupation or changes in the ethnic and class make-up of particular neighbourhoods. While such measures can be suggestive of involuntary displacement occurring, they are rarely conclusive. Rather than being measures of displacement per se, these are perhaps best thought of as measures of displacement pressure (Marcuse, 1986), or of susceptibility to gentrification-induced migration (Chapple, 2009; Chapple at al., 2017; Zuk and Chapple, 2016).
The failures of ‘official’ statistics to reveal actual flows of displaced people at the urban scale suggests that, for the moment, we must then rely on a mixture of proxy measures, approximations and predictions that reveal tendencies but which cannot be relied upon to distinguish between involuntary displacement, voluntary outmigration or incumbent socio-economic uplift. The alternative is a form of ‘data scavenging’ that collates information from a variety of sources, including those collected via participatory methods or via analysis of social media data (e.g. Gibbons et al., 2018; Shelton et al., 2015; Zhou et al., 2018). These less conventional approaches to collating quantitative data on gentrification-induced displacement are growing in importance in an age of ‘big data’ and participatory GIS (Aubrecht et al., 2011, 2016; Goodchild, 2007). Obviously, there remain challenges here, particularly working with geotagged (point-referenced) information that can be used to reveal the existence of communities at different scales of resolution (Poorthuis, 2018): more important in the context of this discussion is whether changes in the location of someone’s social media activity indicate a change in residential location. Yet given the difficulties, failures and limitations of conventional quantitative studies of gentrification-induced displacement outlined in this article, and the urgency of collating robust evidence about displacement in an era of planetary gentrification, it might be time to move beyond conventional census-based measures. Perhaps, then, big data will provide the evidence we seek. But talking about the advantages of machine- and data-driven modelling over linear analysis, two approaches conceptually related but different in practice, is akin to discussing the advantages of interviews over, say, archival research: they are two tools, and the best one depends on what one’s aims are (see Wasserman, 2012). As Harris et al. (2017: 604–605) note: For the geocomputation community, the potential lies in Big Spatial Data, and the opportunities to harness the increasing number of open data initiatives, new forms of data generated by citizens, the near ubiquitous capture of location, and the near permanent connectivity via web-enabled devices that allow data to be shared and uploaded.
But they warn against allowing the data to do its own talking as empirically and theoretically naïve, and assert that research questions need to be specified in advance. And critically, as the Data Justice Lab (https://datajusticelab.org/) makes clear, we always need to consider questions of social justice in this new world of datafication and to think about how we might best pursue ‘data justice’.
Footnotes
Declaration of conflicting interests
The author(s) declared no potential conflicts of interest with respect to the research, authorship, and/or publication of this article.
Funding
The author(s) disclosed receipt of the following financial support for the research, authorship, and/or publication of this article: This research was funded by ESRC, project: PI: LEES, L., Cols: Hubbard, P. and Tate, N. ESRC 2017-2020. Gentrification, Displacement, and the Impacts of Council Estate Renewal in C21st London [ES/N015053 1].