
Abstract
Housing markets are unlikely to be impervious to the preferences and prejudices associated with urban segregation. For example, two neighbourhoods with very different religious attributes are unlikely to be perceived as close substitutes by homebuyers that have a strong preference for neighbours of a particular religion. This paper offers a new framework for the conception and measurement of social integration, defined in terms of perceived homophily. Homophily is the tendency for links to form between similar nodes in a network and we can think of perceived homophily as the tendency for any pair of neighbourhoods to be considered by the housing market to be close substitutes. Textbook economic theory suggests that we should expect the degree of perceived substitutability to affect cross-price elasticities. These can be measured empirically to reveal discontinuities in the network of perceived substitutability of different housing locations. Applying homophily coefficients to substitutability measures allows us to estimate perceived religious homophily between neighbourhoods. The approach can be applied to any city or region that has geocoded house transactions and socio-demographic data. We illustrate the method using data on Glasgow and find strong evidence of religious homophily. This suggests an underlying lack of social integration/cohesion and implies that the Glaswegian housing market is by no means blind to religion.
Introduction
Homophily is the tendency for ‘birds of a feather to flock together’ (McPherson et al., 2001). In network analysis, it is the extent to which similar nodes have a higher probability of connection than dissimilar ones. Heterophily, on the other hand, is the tendency for links to form between dissimilar nodes; the propensity for opposites to attract. Homeowners, for instance, would be described as heterophilious if they were attracted to cultural diversity, with its potential to stimulate productivity, creativity and innovation (Nijkamp et al., 2015).
Homophily is important because it determines the extent to which society is predisposed towards self-segregation. Homophily may also be of interest because of its role in undermining social mobility; stratifying information flows about employment opportunities and restricting job-search opportunities (Chen and Pryce, 2014; Reingold, 1999: 1907–1908). Unsurprisingly, a sizeable literature has emerged estimating the degree of homophily for specific social traits, particularly race, religion and gender (see Cheadle and Schwadel, 2012; McPherson et al., 2001). Homophily in housing market decisions is likely to exacerbate these inequalities. If households choose to locate near neighbours similar to themselves, personal exposure to people of different social status, ethnicity and religion (Cutler et al., 2008) will be reduced. This will erode the capacity for empathy across groups (Allport, 1954; Hewstone and Hughes, 2015), and further embed homophily and segregation.
Our goal in this paper is to develop an approach to perceived homophily which can be applied in a wide variety of settings and time periods. We begin by reviewing the literature, highlighting the gaps therein that we seek to address. We then describe our conceptual framework; how it leads to a measurable definition of social cohesion. We then introduce measures for quantifying homophily in substitutability networks. We go on to illustrate this approach using data for Glasgow to compare the level of perceived homophily with respect to religion vis-à-vis the physical attributes of neighbourhoods. We conclude with a brief discussion of our findings.
Existing literature
One of the challenges for network analysis is how to distinguish connections that have arisen as a result of active choices from those that are the result of circumstances (McPherson et al., 2001). A child that is the only Muslim pupil in a school, for example, will likely have a high proportion of school friends that are non-Muslim, simply because of lack of alternatives. As the ethnic mix in the school increases, the proportion of friendships with children from other groups may actually decline (Echenique and Fryer, 2007). Social mix is, therefore, a very poor proxy for social integration; the two may actually be negatively related.
Ideally, we want to measure the perceptions that underpin inter-group relations. These reveal how social connection and integration (or disconnection and segregation) would emerge were we able to exclude the distortions imposed by opportunity, history and unintended consequence. At the individual level, ‘perceptions of similarity may be more important than real, objective, similarity’ (McCroskey et al., 2006: 2). We would argue that the same is true at the neighbourhood level.
There is an established questionnaire approach to measuring perceived homophily (following McCroskey et al., 1975), but such methods have considerable drawbacks in terms of geographical and temporal coverage, statistical power and response bias. There is also a large literature on regression-based estimation of house prices drawing on the ‘hedonic’ framework (see Adair et al., 2000; Harris, 1999; and critiques by Malpezzi, 2003 and Pryce, 2013), but there are important shortcomings to this approach from a network perspective. An important difference between true statistical network analysis and techniques such as hedonic regression is the capacity to deal with dependence and connectivity (Goldenberg et al., 2010). The assumption of conditional or unconditional independence, common to almost all types of regression analysis including hedonic estimation, is nonsensical when applied to networks as it is the very dependence between individual locations that we are interested in. To assume independence when modelling relational data of any kind is to ignore the very aspect of the data we want to understand. The idea that price dynamics between dwellings might be connected is not new but tends to be considered in a partial way in the housing literature; e.g. with strict limitations on the nature of connectedness based on spatial contiguity or proximity (Anselin, 1988). If housing is to be truly conceived of as a network, it must be modelled in a way that allows connections to transcend geographical constraints. Perhaps because of the over-reliance on regression methods, there is a dearth of applications in the housing literature that draw on the rich conceptual framework afforded by network analysis and that apply appropriate statistical network methods (Goldenberg et al., 2010).
Although social networks are often alluded to in the neighbourhood effects (van Ham et al., 2011) and employment search literatures (e.g. Chen and Pryce, 2014), actual substantive applications of statistical network analysis methods in this area remain elusive. Analogous to the psychology literature of McCroskey et al., there is a survey-based literature on residential location choice and preference (Clark, 1991; Inlanfeldt and Scafidi, 2002) with similar drawbacks and limitations. The results of Inlanfeldt and Scafidi’s (2002) location preference survey of households, for example, are very specific to the particular time period and to the three US cities where the survey was conducted. We can never know how European, African or Asian cities would compare for the equivalent time period. As with the psychology literature, social science survey approaches typically involve bespoke cross-sectional surveys without a longitudinal element, yielding results that are difficult to replicate, subject to response bias and which say nothing about how perceived homophily varies over time or across cities and nations.
Where our method fits in the literature
Our approach conceptualises the urban housing market as a network. The market is partitioned into areas/subregions, where each location/area is treated as a node; links are formed between nodes on the basis of perceived substitutability. The idea has its origins in the early work of Rapkin et al. (1953) and Grigsby (1963). While not drawing explicitly on network methods or theory, Rapkin and Grigsby defined submarkets in terms of ‘chains’ (i.e. networks) of substitutability (Rapkin et al., 1953: 9–10). Network analysis 1 has been applied to many aspects of natural and social science (see Giuffre, 2013; Jackson, 2008), but as far as we are aware, it has not been applied anywhere to the social and economic forces that connect locations viewed through the Rapkin/Grigsby lens of substitution. Recent work by Pryce (2013) has led to a practical approach for measuring perceived substitutability based on estimating cross price elasticity of price (CPEP) between each pair of locations. This opens up new opportunities for applying statistical network analysis to Grigsby/Rapkin notions of substitutability networks.
In short, we offer a new way of measuring perceived homophily. In addition to our departure from stated preference, we break with the McCroskey tradition in two other important ways. First, our approach is market-based rather than individual-based. So, rather than considering how a single individual perceives others to be different or similar, we seek to understand and measure how the local housing market collectively perceives similarity and difference. Second, our interest is in the perceived similarity of neighbourhoods or regions, rather than individuals – i.e. we are interested in the extent to which the market perceives areas to be substitutable (Pryce, 2013). This gives us a more flexible approach, one that has the potential to be applied to almost any city or region for any time period, past or present, for which adequate geocoded house transactions and socio-demographic data are available. Given the rapidly growing availability, scope and quality of such data, our approach opens up the tantalising prospect of quantifying variations in perceived homophily across many different cities, regions and countries, and of investigating how perceived homophily has changed over time.
Our method could be important for advancing the literatures on social segregation, integration (Forrest and Kearns, 2001; Massey and Denton, 1988; Pahl, 1991) and neighbourhood effects (Galster, 2007; van Ham et al., 2011). Given the problems of using social mix as a measure of social integration (Echenique and Fryer, 2007), our measure of perceived homophily could advance social cohesion measurement in these literatures and thereby open new avenues of neighbourhood effects research. While individuals might be reluctant to disclose their true preferences in surveys, our approach takes advantage of the fact that their preferences will be revealed in their choice of location, and that these choices influence market dynamics and the shape of housing submarkets (Pryce, 2013). This could potentially lead to more meaningful and rigorous studies of the impact of social incohesion on wellbeing and life-course. We now explain in more detail the conceptual framework that underpins these ideas.
Conceptual framework
If we say of two locations, i and j, that they are perceived to be substitutable, it suggests that market actors consider them to be somehow equivalent or exchangeable. The extent to which distinctions such as differences in religious mix actually matter to house buyers and sellers will affect the extent to which locations are not considered socially equivalent, and therefore not substitutable in the location choice decision. Conversely, if two locations are considered to be socially equivalent irrespective of whether or not they are surrounded by a different mix of religious affiliation, then we can conclude that religion does not affect perceived homophily. In network terminology, if there is perceived social equivalence despite religious variation, then there would be no homophily with respect to religion because nodes with similar religious mix would not have a higher probability of being connected (i.e. perceived as substitutes) than dissimilar ones. Note that linkage/connection here is defined in terms of perceived substitutability.
Although the market for owner-occupied housing is not the only context in which perceived substitutability could be used to measure homophily, housing has at least three key features that make it particularly apposite. First, dwellings tend to be spatially fixed. If you do not like your neighbours, you cannot easily move your house somewhere else. Second, amenities, transport and access to employment also tend to have fixed locations. Even if you could move your home somewhere else, it would affect your access to these other spatial features of the urban landscape. Third, house purchase typically entails making one of the largest financial commitments of your life; there are substantial financial and personal costs of relocation, so the stakes are high.
As a result of these three features, one is more likely to reveal one’s true preferences when making decisions about residential location than in more trivial decisions (or, indeed, in response to questionnaires) where the cost of suppressing or denying one’s true preferences are minimal. Someone averse to persons from a particular social group or worldview might be happy to exchange telephone conversations or buy coffee from them, but might be more cautious about purchasing a home and raising their children in their neighbourhood.
To conceptualise the substitutability of housing as a network, we first need to define more precisely what we mean when we say locations i and j are perceived to be close substitutes. We can assume that for any pair of physically comparable dwellings within these two locations there will be a distribution of perceptions across potential buyers about the substitutability of the dwellings, ranging from those that see the dwellings as having low substitutability to those that see them as being highly substitutable. For the sake of simplicity (and computational feasibility), we say a pair of locations are close substitutes if the expected (average) perceived substitutability for physically comparable dwellings is above a certain threshold.
Drawing on Pryce (2013), we define this distribution more formally below leading to a specific definition of substitutes in terms of measurable cross price elasticities and a well-defined basis for thinking of housing submarkets as a network consisting of nodes and edges.
Defining the distribution of perceived substitutability
Let
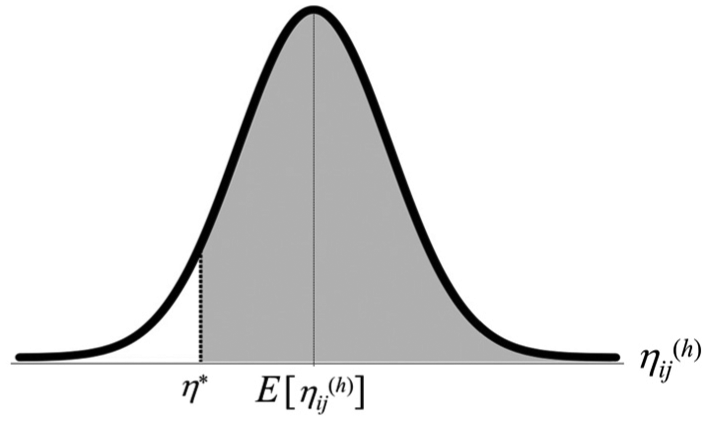
Distribution of household perceived substitutability of a given pair of locations i and j.
If ηij(h) has a symmetric distribution across households, the mean of ηij(h) will equal the median ηij(h), and so equation (1) can be re-stated in terms of the expected (i.e. average) perceived-substitutability being greater than threshold η*:

The stylised distribution in Figure 1, therefore, illustrates the case where locations i and j are indeed perceived to be close substitutes. For any given house transaction in location i, the set of bidders
Revealed perceptions of substitutability
Now assume that the average perceived substitutability will be reflected in CPEDij, the cross price elasticity of demand between i and j. Following Pryce (2013), assume further that if demand and supply curves are well behaved (i.e. slope downwards and upwards, respectively), the cross price elasticity of price (CPEPij) will have a strictly positive, one-to-one, relationship with the cross price elasticity of demand, and hence with perceived substitutability. The intuition behind using CPEPij as a proxy for CPEDij is that a rise in the price of location i will cause an increase in the demand for close substitute j, which in turn will lead to a rise in price of j. So, if i and j are close substitutes, their prices should move in tandem, reflected in a relatively large value of CPEPij.
Networks
We can think of perceived substitutability as a network of relations consisting of nodes (locations) and edges (links). We denote this network as (
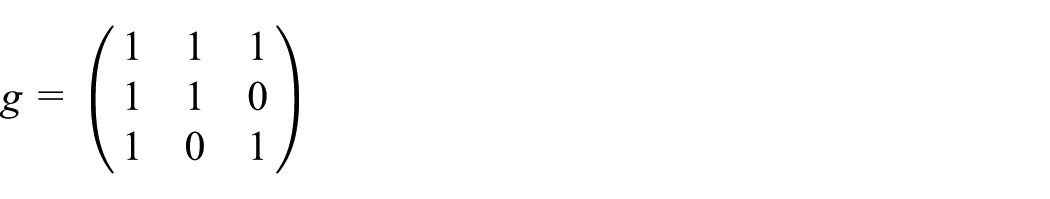
We assume that the substitutability network is undirected; if i is a close substitute for j, then j will be a close substitute for i. Therefore, gij = gji for all i and j, and so the adjacency matrix g will be symmetric. To illustrate, consider a city with three locations: 1, 2 and 3. Thus,
Research on housing market structures (e.g. residential submarkets) is typically monadic, based on analysing the nature of individual nodes, typically using hedonic regression where the price of location i is regressed on the attributes of i. In contrast, the conceptual and empirical framework developed here is fundamentally dyadic– based on analysing the relationship between pairs of nodes.
The density of a network is defined to be the proportion of edges observed relative to the number of possible edges for a given number of nodes. This is an overall indicator of the connectedness of the housing market. If all locations are close substitutes, then all locations will be connected, so every node will form an edge with every other node. If, on the other hand, every location is considered to be a poor substitute for every other location, there will be no edges between nodes. Higher values of density for a network suggest greater overall connectivity.
Homophily, social integration and cohesion
In seeking to understand neighbourhood substitutability, we are interested in identifying which features of dwellings and neighbourhoods are most relevant in evoking perceived homophily between pairs of locations. In particular, we would like to know how strong perceived religious homophily is relative to other types of homophily. Other types of homophily include the effect of similarity of physical neighbourhood attributes, such as dwelling types or access to transport, on the perceived substitutability of neighbourhoods. For example, if religious homophily is more pronounced (relative to structural/physical homophily) in one city than another then this may imply that the more socially homophilous the network, the less socially integrated it is, where religious integration is defined as the extent to which residents from a variety of groups are viewed and treated the same in residential location decisions. If different religious groups are viewed and treated the same, then household location decisions will be blind to differences in the religious make-up of neighbourhoods. This will manifest itself in there being no perceivable difference in house price dynamics between neighbourhoods with contrasting religious mix.
A corollary of this approach to integration is that a pair of nodes will be religiously integrated if they are considered by the market to be perfect substitutes, even if the religious mix in those neighbourhoods is very different. The housing market essentially perceives residents to be similar even if they are from different religious groups. Conversely, a pair of nodes in neighbourhoods of contrasting religious mix are said not to be religiously integrated if they are not considered by the market to be close substitutes. This is a corollary of the housing market not viewing and treating residents the same when they are from different religious groups.
Measuring homophily
How one measures homophily depends on whether the characteristic of interest is quantitative or qualitative. The degree of homophily with respect to qualitative attributes such as religious affiliation can be measured by comparing the proportion of connections between nodes that share the attribute of interest with the proportion of connections that might occur by chance (Newman, 2010: 222–226). A different approach is needed, however, if one is using variables that are measured along a continuum, such as income, or if the qualitative characteristic is measured as a proportion for an aggregate group or aerial unit (as is the case in our data, e.g. we are interested in whether the proportions of Catholics within the two areas affects perceived substitutability of any pair of locations). Such attributes allow us to examine not only links between identical nodes but also similar ones. For example, two neighbourhoods may not have identical proportions of a particular religion or race, but may have much more similar proportions of that attribute than other pairs of neighbourhoods. We would like to take this into account when estimating the degree of homophily.
While a variety of measures of homophily and heterophily have been proposed for quantitative variables (see review by Watts, 2004), the ‘simplest and most flexible’ (Watts, 2004: 259) is Newman’s (2002) homophily (or ‘assortativity’) coefficient, r, which is based on the normalised covariance of edges that varies between −1 and 1. A positive value occurs when the network displays homophily with respect to the attribute of interest. In the context of our perceived substitutability approach to homophily, a positive value of the Newman homophily coefficient would indicate that nodes with similar levels of a particular attribute will tend to be perceived as close substitutes, suggestive of homophily with respect to that attribute. If, on the other hand, opposites attract, i.e. nodes with contrasting levels of a characteristic tend to be connected, then the Newman homophily coefficient will be negative, indicating heterophily with respect to that attitude. We are particularly interested in using the Newman homophily coefficient as a way of gauging whether the housing market is essentially blind to religion. That is, we want to know whether the perceived substitutability of neighbourhoods is impervious to differences in religious mix, leading to a homophily coefficient of zero.
Our approach is not without limitations, however. While similar perceived homophily measures could in principle be computed for private rental data (based on cross rent elasticities), where there are few market transactions because of high levels of public housing or a market slump, it might be difficult to compute reliable cross price or rent elasticities resulting from sample size problems. As such, our approach should be seen as complementary: CPEP analysis potentially enables researchers to measure perceived homophily in multiple cities and time periods where transactions data are readily available; a traditional questionnaire approach, on the other hand, can provide detailed insights for specific locations and time periods even when house price and private rental data are not available.
Empirical illustration
To illustrate how the conceptual framework described above could be applied empirically, we use the CPEP estimates generated by Pryce (2013) to construct a network based on perceived substitutability in the Glasgow housing market. Estimates of CPEP are based on 33,680 geocoded GSPC (Glasgow Solicitors Property Centre) residential property transactions for the period 1999 to 2007. Time series of quarterly house price inflation were computed for around 10,000 postcode locations using the procedure outlined in Pryce (2013). A flexible third-order Taylor Series approximation of the house price surface was estimated separately for each year (see Clapp and Wang, 2006; and Fik et al., 2003) with adjusted R2 results 2 all above 0.57. This model was used to estimate the value of each property in every quarter, with the location of the dwelling assumed to be at the centre of the postcode (the highest resolution of geocoding available in the data). We were then able to compile a time series of values for each of the 10,000 postcode centroids in the data, from which we computed the proportional price change for every location. The cross price elasticity between location i and location j, CPEPij, was estimated by regressing the log price change of each location i against the log price change of location j. Finally, we computed RCPEP, a transformation of CPEP that yields an undirected measure, i.e. one that gives the same result regardless of the ordering of locations in each pair, ensuring that RCPEPij = RCPEPji for all i and j. The transformation of CPEP into RCPEP is summarised below:
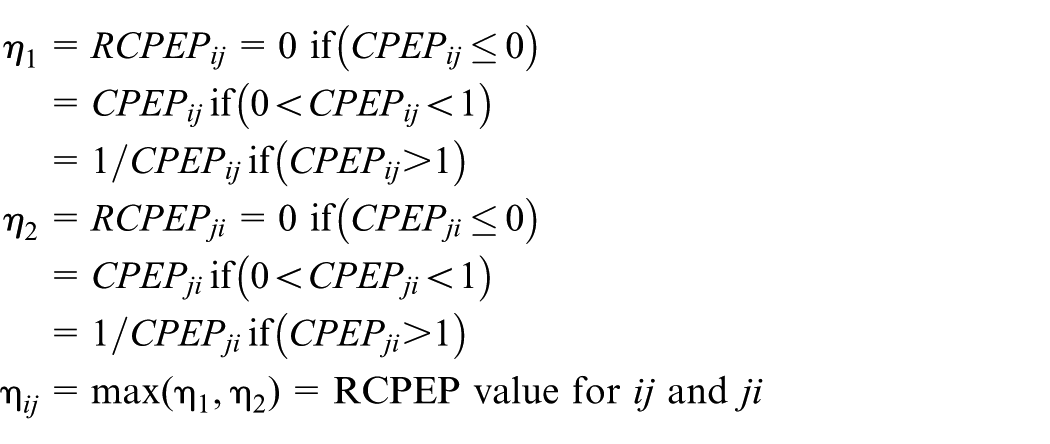
Dyads (pairs of locations) were given an adjacency matrix value of 1 to indicate an edge if, and only if, RCPEPij≥ 0.9. Having constructed the adjacency matrix, we merged datazone data from Scottish Neighbourhood Statistics, Experian and ONS to ascribe neighbourhood physical and social attributes to each node. Descriptive statistics for each of these variables are listed in the first two columns of Table 1.
Descriptive statistics on satazone attributes.
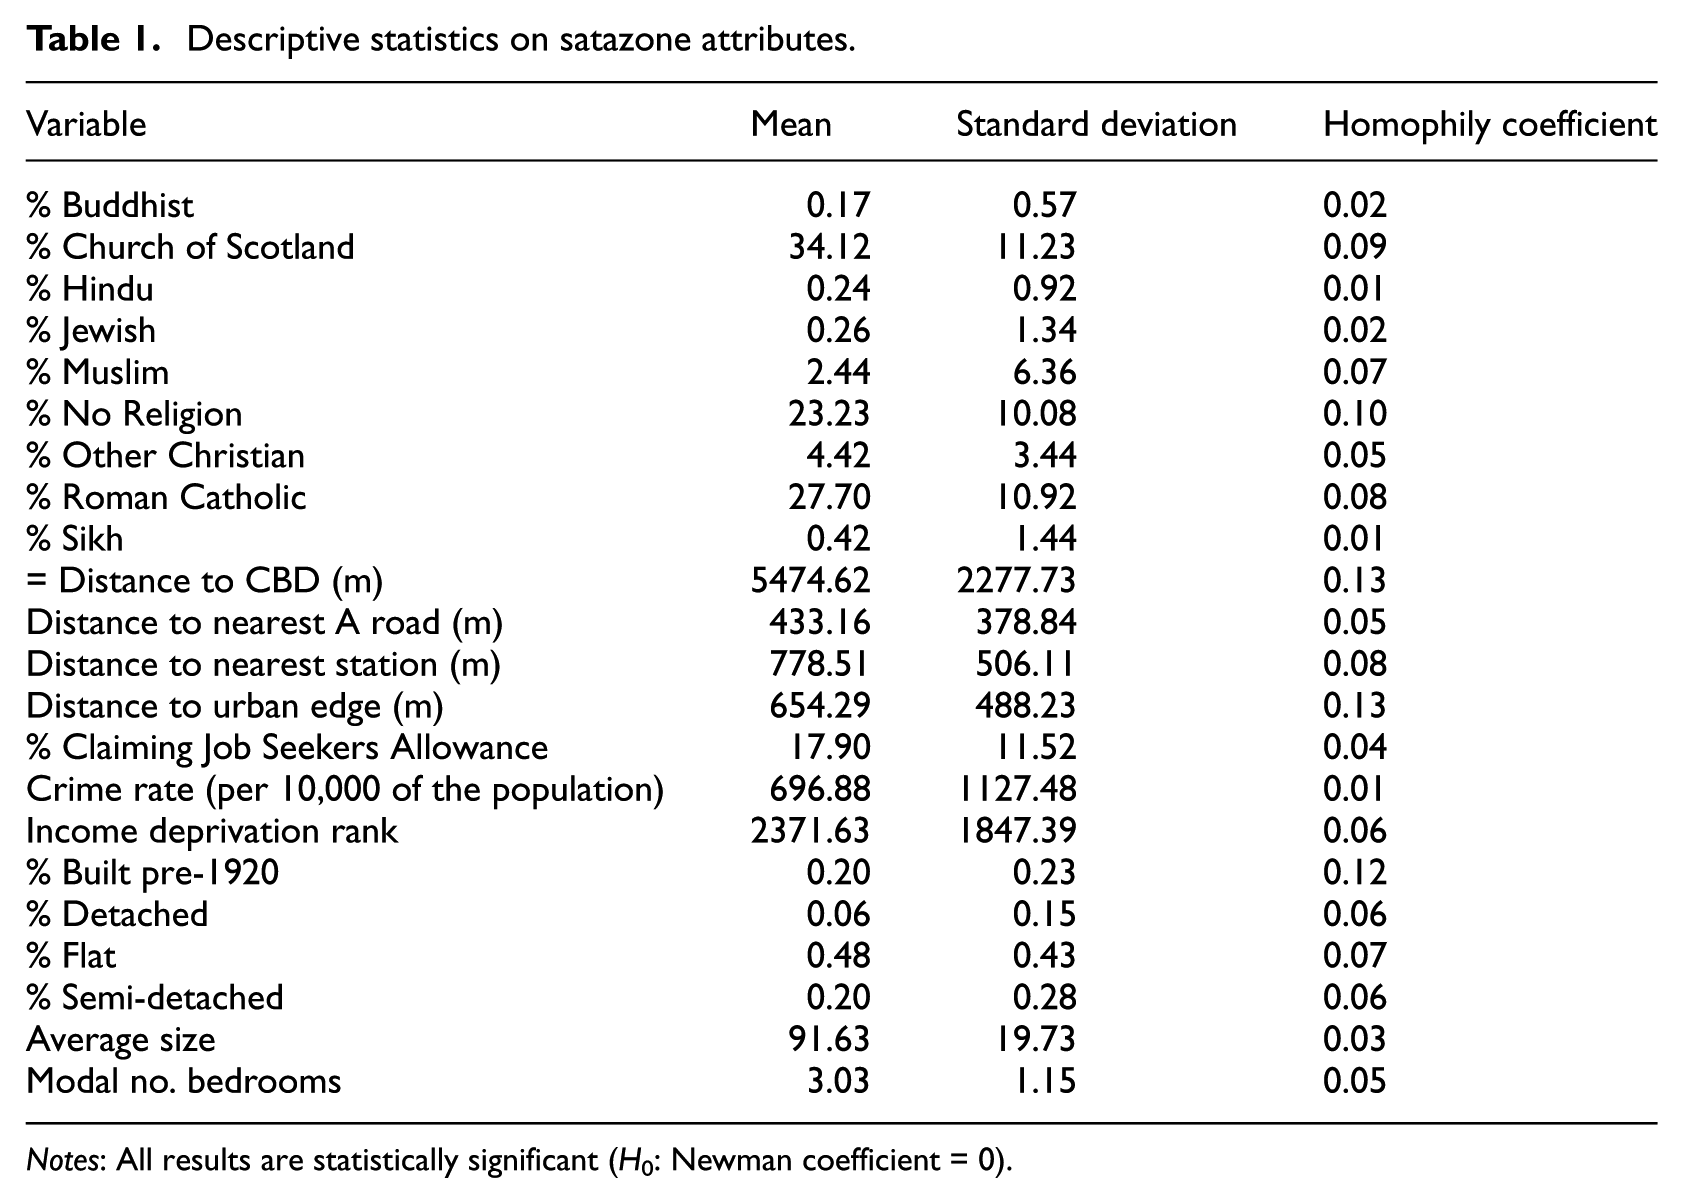
Notes: All results are statistically significant (H0: Newman coefficient = 0).
Results
Density
This is computed as the proportion of edges observed relative to the number of possible edges for a given number of nodes. This is an overall indicator of the connectedness of the housing market. If all locations are close substitutes, then all locations will be connected, so every node will form an edge with every other node. If, on the other hand, every location is considered to be a poor substitute for every other location, there will be no edges between nodes. Network density was computed as 0.113. In other words, of all possible edges that could exist between our 10,000 nodes, just over 11% were observed when a cut point of CPEP = 0.9 was imposed to define ij as close substitutes. This suggests that the Glasgow housing market is a highly connected network. The density measure is likely to be particularly useful when used to compare different cities and regions and could be of interest to real estate analysts seeking a summary measure that captures the degree of market integration.
Homophily, mix and integration
Newman homophily coefficients are listed in the final column of Table 1. All of these are highly statistically significant, rejecting the null hypotheses of zero homophily. Moreover, the homophily coefficients for particular religions (e.g. those for No Religion, Church of Scotland and Roman Catholic) are of a similar order of magnitude to those computed for house type, location, income and crime homophily coefficients.
Note that these results are essentially marginal or univariate – each estimate does not hold constant the effects of the other sources of homophily. Nevertheless, the results are at least suggestive that housing markets are not blind to race and religion. Homophily with respect to Catholic or Church of Scotland or Muslim households in a neighbourhood appears to be at least as important a determinent of perceived substitutability as similarity of house type (detached, semi-detached, flats), dwelling size, distance to transport nodes, crime rates, income deprivation or unemployment. In other words, there is clear evidence that the housing market in Glasgow is not blind to religion; there is a lack of social integration with respect to religion.
Conclusion
Social mix is not the same as social integration. It is possible for neighbourhoods to have contrasting proportions of religious groups and yet for relations between the groups to be cohesive in the sense that they view and treat each other as equals, particularly when making relocation decisions. Conversely, areas can have a high degree of mix but low levels of social integration. But how can we distinguish between mix and integration empirically? Measuring mix is relatively straightforward; we can easily measure the proportions of particular religious and social groups in each neighbourhood. But measuring social integration is more difficult; it requires us to consider more elusive concepts, such as perceived homophily.
The main contribution of this paper is to provide a method for measuring perceived homophily based on empirical estimates of perceived substitutability. We have suggested that this can be interpreted as a measure of social integration with respect to a specific social dimension, such as religion. Markets are essentially a social construct and so it is likely that social prejudices and preferences will be reflected in our perceptions of substitutability. The focus of this paper has been on the interconnections between locations that arise when people perceive two neighbourhoods to offer similar bundles of housing service and social amenity. The extent to which the strength of perceived connection is diminished by differences in the religious make-up of neighbourhoods potentially reveals the extent to which participants in the housing market consider such social differences to be important. Hence, we arrive at a practical way of distinguishing between ‘social mix’ and ‘social integration’.
We define social integration as the extent to which residents from a variety of groups are viewed and treated the same in housing market location decisions. The extent to which we observe homophily with respect to a particular social attribute such as religion is a guide to the extent to which we observe a lack of social integration with respect to that attribute. Homophily and social integration are inversely related in this definition. Both are attribute-specific. Thus, a positive homophily coefficient for a particular social attribute would indicate a lack of integration; the housing market is not oblivious to differences in that social attribute across neighbourhoods. This provides a litmus test for whether social integration has been achieved in a socially heterogeneous urban system, based on whether socially contrasting neighbourhoods are considered by the market to be close substitutes. While we cannot observe household preferences directly, we can observe which pairs of neighbourhoods are considered to be close substitutes by comparing cross price elasticities. Homophily with respect to a particular attribute such as religion occurs when dissimilarity of that attribute between a pair of neighbourhoods leads to the neighbourhoods being perceived as poor substitutes. This would be evident in the low cross price elasticity between the two neighbourhoods.
We have presented illustrative results using Glasgow data. If the housing market were blind to religion, then religion would have no role to play in determining the perceived substitutability of neighbourhoods, and there would be no evidence of religious homophily. In other words, cross price elasticities would be impervious to differences in religious mix, and the homophily coefficient would be zero.
In the event, we found a statistically significant positive homophily coefficient, indicating a relatively strong degree of perceived religious homophily in the Glasgow housing market with respect to most religious groups. As a guide to the scale of the effect, we compared the religious homophily coefficients with non-social ones. We found that many of the religious homophily coefficients were at least as large as those for physical attributes of neighbourhoods.
The strong evidence of homophily with respect to religion and other social variables suggests that the housing market in Glasgow is not, in fact, oblivious to such factors. In contrast to the regression-based methods which dominate the existing literature, we estimated these effects using statistical network analysis methods and so our approach was not encumbered by having to assume independence of price movements between any of the neighbourhoods considered.
A promising and important avenue for future research would be to explore the use of the substitutability-based perceived homophily measures developed here as an indicator of changes to social cohesion over time and across cities and regions. The stronger the homophily with respect to religion and other social variables, the greater the potential for social division. Being able to monitor how social cohesion varies and evolves, how it relates to social mix, and how it impacts on social indicators such as crime and wellbeing, is potentially a valuable input into the process of policy making.
Being able to distinguish between mix and integration could also open up new avenues in the research on ‘neighbourhood effects’. For example, to what extent does neighbourhood integration (as opposed to neighbourhood mix) affect educational performance, social mobility, psychological wellbeing and long-term health outcomes? If we were able to measure integration, at least as perceived by the housing market, then we might be able to investigate this question empirically in a more rigorous way. For example, the Moving to Opportunities programme in the USA offered low-income households the opportunity to locate in affluent neighbourhoods. Whether and how that relocation improved their life outcomes might critically depend on the degree of perceived homophily with respect to their religious or social characteristics in their original location, and also in the destination neighbourhood. Being able to measure these perceptions would enable us to estimate whether poor households relocated in areas with low levels of perceived religious homophily did better than those relocated near residents with a more homophilous outlook.
Footnotes
Acknowledgements
The authors gratefully acknowledge the helpful comments made by unnamed referees. We are also grateful for the access to data provided by Glasgow Solicitors Property Centre (GSPC). Neighbourhood data were accessed from the Scottish Neighbourhood Statistics website.
Funding
This work was funded by the Economic and Social Research Council (ESRC) through the Applied Quantitative Methods Network: Phase II, grant number ES/K006460/1.