
Abstract
This paper explores the changing geography of ethnic inequality in England and Wales drawing on data from the 2001 and 2011 censuses. Specifically, we use the 2011 Office for National Statistics (ONS) area classification to examine how ethnic inequalities within local areas with different demographic and socio-economic characteristics have changed over time. Local ethnic inequalities are examined through a set of indicators which capture differences in housing, health, employment and education between ethnic minority groups and the White British in local authority districts in England and Wales. The results suggest that ethnic inequalities are widespread and persistent, and highlight the different ways in which inequalities manifest for particular ethnic groups in different localities. Ethnic inequality in housing and employment is severe for most ethnic minority groups, particularly in large urban areas that have been traditional settlement areas for ethnic minorities. However, inequalities increased most over the decade 2001–2011 in rural and coastal areas that have low ethnic diversity levels and small ethnic minority populations. The paper considers these findings in relation to theories of service provision and racism, ethnic density, and immigrant adaptation.
Introduction: Spatial and ethnic inequalities
In recent years there has been considerable empirical and theoretical interest in the geographies of inequalities, with many documenting widening social as well as spatial inequalities (Dorling, 2015) and attention broadening from socio-economic measures to other concerns including quality of life (Higgins et al., 2014). Widening spatial inequalities are seen to be problematic because they indicate peripheralisation and marginalisation of certain populations and places (Kühn, 2015). A large number of theories have been proposed to explain spatial inequalities, particularly the spatiality of income inequality, of which Wei (2015) provides a comprehensive review. This flourishing scholarship is focused on the unevenness of characteristics of places or populations, the inequality between places.
Van Kempen and Marcuse (1997) explain the increase of socio-spatial inequalities in relation to four major processes: the changing nature of economic activities; migration driven demographic change; xenophobia and racism; and the changing role of the state in the provision of welfare services. The spatial manifestation of these processes will vary depending on the particular historical, political and socio-economic characteristics of places. Segregation is ‘the projection of social structure onto space’ connected to general societal exclusion mechanisms (Cassiers and Kesteloot, 2012: 1912). One of its dimensions relates to the spatial separateness of ethnic groups which has been associated with the persistence of socio-economic inequalities between ethnic minority and majority groups (Massey, 2001).
In this paper we frame the question of spatial inequality in a different way, to ask how within-place differences between groups are spatially distributed across the country. Our focus is on the employment, education, housing and health experiences of ethnic minorities compared with their White British counterparts and how they vary in different socio-economic contexts. Examining the spatial variation of ethnic minority outcomes and how this has changed over time can deepen understanding about processes underlying spatial and ethnic inequalities.
How ethnic inequalities are patterned subnationally is an interesting question for several reasons: ethnic groups are not evenly distributed spatially; socio-economic spatial inequalities in England and Wales are marked, from the broad North–South divide that has long been the concern of scholars and government to local socio-economic variations that have been the subject of a number of area-based policy interventions; and, an understanding of how inequalities manifest spatially will be important for the success of initiatives to address them, both in terms of the nature of the initiatives and their geographical targeting. The latter point is relevant in the current UK political context where the government has pledged commitment to tackling both inequalities and racism (Cameron, 2015).
The inequality experienced by ethnic minorities in the UK has been well documented over the past 50 years (Bhat et al., 1988; Collins, 1957; Jivraj and Simpson, 2015; Modood et al., 1997; Rex, 1973; Simpson et al., 2006). Ethnic minorities have been shown to face a disadvantage in the labour market particularly in terms of a higher risk of unemployment than the White British (Heath and Cheung, 2006; Nazroo and Kapadia, 2013). Furthermore, ethnic inequalities have been shown to persist despite many ethnic minority groups having lived in Britain for several generations. For example, studies have shown that the ‘net disadvantage of ethnic minorities in the labour market has become greater for men born in the UK’ (Simpson et al., 2006: 2). Poor health has also persisted for ethnic minorities born in the UK (Becares, 2015; Nazroo, 2005), and minorities continue to be overrepresented in deprived neighbourhoods (Jivraj and Khan, 2015). Overcrowding and poor housing conditions also persist, particularly among Pakistani and Bangladeshi households and recent migrant groups (Lakey, 1997; Robinson and Reeve, 2006; Spencer et al., 2007).
In terms of education, a picture of disadvantage for Asian and Black pupils GCSE attainment was evident in the 1990s and early 2000s (Gillborn and Mirza, 2000; Strand, 2007). In recent years ethnic minorities have experienced large improvements in educational attainment, with younger members of ethnic minority groups, including Pakistani and Bangladeshi, being considerably more qualified than their older counterparts (Lymperopoulou and Parameshwaran, 2015). Nevertheless, all evidence points to marked and persistent ethnic inequalities in the UK in a number of spheres (Jivraj and Simpson, 2015).
Relatively little attention has been paid to the geographies of ethnic inequalities in the UK. Simpson et al. (2009) examined the spatial distribution of jobs deficits for minorities in districts of England and Wales. They found a ‘neighbourhood ethnic penalty’: the local variation in unemployment was not explained by the characteristics of individuals but also had to do with local conditions. The idea of neighbourhood effects in explaining the differential outcomes of minority ethnic groups has been explored by others such as Wang and Lysenko (2014) who found neighbourhood factors to influence minority underemployment in the USA, and Feng et al. (2015), who found that neighbourhood deprivation accounted for some (though not all) ethnic minority disadvantage in the labour market in the UK.
The connection between spatial variation (depicted in this paper using an area typology) and (ethnic) inequality (within areas) has been undertheorised. It has been suggested that there are compositional, contextual and collective explanations for geographical variations of inequalities, relating to the composition and characteristics of populations in particular places, opportunity structures in the physical and social environment and sociocultural and historical features of communities across different localities (Macintyre, 1997). In addition, explanations about ethnic inequalities and their spatial manifestations relate to wider processes of segregation and integration of ethnic minorities.
Three sets of theories can be usefully drawn on to help explain the spatial variation of ethnic inequalities and why ethnic minorities might fare better in relation to the White British in some parts of the country compared with others. First is the idea that minorities have poorer access to, or experience of, services than White British people in particular places. For example, racism in schools and the educational system has been shown to play a part in explaining educational disadvantage and some schools have been less successful than others at implementing the duties placed on them in the Race Relations (Amendment) Act 2000 (Gillborn, 1990; Parsons et al., 2004). Ethnic inequalities in housing have been related to historical place-based discrimination and hostility towards ethnic minority groups which forced Black and Asian migrants ‘into poor private rental accommodation and the worst of owner-occupied housing in the declining inner cities’ (Phillips, 1998: 1682).
The second set of theories about why ethnic inequalities might vary spatially relate to ideas of ethnic density. Residential proximity to co-ethnics might act in two ways which can broadly be aligned with ‘contact’ and ‘conflict’ hypotheses. In the former, ethnic concentrations can provide intragroup solidarity that can increase group social capital and mitigate disadvantage (Becares et al., 2009). Conversely, concentrations of ethnic minorities might increase prejudice and discrimination from other groups (Quillian, 2014).
The third set of theories concern immigrant integration. It is widely understood that integration (or adaptation, or acculturation), socially and spatially, proceeds over a period of time (Alba et al., 1999). Newly arrived migrants commonly experience a period of adaptation to new systems of education, employment, health and housing. Increases in length of residence and migrant generation can be expected to be associated with reduced disadvantage. Neighbourhoods with a high proportion of recent immigrants from an ethnic group may thus have higher levels of disadvantage than other areas.
This paper aims to present a comprehensive account of patterns of ethnic inequalities in education, employment, health and housing within and across districts of England and Wales at the beginning of the 21st century. In evidencing the nature and persistence of ethnic inequalities over the inter-censal decade 2001–2011 and thereby extending the limited set of studies on geographies of ethnic inequalities, this paper enables critical reflection on processes of differential access to service provision and racism, ethnic density and immigrant integration. This in turn raises new research questions concerned with understanding contemporary inequalities.
Data and methods
This paper uses census data for local authorities in England and Wales for 2001 and 2011 to develop a set of ethnic inequality indicators in education, employment, health and housing for the 348 districts in England and Wales. 1 The analysis makes use of the unique qualities of the UK censuses, to provide detailed information for ethnic groups and subnational areas, and in such a way that patterns over time can be reliably compared. Although care must be taken in comparing cross-sectional data from 2001 and 2011 to conclude about social trends, the consistency of the subnational geographies and measures of education, employment, health, housing and ethnic group presents a unique opportunity in a UK context for making comparison over time. Using the Census Longitudinal Study (which cannot be used for this paper because of insufficient sample size and a lack of subnational geography) Simpson (2014) demonstrates the reliability of census ethnic group categories for making comparisons between 2001 and 2011.
This paper uses the subnational units of local authority districts of England and Wales. Districts are a commonly used geography for spatial analysis and one of the spatial scales at which neighbourhoods exist (Kearns and Parkinson, 2001). They are heterogeneous in size, with an average population of around 161,000. There are several reasons for using districts for the analysis of local ethnic inequalities: most have sufficient ethnic minority population size to construct reliable indicators of inequality and, since local authority districts are administrative local government boundaries, they are meaningful in policy terms.
Housing disadvantage is measured by overcrowding which indicates whether a household has adequate space to live in. Housing characterised by poor living conditions can create stress in the home and have negative consequences for wellbeing, particularly for children, and is therefore an important aspect of social inequality (Solari and Mare, 2012). The number of rooms required depends on the demographic make-up of the household in terms of age, sex and relationships (see Finney and Harries, 2015). The Office for National Statistics (ONS) produces measures of occupancy which capture overcrowding denoted by the proportion of households with an occupancy rating of −1 or below (indicating fewer rooms than required).
It is recognised that chances of employment improve as one’s level of qualifications increase and that educational attainment aids greater participation in society. Therefore, it is those with no qualifications that are at risk of becoming the most socially excluded and the most disadvantaged. Educational disadvantage is measured by the proportion of people aged 16–24 years with no qualifications since people in this age group should have acquired at least Level 1 qualifications (1 or more ‘O’ level or GCSE pass or equivalent).
Unemployment is a specific measure of those who are willing and able to work but unable to get a job, taken as a proportion of all those who are economically active. We consider only those aged 25 years and over to exclude younger people who are more likely to be transient between education and work.
We measure poor health by the proportion of people with a Limiting Long Term Illness (LLTI). LLTI relates to health conditions that limit a person’s everyday activities or work, commonly used as predictors of mortality (Norman and Bambra, 2007). We use age–sex (indirectly) standardised LLTI rates to account for the differing age structures in each ethnic group population.
Ethnic inequality can be measured in a number of ways depending on the type of differences between ethnic groups that are of interest. In this paper, we use absolute inequality measures calculated as the percentage point difference in the proportion of the White British group and the ethnic minority group in those aged 16–24 years with no qualifications (Education); aged 25 and over who are unemployed (Employment); those with a limiting long-term illness (indirectly age standardised) (Health); those living with an occupancy rating of −1 or below, indicating overcrowding (Housing). Although difference cannot always be read as inequality, the UK context of marked and persistent ethnic minority disadvantage renders an inequality framing apt (Jivraj and Simpson, 2015).
These measures are conceptually straightforward; if a minority ethnic group has a higher score on an indicator than the White British group there is disadvantage for the minority group and we can say that ethnic inequality exists. Subtracting a percentage score for an ethnic minority group from the score for the White British group mean that negative scores denote ethnic minority disadvantage. These measures have been calculated for ethnic minorities as a whole (all groups other than White British taken together) and nine separate ethnic minority groups: White Irish, White Other, Mixed, Indian, Bangladeshi, Pakistani, Chinese, Black African and Black Caribbean.
To examine ethnic inequalities in different socio-spatial contexts we grouped local authorities using the 2011 ONS local authority classification. The classification groups districts on the basis of 59 demographic and socio-economic variables drawn from the 2011 Census. The ONS classification is a three-tier classification system comprising of supergroups, groups and subgroups. We use the middle tier classification comprising of 13 groups of districts in England and Wales, as shown in Figure 1. 2 Census area classifications have been produced since 1971 at different geography levels in the UK and are used extensively in academic research to provide descriptive characterisations of geographic areas and as measures of socio-economic status (Singleton and Spielman, 2014). The classification enables us to summarise patterns of ethnic inequality and examine how they are associated with the demographic and socio-economic characteristics of districts. 3 By examining ethnic inequalities through an area classification framework we can obtain new insights for understanding ethnic inequalities in different socio-economic contexts and, correspondingly, the potential causes of local ethnic inequalities.
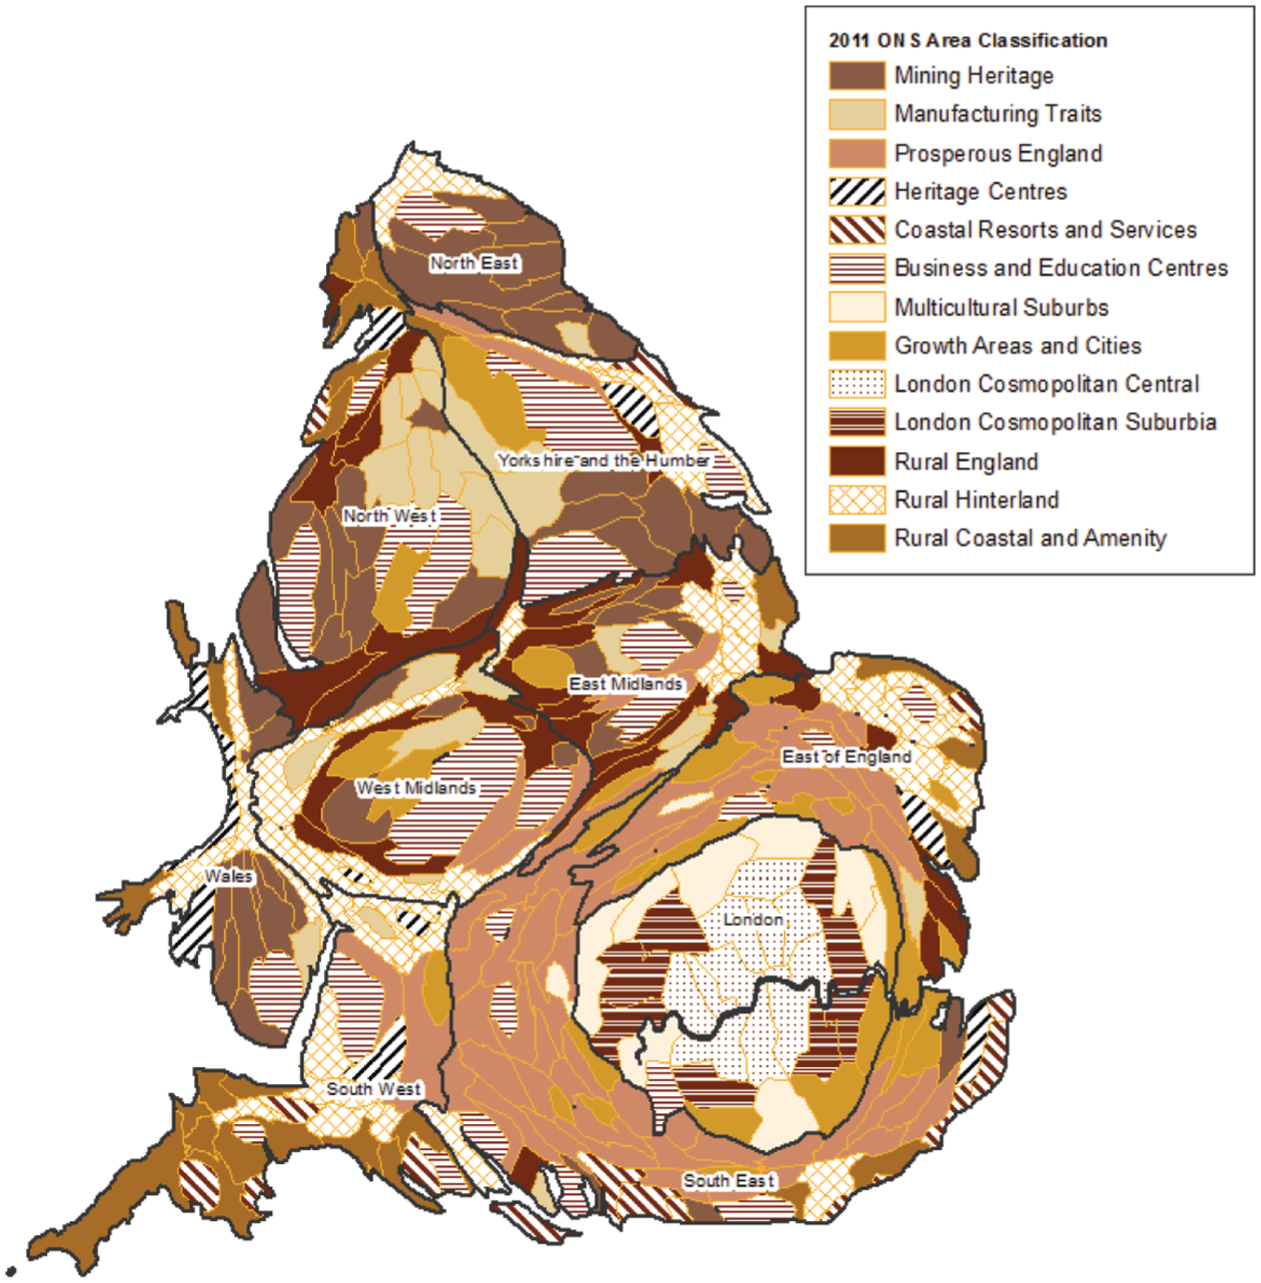
2011 ONS area classification for local authorities in England and Wales.
Patterns of ethnic inequality for district types, 2001–2011
There is significant differentiation in the education, employment, health and housing experiences of ethnic minority groups in relation to the White British across district types. As shown in Table 1, there is a higher proportion of White British and ethnic minority people unemployed in ‘Business and Education Centres’, ‘Mining Heritage’, ‘Manufacturing Traits’ and ‘London Cosmopolitan’ areas than in other classification areas. Ethnic minority people, however, are more likely to be unemployed than White British people in every classification area, with the largest differences in the proportion of people unemployed from ethnic minorities and the White British observed in London. In contrast, unemployment rates are lower in rural and coastal areas and the gap in the unemployment rate between White British and ethnic minority people is smaller in these areas. Between 2001 and 2011 the unemployment rate of White British and ethnic minority people increased in all districts except in ‘London Cosmopolitan Central’ where unemployment rates decreased for both groups.
Percentage of White British and ethnic minority people disadvantaged in education, employment, housing and health by classification area.
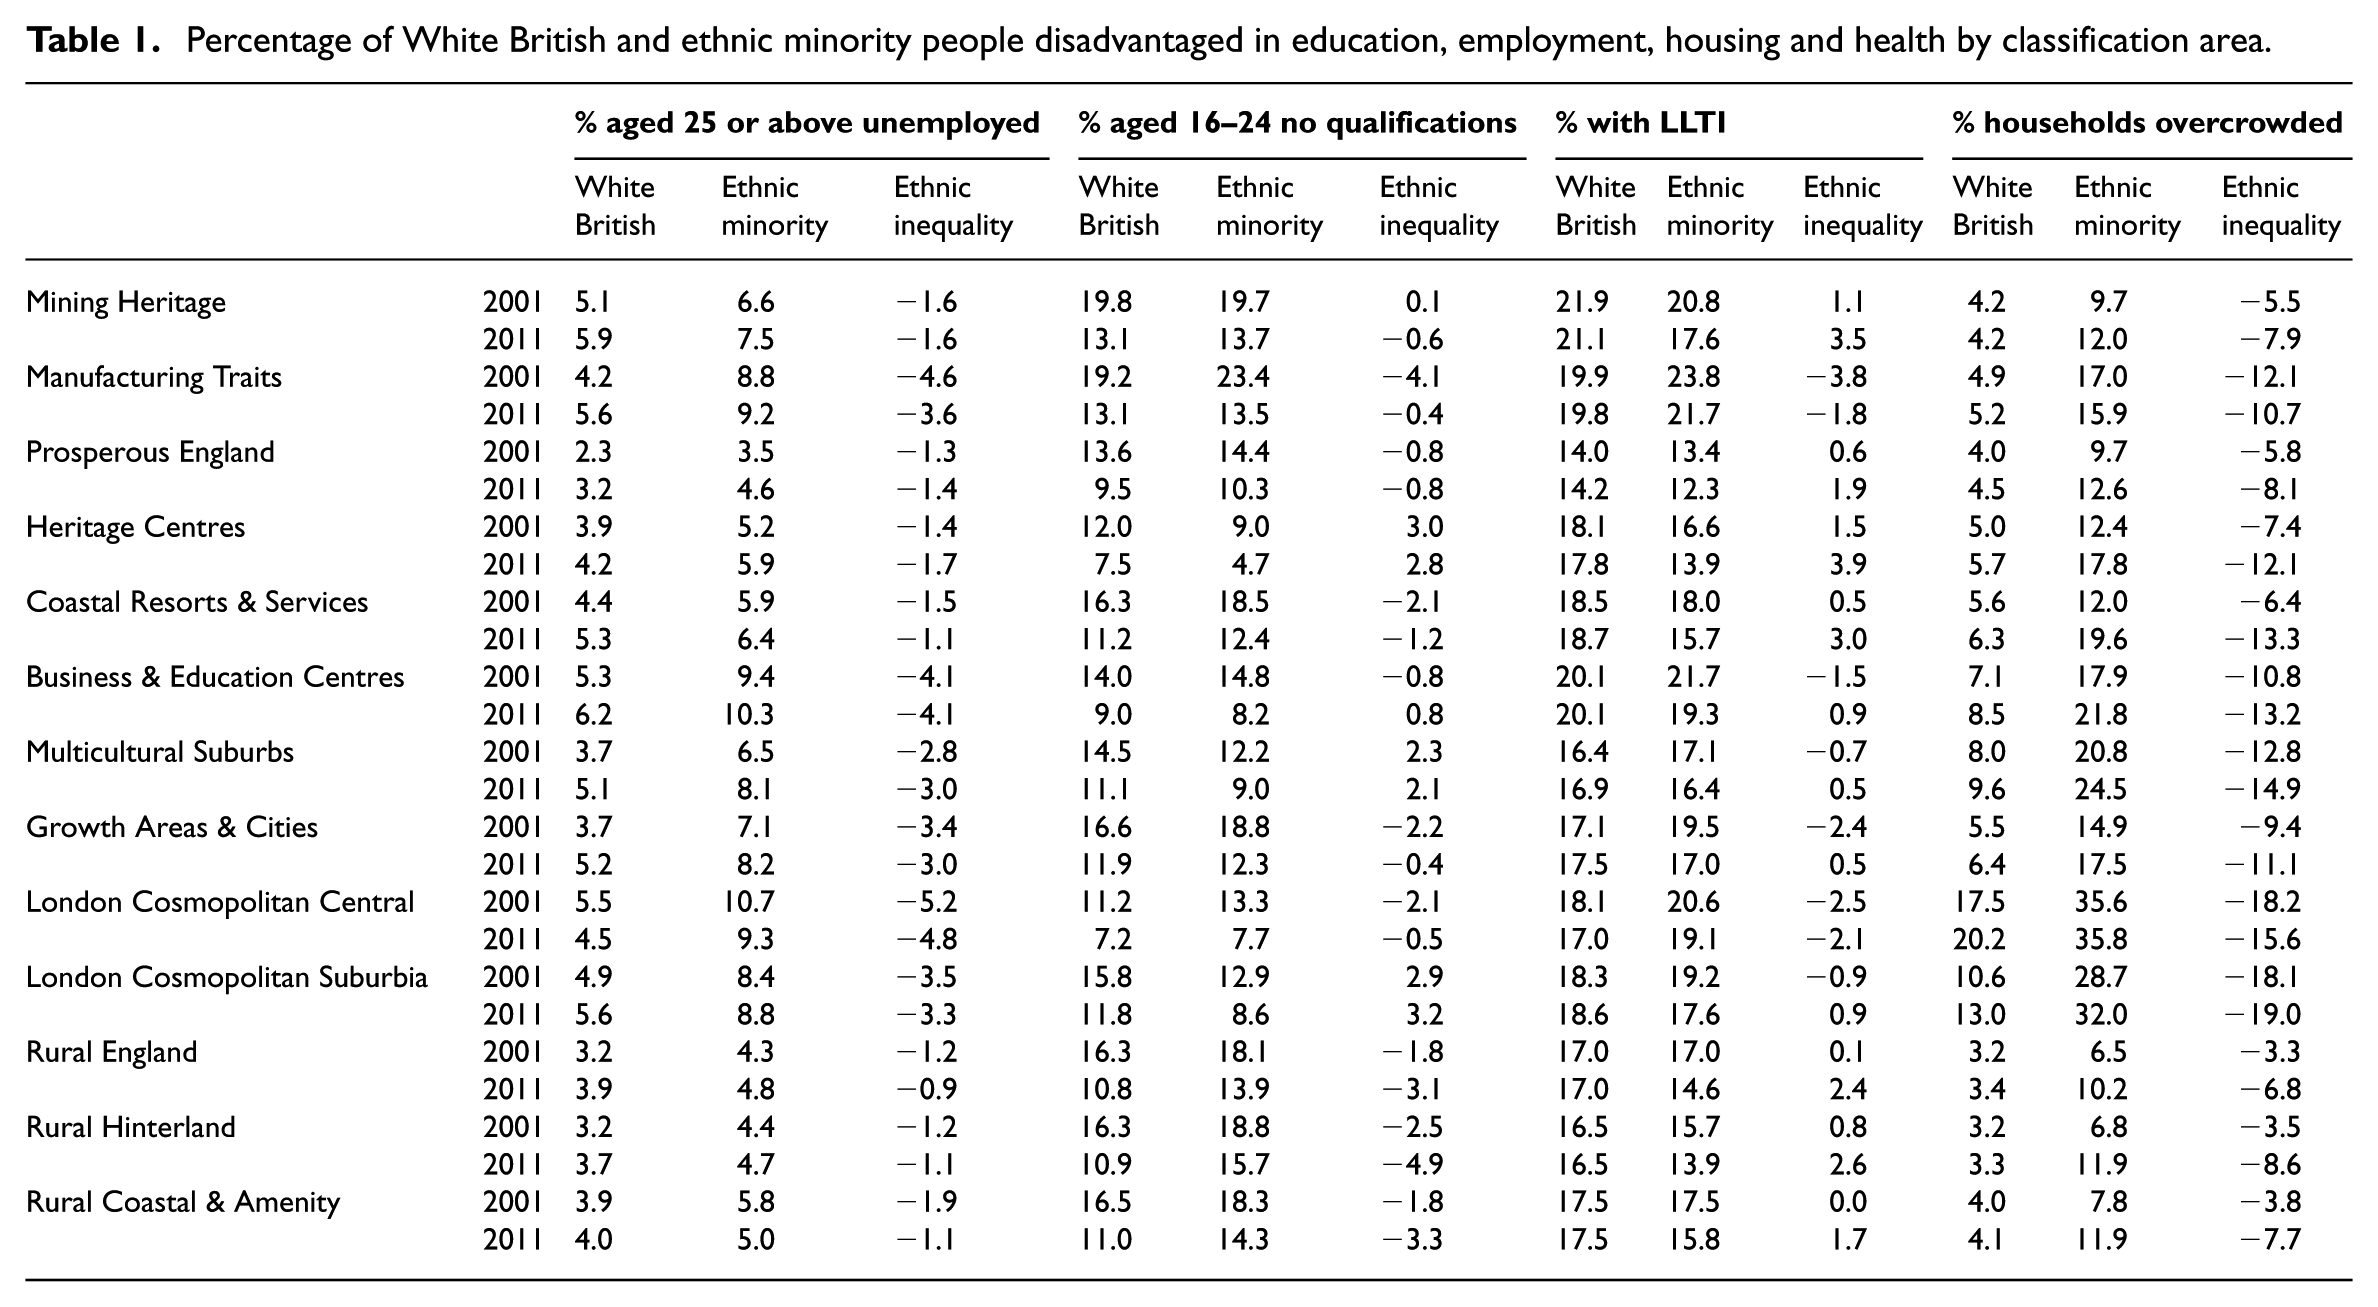
In 2011, the proportion of people with no qualifications was higher in manufacturing and mining towns located in the North of England and Wales (‘Manufacturing Traits’ and ‘Mining Heritage’) but the education gap between White British and ethnic minority people was largest in rural and coastal areas where there was also a significantly higher proportion of people with no qualifications from ethnic minorities than in other district types. In several classification areas, ethnic minorities were less likely to have no qualifications than the White British, particularly in London and ‘Heritage Centres’ where students and people who work in the Education sector are overrepresented. There was also an overall improvement in educational attainment and the proportion of people with no qualifications was lower in 2011 compared with 2001 in every district group. Between 2001 and 2011 the largest improvements in ethnic minority attainment were in ‘Manufacturing Traits’ districts where ethnic inequality in education (the difference in the proportion of people with no qualifications from the White British group and the ethnic minority group) also decreased at a higher rate than in other classification areas.
Poor health is more prevalent in larger cities and manufacturing and mining towns indicated by the higher proportion of people (both White British and ethnic minorities) with LLTI in ‘Business and Education Centres’, ‘Manufacturing Traits’ and ‘Mining Heritage’ areas. In 2011 people from ethnic minorities were less likely to have an LLTI than White British people in every district group except in ‘Manufacturing Traits’ and ‘London Cosmopolitan Central’. Ethnic minority advantage in terms of health between 2001 and 2011 has resulted from the larger improvements in health (lower proportion of people with LLTI) for ethnic minorities than for White British people (Table 1).
In contrast, ethnic minorities were far more likely to be overcrowded than White British people in every district type. Overcrowding rates were higher in London Cosmopolitan areas compared with other areas and ethnic minorities also experienced the most disadvantage in housing relative to the White British in London. Between 2001 and 2011 overcrowding rates increased in nearly every classification area, and the largest increases in overcrowding rates were for ethnic minorities. There was also larger variation in ethnic inequality in housing over the ten year period than in any other domain. Ethnic minority households were far more likely to be overcrowded in rural and coastal areas in 2011 than in 2001, including in districts that experienced relatively high net immigration over this decade. Furthermore, there were larger increases in ethnic inequality (the difference in the proportion of households who are overcrowded from the White British group and the ethnic minority group) in rural and coastal areas than elsewhere.
This overview has demonstrated that the spatial patterning of ethnic inequalities differs depending on the indicator of inequality: for ethnic inequalities in employment and health, (inner) London and manufacturing and mining areas raise the greatest concern. Strikingly, it is rural and coastal regions in which ethnic inequalities in education and housing are notable and worsened over the inter-censal decade 2001–2011. It is likely, because of the differing socio-economic profiles and geographical distribution, that the geographies of ethnic inequalities vary not just by the indicator used but by ethnic group. A more fine-grained analysis of individual ethnic groups may also lend explanation to the broad patterns observed for minorities as a whole. The analysis in the following sections examines patterns of ethnic inequality between the White British group and each of nine ethnic groups.
Ethnic inequalities in education, 2001–2011
As shown in Figure 2, in terms of education, ethnic minorities have the highest levels of ethnic disadvantage in rural areas. Districts in the ‘Rural Coastal and Amenity’, ‘Rural Hinterland’ and ‘Rural England’ groups typically have small ethnic minority populations and are areas where the White Other group was the largest ethnic minority group in 2011. Ethnic minorities as a whole were better educated than the White British group in ‘London Cosmopolitan Central’, ‘London Cosmopolitan Suburbia’ and in ‘Multicultural Suburbs’ where more than half of the population belongs to an ethnic minority group, as well as ‘Heritage Centres’ where a large proportion of the population are students. Education outcomes vary by ethnic group with the Bangladeshi, Black African, Black Caribbean, and Mixed groups, for example, being disadvantaged in terms of education in ‘London Cosmopolitan Central’ districts but better qualified than the White British in ‘London Cosmopolitan Suburbia’.
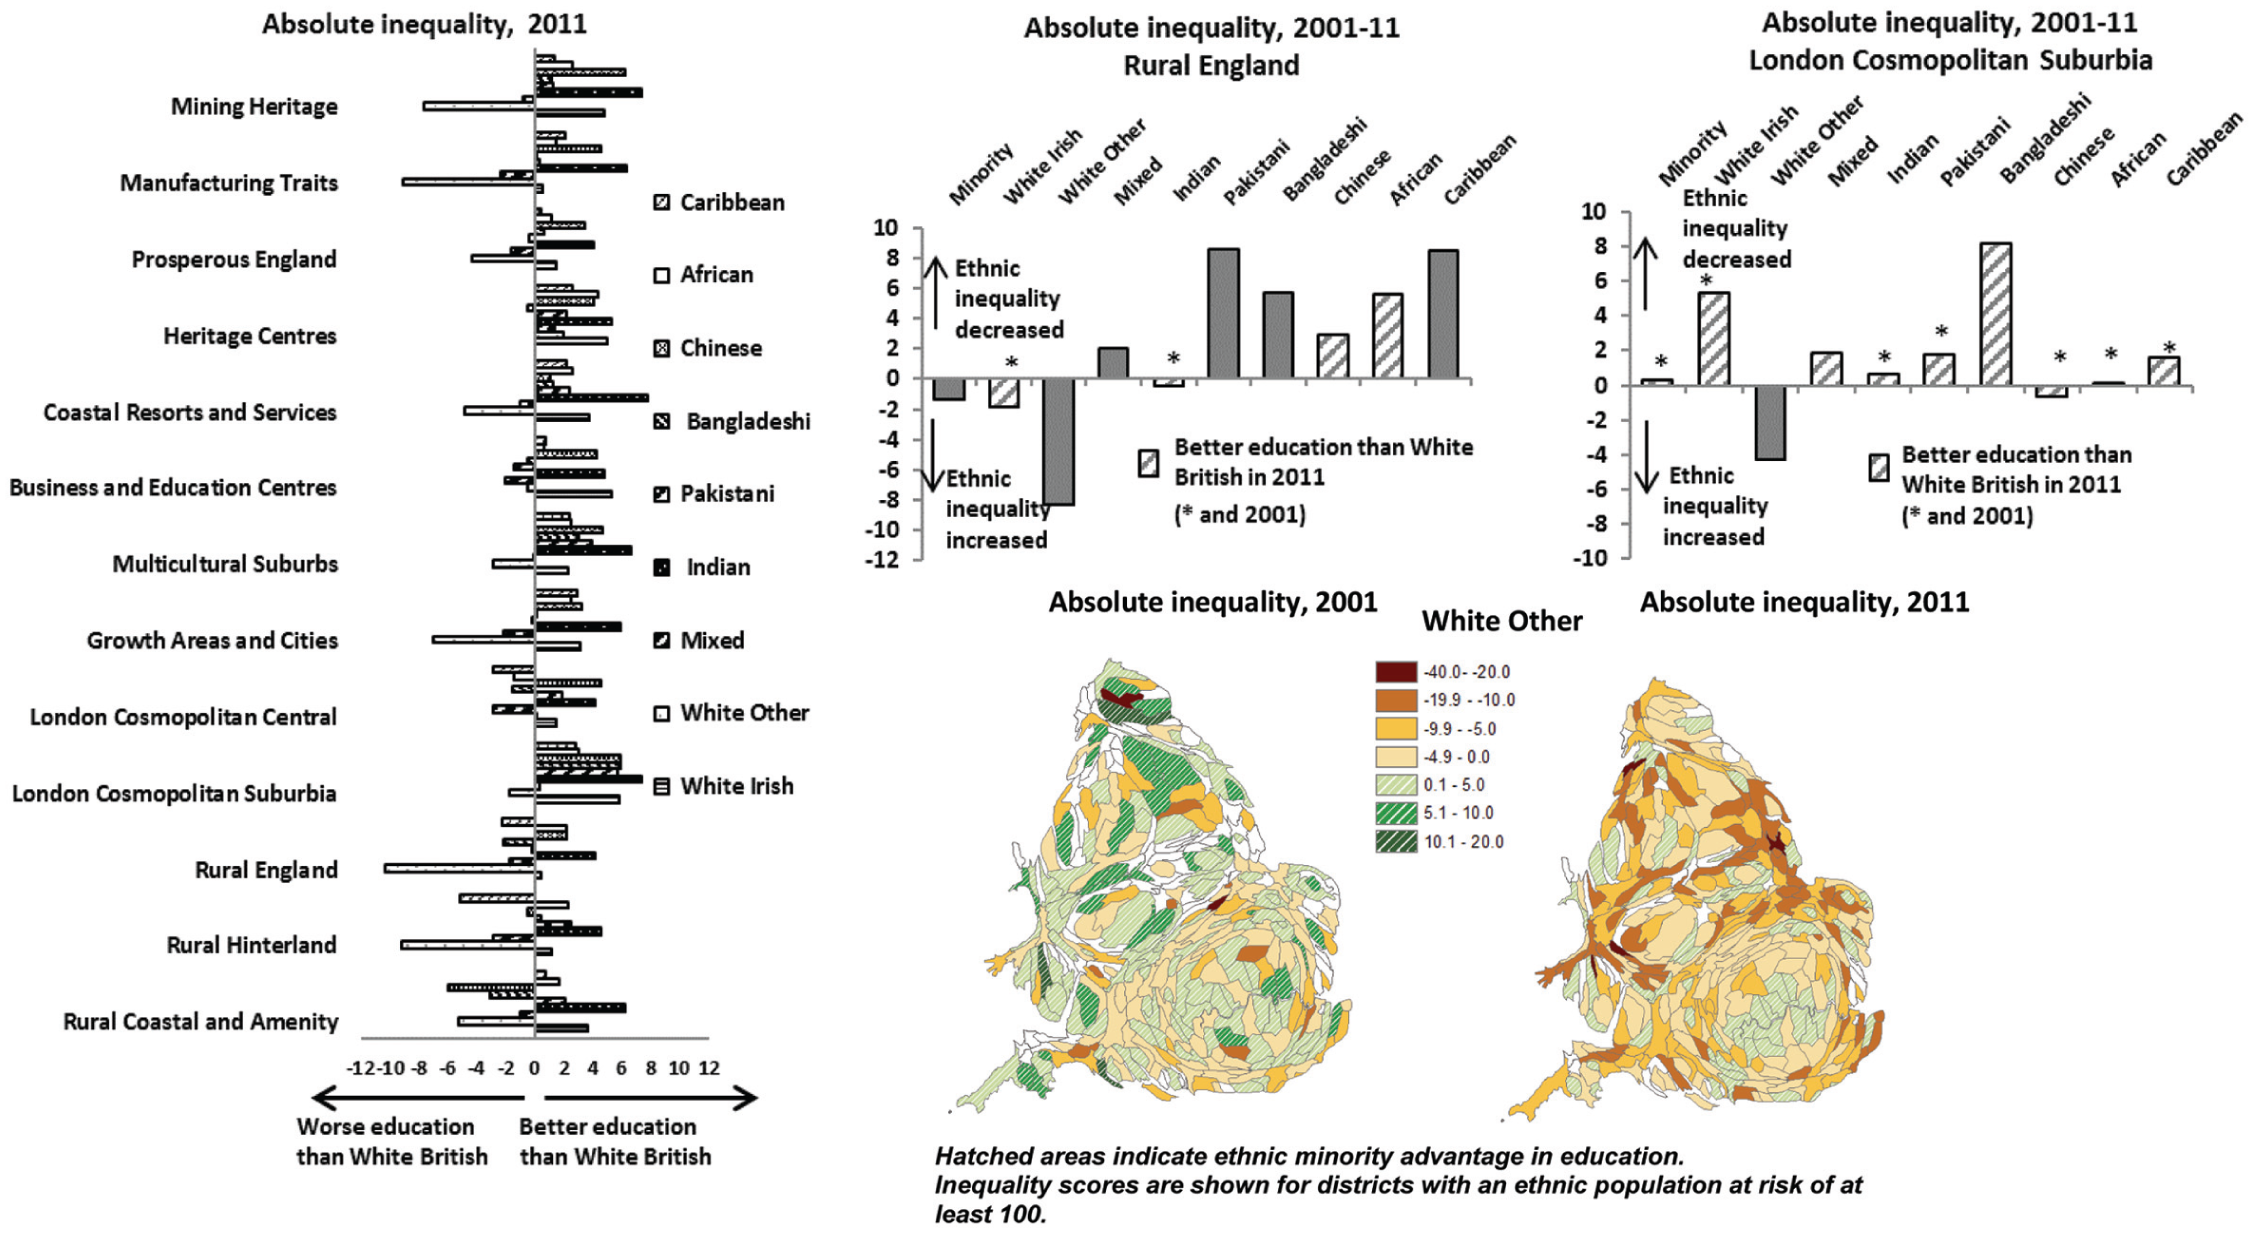
Absolute inequality in education, 2001–2011.
As shown in Figure 2, the White Other and Mixed groups were the most disadvantaged in terms of education in 2011. The White Other group which grew mostly from immigration over the inter-censal decade 2001–2011 (Simpson and Jivraj, 2015), was more disadvantaged in terms of education than any other group in 2011, particularly in rural districts and manufacturing and mining towns. The only classification areas where the White Other group did not experience educational disadvantage in relation to the White British group were ‘London Cosmopolitan Central’ and ‘Heritage Centres’ where higher education inequality was experienced by the Bangladeshi and Black Caribbean groups, respectively. The Mixed group fared worse than the White British group in all but two district types. In contrast, the Black African group fared better than the White British group in all district types except ‘London Cosmopolitan Central’.
The Bangladeshi and Pakistani groups experienced the most disadvantage in relation to the White British in ‘Rural, Coastal and Amenity’ and ‘Business and Education Centres’, respectively. The Chinese group experienced inequality in terms of education in rural and coastal areas although it outperformed the White British group in all other district types. Similarly, the White Irish and Indian groups had better attainment than the White British group in every district type. These ethnic groups were far more likely to be qualified than the White British group in ‘London Cosmopolitan Suburbia’ than in other districts.
The district types that became more unequal over the 2001–2011 decade in terms of education inequality for the minority group as a whole are rural and coastal areas which also had the highest ethnic inequality in 2011 (see Table 1). The worsening of ethnic inequality in these areas, particularly in ‘Rural England’, reflects the widening of the attainment gap between the White Other group and the White British group (Figure 2). Education inequality for the White Other group increased in every district group except in ‘London Cosmopolitan Central’ districts. For most other ethnic minority groups attainment improved relative to that of the White British group. In ‘London Cosmopolitan Suburbia’ the education advantage of ethnic minority groups relative to the White British reflects these improvements although most groups had better attainment than the White British in both 2001 and 2011 (Figure 2).
The Bangladeshi group saw improvements in educational attainment relative to the White British group across all classification areas, with the largest improvements seen in rural and coastal areas. Similarly, the Pakistani group saw improvements in education in most district types, with the largest improvements in attainment seen in less ethnically diverse rural areas and large conurbations comprised of former industrial districts (‘Manufacturing Traits’) where the Pakistani group is the largest ethnic minority group.
Figure 2 also shows the patterns of ethnic inequality for the White Other group in each district in 2001 and 2011. The districts with the highest inequality in 2011 are located outside major conurbation areas, and tend to be less deprived areas with small ethnic minority populations. The districts that have become more unequal between 2001 and 2011 include places where the White Other group was the largest ethnic minority group in 2011. In some of these districts, such as Boston and Fenland, the White Other group grew significantly over the decade 2001–2011 as a result of immigration from the EU Accession states. Although on average EU Accession migrants are no more likely to be without qualifications than the UK born, those in the younger age groups are far more likely to have no qualifications than their UK-born and non-UK born counterparts (Lymperopoulou and Parameshwaran, 2015). Recent migrant groups are also one of the groups more likely to be underreporting lower-level qualifications in the census (ONS, 2012). Poor educational attainment, lack of employer recognition of foreign qualifications, combined with lower English language ability, are likely to increase the disadvantage of recent migrants in the labour market (Berthoud, 2000a).
Ethnic inequalities in employment, 2001–2011
Employment inequality is an experience that affects disproportionately ethnic minority groups in England and Wales. In 2011, ethnic minorities experienced employment disadvantage (a higher unemployment rate than the White British) across different districts, with the most disadvantaged group being the Black African group (Figure 3).
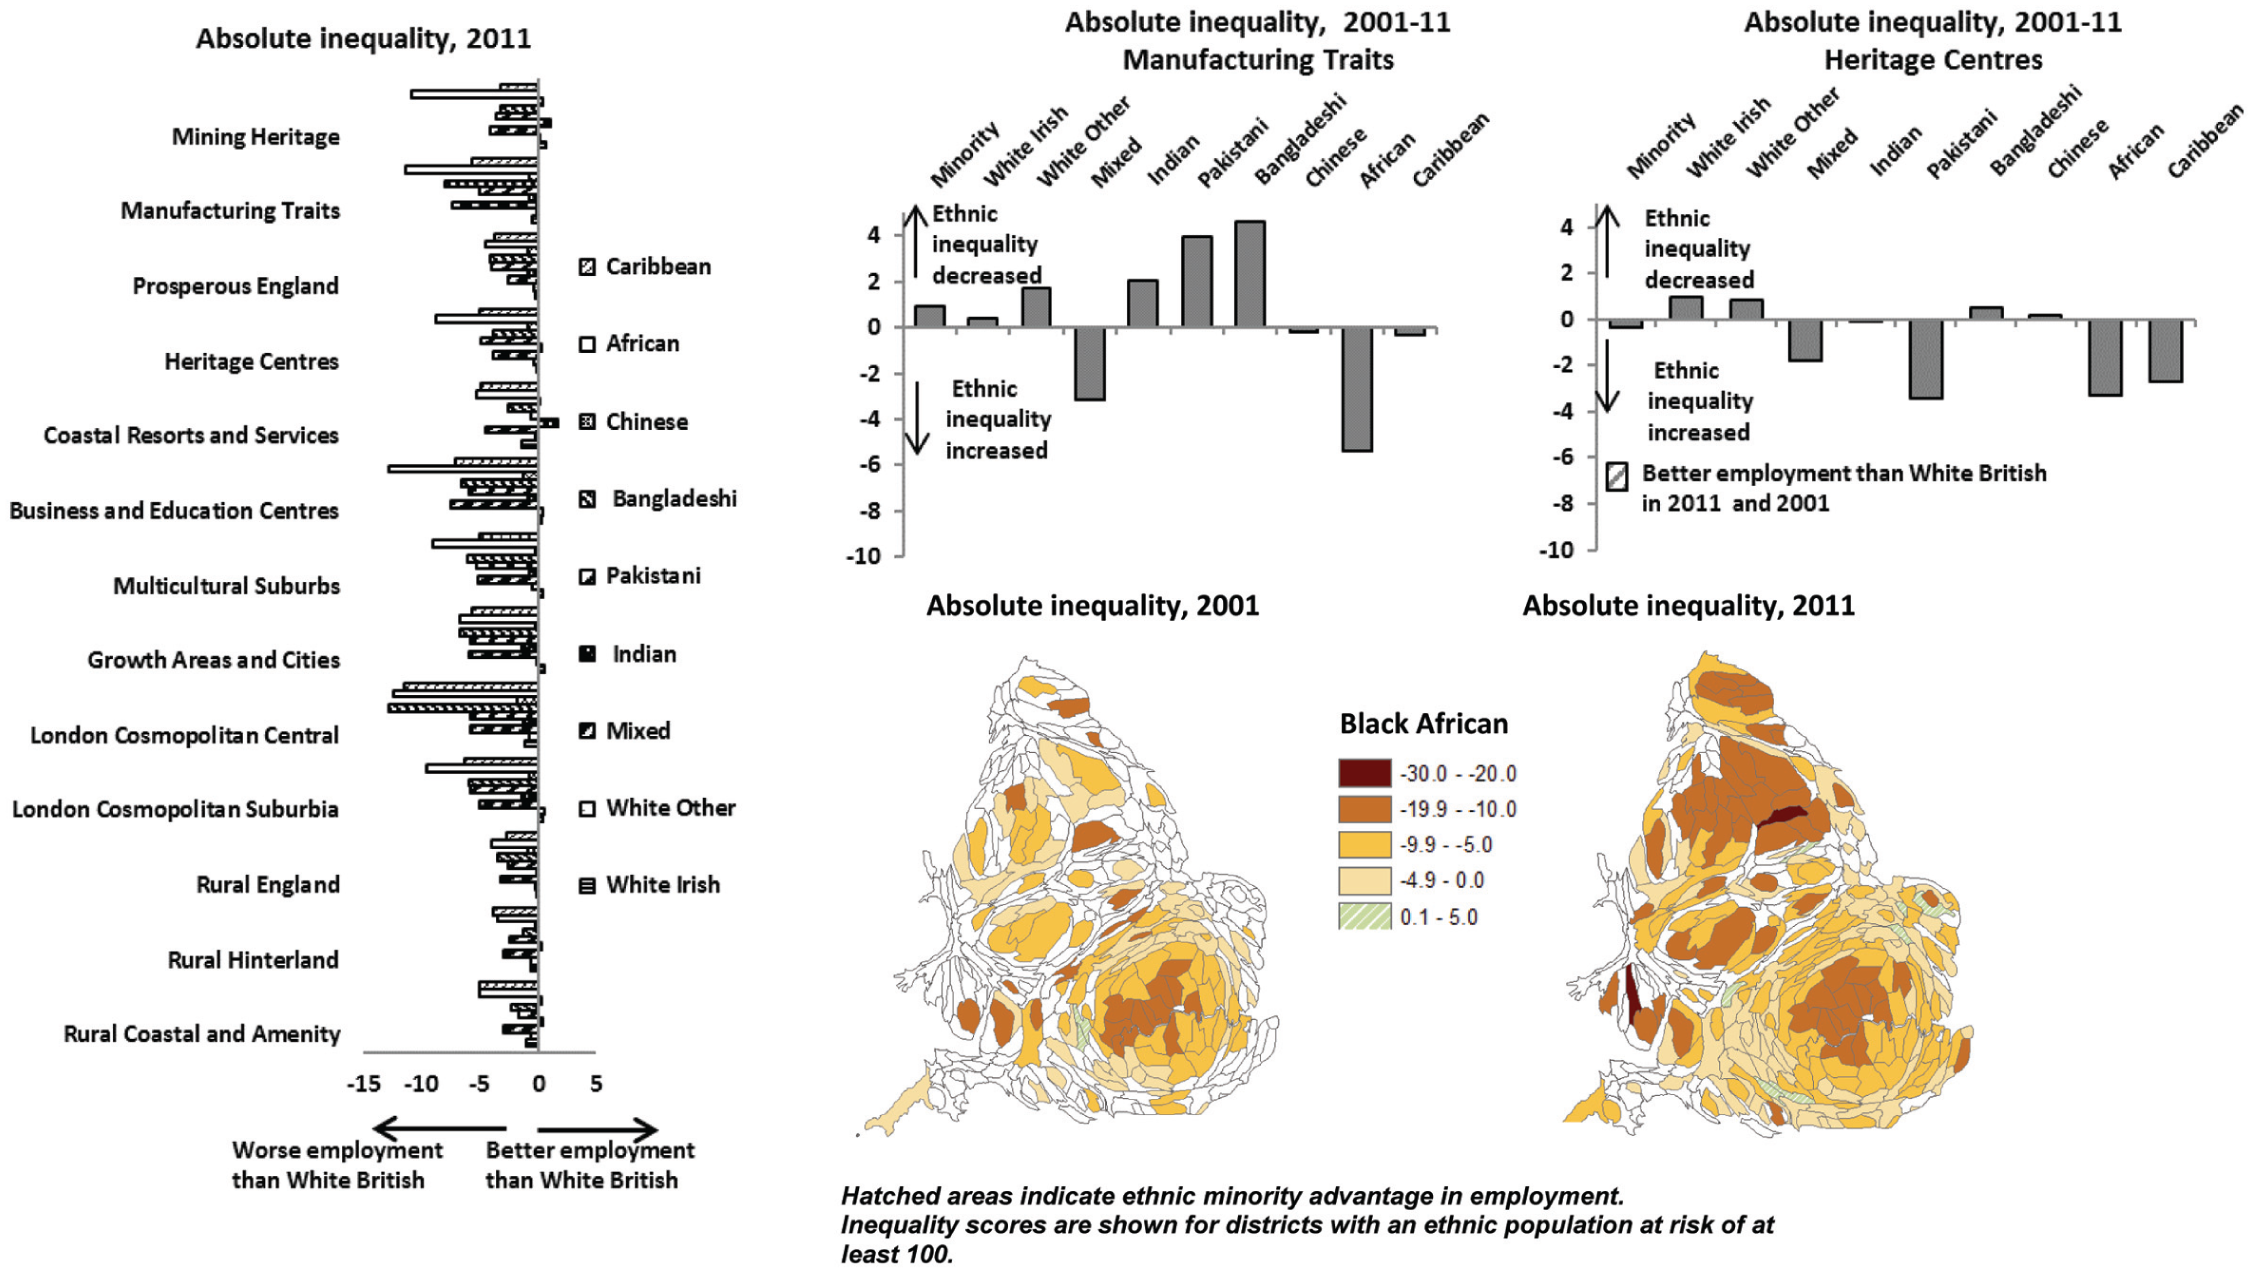
Absolute inequality in employment, 2001–2011.
The districts with the greatest levels of ethnic inequality in 2011 were in London and the largest cities so that the unemployment rate of ethnic minority groups was higher in ‘London Cosmopolitan Central’, ‘London Cosmopolitan Suburbia’ and ‘Business and Education Centres’ for most groups. In these areas, employment inequality was noticeably higher for the Black African, Black Caribbean and Bangladeshi groups. The Bangladeshi and Mixed groups also fared worst in ‘Manufacturing Traits’ districts while the Pakistani group was also disadvantaged in ‘Growth Areas and Cities’. The Indian group had worse employment outcomes than the White British group in London Boroughs but noticeably better employment outcomes than the White British in less ethnically diverse areas, particularly in ‘Coastal Resorts and Services’. In contrast, employment inequality was least severe for the white ethnic groups. Both the White Other and White Irish groups had similar unemployment rates to the White British group across classification areas although both groups were more disadvantaged than the White British group in ‘London Cosmopolitan Central’.
A comparison of ethnic inequalities in 2001 and 2011 suggests that the Black African group became significantly more disadvantaged in terms of employment than the White British group. The gap in the unemployment rate for the Black African group and the White British group increased the most in ‘Manufacturing Traits’ and ‘Mining Heritage’ districts. Employment inequality intensified the most in ‘Manufacturing Traits’ for the Mixed group as well. Overall, the ethnic gap in employment intensified the most in ‘Heritage Centres’ comprised of less ethnically diverse districts with a large student population. Across different district types the gap in employment between white ethnic minority groups and the White British narrowed or disappeared over the ten year period.
As shown in Figure 3, for the Black African ethnic group, the most unequal districts in 2011 were in parts of London and the north of England, and included deprived districts such as Birmingham, Stoke-on-Trent, Liverpool, Salford, Bradford and Hackney. These were also some of the districts where inequalities increased the most between 2001 and 2011 for the Black African group, although inequalities became more widespread across the country.
Ethnic inequalities in housing, 2001–2011
Ethnic minorities are particularly disadvantaged in terms of housing: all ethnic minority groups had higher levels of overcrowding than the White British group across all types of localities. The lower home ownership rates among ethnic minority people partly explain ethnic inequality in housing since overcrowding levels are much higher among households who live in rented accommodation. Ethnic inequality in housing is also most severe in London Boroughs and Multicultural Suburbs where there is a higher proportion of people from ethnic minority groups and higher levels of private renting than the rest of England and Wales.
The Bangladeshi and Black African groups were the most disadvantaged ethnic minority groups in terms of housing in 2011 across classification areas, particularly in London, where nearly half of the Bangladeshi and Black African groups were social housing tenants. The White Irish group was least likely to experience housing inequality than other ethnic minority groups.
Between 2001 and 2011 the gap in overcrowding rates between ethnic minorities and the White British narrowed the most in inner London Boroughs. This was a result of increases in overcrowding rates for most ethnic groups but these being larger for the White British group than for ethnic minority groups. Across ethnic groups, the Bangladeshi group experienced significantly lower overcrowding rates relative to the White British group in 2011 than in 2001, particularly in ‘London Cosmopolitan Central’ and ‘Manufacturing Traits’ districts. Housing inequality for the Pakistani group was also lower in 2011 compared with 2001 in nearly every district type. In contrast, the overcrowding rates of the White Other and Mixed groups increased relative to those of the White British group during the same period. The disadvantage of the White Other group was highest in rural and coastal areas, which include areas with large concentrations of migrants working in low-pay sectors such as hospitality, food processing and agriculture, associated with poor housing conditions (Spencer et al., 2007; UK Border Agency et al., 2009).
As shown in Figure 4, between 2001 and 2011 housing inequality for the White Other group worsened across the country, particularly in districts located outside London. They include districts such as Luton, Slough, South Holland, Fenland, Breckland and Boston which experienced among the largest population increases for the White Other ethnic minority group, and have among the largest EU Accession migrant populations in the country.
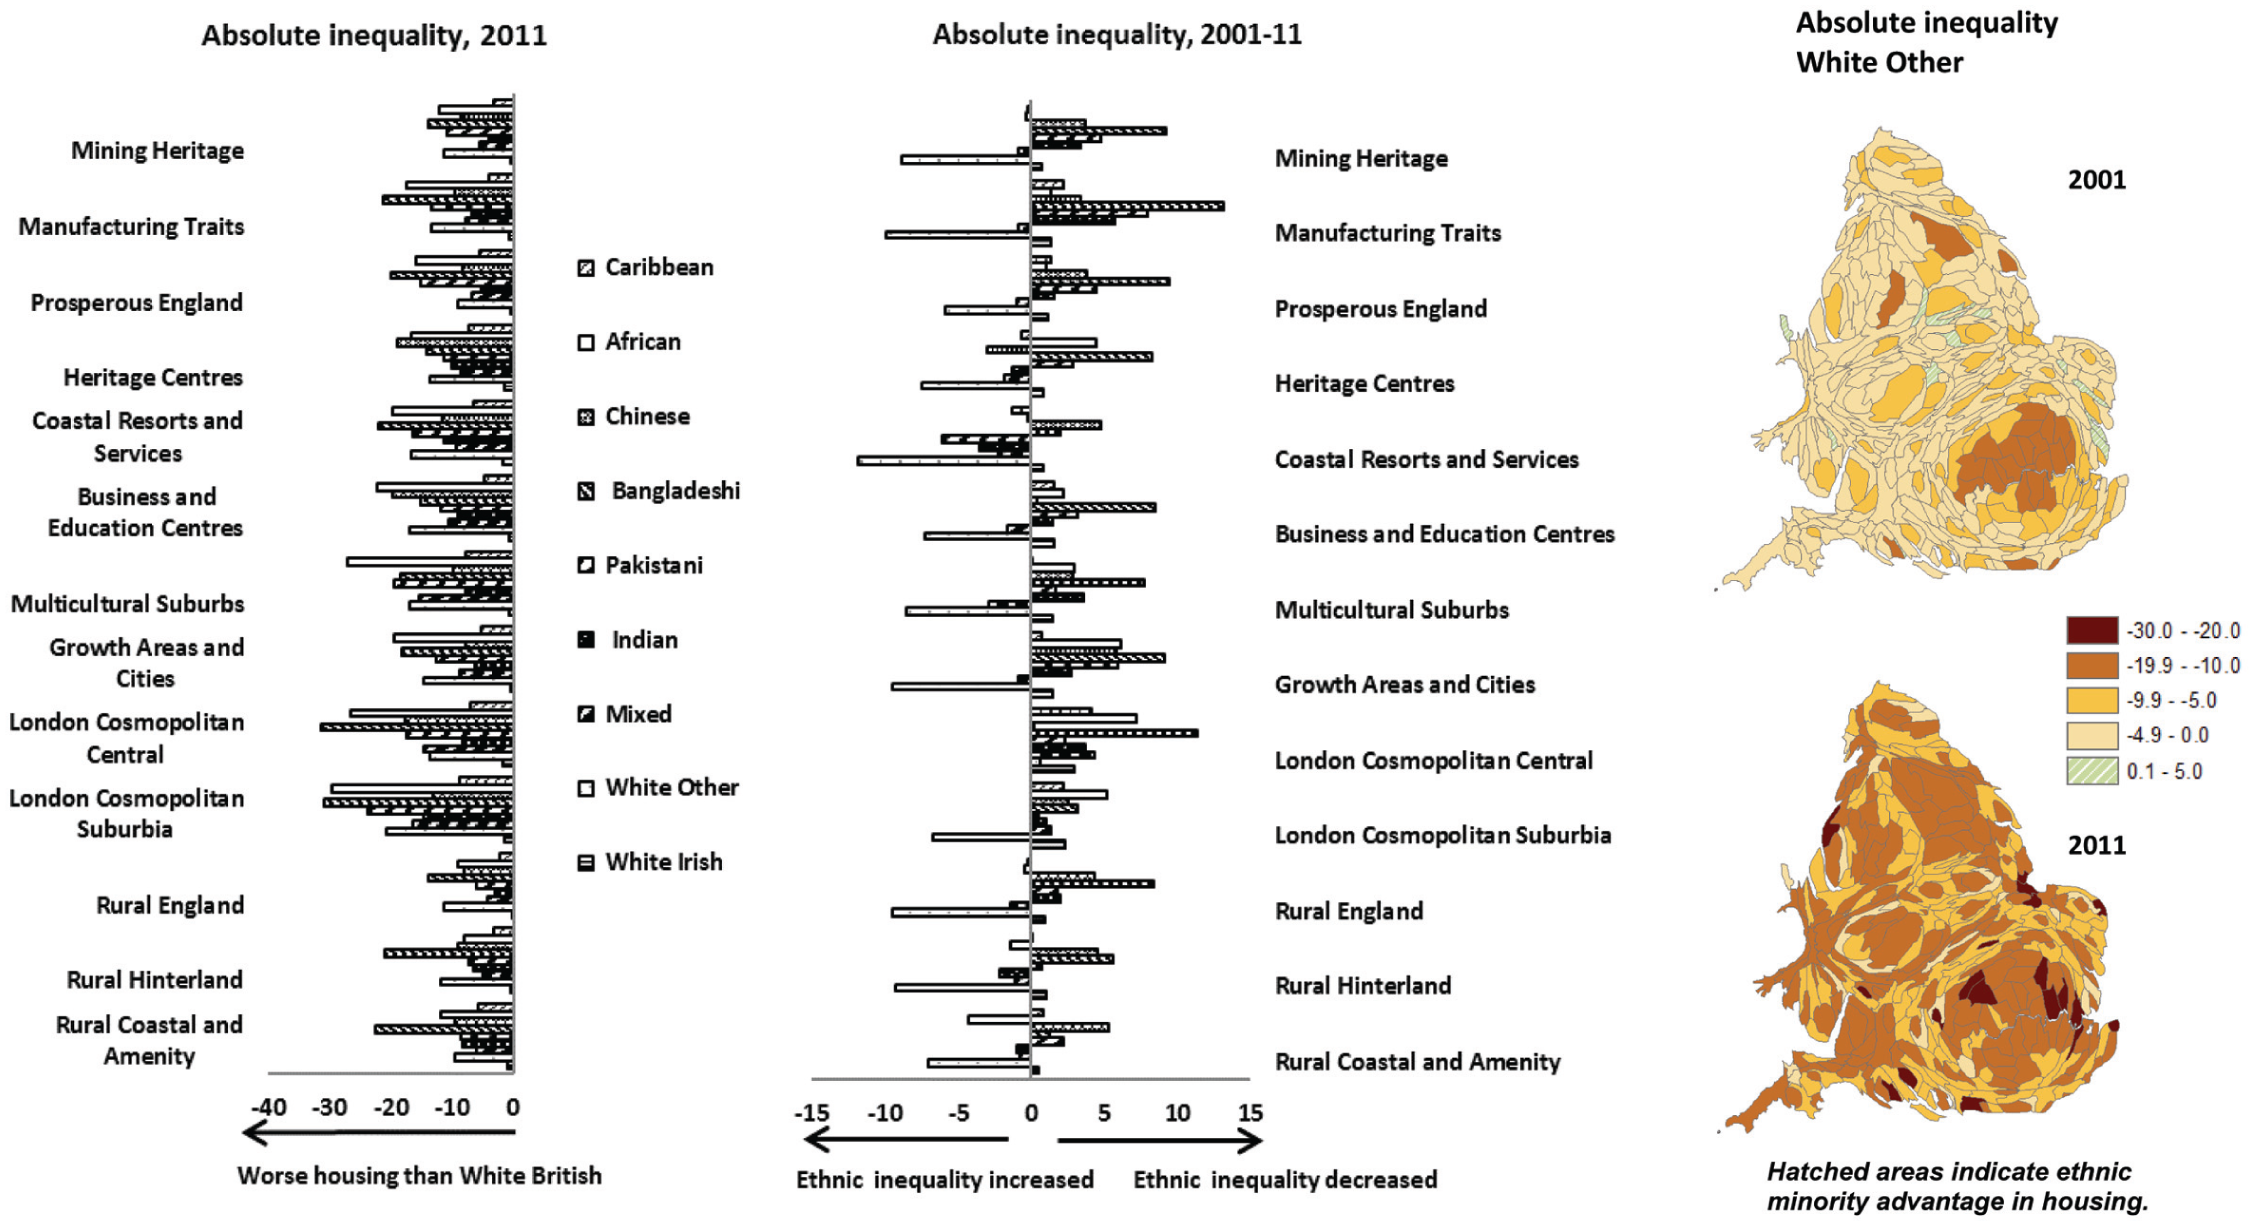
Absolute inequality in housing, 2001–2011.
Ethnic inequalities in health, 2001–2011
In 2011, ethnic minorities fared better than the White British in terms of LLTI (age standardised) in most districts, particularly outside London (Table 1). Most ethnic minority groups experienced inequality in inner London (‘London Cosmopolitan Central’) where health inequality was highest (Figure 5).
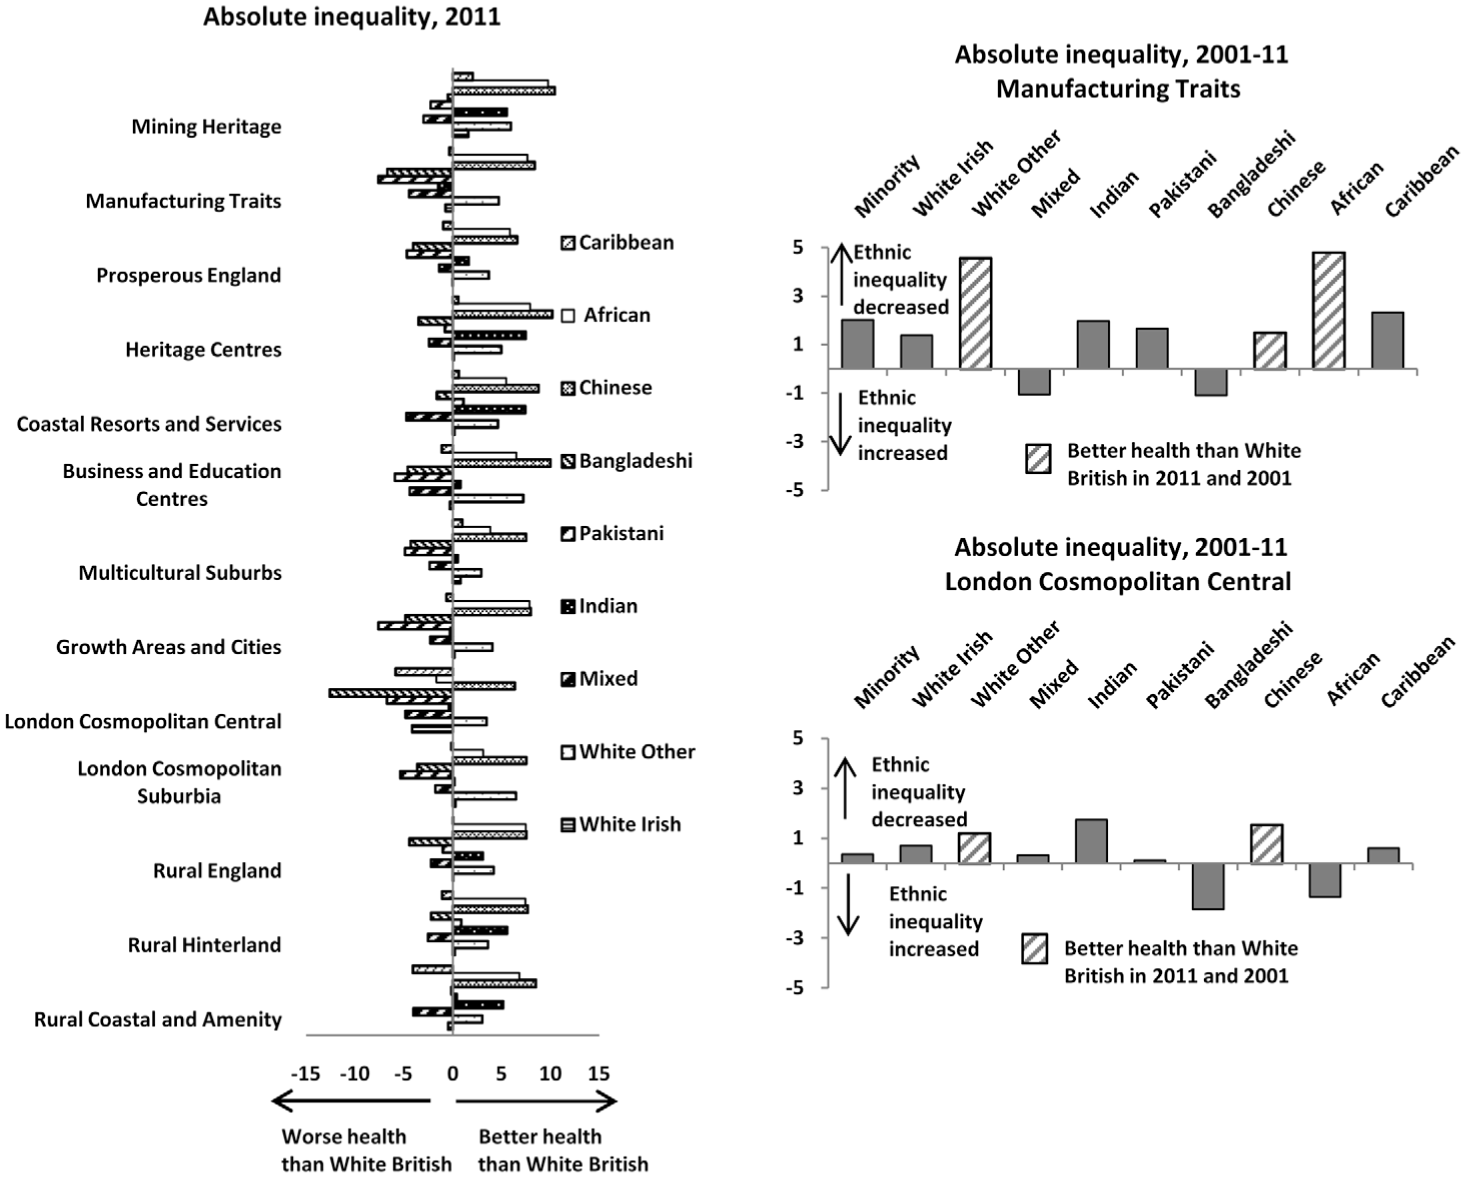
Absolute inequality in health, 2001–2011.
The Chinese, Black African and White Other groups experienced significantly better health outcomes than the White British in 2011. These groups are comprised of large numbers of migrants and grew mainly through immigration over the decade 2001–2011 (Simpson and Jivraj, 2015). The ‘healthy migrant’ effect – the positive selection of migrants in terms of health – explains the better health of these groups relative to the White British (Wallace and Kulu, 2014).
In contrast, the Pakistani, Bangladeshi and Mixed groups, which grew less from immigration over the decade 2001–2011, experience higher inequality in health, particularly in London where inequality is more severe than elsewhere. The health disadvantage of these groups is likely to reflect their disadvantage in other dimensions such as housing, education and employment as well as their higher concentration in deprived areas (Becares, 2015).
There were improvements in health for ethnic minorities as a whole across districts between 2001 and 2011. Ethnic inequality in health, however, worsened for the Mixed and Bangladeshi groups. Inequalities in health worsened in different types of districts for the Mixed group, particularly in manufacturing, mining, rural and coastal areas while for the Bangladeshi group inequalities worsened the most in inner London Boroughs. This is shown in Figure 5 which also shows that despite improvements in health in ‘London Cosmopolitan Central’ areas only the White Other and Chinese groups had better health than the White British group in these districts in 2011. In contrast, in ‘Manufacturing Traits’ districts, inequalities worsened between 2001 and 2011 for the Mixed and Bangladeshi groups while the ethnic gap in health narrowed for all other ethnic minority groups.
Discussion and conclusion
The analysis presented in this paper suggests a complex picture of ethnic inequalities across England and Wales. Unrivalled census data for 2001 and 2011, together with the ONS Area Classification, presents evidence of the differing experiences of ethnic groups in districts of England and Wales that have not previously been documented comprehensively. In evidencing the geographies of ethnic inequalities this paper raises many questions about the formation and impact of ethnic inequalities and their uneven geographies.
Whilst the richness of census data has revealed the complexity in the spatial patterning of ethnic inequalities, a number of key results can be highlighted. The census analysis has shown that inequalities in socio-economic outcomes manifest in different ways for particular ethnic groups and are characterised by local variation: in some types of districts there is large ethnic inequality, while in others, ethnic minority groups have equal or better outcomes than the White British population. Education inequality is severe for the White Other group while other ethnic minority groups tend to have better educational outcomes than the White British across different localities. Many of the districts that have become more unequal between 2001 and 2011 are coastal and rural districts that have small ethnic minority populations. Despite local variations in patterns of ethnic inequality, it is clear that they are most widespread in employment and housing: most ethnic minority groups were disadvantaged in terms of employment and housing in 2001 and 2011 irrespective of where they lived. Employment and housing inequality in 2011 was particularly pronounced for the Black African ethnic minority group. Overall, while inequalities in housing and employment are severe for ethnic minorities in most districts, most ethnic minority groups fared better in 2011 than the White British group in terms of education and health.
So, what might be gleaned from these results about the social processes causing and resulting from these inequalities? In the Introduction we noted a dearth in theoretical development of the connection between spatial variation (conceived in this paper as area type) and (ethnic) inequalities but suggested that three theoretical perspectives are useful for enabling critical reflection on our results: the ‘effects’ of ethnic density (neighbourhood diversity); differential service access and treatment, including racism; and immigrant integration/adaptation. We review these ideas in turn, in relation to our results, and draw out fruitful avenues for future empirical and theoretical development.
The association between ethnic composition (or, ethnic density or diversity) and inequalities is not straightforward. London, the most ethnically diverse part of the country, has high levels of ethnic inequalities, but so too do more rural locales that are less ethnically diverse. The benefits of ethnic density that we might expect to exist (Becares et al., 2009) are likely concealed by the negative effects of area deprivation. Certainly, ethnic health and employment inequalities are most severe in deprived areas in London and in former industrial and manufacturing towns that have suffered from long-term economic decline. Districts that have become diverse because of recent immigration, as discussed below, also suffer in terms of inequalities. What is clear is that to understand the relations between ethnic diversity and inequalities the nature of an area’s diversity needs to be taken into account, particularly in terms of its recency and association with deprivation.
This raises the issue of the geographical unit of investigation and whether the differential experience of White British and minority groups within a district are an artefact of the differential location – and thus differential exposure to deprivation, access to services and suchlike – of ethnic groups within a district. In other words, within-district inequality may correlate highly with within-district ethnic residential segregation. This is a hypothesis worthy of investigation. However, given the declining ethnic residential segregation for small areas in England and Wales (Catney, 2016) it is unlikely that this provides the whole explanation for geographical variation in ethnic inequalities.
The second explanation that we propose for within-district ethnic inequalities is a mis-match between the needs of different minority groups and service provision. This can be illustrated with reference to housing, for which we have evidenced extreme ethnic minority disadvantage: cultural preferences such as the ‘three-generation’ household pattern (Berthoud, 2000b) and continued multi-adult households (Catney and Simpson, 2014) together with a shortage of adequate accommodation to cater for the larger size of ethnic minority households and rising housing costs may be part of the explanation for the increasing housing disadvantage of ethnic minorities. Housing inequalities are most severe in London, reflecting higher house prices and rents and disproportionally higher levels of private and social renting than the rest of the country.
Employment inequalities are also most severe in London and other urban conurbations and in less affluent localities. Employment inequalities are higher for the Black, Asian and Mixed ethnic groups and less severe for white ethnic minority groups across different localities in England and Wales. In addition to mismatch between needs and service provision it is impossible to rule out the presence of racial discrimination or bias in recruitment and workplace practices as part of the explanation for differences in ethnic group experiences (Heath and Cheung, 2006).
We should take care, however, not to generalise about the minority disadvantage or racism in service provision which may be exacerbated in deprived areas. Despite the concentration of Bangladeshi people in deprived urban areas they benefit from higher quality schools since pupil attainment is higher in large conurbation centres than in other places (Social Mobility and Child Poverty Commission, 2014). This, together with the increasing proportion of Bangladeshi people educated in Britain, can explain the improvements in educational attainment observed for this group.
Our third perspective for interpretation of our results is that of immigrant adaptation. Our analysis shows large increases in ethnic inequality in education and housing in localities with small ethnic minority populations where the White Other group grew significantly over the decade 2001–2011 from work-related migration from the EU Accession countries. EU Accession migrants in the younger age groups tend to have lower levels of attainment than other groups (Lymperopoulou and Parameshwaran, 2015) and in rural areas they are overrepresented in Houses of Multiple Occupancy (HMOs) characterised by overcrowding conditions (Spencer et al., 2007). However, it is not immigration per se that contributes to ethnic inequalities but the nature of the immigration and the characteristics of the migrants. In contrast to the White Other group, two other groups that grew mainly through immigration between 2001 and 2011, the Chinese and Indian, are advantaged in relation to Whites on educational attainment. This is because this immigration comprised large numbers of international (Higher Education) students who by definition would have educational qualifications (Simpson and Jivraj, 2015).
The disadvantage of the White Other group may relate to their immigration to Britain over the decade 2001–2011 being notably to places outside urban areas. Lack of cultural resources and knowledge of British educational systems and language together with poor language provision and support services such as interpreting and translation in rural areas may help explain their educational disadvantage (Chakraborti and Garland, 2004). In addition, the higher visibility of people from ethnic minorities in less ethnically diverse and rural areas has been associated with increased hostility and racial harassment towards ethnic minorities (Chakraborti and Garland, 2004).
This suggests there is a need for specific local interventions aimed at tackling the inequalities for particular groups: interventions to improve educational attainment may be most effectively targeted to the White Other group, particularly in rural and coastal areas. The socio-economic disadvantage of the White Other group draws attention to the importance of the distinction between ethnic minority groups from new immigrant communities and more established ethnic minority communities for understanding and tackling local ethnic inequalities, particularly in terms of education and housing. Ethnic education inequalities for example, may be addressed by additional resources in schools, which in rural and coastal areas may include English language provision. The principle of the current government’s Localism policy, to devolve power to UK countries, regions and cities, may be an opportunity for localities to respond to the dynamics of their populations, and the evidence in this paper can contribute to local understandings. However, local initiatives alone will not suffice: for example, employment and housing inequality may be better addressed by national policies which aim to address youth employability, and commitment to address housing affordability and supply issues. National policy is also crucial to provide frameworks of equality and anti-discrimination, to address employer discrimination which is likely to have contributed to the severe local ethnic inequalities in employment found in this study.
This paper has presented new evidence on the spatial distribution of ethnic inequalities across England and Wales and how this has changed over time. It has contributed to a relatively underdeveloped literature and is timely given the current political focus on both inequality and racism. The detailed documentation of the extent and persistence of ethnic inequalities in England and Wales will, we hope, spur others to investigate the drivers and consequences of these inequalities. We have suggested that processes relating to segregation and integration may provide some explanation alongside a mismatch between demand for, and provision of, local services and the impact of immigration. What is clear from the compelling census evidence that has been presented is that any consideration of local integration will be partial unless attention is paid to socio-economic ethnic inequalities.
Footnotes
Acknowledgements
This work contains statistical data from ONS which is Crown Copyright. The use of the ONS statistical data in this work does not imply the endorsement of the ONS in relation to the interpretation or analysis of the statistical data. We would like to thank the referees for their helpful comments and the ESRC Centre on Dynamics of Ethnicity and the Runnymede Trust for their support.
Funding
This work was funded within the ESRC Centre on Dynamics of Ethnicity (Grant ref: ES/K002198/1).