
Abstract
We study the global system of information and communication technology (ICT) research and development (R&D) locations at city level by applying network analysis and profiling R&D locations with respect to technological complexity. We analyse how the position of a city in the network interacts with the level of its technological complexity. The results show that the ownership and location of R&D activities are concentrated. However, cities with high levels of R&D-centre ownership are not necessarily the most important locations of R&D activity. Instead, cities where the corporate control of R&D activities is concentrated play the role of the network hubs. We find that there is a clear relationship between the level of technological complexity and the choice of a city as a location for R&D activity and its role as a network hub. Along with the already established global cities, Chinese cities now occupy key positions in the ICT R&D network.
Keywords
Introduction
A global research and development (R&D) network is emerging as a result of multinational enterprises’ (MNEs) decisions concerning the location of their R&D activities (Dicken et al., 2001; Sachwald, 2008). An important implication of this process for both MNEs and location of R&D activity is that being connected globally is increasingly recognised as the crucial determinant of the position of individual MNEs and locations in the global hierarchy (Cantwell and Janne, 1999; Meyer et al., 2011). However, with some exceptions (Kali and Reyes, 2007), to our knowledge, the available research fails to apply a network perspective to studying the multidimensionality of MNEs’ R&D location choices. Moreover, it does not provide coherent guidance with respect to the network position and technological heterogeneity of locations (Arregle et al., 2008; Dicken and Malmberg, 2001).
Taking into account the existing gap in treating globally dispersed R&D activity as a system of interlinked activities and accounting for the heterogeneity of locations, the present study constructs a methodology to study the interplay between the network position and technological complexity of locations. This is done in three steps. First, we apply network analysis to study the globally dispersed information and communication technology (ICT) R&D centres at city level. Second, we profile cities according to the complexity of the R&D activities performed in research centres located within them. Finally, we combine the network and technological complexity dimensions of cities and assess the relationship between technological complexity and the cities’ positions in the network of R&D locations.
Literature review
The paper builds on various strands of literature. First, it relates to the body of research devoted to MNEs’ choices of location for R&D. Second, by capturing the characteristics of technological activity, it extends research on the role of diversity of locations and its consequences for the location of knowledge-intensive activities. Finally, by implementing network analysis, it links the two elements, i.e. R&D location decisions and location heterogeneity. Thus, it belongs to the group of recent attempts to introduce a systems approach to studying globally dispersed and interlinked economic activity.
The issue of R&D location choice and R&D internationalisation has attracted considerable attention. Existing studies are either based on firm-level analysis (Boutellier et al., 2008; Florida, 1997) or they analyse MNEs’ location choices and subsequent internationalisation of R&D from the perspective of relationships between individual countries (Belderbos et al., 2006; Nepelski and De Prato, 2012; Patel and Pavitt, 1991). The studies of R&D internationalisation seek an explanation behind MNEs’ decisions to establish R&D activity abroad in the heterogeneity of locations. Hence, MNEs are said to build up R&D capacity abroad either to exploit their current technology assets or to look for new ones (Kuemmerle, 1997). However, despite the abundance of literature discussing the importance of knowledge acquisition by tapping into foreign resources, empirical evidence shows that firms tend to focus the work of their foreign technology centres on those domains in which they are strong at home (Patel and Vega, 1999). In this paper, we take up the issue of technological heterogeneity and seek an explanation of how it relates to a city’s position in the network. Moreover, this study focuses on the city as a unit of analysis and, thus, increases the level of granularity.
Along with other studies, our work uses network analysis to study R&D locations. This is driven by the fact that, owing to the differences between locations and knowledge stickiness, connections emerge between them. This, in turn, creates such externalities as increased competition for knowledge and technology resources or technological spillovers (Dunning, 2009; Enright, 2009). To understand these interdependencies, network analysis to study R&D and innovation has been introduced by looking at, for example, co-patenting (De Prato and Nepelski, 2014; Han and Park, 2006; Lai et al., 2014; Stefano and Francesco, 2004) and bibliometrics (Glänzel and Schubert, 2005; Glänzel et al., 1999; Kretschmer, 2004). Similar to the current study, some works map the architecture of the global R&D network by zooming in at the level of individual cities (Matthiessen et al., 2002, 2010).
By focusing on the city as a unit of observation, our work is also closely related to the research on the global city. The term ‘global city’ was coined by Taylor who argues that world cities generally form a city network (Taylor, 2001). This concept of a city in a global network has received considerable attention (Taylor et al., 2002, 2014). Acknowledging how important knowledge-related factors are in the development of a global city and its competitiveness and, hence position in the global economy (Lever, 2002), the subject can be narrowed to that of knowledge-based city (Simmie and Lever, 2002). This work builds on these approaches to studying the globalisation of R&D and extends them by looking at how technological specialisation relates to a city’s position in the global R&D network.
Modelling the network of ICT R&D locations and their technological complexity
Cities hosting ICT R&D centres as a network
In this paper, we follow the approach of constructing a global city network proposed by Taylor (2001). In this framework, the world city network is formed by cities as nodes. Thus, an intuitive way of representing cities hosting ICT R&D centres (nodes) as a network is by connecting two cities that share an R&D centre through location and ownership relationships (arcs). In this context, we can define the measures of cities’ centrality in the following way:
In-degree is the total number of connections city i maintains through the ownership of R&D centres located in a different city than companies owning them.
Out-degree is the total number of connections city i maintains through hosting R&D centres that belong to companies located in a different city.
Technological complexity
Following an approach to the study of complex economic systems (Hausmann and Hidalgo, 2009), in our study of the technological complexity of a city we use information on the type of R&D activity performed in R&D centres based in the city. By R&D type, we mean distinct activities with common traits that distinguish them as a class. For example, hardware and software research activities belong to different R&D types. The technological complexity of R&D activity is captured by the concept of a city’s diversification, i.e. the number of R&D types performed in all R&D centres located in the city, and the ubiquity of these types, i.e. in how many other cities, on average, these R&D types are performed.
To operationalise these two concepts, we define the Mct adjacency matrix, which includes the connections between cities and the R&D types that are performed in the R&D centres located in each city, in the following way:
Mct = 1 if R&D type t is performed in any of the R&D centres located in city c, and
Mct = 0 otherwise.
The diversification level of city c is the sum of all distinct R&D types that are performed in any of the R&D centres located in that city:

The ubiquity of each R&D type t is the sum of Mct over all cities:

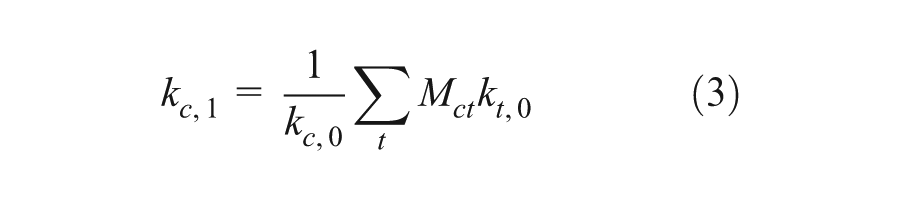
This allows us to estimate the average ubiquity of R&D types performed in R&D centres located in city c as:
In the following analysis, we use the above-defined measures to profile cities with respect to their technological complexity.
Data
We use a company-level dataset with 3154 R&D centres belonging to 171 MNEs located in 807 cities in 54 countries (see Table 1). The data were collected by iSuppli, 1 an industry consultancy, to map the ICT R&D centres of MNEs considered to be major semiconductor influencers, i.e. the largest manufacturers of applied electronic and microelectronic products. Owing to the scope of R&D activity, i.e. mainly hardware and software, the R&D centres deal mainly with ICT-related technologies. The current study uses the 2012 version of the iSuppli dataset.
Indices of the network of ICT R&D locations.
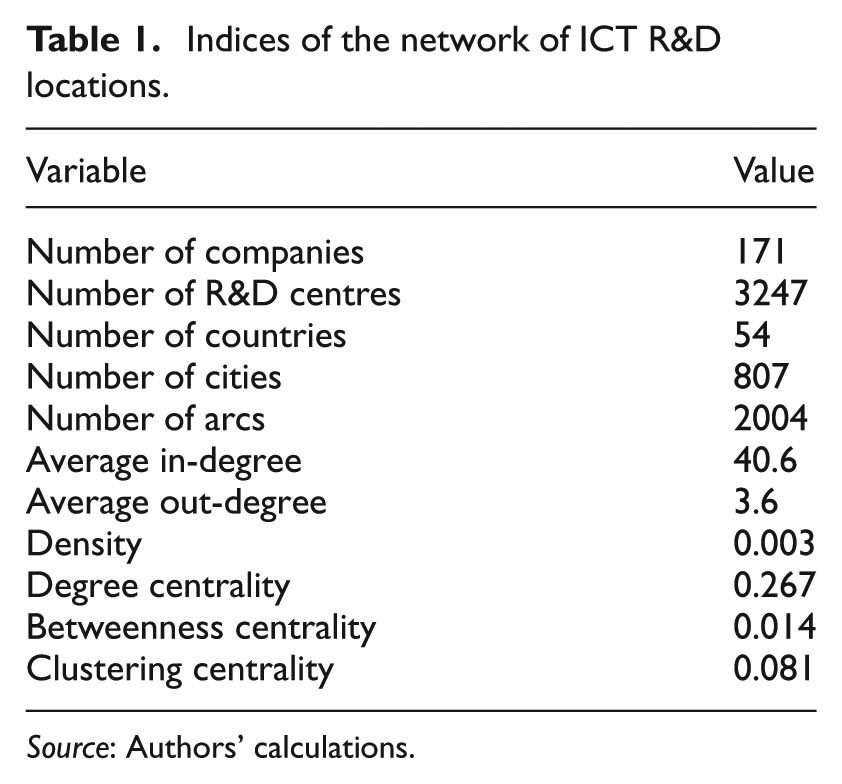
Source: Authors’ calculations.
To check the sample’s representativeness in terms of large ICT MNEs, we compared it with the R&D Scoreboard, 2 a list of the top 2000 R&D investors worldwide, and the list of patent applicants of the United States Patent and Trademark Office (USPTO). The sample represents 30% of the 2008 R&D budget of all companies included in the R&D Scoreboard and more than 30% of patent applications filed to the USPTO in 2009. This confirms that the sample is representative for the population of large ICT firms.
Regarding the level of observation, the original dataset uses ‘city’ as geographical information on the location of R&D centres. However, the term ‘city’ is defined in a number of ways and this type of classification poses analytical problems concerning the comparability between various units of analysis (Matthiessen et al., 2002). This is clearly illustrated by, for example, Tokyo and Palo Alto. While the first has over 13 million inhabitants, the latter has only 65,000. Another important point concerning the level of analysis is the fact that by adopting a city perspective, we overlook its spatial context. This again is very clearly visible in the case of Palo Alto, a small city located in the centre of Silicon Valley, the world’s main hub of ICT activity.
In order to overcome the problem of comparability of distinct territorial units, we aggregate neighbouring cities into Functional Urban Areas (FUA). This is done by using the method of defining FUAs developed at the Organisation for Economic Cooperation and Development (OECD, 2013). This methodology is applied to 29 OECD countries and lists 1179 FUAs of different sizes. In our case, the aggregation of the data leads to the reduction of the distinct units of observation from 1345 to 807.
Characteristics of the network of ICT R&D locations
Table 1 summarises the measures of the network. The value of the network density parameter is 0.003. Thus, the network is not regular and it is incomplete. This is partly related to the sample size. A larger sample introduces the issue of greater inequality between the units, which results in low network connectedness. This is exemplified by, for example, another study of the world city network, where the sample size was much smaller (Taylor et al., 201). In addition, this low level of connectedness is also a result of the choice of the unit of analysis and the number of cities in the sample. For example, trade or research networks with countries as nodes report densities between 0.38 (De Benedictis and Tajoli, 2011) and 0.06, respectively (De Prato and Nepelski, 2012, 2014).
The betweenness and clustering centralisation measures show that the network is very dispersed, with nodes clustering between themselves into small ‘cliques’. Thus, the network does not have a dominant gatekeeper and cities form tightly connected subgroups linked through the hubs.
Figure 1 represents the current network. The arcs reflect the relationships where companies from one city own R&D centres in another city. The arcs are weighted by strength of the links. To make the graph more readable, we limited the set of cities to those that host at least ten R&D centres. This network includes 68 nodes, which have 643 links. In other words, 8% of all nodes account for 32% of all the links in the global ICT R&D network. The density of the reduced network is 0.071, as compared with 0.003 for the full sample. Thus, cities belonging to the subnetwork are better connected among each other, than cities with fewer R&D centres.
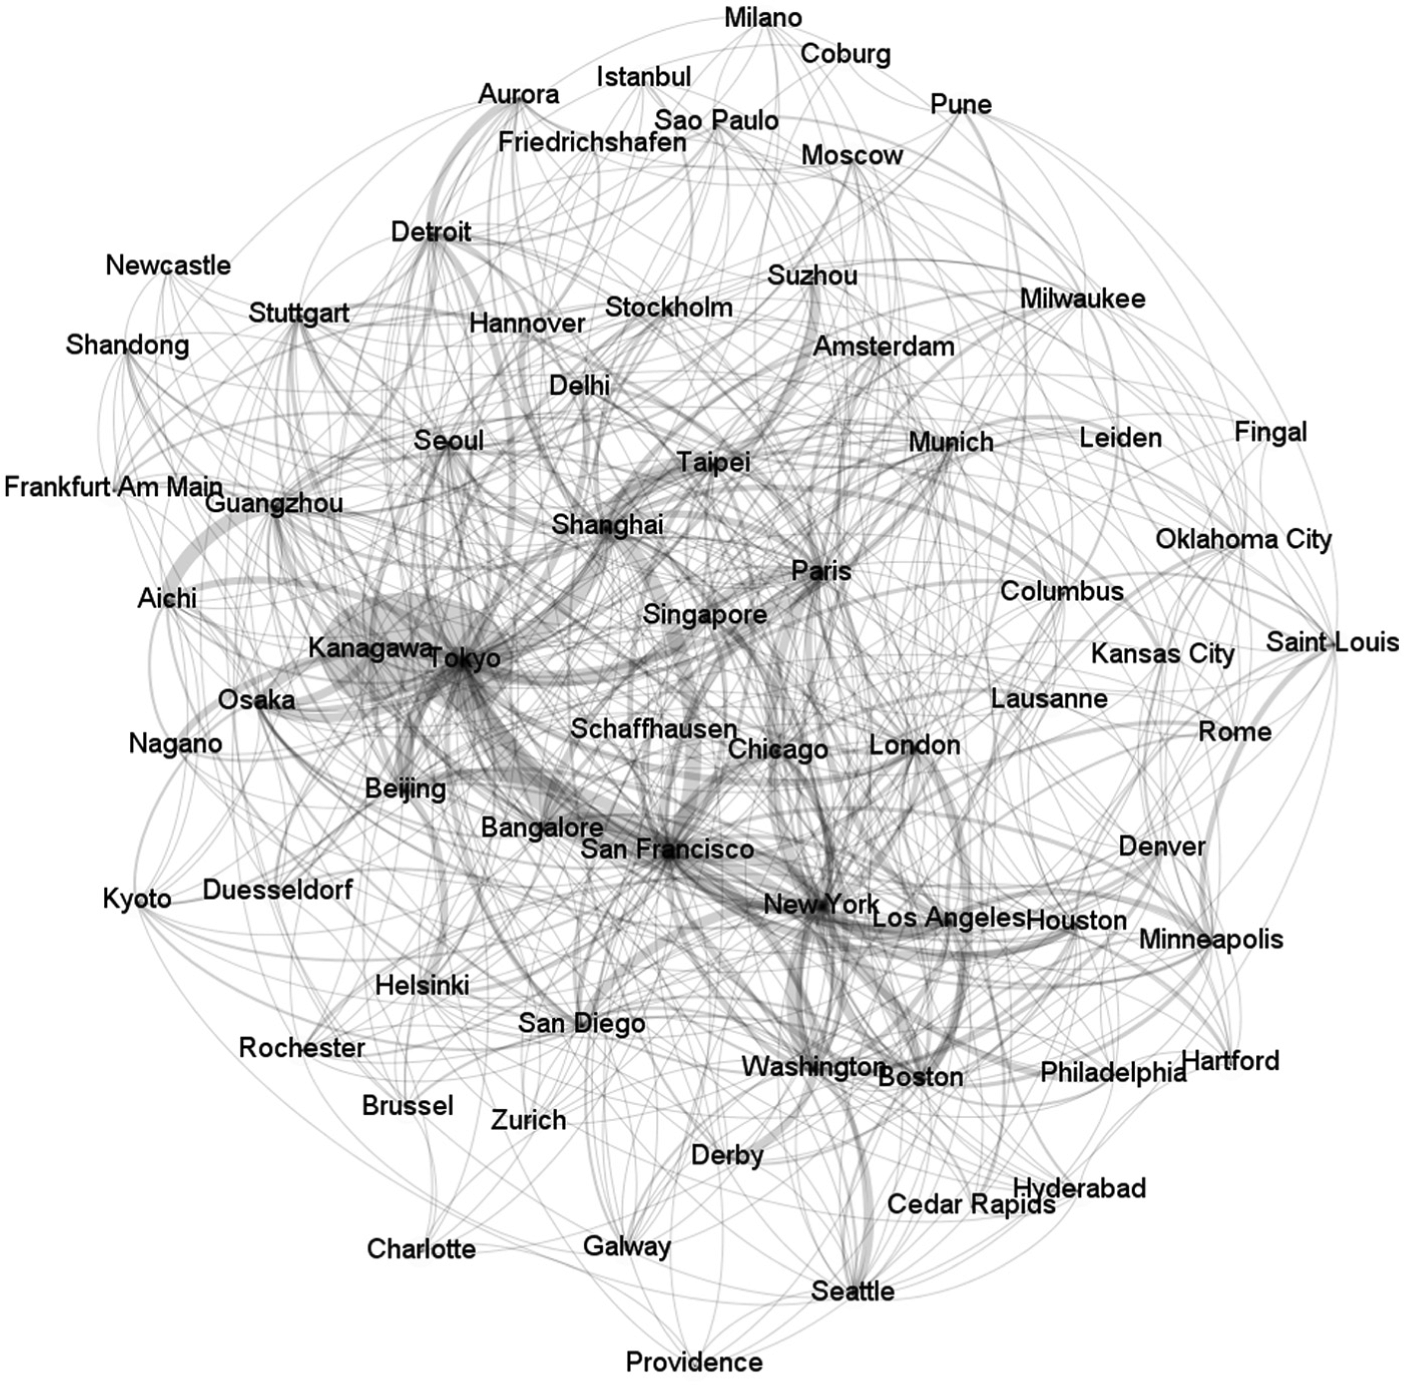
Network of cities hosting ICT R&D centres.
Connectivity, betweenness and clustering
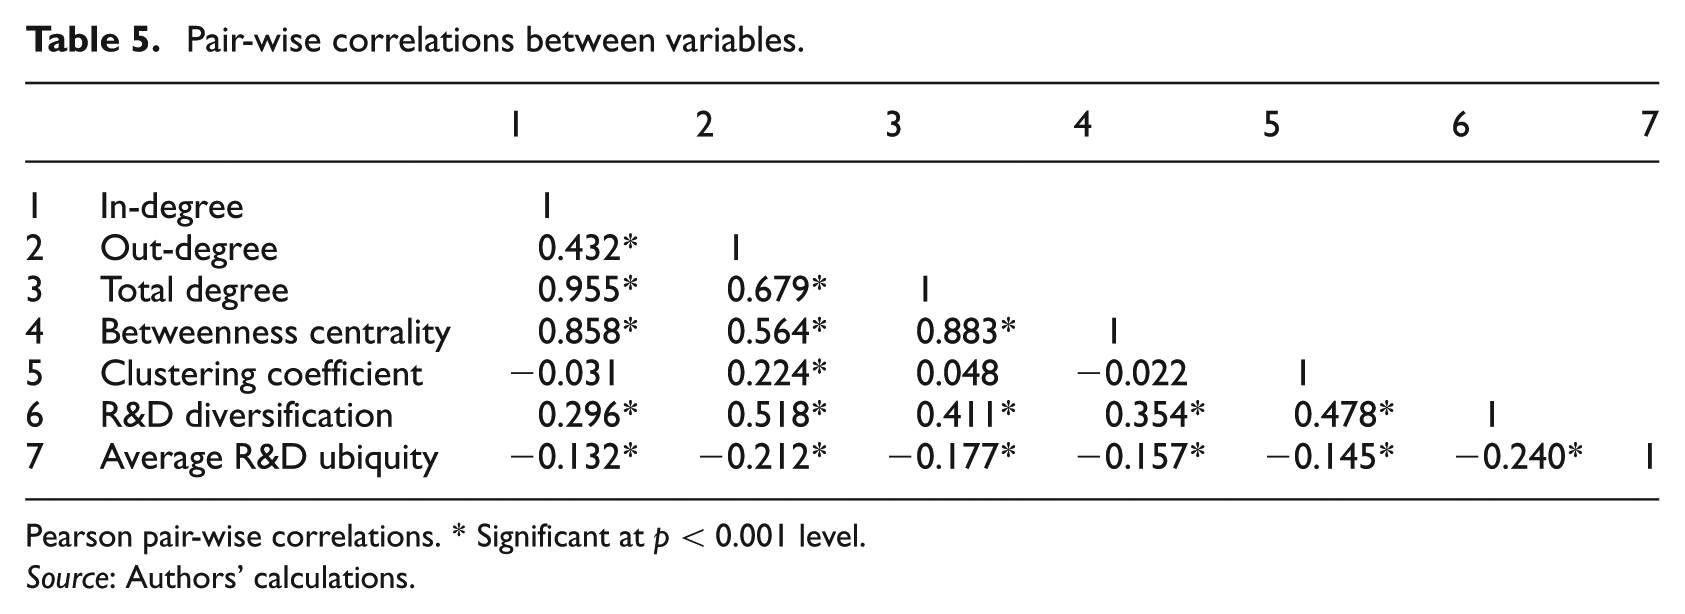
Concerning the connectivity level of nodes, the value of the in- and out-degree parameters are 40.6 and 3.6, respectively (Table 1). As illustrated by the probability distributions of both measures, the ownership and location of R&D centres are very concentrated (Figure 2a and b). There are very few cities which have firms that own large numbers of R&D facilities, and relatively few that host such facilities. Interestingly, ownership and location of R&D centres are not very strongly correlated, i.e. the correlation coefficient of the two measures is 0.43 (Table 5, see Appendix). In other words, the location of corporate control of ICT R&D activities is distinct from the location where such activities take place.
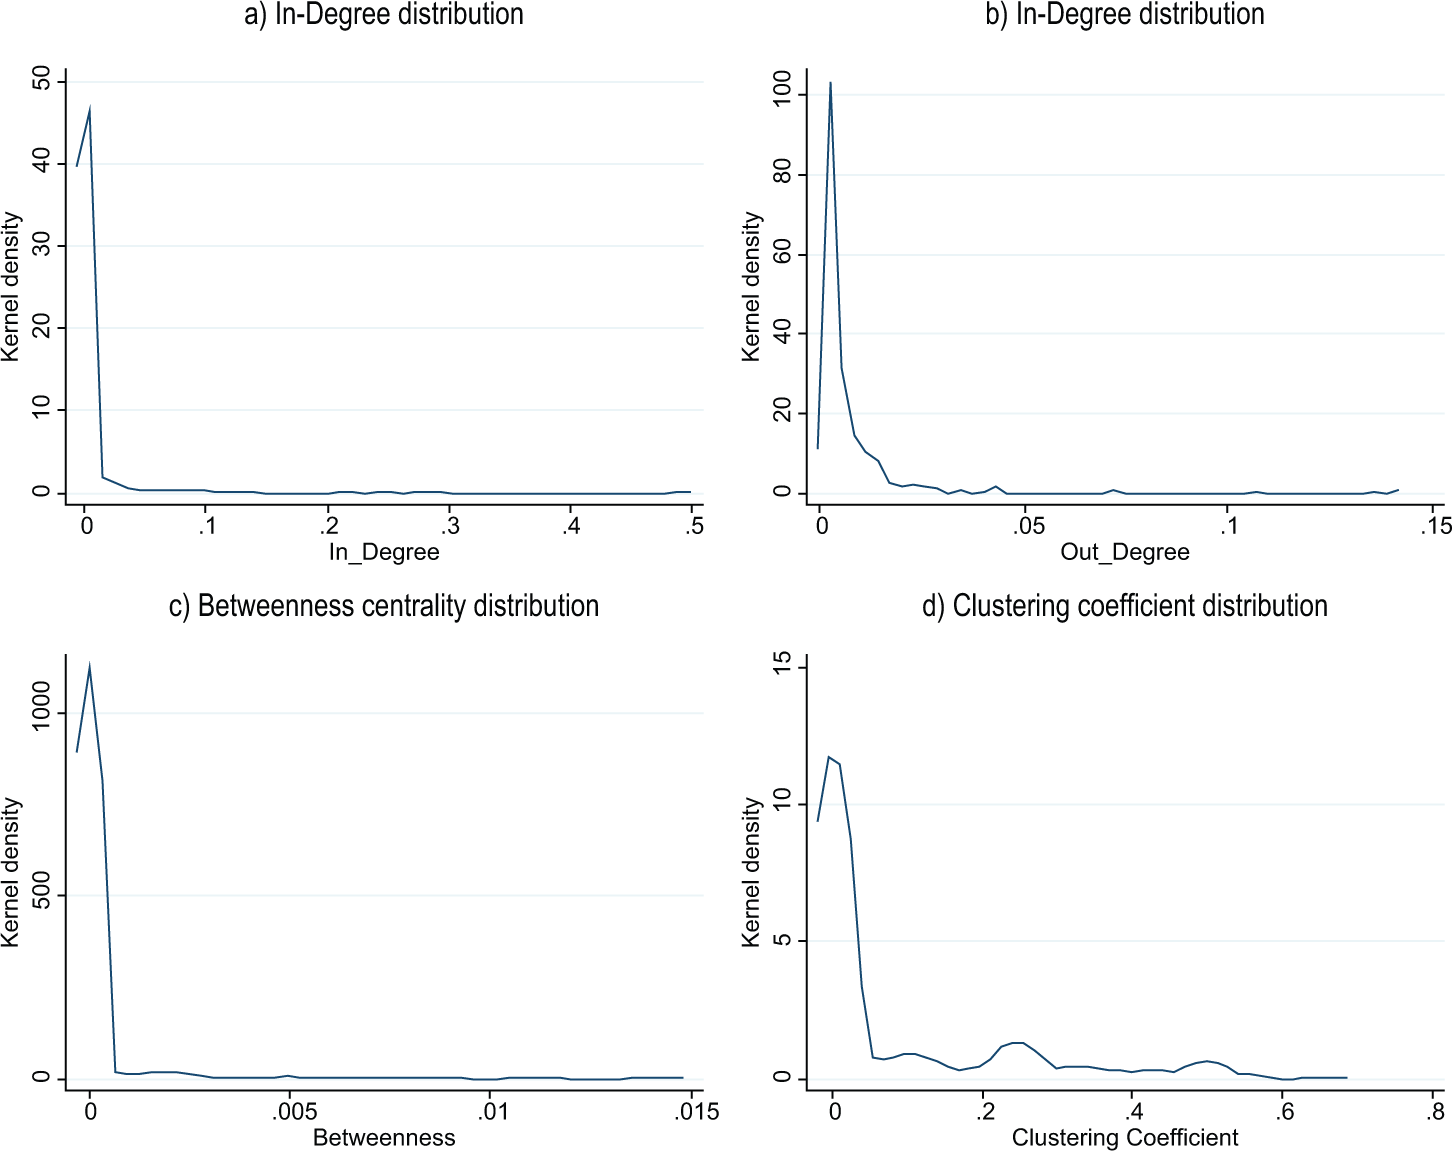
Distribution of the key network measures.
The distribution of the betweenness centrality index, which tells us about the ‘hub’ role of a node, is positively skewed (Figure 2c). In other words, there are a few cities at the core of the network that are connected with many other members of the network, and numerous cities that are connected only to the core cities. These cities play the role of the network’s hubs. According to Table 5 (see Appendix), cities belonging to the group of the network’s hubs are mainly those with high in-degree. These structural properties of the network indicate that there are qualitative differences between the cities and the functions they have in the network, and that cities where the ownership of R&D centres is concentrated are the hubs in the network.
The clustering coefficient reveals how much the partners of a node are connected among themselves, i.e. how nodes cluster in groups (Figure 2d). From the point of view of geographically dispersed economic activity, the issue of node clustering is very informative, because networks with strong clustering properties are likely to reflect strong geographical structure in which short-distance links count more than long-distance ones. In our example, the value of the clustering coefficient is 0.081, which is significantly higher than the network density (Table 1). Thus, in contrast to a random graph where the clustering coefficient would be expected to be equal to network density, the network of cities hosting R&D centres is significantly more clustered than if the links were generated at random. It can be said that cities establish R&D relationships with cities which belong to the same group or cluster. This type of clustering behaviour suggests that ‘local’ links tend to play an important role. However, it must be noted that ‘local’ links do not necessarily imply geographical proximity and that instead, this can be interpreted as a pattern of interaction with the ‘usual suspects’, who may represent either cities belonging to some regional group or cities at a similar level of development.
Cities’ positions in the network of R&D locations
Regarding the positions of cities in the network, Table 2 shows the values of in-, out-, total degree and betweenness for the top 20 cities in each category. The in-degree ranks cities in terms of corporate ownership and control of R&D centres located around the world. It is a measure of incoming connections, in the form of R&D centres which are owned by companies located in a particular city, and which are located in other locations. Here we can see that along with Tokyo, US and European cities are at the top of the ranking. Interestingly, the Chinese city Guangzhou appears to be a meaningful receiver of R&D services from other locations and its level of in-degree places it ahead of cities such as Taipei or Seoul in Asia or Stockholm and Helsinki in Europe.
Cities’ position in the ICT R&D locations network.
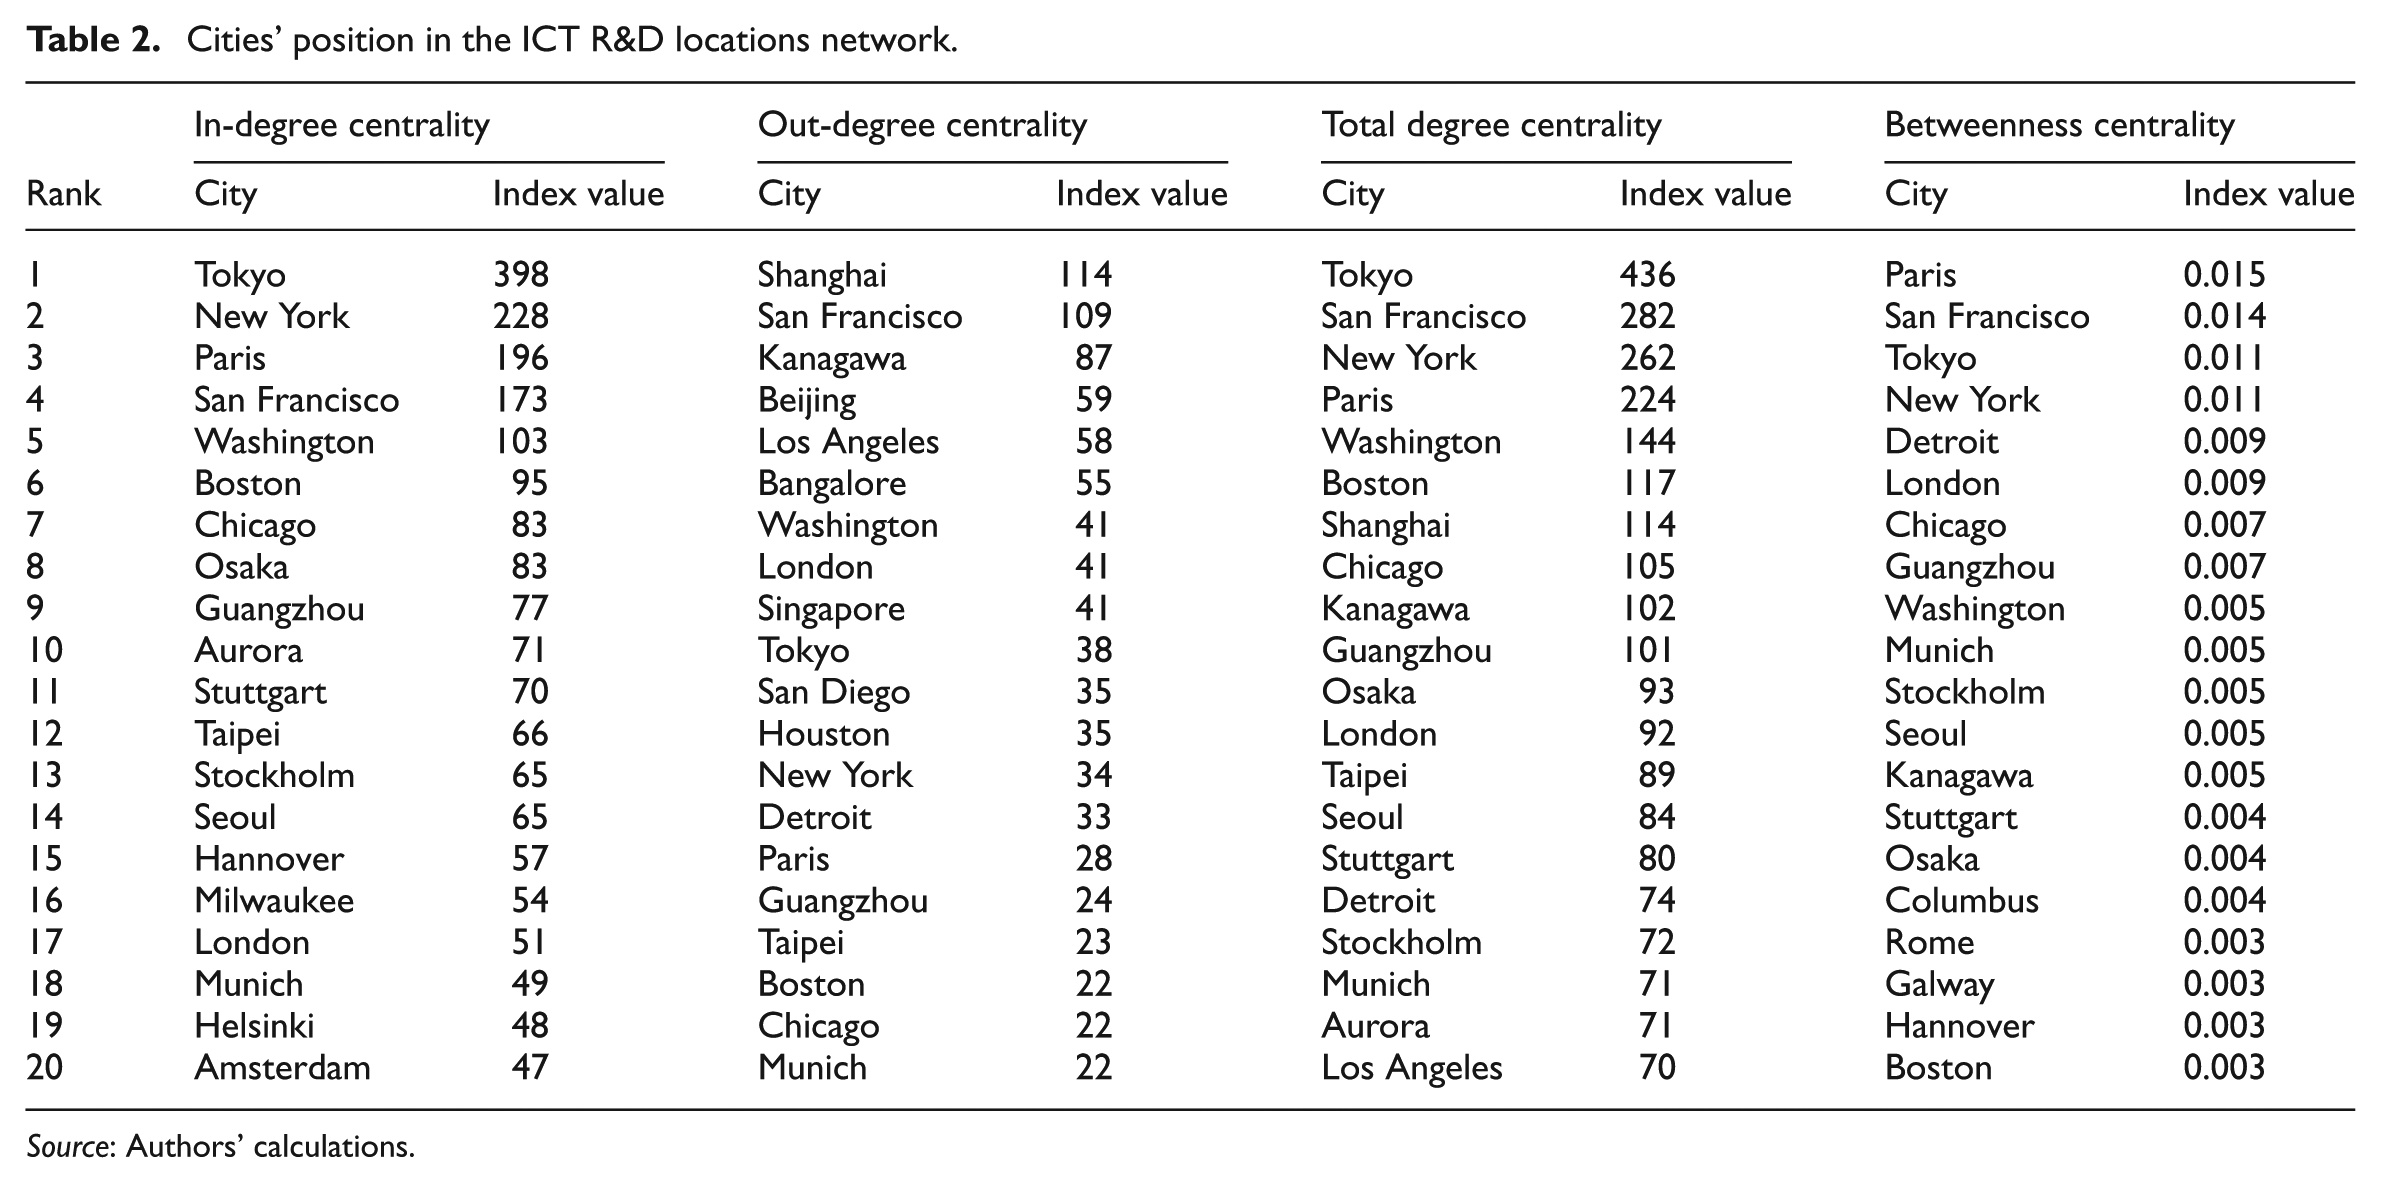
Source: Authors’ calculations.
Regarding the level of out-degree (which reflects the number of R&D centres located in a particular city), three cities lead: Shanghai, another Chinese city; San Francisco, representing here the Silicon Valley; and Kanagawa, the main location of ICT R&D activity in Japan. Interestingly, the ranking also includes two other Chinese cities (Beijing and Guangzhou) and Bangalore. This confirms the increasing attractiveness of Asia as a location for R&D activities by foreign companies (De Prato and Nepelski, 2013).
The betweenness centrality index in Table 2 shows a ranking that reflects the position of a city as a core node or a hub in the network of international R&D centres. Here we can see that the ranking is dominated by European and US cities such as Paris, San Francisco, New York or London. Tokyo also plays a relatively strong intermediary role.
We observe structural differences in the characteristics of the cities in the ICT R&D network. It can be said that there are three groups of cities. The first group includes cities in which the ownership and control of R&D centres spread around the world is concentrated. This group mainly includes US and European cities, together with Tokyo. Interestingly, many of these well-connected cities are also found at the core of the corporate power group in the world city network (Taylor et al., 2002). The second group consists of cities that are the primary locations of R&D activities, e.g. Shanghai, San Francisco representing the Silicon Valley, Kanagawa, Beijing and Bangalore. The last group is composed of cities that, because of their strategic position in the network, and not the number of R&D centres located or owned by companies based in them, can be considered to be hubs of the network of R&D cities. This last group is dominated by US and European cities. Thus, looking at the composition of these cities, we would also expect them to play the role of ‘regional hubs’, bringing together other cities from the same region with remote cities. This rough classification is consistent with the notion of diversity and power in the world city network (Taylor et al., 2002).
The analysis of the cities ranked by different centrality measures shows that the major cities in the current network overlap to some extent with those found in other studies. These studies report that cities such as Tokyo, Paris or London hold very strong positions in global networks (Taylor et al., 2002). At the same time, however, we can observe that there are a number of other strong cities that are not covered by other studies. This might indicate that there are different types of global networks, some of which overlap with each other.
Technological complexity of cities
Table 3 presents the rankings of cities based on R&D diversification and the average ubiquity of R&D types at city level as defined in (1) and (3), respectively. The first ranking shows two groups of cities: the first includes those which have levels of R&D diversity equal to or above 5. The second ranking lists cities with the lowest levels of average R&D ubiquity. As we can see, there are only two cities with the highest level of R&D diversity, i.e. Aichi and Shanghai. R&D centres that are located in these two cities cover seven out of nine possible R&D types. As the number of R&D types performed in R&D cities decreases, the number of cities in a group increases. The ranking of R&D ubiquity shows that the lowest average R&D ubiquity is 18, and that there are only a few cities with relatively low R&D ubiquity, as this number increases very rapidly.
Technological complexity of cities.
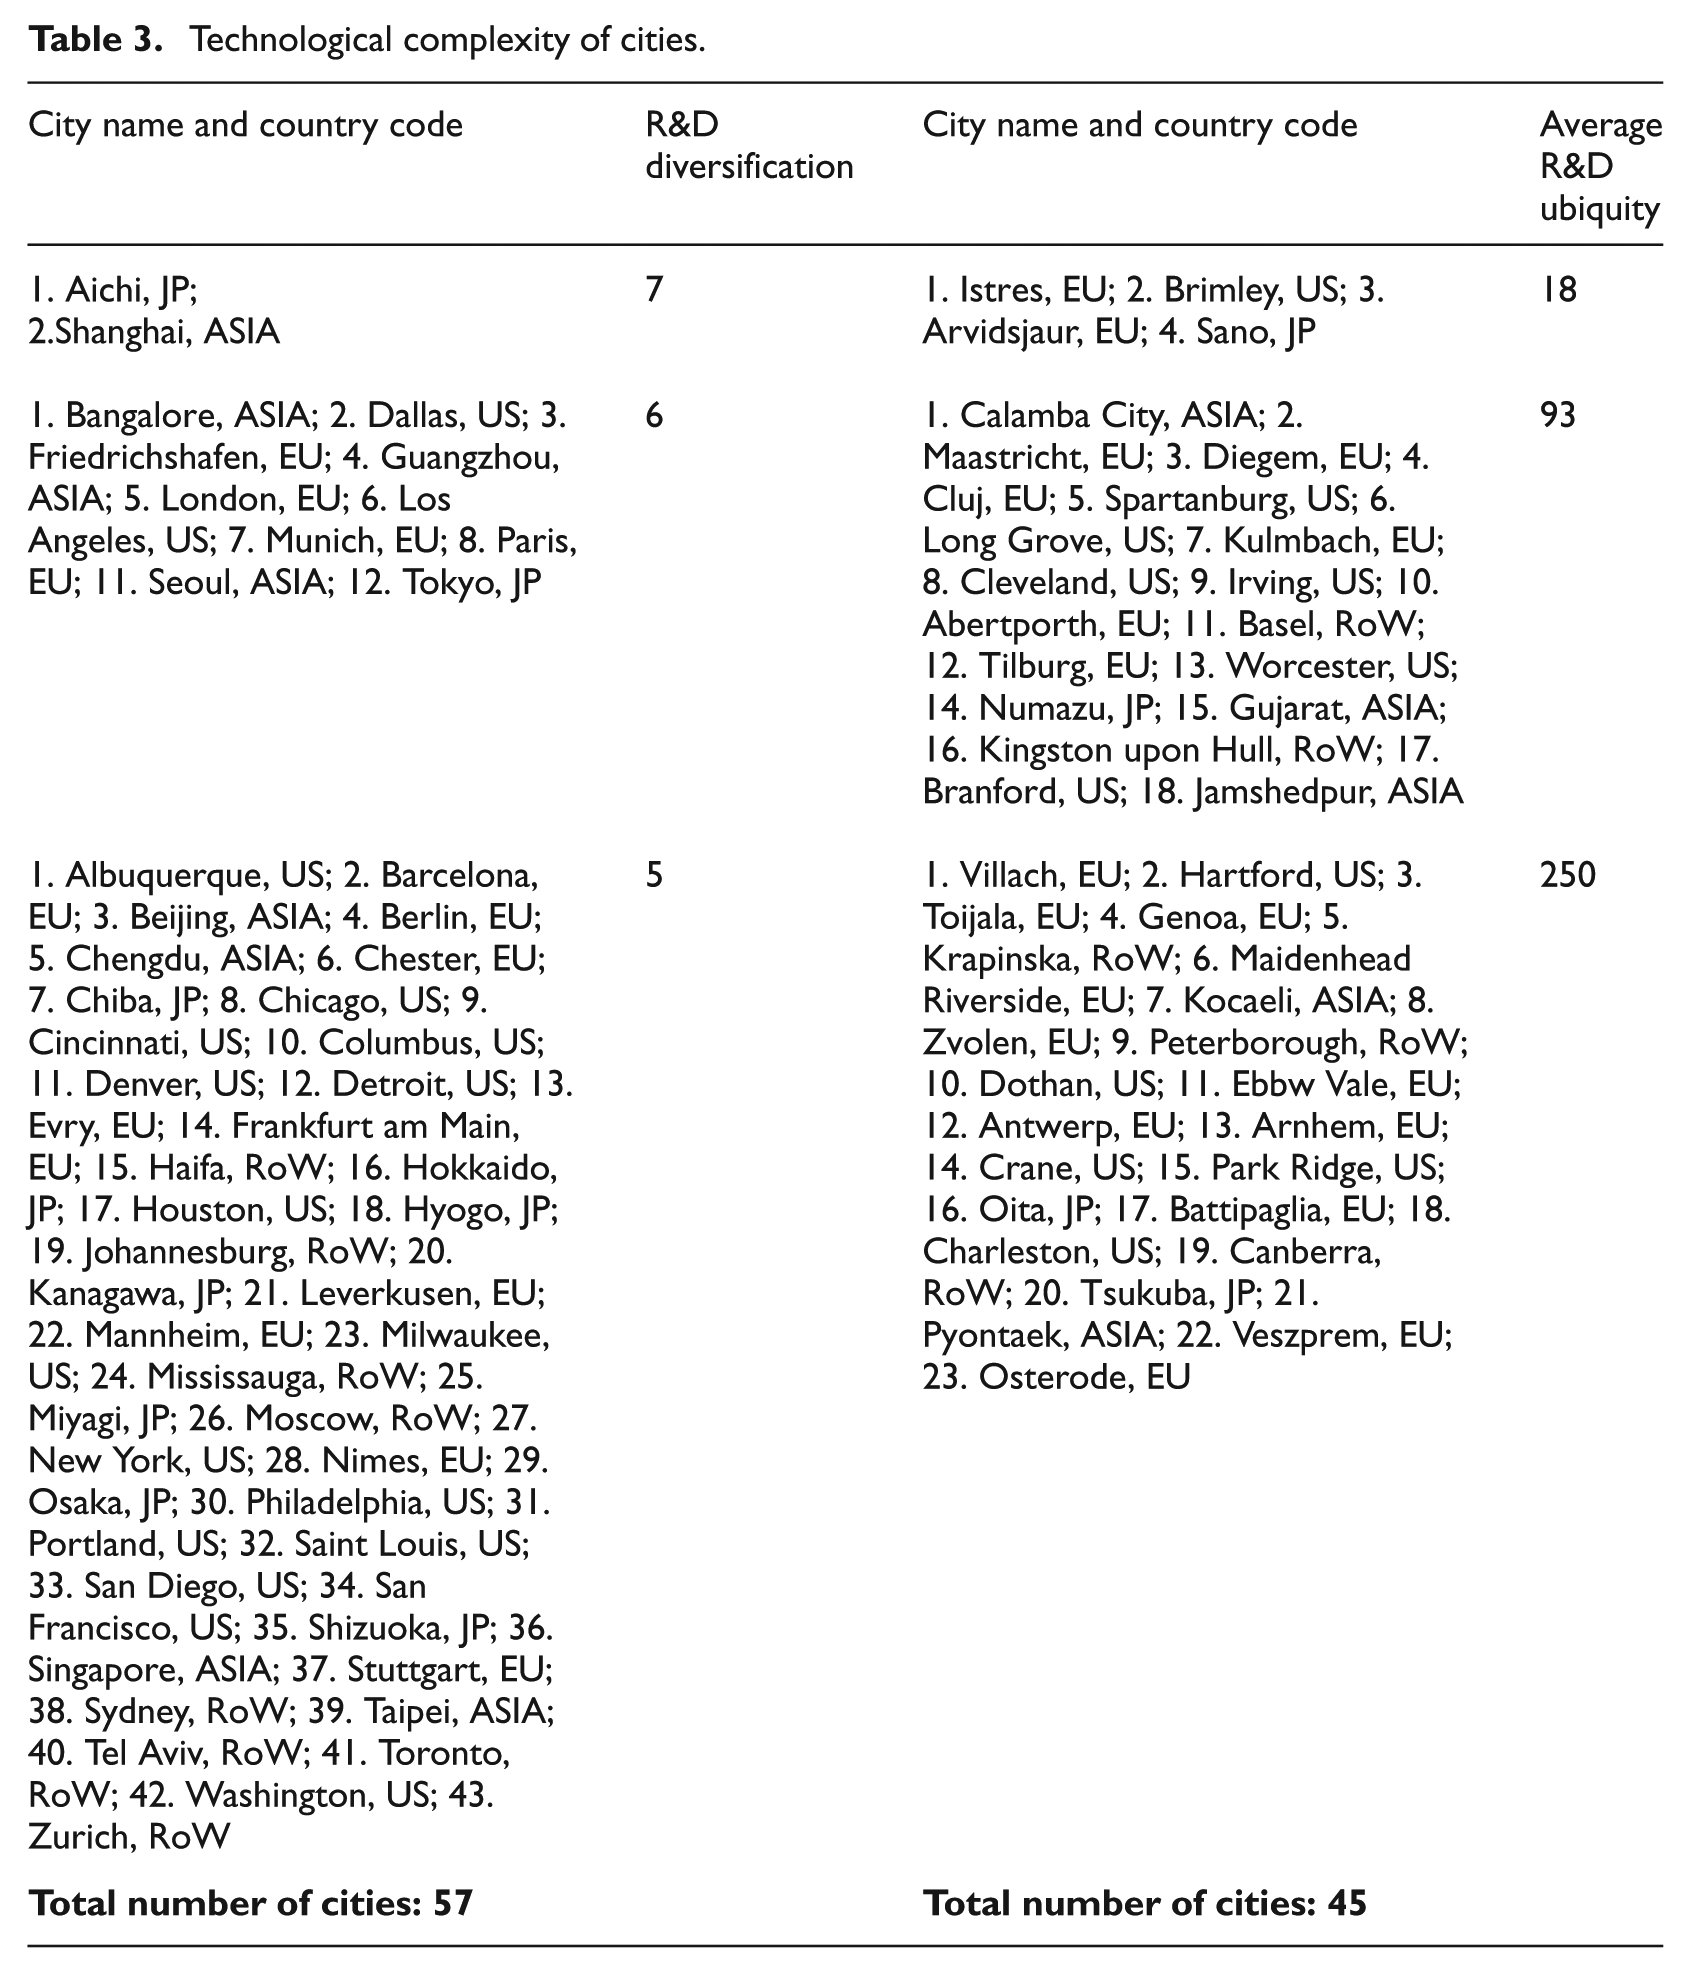
According to this list, the cities with the highest levels of R&D diversity are mainly large cities. On the other hand, however, we can see that the average R&D ubiquity ranking includes rather small cities. As this ranking places R&D activity in a city in the context of all the remaining cities, it shows that there are a small number of locations that specialise in very unique and not ubiquitous activities.
Although there is no straightforward relationship between the level of city technological diversification and the ubiquity of R&D types performed in a city’s R&D centres (correlation: −0.24; Table 5, see Appendix), deviations from the expected negative relationship between diversification and ubiquity can be very informative. For example, R&D centres based in Wrocław, Poland, and Oxford, UK, focus their activity on the same number of R&D types, i.e. kWroc,1 = kOx,1 = 3. However, the R&D types performed in Wrocław’s R&D centres are more ubiquitous. That is, they are performed in a larger number of cities than those in which Oxford’s R&D centres specialise (kWroc,0 = 500 vs. kOx,0 = 314). Thus, owing to the scarcity of some R&D types, the structure of the technological activity located in Oxford is not only very different from those of Wrocław but is likely to be more complex. Thus, the analysis shows that the R&D centres located in some cities are more diversified and also tend to concentrate on less ubiquitous R&D types, i.e. activities which are sourced from few locations. At the same time, there is a group of cities whose R&D centres are weakly diversified and which specialise in activities that are also performed in a number of locations.
Technological complexity and network position
In the preceding analysis, we examine how the position of a city interacts with the level of technological complexity performed in the city. We apply classification and regression tree analysis (CART), a nonparametric technique that uses a method which allows us to segregate individuals into different groups that show significantly different characteristics (Breiman et al., 1983). This method reveals interactions between variables and chooses those that are most important in determining the outcome variable to be explained. An advantage of CART is that it identifies relevant predictors and detects higher order, while avoiding multicollinearity problems (Breiman et al., 1983). Examples of areas in which this method is used are medical research (Zhang and Singer, 1999), corporate finance (Timofeev, 2004) or management (Haughton and Oulabi, 1993).
The first variable we test is the out-degree and the second the betweenness centrality of a city. The predictors included in both tests are the measures of R&D diversification and ubiquity at city level as defined in the section ‘Technological complexity’. In addition, we control for the city’s origin with dummy variables indicating whether a city belongs to one of the following regions: Asia, the EU, Japan, the US or the rest of the world (RoW). In the classification process, we use the least square method.
Figures 3 and 4 show both classification trees. The description of each tree node includes the node number, the name of the variable used as a predictor at each step together with the threshold value of the split, the number of observations remaining in each group after the decision and the mean value of the predicted variable in the selected group. In order to understand the relationship and impact of each predictor on the target variable, one needs to follow the tree branches.
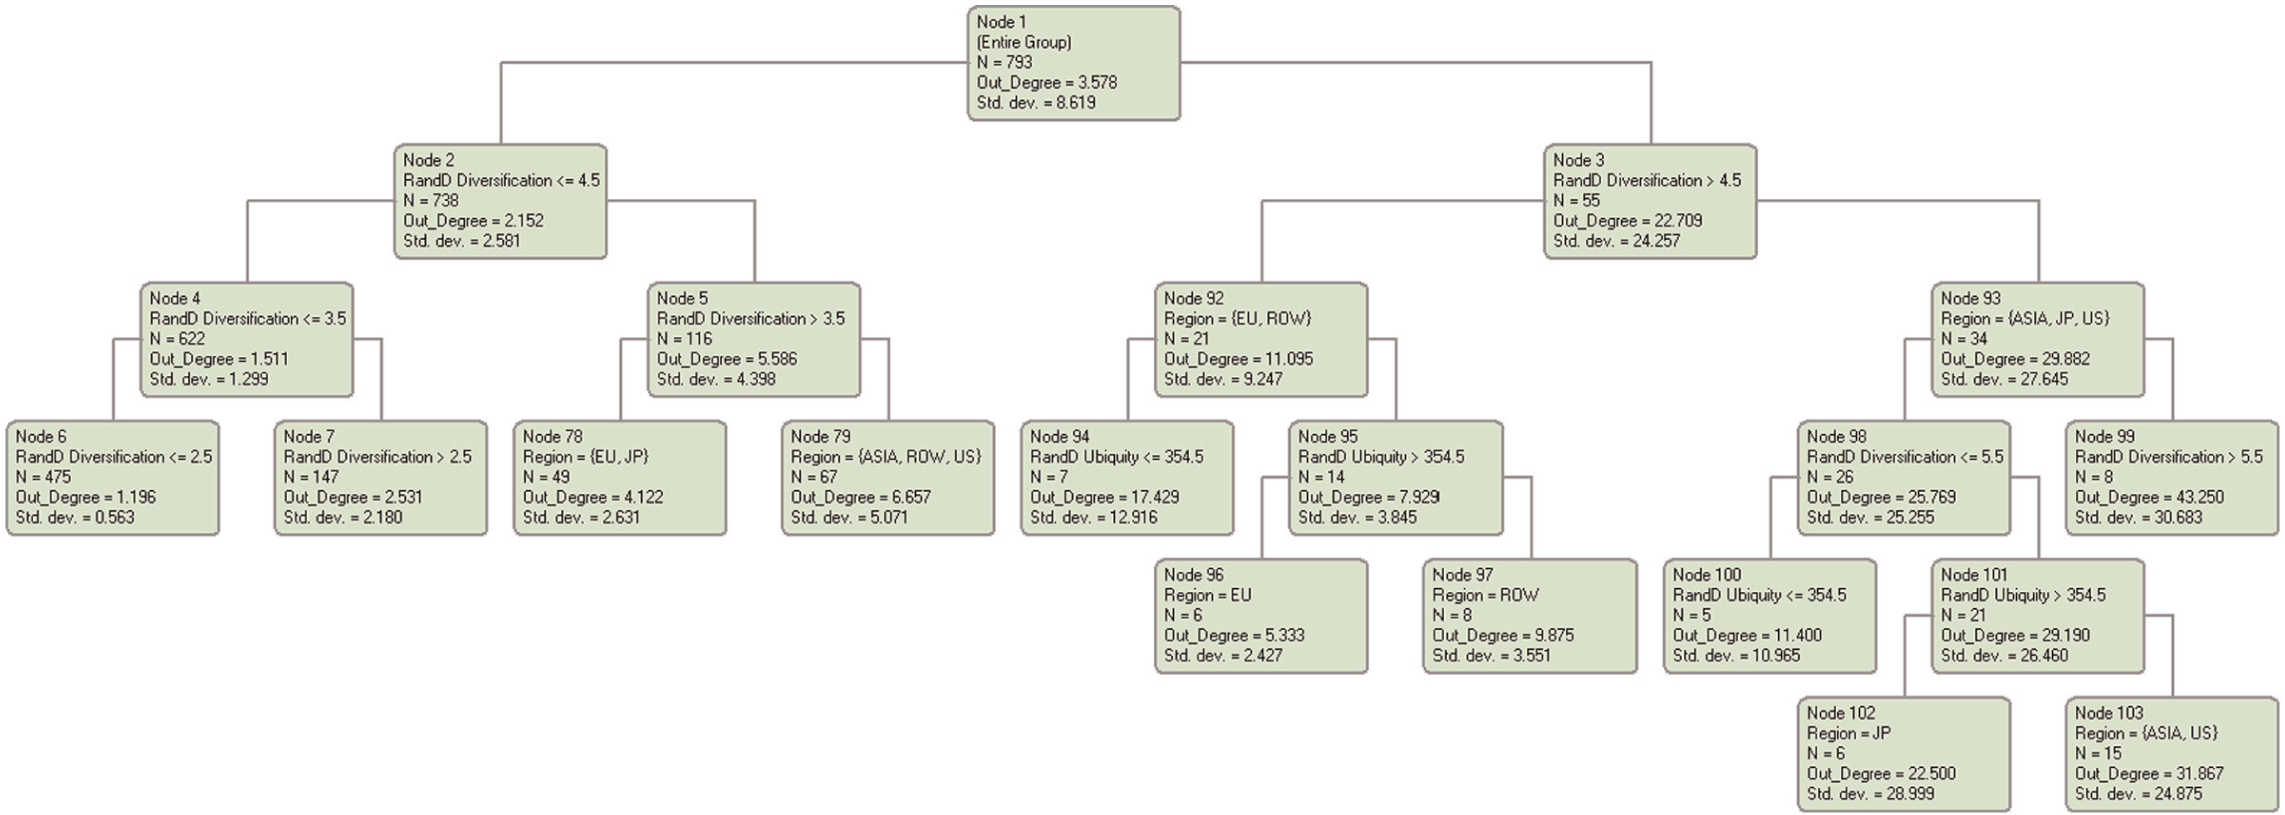
Technological complexity and city’s out-degree level.
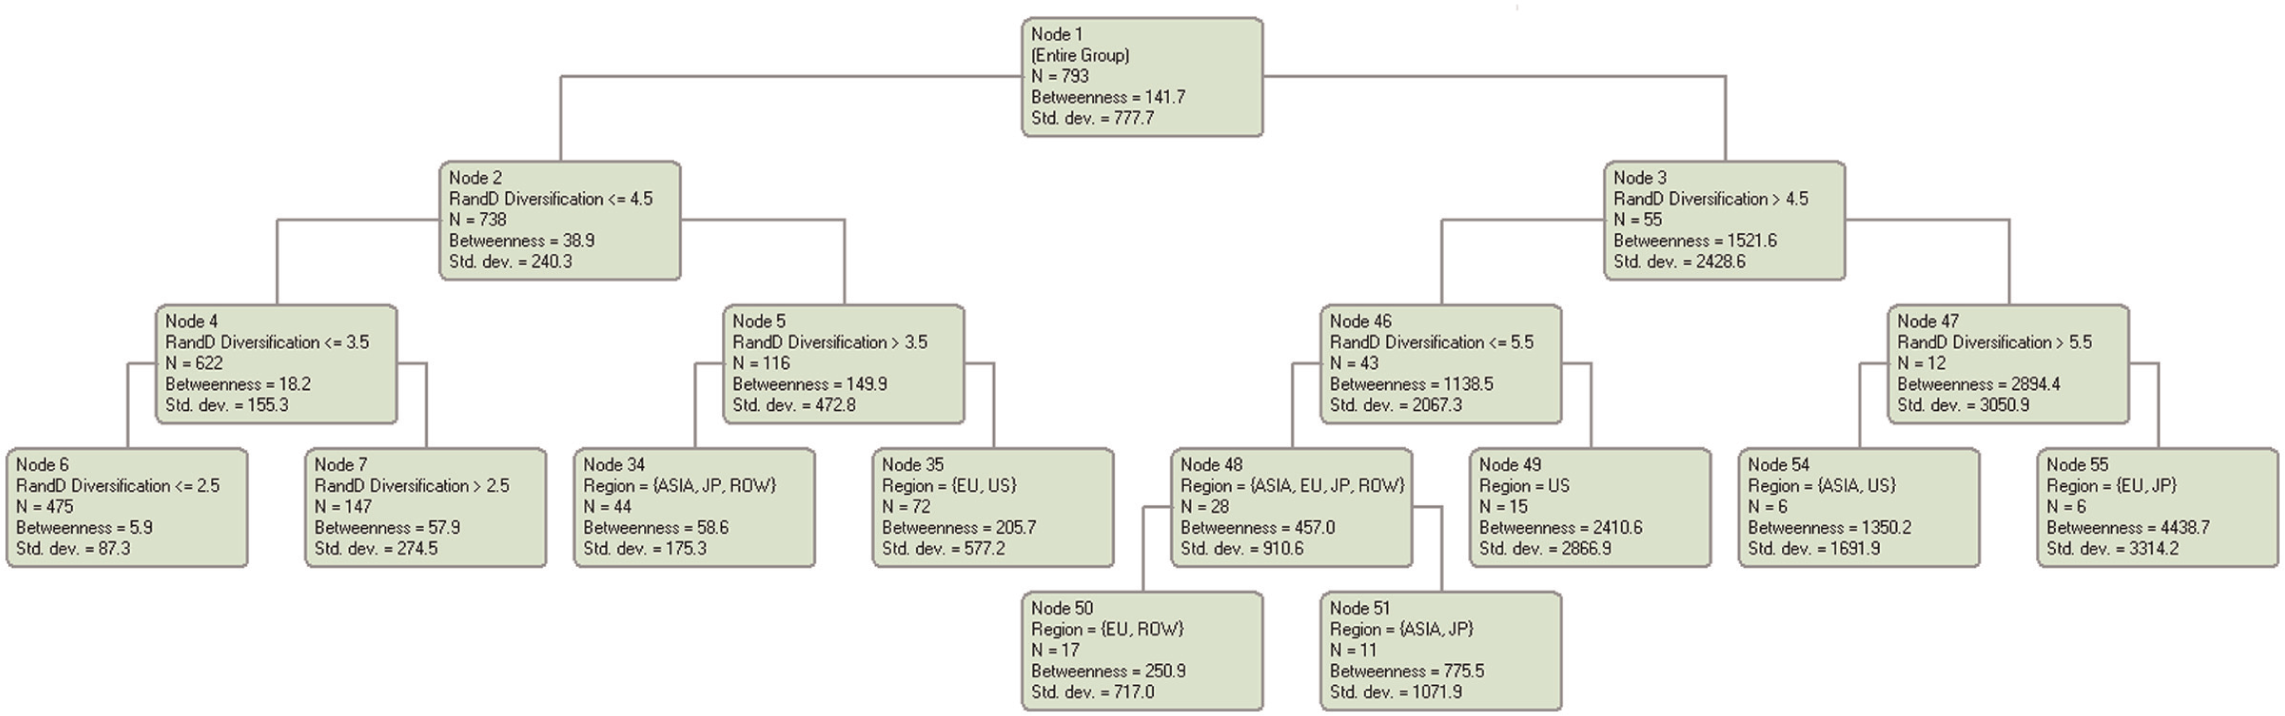
Technological complexity and city’s betweenness level.
The decision tree of a city’s out-degree was constructed by a total of 51 group splits and the full tree has 52 terminal nodes (see Figure 3). The minimum validation relative error occurs with 11 nodes. Hence, the tree was pruned from 52 to 11 nodes. The first node of the tree shows the total population of 793 cities with mean value of out-degree, i.e. the target variable, of 3576. The first split was on R&D diversification. The left node includes 738 cities with R&D diversification levels lower than 4.5; the right-hand node consists of 55 cities with R&D diversification greater than 4.5. Thus, cities with R&D diversification levels higher than 4.5 are the most likely to have the highest level of out-degree. In other words, there is a very high probability that they are selected as a location for R&D centres. Following the tree further, one can see that cities with R&D diversification levels below or equal to 2.5 have the lowest level of out-degree centrality (node 6). Counting 475 cities, this group is also the largest.
Cities with R&D diversification levels between 3.5 and 4.5 also constitute an interesting case of R&D locations with low levels of R&D diversification. They are split on the region variable. Here we can observe that 78 cities in this group are from the EU or Japan, with a mean value of out-degree of 4.1. In contrast, having the same level of R&D diversification, i.e. (3.5–4.5), but belonging to one of the remaining regions, i.e. Asia, RoW or the US, increases the expected mean value of out-degree to 6.7.
The relationship between the target variable and the predictors becomes more complicated when the level of R&D diversification is greater than 4.5. This group includes 55 cities. Node 3 shows that this group of cities is further split according to their region. As a result, being an Asian, Japanese or American city increases nearly threefold the likelihood of having a higher level of out-degree. Cities located in Europe and in the RoW are further split at the level of the average R&D ubiquity of the R&D types performed in their R&D facilities. Here we can see that less ubiquitous R&D types significantly increases the level of out-degree from 8 to 17.4. In general, however, Asian, Japanese and American cities, with R&D diversification levels greater than 5.5, are the most likely choices as locations for R&D activity. These cities have an average out-degree of 43 (see node 99).
Figure 4 presents the decision tree with betweenness as a target variable. The full tree has 28 terminal nodes and the minimum validation relative error occurs with nine nodes. We interpret the results of the classification analysis of the relationship between a city’s betweenness centrality and technological complexity as above.
The full sample was first split on R&D diversification with a threshold of 4.5. We can observe that there is a very large difference between the two groups both in terms of the betweenness centrality and the total number of cities. Whereas the first group has 738 cities with low levels of betweenness, the second consists of only 55 cities, which have, on average, a very high level of betweenness. Going further down the decision tree, we can see that the lowest level of betweenness can be observed for cities with R&D diversification levels smaller than or equal to 2.5. In contrast, the highest level of betweenness can be found among cities with R&D diversification levels greater than 4.5 located in Europe or Japan.
Summing up, the results show that there is a relationship between technological complexity or specialisation of a city and its network position. In particular, the level of diversification and the ubiquity of R&D activities performed in a city have a strong impact on its likelihood of being selected as the location for the R&D centre of a multinational firm. At the same time, we can conclude that the level of diversification is also related to the importance of a city as a network hub. Here, however, the origin of a city and hence other unobserved factors play an equally important role.
Conclusions
In this paper, we create a map of ICT R&D locations dispersed globally and study the position of cities in this network in order to assess how it interacts with technological complexity. By considering technological complexity as a characteristic of cities, we address the issue of diversity of location environments.
The results show that the global ICT R&D network is sparsely connected and the level of inequality between cities is very pronounced. As a result, once cities which host only a few R&D centres are excluded, there are very few locations where R&D activity is concentrated. These locations are very well connected with each other. This shows how agglomeration forces influence the location of R&D activity and, as a result, the structure of the global R&D network.
The analysed cities exhibit some structural differences and hence differ in the role they play in the network. In general, we can distinguish between three groups. The first includes locations where corporate control resides, the second contains cities that are the primary location of R&D activities and the last is comprised of cities that can be considered to be network hubs. Casting more light on the characteristics of each of the groups would be an interesting endeavour for future research.
A comparison of our results with other studies of the location of corporate control and economic activity (Taylor et al., 2002) shows that there are some similarities between the actors in the network and the roles they play. However, there are some differences in, for example, the composition of the network. This might indicate that there are different types of global networks. This raises a set of questions such as: Which cities play the role of gatekeeper between different networks? How do they link them? What is their role in the global system of interconnected activities?
The results show that cities vary considerably in terms of their technological complexity. There are two extremes. On the one hand, there are two unique and small groups: one group consists of large and diversified cities and the other includes relatively small cities specialised in non-ubiquitous R&D activities. On the other hand, the remaining cities, i.e. the majority of the sample, are weakly diversified and perform ubiquitous R&D activities. Considering that there is a dependency between a city’s technological complexity and its network position, these findings have implications concerning the choice of an R&D specialisation strategy. Based on the presented evidence, we can conclude that such choices should be made while taking into account the actions of the remaining actors, which are either competitors or sources of complementarities.
The study suffers from some limitations. First of all, the data used in the study cover only a selection of companies. Second, the richness of information on R&D activities of these companies is also limited. Consequently, our ability to investigate the type of activity in detail is very restricted. Despite these constraints, the study confirms the rationale for placing the behaviour of MNEs into a geographic context and the necessity of analysing this behaviour from the perspective of the entire system, ensuring at the same time that its multidimensional character is captured.
Footnotes
Appendix
Pair-wise correlations between variables.
| 1 | 2 | 3 | 4 | 5 | 6 | 7 | ||
|---|---|---|---|---|---|---|---|---|
| 1 | In-degree | 1 | ||||||
| 2 | Out-degree | 0.432* | 1 | |||||
| 3 | Total degree | 0.955* | 0.679* | 1 | ||||
| 4 | Betweenness centrality | 0.858* | 0.564* | 0.883* | 1 | |||
| 5 | Clustering coefficient | −0.031 | 0.224* | 0.048 | −0.022 | 1 | ||
| 6 | R&D diversification | 0.296* | 0.518* | 0.411* | 0.354* | 0.478* | 1 | |
| 7 | Average R&D ubiquity | −0.132* | −0.212* | −0.177* | −0.157* | −0.145* | −0.240* | 1 |
Pearson pair-wise correlations. * Significant at p < 0.001 level.
Source: Authors’ calculations.
Disclaimer
The views expressed are those of the authors and may not in any circumstances be regarded as stating an official position of the European Commission.
Funding
This analysis was produced by the Information Society Unit at the European Commission’s Joint Research Centre – Institute for Prospective Technological Studies for DG Communications Networks, Content and Technology (Project Nr 31786-2010-06). It is part of the European ICT Poles of Excellence project jointly funded by DG CONNECT and JRC-IPTS.