
Abstract
Drawing on Boddie’s adaptive discrimination framework, this article analyzes changes in demographic trends from 2002–2021. Our findings reveal a continuation of several longstanding trends, including increased racial/ethnic diversity in public school enrollment; deepening racial isolation within districts; persistent, high isolation for Black students; high but declining isolation for white students; growing isolation for Hispanic and Asian students; and substantial variation across regions. The growth of charter school enrollment and segregation since 2002 is striking, with substantial increases in many urban areas. Seventy years after Brown v. Board of Education, these trends reveal the continued effects of adaptive discrimination via privatization.
The article examines major patterns of national, regional, and urban school segregation over the last two decades (2002–2021) in the context of resistance and legal challenges to Brown. These decades included ongoing housing segregation, isolation of urban schools by rigid school district boundaries, and funding disparities that have shaped racial segregation since the mid-1970s (Holme & Finnigan, 2018). Within this period emerged several policy factors that undermined full implementation of Brown: limitations for race-conscious student assignment policies, rapid proliferation of market-oriented policies like charter schools and high-stakes accountability, and the gentrification of cities alongside growing racial diversification and segregation in the suburbs (i.e., Welsh & Swain, 2020; Wells et al., 2019).
Our study utilizes the framework of adaptive discrimination to understand how established and new mechanisms sustain racial segregation via maintenance of race-evasive strategies (Boddie, 2016). Racial segregation in schools remains tightly linked to unequal educational opportunities and, by extension, outcomes (Linn & Welner, 2007). Further, racial segregation in schools ill prepares all students for effective participation in a multiracial democracy (Mickelson & Nkomo, 2012). We emphasize segregation by race rather than socioeconomic status because of the racially discriminatory effects of school district boundary segregation resulting from urban isolation extending back to Milliken (Holme & Finnigan, 2018) and from publicly subsidized privatization plans following Brown (Hannah-Jones, 2024) that are related to socioeconomic status but that cannot be understood separate from racialized opportunities. Our findings confirm that on the 70th anniversary of Brown, remedies to ongoing segregation must be race-conscious (Scott et al., 2023).
In the context of rigid school district boundary lines, demographic change in metropolitan areas, ongoing residential segregation and the increasing privatization of public schools, these descriptive findings offer insight into preliminary patterns/relationships of the persistence of racial segregation in U.S. elementary and secondary schools. This macro-level analytic approach provides useful information for researchers, practitioners, and policymakers as they consider what types of interventions might be useful and how we might understand the current education landscape related to demographic change and segregation (Loeb et al., 2017). In this period of shifts and challenges to a democratic, multiracial system of public education, this study serves as a baseline analysis of contemporary school segregation. A chief aim is beginning to define where to look at policy adaptations that are potentially race-evasive.
Review of Literature
School Segregation Trends in the Early Aftermath of Brown
To understand the current context of racial segregation in schools, we must understand the historical antecedents and how contemporary policies are layered upon them. In the aftermath of the delays sanctioned by the Supreme Court's guideline that school desegregation be implemented “with all deliberate speed” and litigated separately in each district (Brown II, 1955), white resistance meant little numerical desegregation progress in the South, where schools had been completely segregated. By the fall of 1965, over a decade after Brown, a national survey indicated that roughly 3% of Black first grade students attended majority white schools in the metropolitan South, compared to 8% in the nonmetropolitan South (Coleman, 1966).
Following a coordinated, albeit brief, effort to enforce Brown among the federal judicial, executive, and legislative branches during the Johnson administration (Frankenberg & Taylor, 2015), contact between Black and White students in the South increased quickly. Large, countywide districts in the South enabled significant interracial contact within school systems once courts ordered school officials to redraw attendance zones to incorporate Black and white communities (Clotfelter, 2004; Swann, 1971). By 1970, 33% of southern Black students attended majority white schools (Frankenberg et al., 2019).
Just two years later, the South began to report lowest levels of school segregation, as measured by the share of Black students attending majority nonwhite schools, with similarly low levels reported in the West (Clotfelter, 2004; Orfield, 1983). Meanwhile, school segregation began to increase in the more highly fragmented Northeast (Clotfelter, 2004) and elementary students in the Midwest, also known for having numerous small school districts within metropolitan areas, were highly segregated (Coleman, 1966).
Metropolitan Segregation Increasingly Structured by School District Boundary Lines
In 1974, Black plaintiffs in Detroit brought the issue of metropolitan school segregation to a Supreme Court altered by President Nixon's four judicial appointees, all of whom had signaled their opposition to “busing” to achieve desegregation. This meant that, only 20 years after Brown, the race-evasive doctrine of the Court adapted to upholding racist structures (Ryan, 2010). In the Midwest and Northeast, school district boundaries separating students in increasingly Black cities and overwhelmingly white suburbs limited the effectiveness of within-district desegregation efforts. Five Supreme Court justices held that inter-district remedies must be reserved for when “racially discriminatory acts of one or more districts caused racial segregation in an adjacent district, or where lines have been deliberately drawn based on race” (Milliken v, Bradley, 1974, p. 745). The bar for proving intentional discrimination remains high, effectively shutting the door to inter-district relief in most metropolitan communities.
In the wake of Milliken, school district boundaries began to structure most of school segregation. In 1970, for instance, segregation between metropolitan school districts accounted for less than 4% of total segregation; by 2000, 84% (Clotfelter, 2004, p. 61). While segregation declined within many school districts, partly because of court-ordered desegregation, Milliken and earlier federal housing policies eased white and middle class exit from urban to suburban school districts.
Between 1993 and 2010, as growing racial/ethnic diversity contributed to a decline in intergroup exposure between minoritized and white students, between-district segregation remained the most important contributor of overall racial segregation (Fiel, 2013). A subsequent study found that school segregation was highest between white and minoritized students. This was also true between different minoritized groups, when school district fragmentation was more severe and when resources like teachers were unequally allocated across schools (Fiel, 2015). In addition to the increase of school choice options, school district secession, a small but growing phenomenon of whiter wealthier districts breaking away from more racially and economically diverse ones concentrated in the South, exacerbated fragmentation and segregation (U.S. GAO, 2022).
Contemporary school segregation is also correlated with the appearance of charter schools in districts as well as separate all-charter districts that contribute to the overall fragmentation of metro areas (EdBuild, 2019). Rich et al. (2021) found that the average increase in the share of charter students related to a 12% increase in school segregation. Charter schools are more consequential for the segregation of Black students in terms of both isolation and exposure to white students (Fiel, 2013).
Demographic Inversion of Cities and Suburbs and Contemporary School Segregation
As the 21st century progressed, “metropolitan migrations” (Wells et al., 2016) also shifted the contours of school segregation. The demographic inversion of cities and suburbs has meant increasing racial/ethnic and economic diversity within many metropolitan communities (Ehrenhalt, 2012). While increased diversity within urban and suburban neighborhoods allows opportunities for more diverse schools, too often, after a period of transition, school segregation or resegregation follows (Frankenberg & Orfield, 2012). Indeed, segregation within districts has risen in recent decades (Owens et al., 2016), shaped by policies like how officials draw school attendance boundary lines and design choice plans (Castro et al., 2023). Especially in large metropolitan areas, many suburban districts are undergoing rapid racial transition, and Black and Latinx suburban students experience very low exposure to white students (Menendian et al., 2021). In 2010, if between-district imbalance had been eliminated, the typical Black student's school would have had a white student enrollment that was 13 percentage points higher (Fiel, 2013).
The U.S. public school enrollment today is far more multiracial than in the past, when a Black/white binary defined most enrollment and segregation patterns. By 2022, students of color accounted for 54% of the national enrollment, of which Hispanic students accounted for 28%, Black students 15%, Asian students 6%, multiracial students 4% and American Indian students 1% (GAO, 2022). Segregation trends vary by racial/ethnic group. Though white students continue to have the lowest exposure to students from other racial/ethnic groups, Frankenberg et al. (2019) also found a sharp decline in segregated white schools between 1988 and 2016. A study of Latino student segregation trends between 2000 and 2015 found that Latino students were less likely to attend schools with white peers in the latter years, and that they increasingly enrolled in districts with higher shares of students in poverty (Fuller et al., 2019). Research exploring segregation trends for Asian American students found increasing isolation with same race peers, though relative to other minoritized groups, Asian American students had the highest exposure to white students (Frankenberg et al., 2019). The enrollment of multiracial and American Indian students remains small; however, better understanding how these groups experience segregation is essential.
In sum, existing literature on school segregation since the early aftermath of Brown describes durable isolation for white and Black students, even as the structure of segregation has adapted. After a coordinated federal effort in the late 1960s, desegregation plans began to address patterns of segregation within districts. Once Milliken made inter-district remedies much more difficult to establish, segregation between districts increased to account for most segregation. And then, as metropolitan migrations in the 21st century have rendered city and suburban neighborhoods more racially diverse, policymakers’ strong policy emphasis on market-based choice and accountability introduced another powerful mechanism for segregation.
Market-Based Reforms and School Segregation in the 21st Century
As the U.S. Supreme Court has largely dismantled the legal framework provided by Brown to desegregate schools, policymakers and advocates across the political spectrum have justified market-based reform efforts, including school choice and greater accountability measures, as solutions to educational inequity for low-income students of color (Scott & Quinn, 2014; Wells et al., 2019). However, increased expansion of school choice, in combination with demographic and sociopolitical shifts, have resulted in growing segregation in public education (Jacobs, 2013).
The history of private segregation academies as a choice mechanism for maintaining racial segregation and resisting Brown is well-documented (Scott, 2011; Suitts, 2023). Choice has expanded further in the past two decades—including the explosion of charter schools, charter management organizations, private and religious schools, tuition tax credits, and education savings accounts (Scott et al., 2014; Welner, 2008). One cause is two recent Supreme Court rulings—Espinoza and Carson—that held states cannot deny funding to religious schools because of their religious status (Welner et al., 2023), accelerating state trends toward individualized subsidies for families exiting the public system for private schools.
Market-based solutions to racial and economic segregation wrought by Milliken disproportionately impact central city school systems. Urban education systems reflect the decades-long disinvestment, resulting in a lack of necessary resources, assisting in an exodus of middle-class and white families, and fostering the growth of market-oriented reforms to fix “low-performing” urban schools (Baker, 2016; Scott & Quinn, 2014).
Segregation in the current context of increased school choices and accountability measures function through selection, exclusion, and familial advantage (Wells et al., 2019). Research on school choice policies illustrate that as school choices and accountability measures increased, the ability and incentive for individual schools to control who attends and who is excluded increased as well (Ayscue & Frankenberg, 2018; Gabor, 2018). For instance, most charter schools use lotteries for admissions, but recruiting and marketing processes, screening, suspension and “push out” policies all may be used to manage enrollment to select students with higher test scores (Mommandi & Welner, 2021).
Of note, these market-based educational reforms are representative of the racialized and spatialized contours of privatization among urban school districts. State disinvestment of urban spaces and public education, alongside historically racist practices like discriminatory mortgage lending, have often left majority low-income Black and Latinx neighborhoods with unequal cities and schools (Scott & Holme, 2016). The broader social, political, ideological, and economic trends, such as globalization, gentrification and displacement, spatial segregation, and job market bifurcation, that created unequal conditions also undergird the educational policies that claim to address the inequality in urban schools. The rise in school closures, growth of charter schools, state-takeovers, and racial, socioeconomic, and linguistic segregation have diminished the traditional public school options and increased segregation for many minoritized and low-income students (Hahnel & Pearman, 2023; Pearman & Swain, 2017).
Conceptual Framework
The undoing of Brown occurred through the courts and because of white and middle-class resistance. White supremacist ideologies and policy interests established Jim Crow, and were behind Brown II, which stalled the enforcement of Brown I for decades (Horsford, 2019). George (2024) described legislative tactics of massive resistance: Enactment of deny, defund, and divert laws dominated southern legislatures and by 1957—just three years after the ruling—lawmakers in southern and border states enacted 136 new laws and state constitutional amendments designed to defy Brown. Resistance to the Brown ruling thus became not only the goal of southern public policy during this period, but the prevailing way in which southern law was crafted and articulated… (p. 16)
Subsequent Supreme Court rulings reduced the extent of what federal courts could order school districts to do in pursuit of school desegregation and made it easier for districts to end supervision of desegregation (Orfield & Eaton, 1996). Post-Milliken, the continuing racialized stratification of residential choices, funding inequality, and racial segregation across metropolitan areas have been a consistent reality affecting urban schools, even though most education reforms do not take this phenomenon into account (Holme & Finnigan, 2018).
Parents Involved in Community Schools (2007) further narrowed local officials’ options to racially integrate and stabilize their districts by making schools more equitable. Parents Involved limited race-conscious, voluntary integration plans and interacted with local political preferences to shape education policy. Race-conscious student assignment policies became more vulnerable to legal challenges after Parents Involved and risk-averse local authorities modified or avoided new race-conscious choice-based plans (McDermott et al., 2012).
Against this backdrop, we employ Boddie's framework of adaptive discrimination (2016), which contends that racial discrimination is mutable, adapting to anti-discrimination laws and policies in new forms, mechanisms, and processes. Boddie (2016) argued that adaptive discrimination by government, private organizations, and individuals “persists through ostensibly race-neutral institutional rules, laws, and behaviors that converge around norms of white privilege, racialized class ideologies, and pervasive implicit racial bias” (p. 1240). Adaptive discrimination manifests through race-evasive legal frameworks that allow a proliferation of segregative school district boundary lines in diversifying communities (George, 2024; Wilson, 2020). It is further evident via local school boards’ attempts to privatize public education that construct dual systems of education through charter schools (Welner, 2008). How these trends relate to patterns of demographic change and segregation requires further systematic investigation. Furthermore, policy trends affecting the largest urban school systems—the acceleration of choice and privatization; the acceleration of gentrification and rising segregation within districts, not just between them—call for a fresh analysis of the nation's urban districts in the largest 25 metropolitan areas via this framework.
Research Questions
Our analysis of national public school data explores the following questions:
For the period 2002–2021, how has public school enrollment and segregation changed? How do these patterns of public school enrollment change, racial composition, and racial/ethnic concentration, exposure, and isolation differ by region? How have urban districts’ enrollment and segregation changed? Do they reflect the ways discrimination has adapted (e.g., charters, suburbanization)?
Data limitations restrict this analysis to public schools as federal data collection has not fully kept up with being able to understand the contours of how discrimination is adapting in non-public schools, a point we return to in the discussion.
Methods
Our primary data source is the NCES Common Core of Data Public School Universe (CCD) from 2002–2003 to 2021–2022 via the Urban Institute's Education Data Portal Stata endpoint (v. 0.4.1). We supplemented missing CCD data with data from the Nevada Department of Education, Arizona Department of Education, and NCES's Elementary and Secondary Information System. Districts and schools that provide special, vocational, alternative education, or virtual-only instruction are excluded, leaving only “regular” districts and schools (NCES, 2022, Appendix B). Prekindergarten and kindergarten-only schools are excluded. District enrollment is constructed from constituent regular schools.
Midway through our study period, the U.S. Department of Education began requiring race/ethnicity data collection for all states in seven categories instead of the previous five (U.S. Dept. of Ed., 2010); a small number of students did not have their race/ethnicity specified. Consequently, Native Hawaiian and Pacific Islander and multiracial are not universally present across the data until 2011. We use the NCES racial categorization terms in this paper, but recognize that many of these terms are not aligned with advances in sociological insights about race and racialization, nor do they reflect how members of these groups prefer to identify. We analyze our data at three geographic levels: nationally, regionally, and for urban districts in large metros. Our region classifications come from Orfield et al. (2014), who delineated Southern and Border regions by de jure school segregation prior to Brown and Civil War secession (Southern states did both; Border states had segregated schools but remained in the Union). Alaska and Hawaii are excluded from regional analyses.
Our metro-level analysis consists of the 25 largest core-based statistical areas (CBSAs). Districts and schools are included in CBSAs if their physical address lies within the boundaries. CBSAs include districts and schools of varying urbanicity (i.e., urban, suburban, exurban/town, and rural locales all exist within CBSAs). We consider a district or school to be urban if it was classified as such in 2021; this includes some districts and schools that transitioned from (usually) suburban areas during the 20-year period. The CCD urbanicity classifications are derived by whether a plurality of the students in that district attend an urban school (Geverdt, 2019). The Orlando-Kissimmee-Sanford, FL and Miami-Ft. Lauderdale-Pompano Beach CBSAs contain no urban-classified districts during the study period, but we reclassify Orange County Public Schools and Miami-Dade County Public Schools respectively as urban as they are the most centrally located and densely populated districts in those CBSAs.
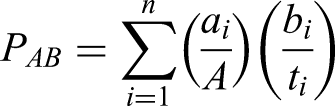
Our segregation measures examine concentration, exposure, and isolation. We classify districts and schools as White-Asian concentrated or Black-Hispanic concentrated if their enrollment was at least 90% composed of those combinations each year. Exposure and isolation (e.g., student's exposure to their same race) are calculated with Reardon & Townsend's Stata SEG package (1999). The equation for exposure and isolation is
Findings
Public School Enrollment and Change
Despite the recent decline in public school enrollment during the pandemic, the overall public school enrollment has increased since 2002. Growth is being driven entirely by Hispanic, Asian, and multiracial students, while the decline of white students during the second decade of our analysis was especially sharp (Table 1). The number and percentage of Black students also declined over the two decades studied.
National and Regional Enrollment and Racial Composition Change, 2002–2021.
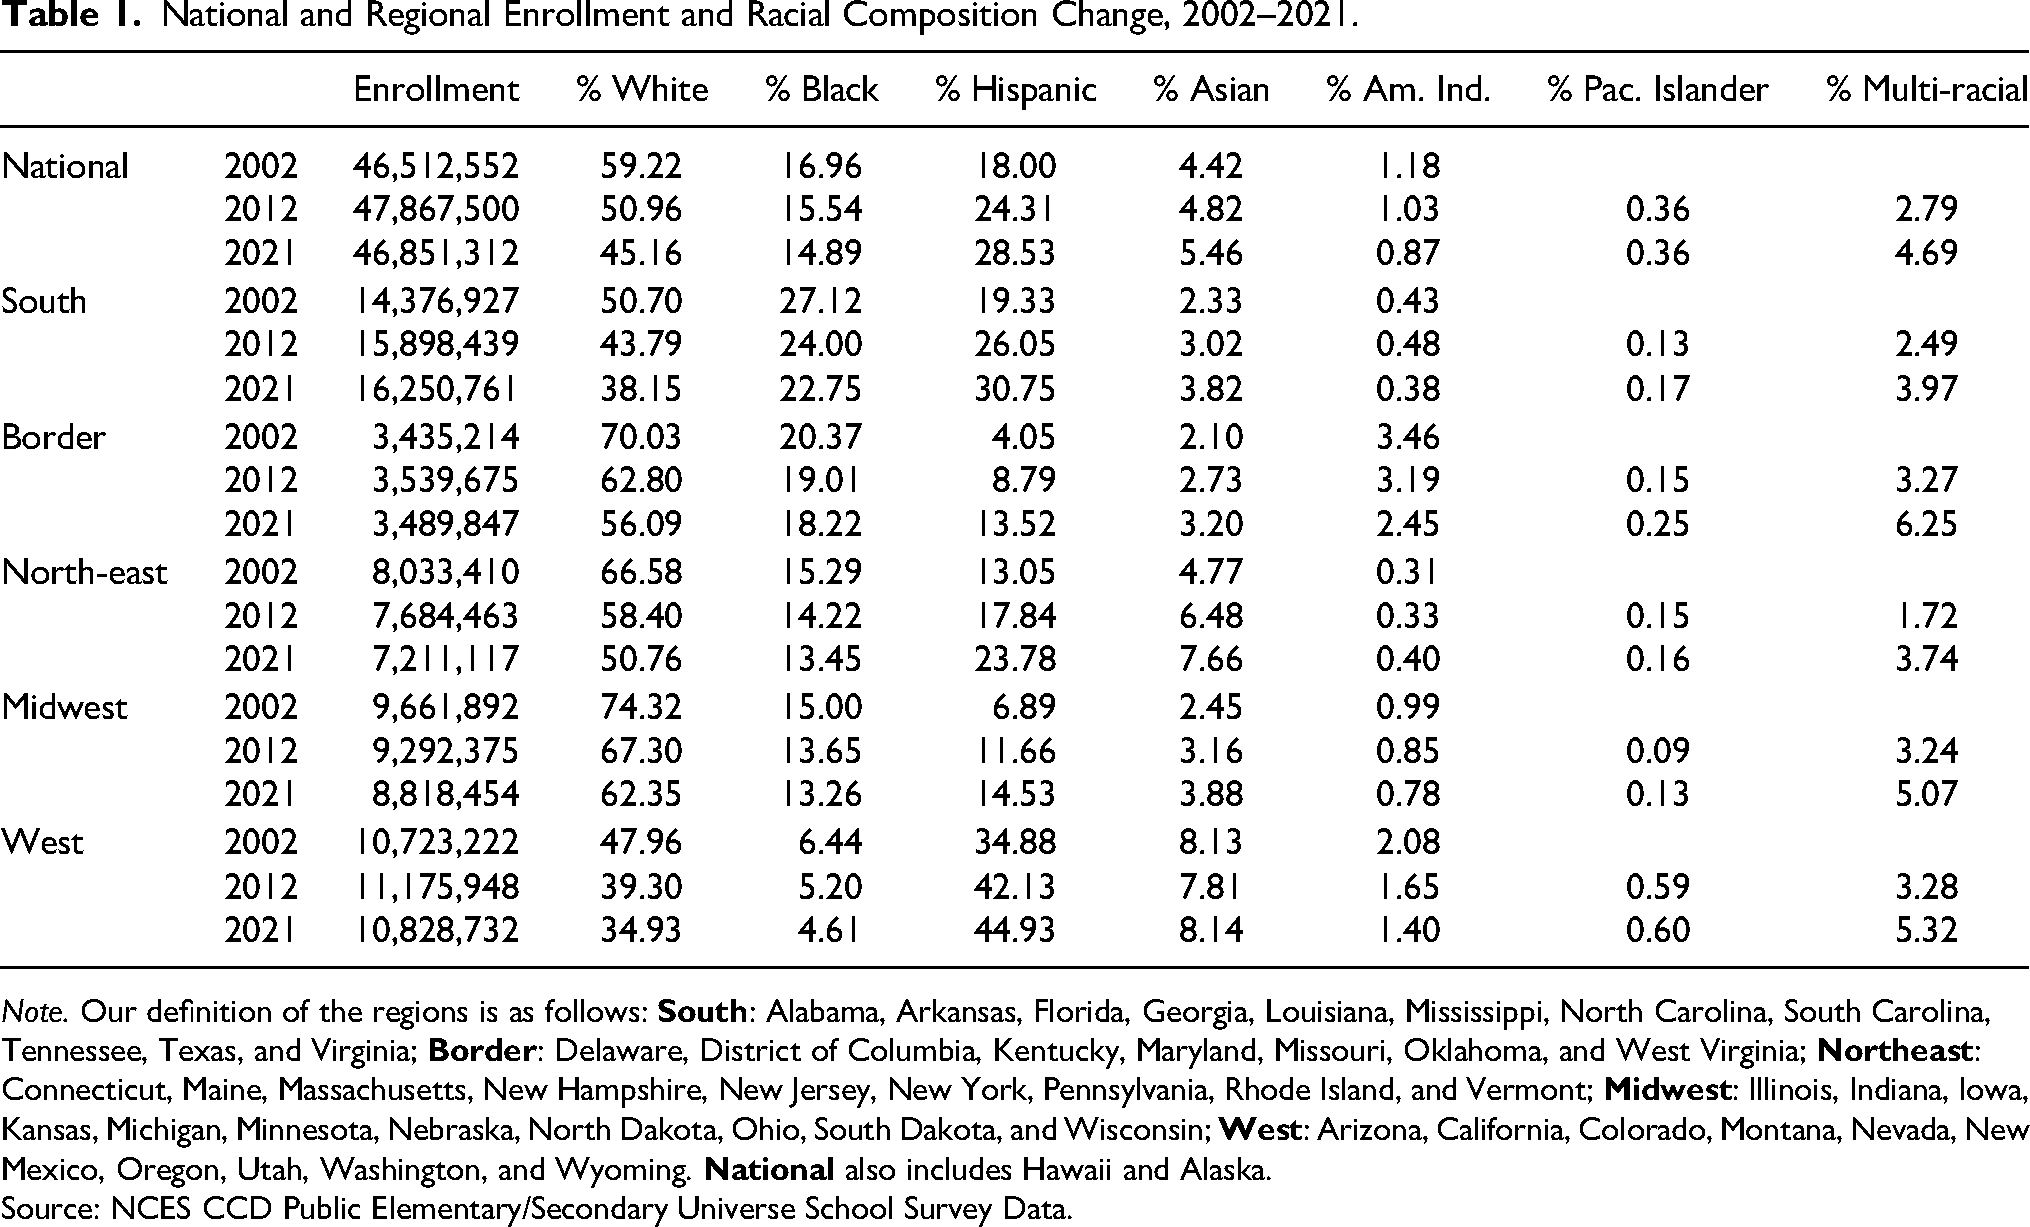
Note. Our definition of the regions is as follows:
Source: NCES CCD Public Elementary/Secondary Universe School Survey Data.
Our examination of racial composition and change by regions of the country reveals striking differences. Although the white percentage declined everywhere, it did so most rapidly in the Northeast. Two decades ago, over 65% of students in the Northeast were white (see Table 1). However, by 2021, just over 50% were. Hispanic students comprise the largest increase in the Northeast—to just under one-quarter of all students. While the percentage of Hispanic students increased across the two decades, the increase in the number of Hispanic students was lower in the second decade. The South, the only region to gain significant total enrollment during this time (almost 2 million students), had the lowest decline in the white percentage (and lowest percent decline, see Appendix Table A1). Both the South and the West have been the most racially diverse regions during this time while the Midwest remained the least diverse.
Although the percentage of Black students has declined in the South—the region where Black students are the largest group—the number of Black students increased (see Table A1). The share and number of Black students declined in every other region while, conversely, Hispanic enrollment grew in every region, and in the West, became the largest group of students, reaching 45% of enrollment by 2021. Additionally, by 2012, Hispanic students surpassed Black students in the South as the largest group of students of color—especially notable in a region that has historically had the largest concentration of Black students.
The highest shares of Asian students were in the West and the Northeast. During our 20-year study period, the Asian student population grew most rapidly in the Northeast, and increased in every region. Among the smaller racial/ethnic groups, the percentage of American Indian students declined in the regions of the country where they were a larger percentage (Border and West). Multiracial students were between 3.74% and 6.25% of enrollment in 2021 in all regions.
Growing share of students in charter schools
During this period, charter school enrollment increased dramatically. In 2002, charter schools enrolled 805,000 students, or 1.7% of the public school enrollment. Enrollment in charter schools more than doubled between 2002 and 2012, with charter school enrollment representing 4.2% of the public school enrollment in 2012. Between 2012 and 2021, charter school enrollment increased by another million students to just over 3 million students while non-charter traditional public school (TPS) enrollment declined by more than 2 million students during this time. As we will discuss, charter school enrollment growth is associated with deepening segregation. Both charter schools and TPSs are public schools but while the latter are part of school districts, the former are often separate from local districts and may be exempt from some regulations.
By 2021, 6.7% of public school students were enrolled in charter schools (see Appendix, Figure 1). The racial composition of TPSs and charter schools consistently differed during the 20-year period we examined, diverging further from one another by 2021 (see Figure 1). Charter school law is determined by each state, and in some states, charter schools are not permitted—especially during earlier years of this period—and charter legislation also in some cases prohibited state-wide establishment. Among TPS, the percentage of white enrollment declined from nearly 60% in 2002 to just under 47% in 2021. The white enrollment decline was much more substantial in the first decade of this period. In the charter sector, white students were a minority of the enrollment, declining from 39% in 2002 to approximately 25% by 2021, and were the third largest racial/ethnic group (after Black and Hispanic students). Although the Black percentage is larger in charter schools (approximately one-quarter of enrollment), it has declined. The increase in Hispanic students in both sectors is substantial, and Hispanic students have been the largest group of students in charter schools since 2009. Percentages of Asian, American Indian, multiracial, and Pacific Islander students were comparable across sectors in 2021.
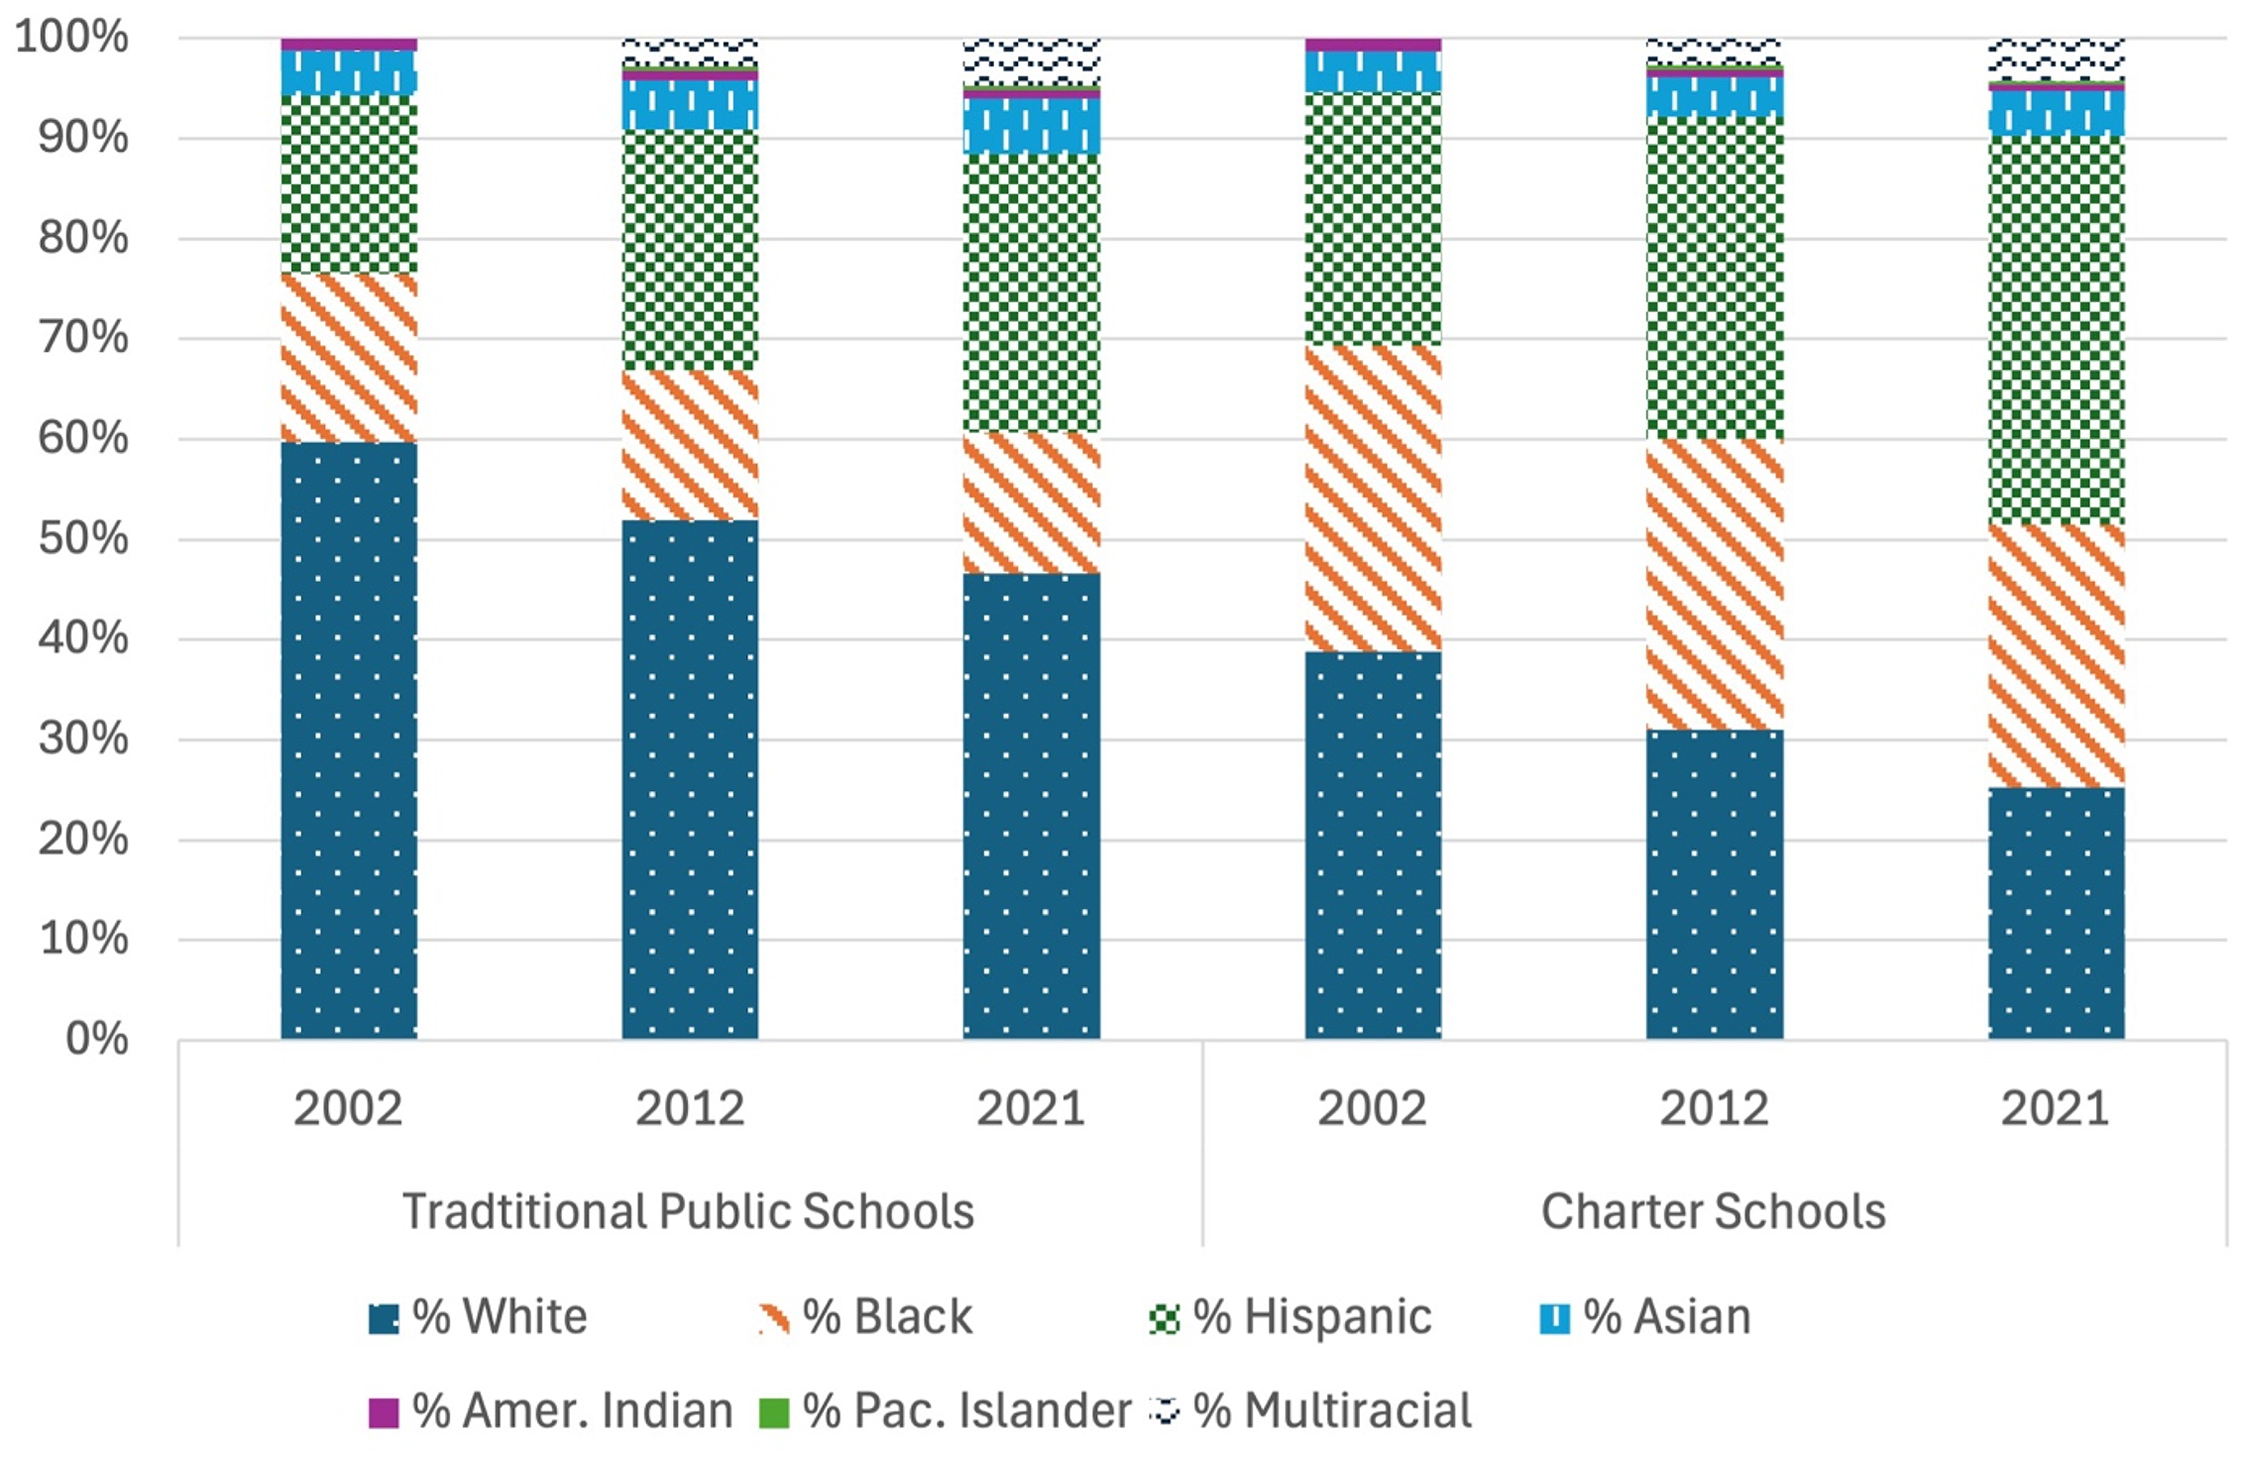
Racial composition, traditional and charter schools, 2002, 2012, and 2021.
Racial Concentration
Initial desegregation guidelines issued in the 1960s by the federal Office of Education specified that districts must reduce the number of students in one-race schools. While this was an early step to begin desegregation decades ago and other measures are also used today, concentration still provides a valuable understanding of the extent to which there are schools that provide students experiences where there are few students from other races. Research has also linked racially minoritized concentrated schools with concentrations of students from low-income households and fewer educational resources (Ayscue & Orfield, 2015; Gamoran & An, 2016; Lee et al., 2022; Rothstein, 2015; Saporito & Sohoni, 2007).
A commonly used segregation measure that closely relates to this mandate is racial/ethnic concentration. While concentration can be measured at the district or school level, we focus primarily on schools because of the linkage to historical goal of compliance with Brown and the importance of school-level desegregation for students’ outcomes. District level concentration matters, however, because of Milliken's near prohibition on cross-district student assignment, it limits school-level diversity. Given the growing and racially disproportionate enrollment in charter schools, we also examine school-level concentration in that sector.
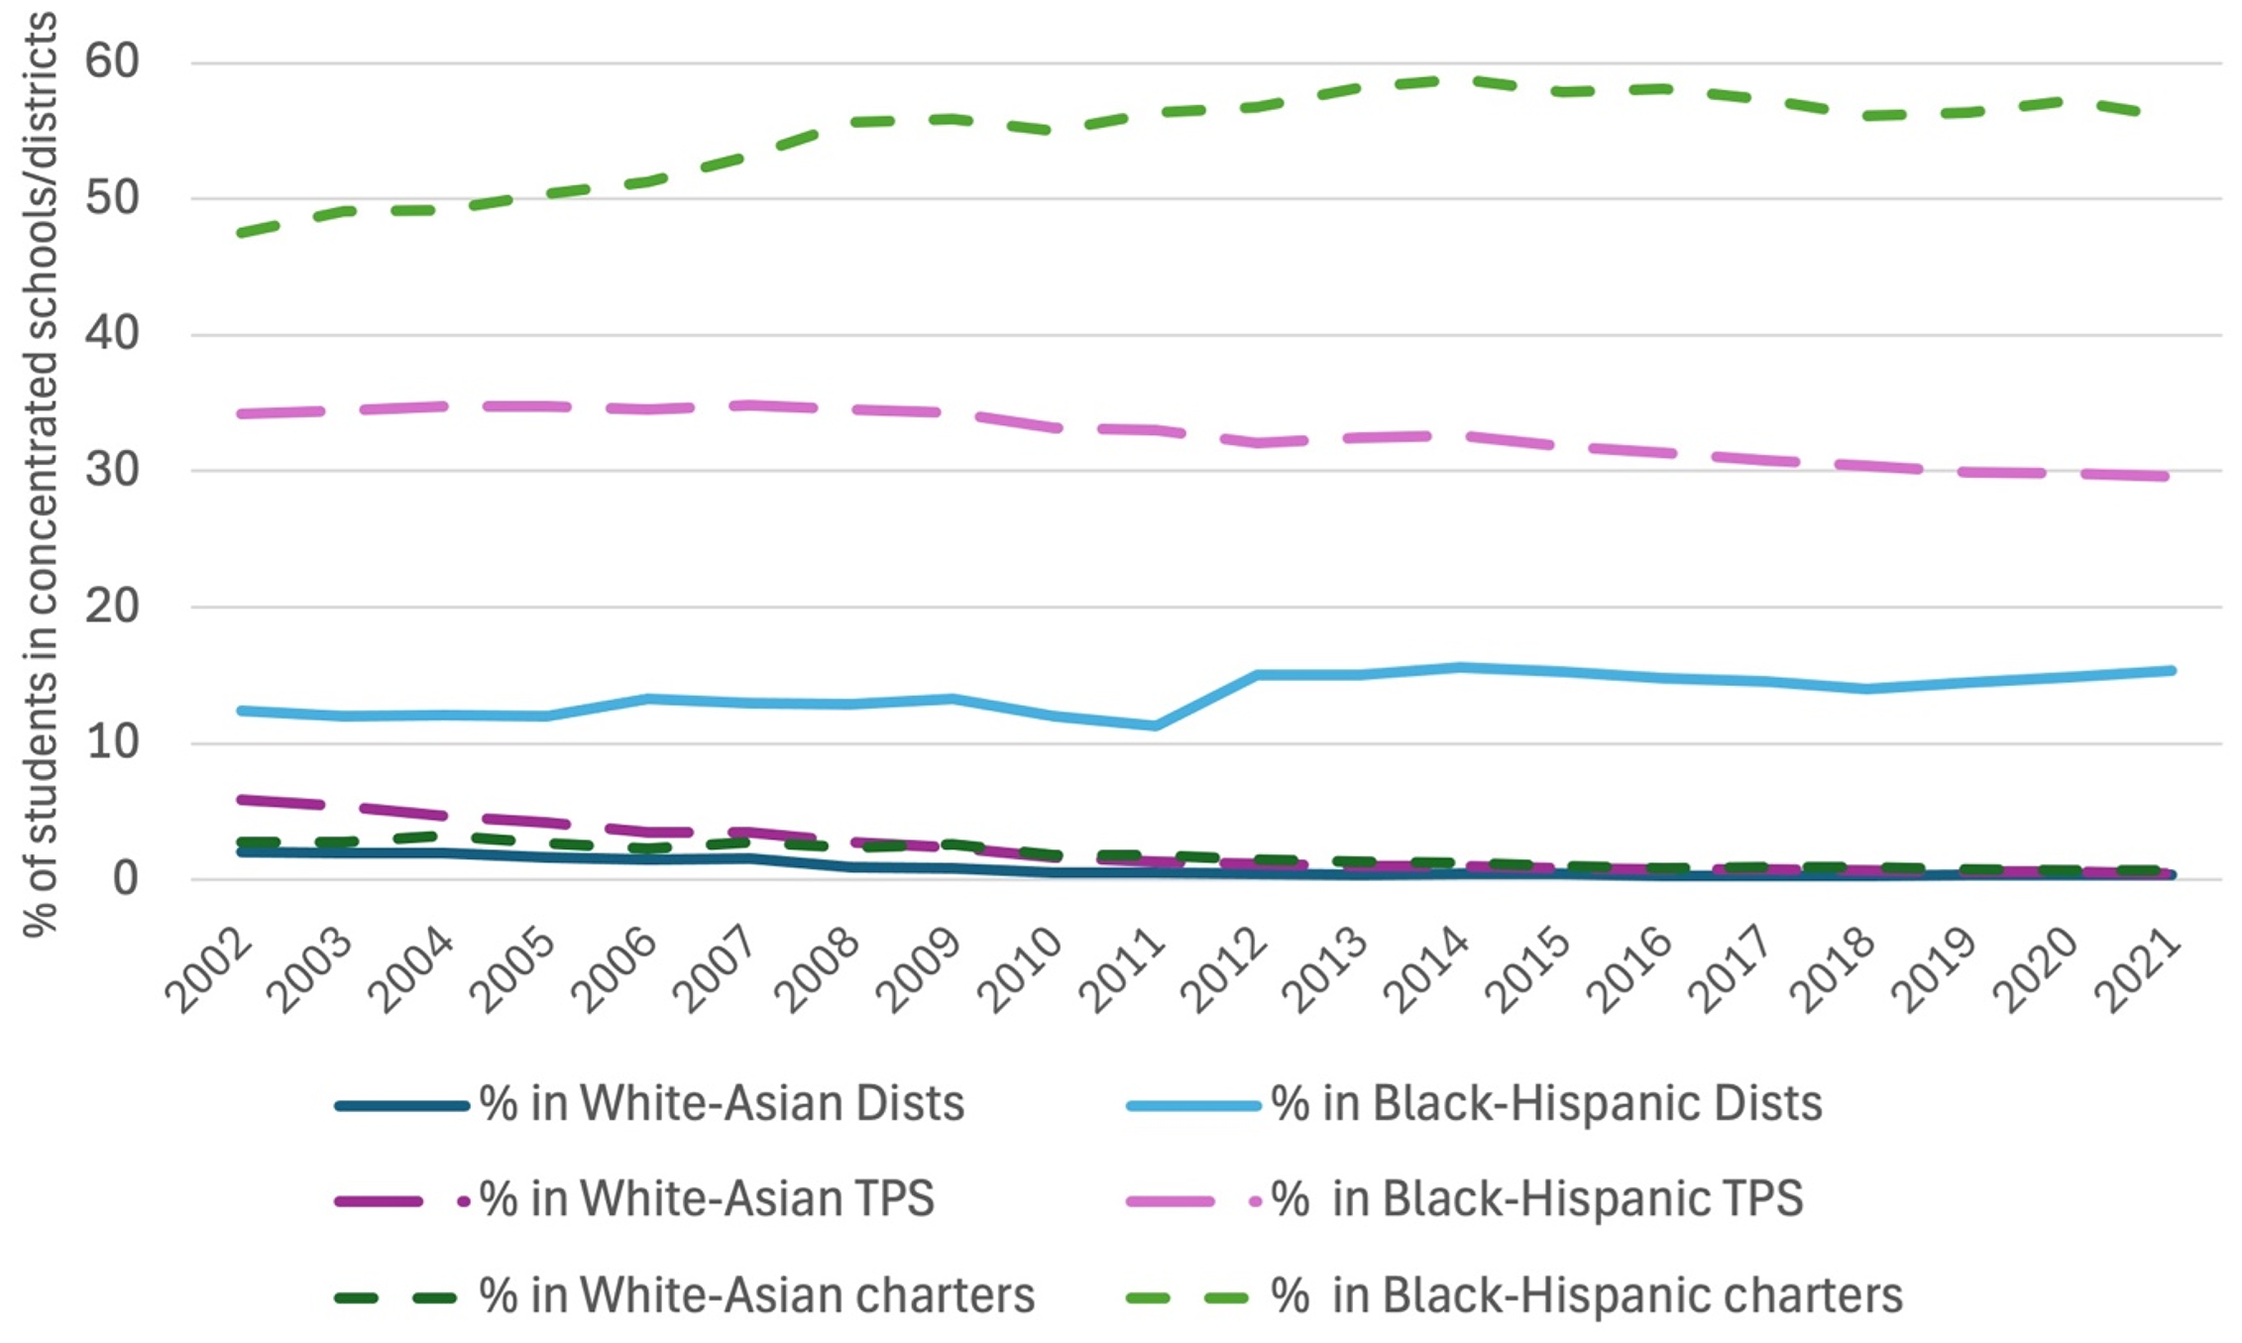
The percentage of students in concentrated schools has been considerably higher than the percentage of students in concentrated districts during the time studied, likely reflecting within-district stratification in racially diverse districts that results in more schools with 90–100% Black or Hispanic students or 90–100% white and Asian schools. The percentage of students in racially concentrated Black and Hispanic charter schools was high throughout, staying above 30% of students in all years. Overall, the percentage of students in concentrated Black and Hispanic schools has risen because of the increase in the percentage of charter schools with 90–100% Black and Hispanic students and the percentage of students enrolling in charter schools. Such schools enrolled just under 6 million students in 2021. The percentage of students in racially concentrated Black and Hispanic TPS remained flat during this time (Figure 2).
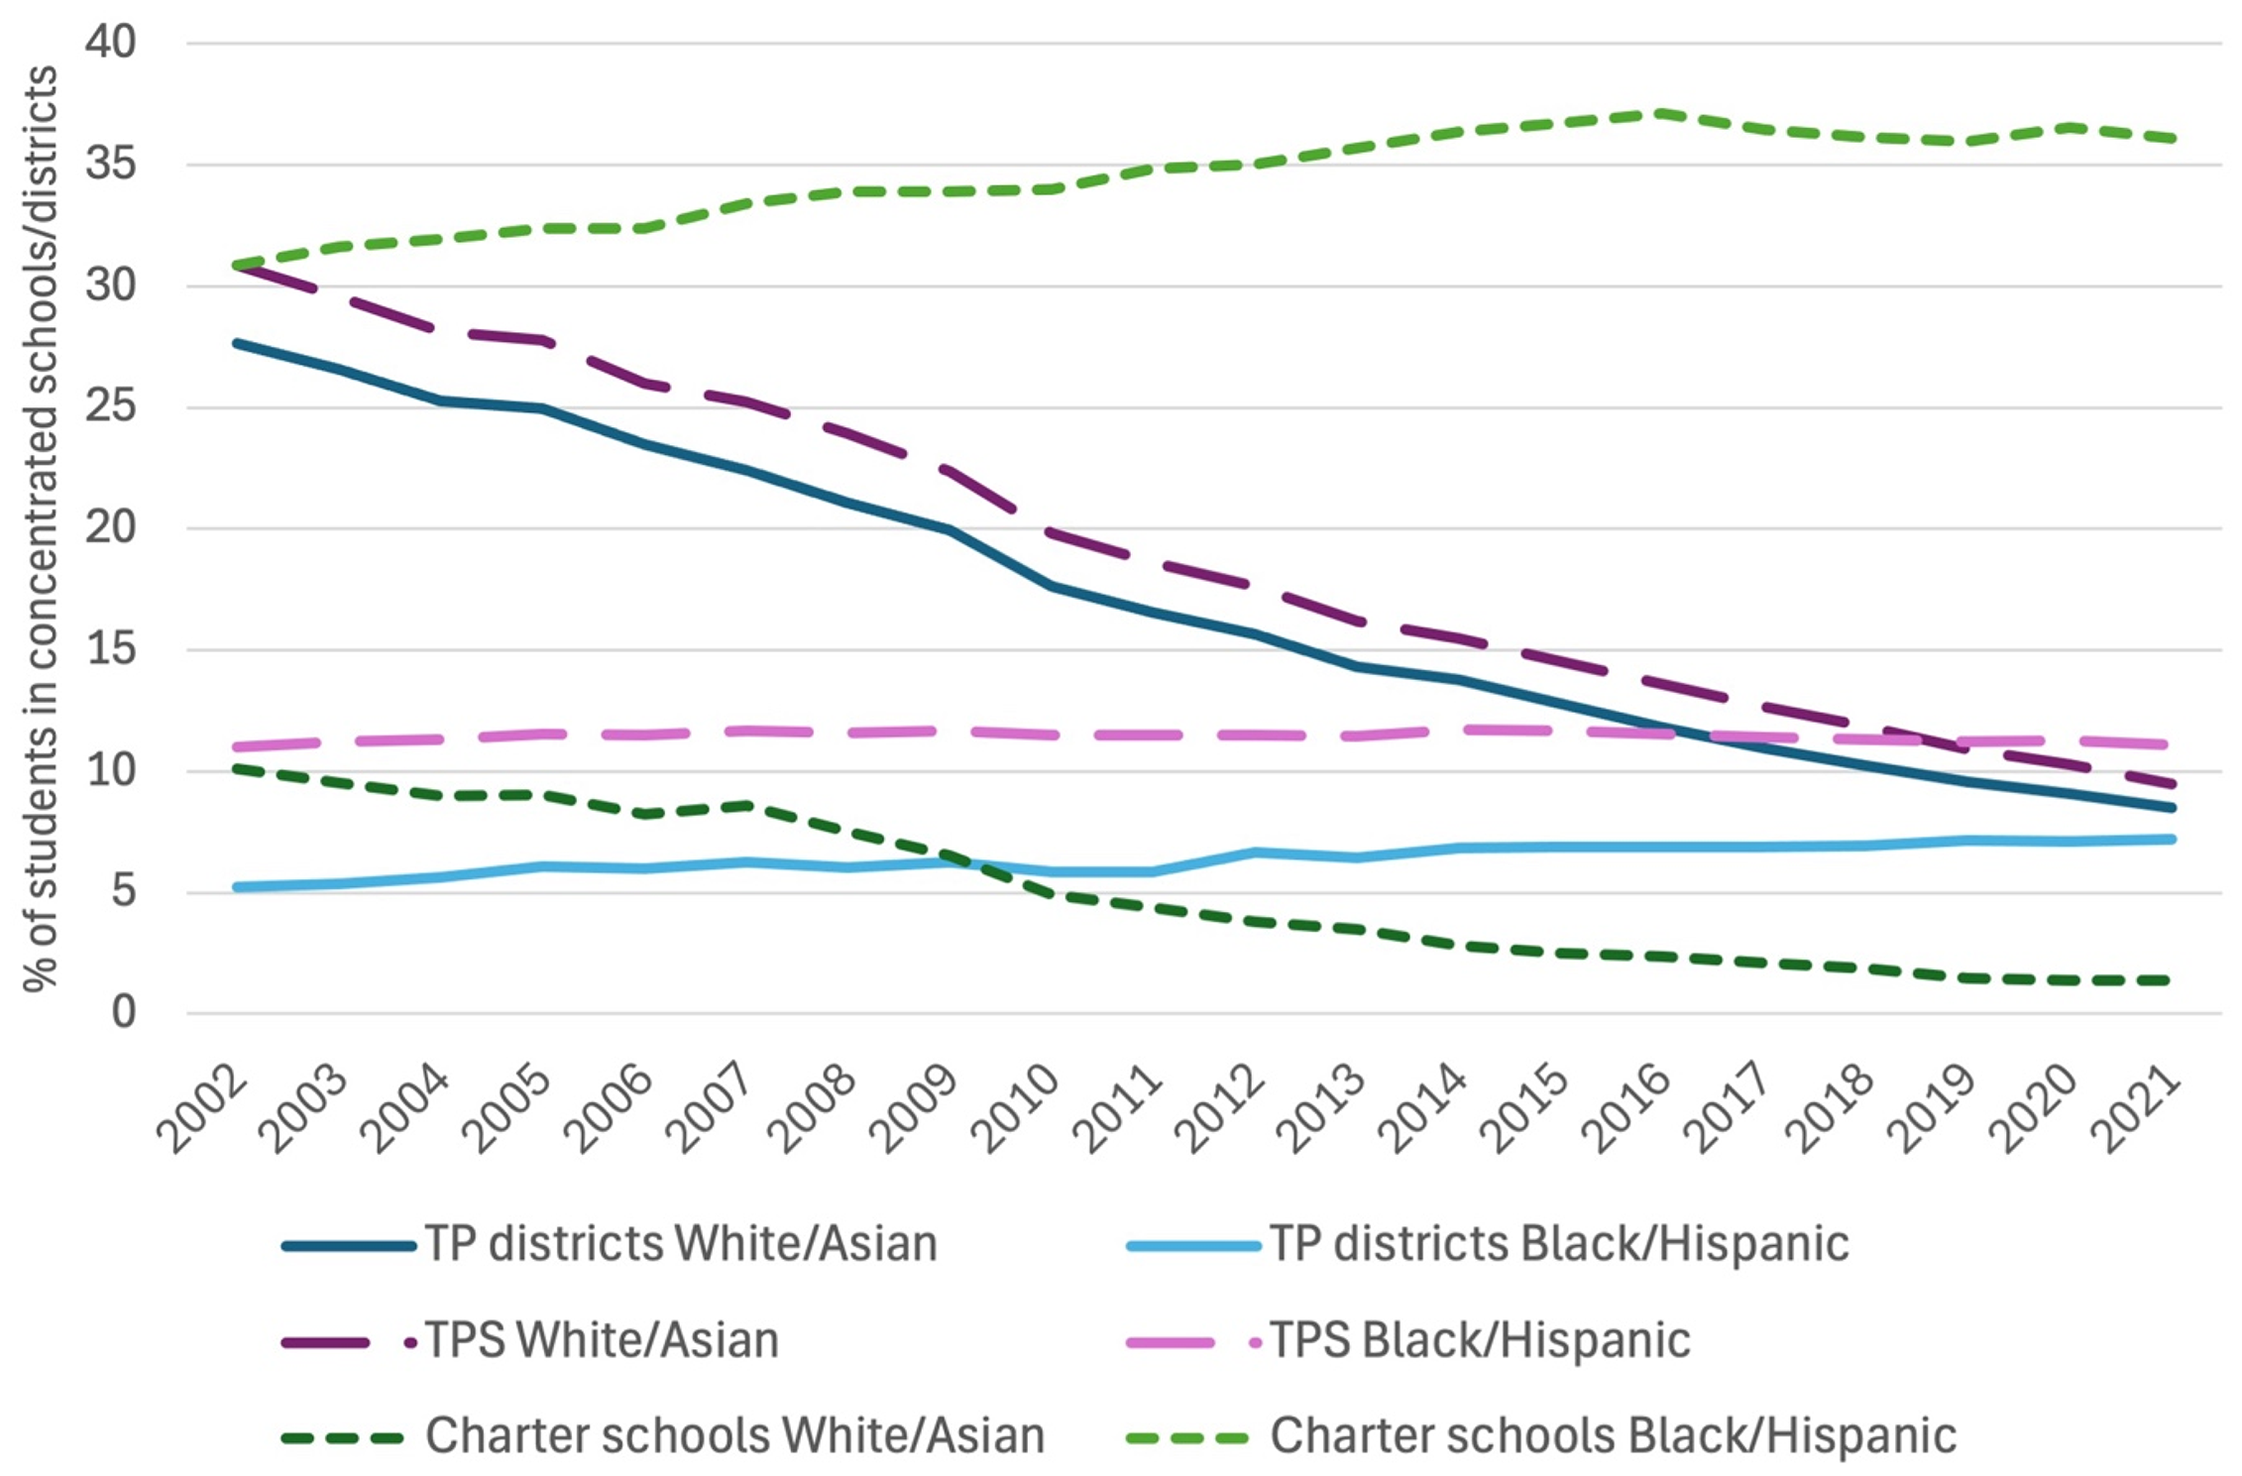
Percent of students in racially concentrated schools and districts, by sector.
As public school enrollment has diversified, the percentage of students attending racially concentrated white and Asian TPS schools and districts have declined. More than a quarter of all public school students (14 million) were enrolled in concentrated white and Asian districts in 2002 and less than 10% (just over 4 million) are in 2021. The percentage of white and Asian-concentrated charter school students was 10% in 2002—much lower than Black and Hispanic concentration and declined steadily during the time period.
The transition that has occurred during this period means that racial concentration is highly variable over time, and now disproportionately affects Black and Hispanic students. In 2016, the percentage of students in racially concentrated white and Asian schools dropped below that of those in racially concentrated Black and Hispanic schools, and the percentages further diverged through 2021. Thus, in terms of racial concentration at the school level, Black-Hispanic concentration affects more students. Together, approximately 10 million students are in either racially concentrated Black-Hispanic or white-Asian schools. The percentage of students in concentrated white and Asian districts remains slightly higher than in 90–100% Black and Hispanic districts.
Examining school-level concentration by region shows that, because of within-district sorting, school-level concentration percentages are higher than district-level (Figure 3; see Appendix Figures A2 and A3). However, the extent to which within-district segregation affects school-level concentration patterns vary by region. Starting with Black-Hispanic concentration, only the South had more than 10% of students in concentrated districts in 2021, while nearly 17% of students were in concentrated schools. Similar patterns are seen in the Northeast and especially the West, which had relatively low percentages of students in 90–100% Black and Hispanic districts.
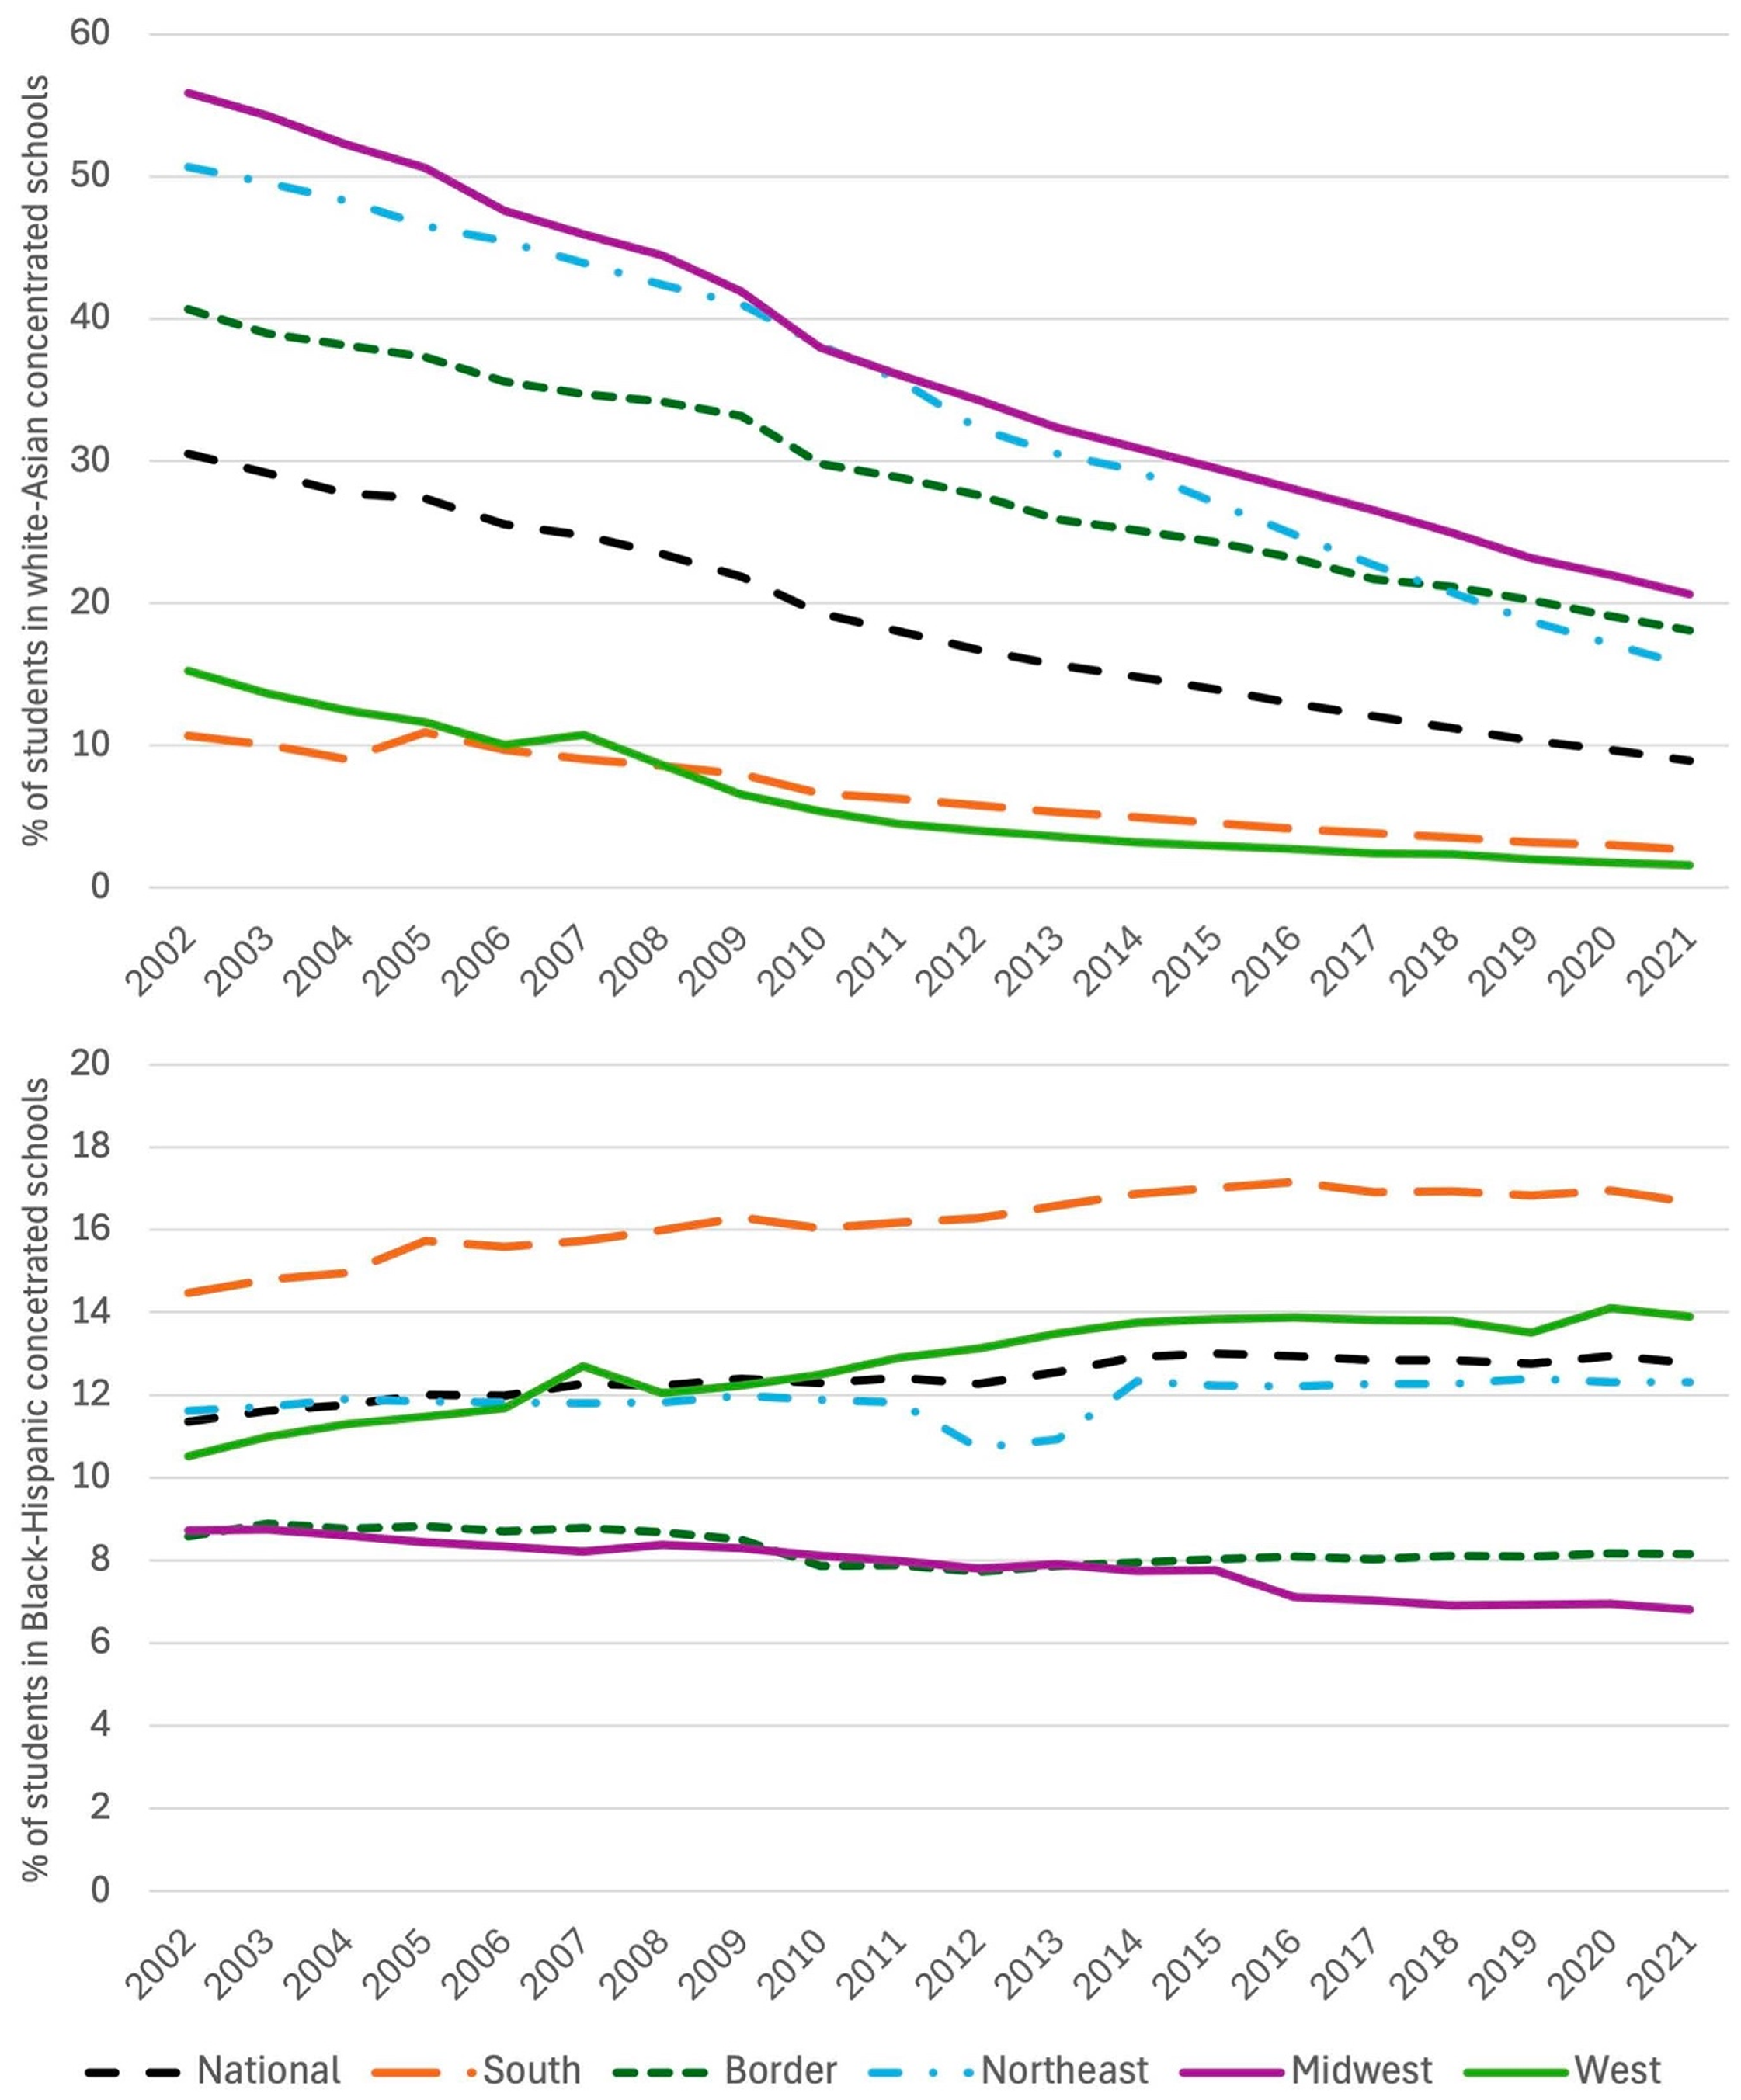
Regional White/Asian and Black/Hispanic school-level concentration by percent of students, 2002–2021.
At the school level, the number and percentage of students in Black-Hispanic concentrated schools has been higher and increased in the South and especially the West. In the latter, nearly 4 million additional students were in racially concentrated Black-Hispanic schools. In both regions, the increase in concentration has slowed in the latest decade studied. The Northeast also had a more modest increase during the two decades examined. In the Midwest and Border regions, which had similar demographics over the study period, there were low and declining percentages of students in Black-Hispanic concentrated schools.
While all regions experienced declines in the percentages of students in white-Asian concentrated schools, the steepness of declines and overall concentration levels varied. The South and the West had similar patterns of declining white and Asian school-level concentration, in that they were lower in white-Asian concentration in 2002 than other regions were even after those regions' declines to 2021. In the earlier part of the study period, Southern school-level white and Asian concentration was much higher than district-level, which likely indicates substantial school-level concentration within more diverse districts. There were also substantial declines in the Midwest and the Northeast in the percentage of students in concentrated white-Asian schools. Shares of students were highest in the Midwest at nearly every year, and one in five students were still in 90–100% white and Asian schools in 2021. Recall, the Midwest had approximately two-thirds of its enrollment that were white and Asian in 2021.The decline in school-level white and Asian concentration was less substantial in the Border region.
Exposure and isolation of students
An additional, frequently used measure of segregation is the interaction index, which measures the exposure to other-race students and isolation with same-race students. Like concentration, this can be calculated using various units (i.e., school, district). We focus on school-level patterns because of the importance of intergroup exposure within school buildings. While concentration measures schools or districts that may be considered outliers in terms of composition, the interaction index is a measure of central tendency, showing the experience of the “average” student of each racial group. If schools were perfectly integrated, the interaction index for each group would be identical and mirror that of the overall racial composition. High isolation limits a group's exposure to students of other races/ethnicities.
Nationally, white student isolation declined similarly to the declines in the percentage of the white enrollment during the first decade. From 2012 to 2021, white isolation also declined moderately, less than the percentage of white students. White students still had the highest absolute isolation of any group across this entire period (e.g., in 2021, 66% of students in the typical white student's school were white, leaving just one-third non-white students, Figure 4). Black student isolation also declined but remained 30 percentage points higher than the percentage of Black students in 2021 (isolation was 44.8%). Hispanic student isolation remained virtually unchanged during this 20-year period despite the larger increase in the percentage of Hispanic students. However, Hispanic isolation was high throughout this period, second only to white students. In 2021, isolation was 26 percentage points higher than the percentage of Hispanic students nationally (54.7% compared to 28.5%), and 10 percentage points higher than Black isolation. Asian isolation is the lowest of the four major racial/ethnic groups but has risen.
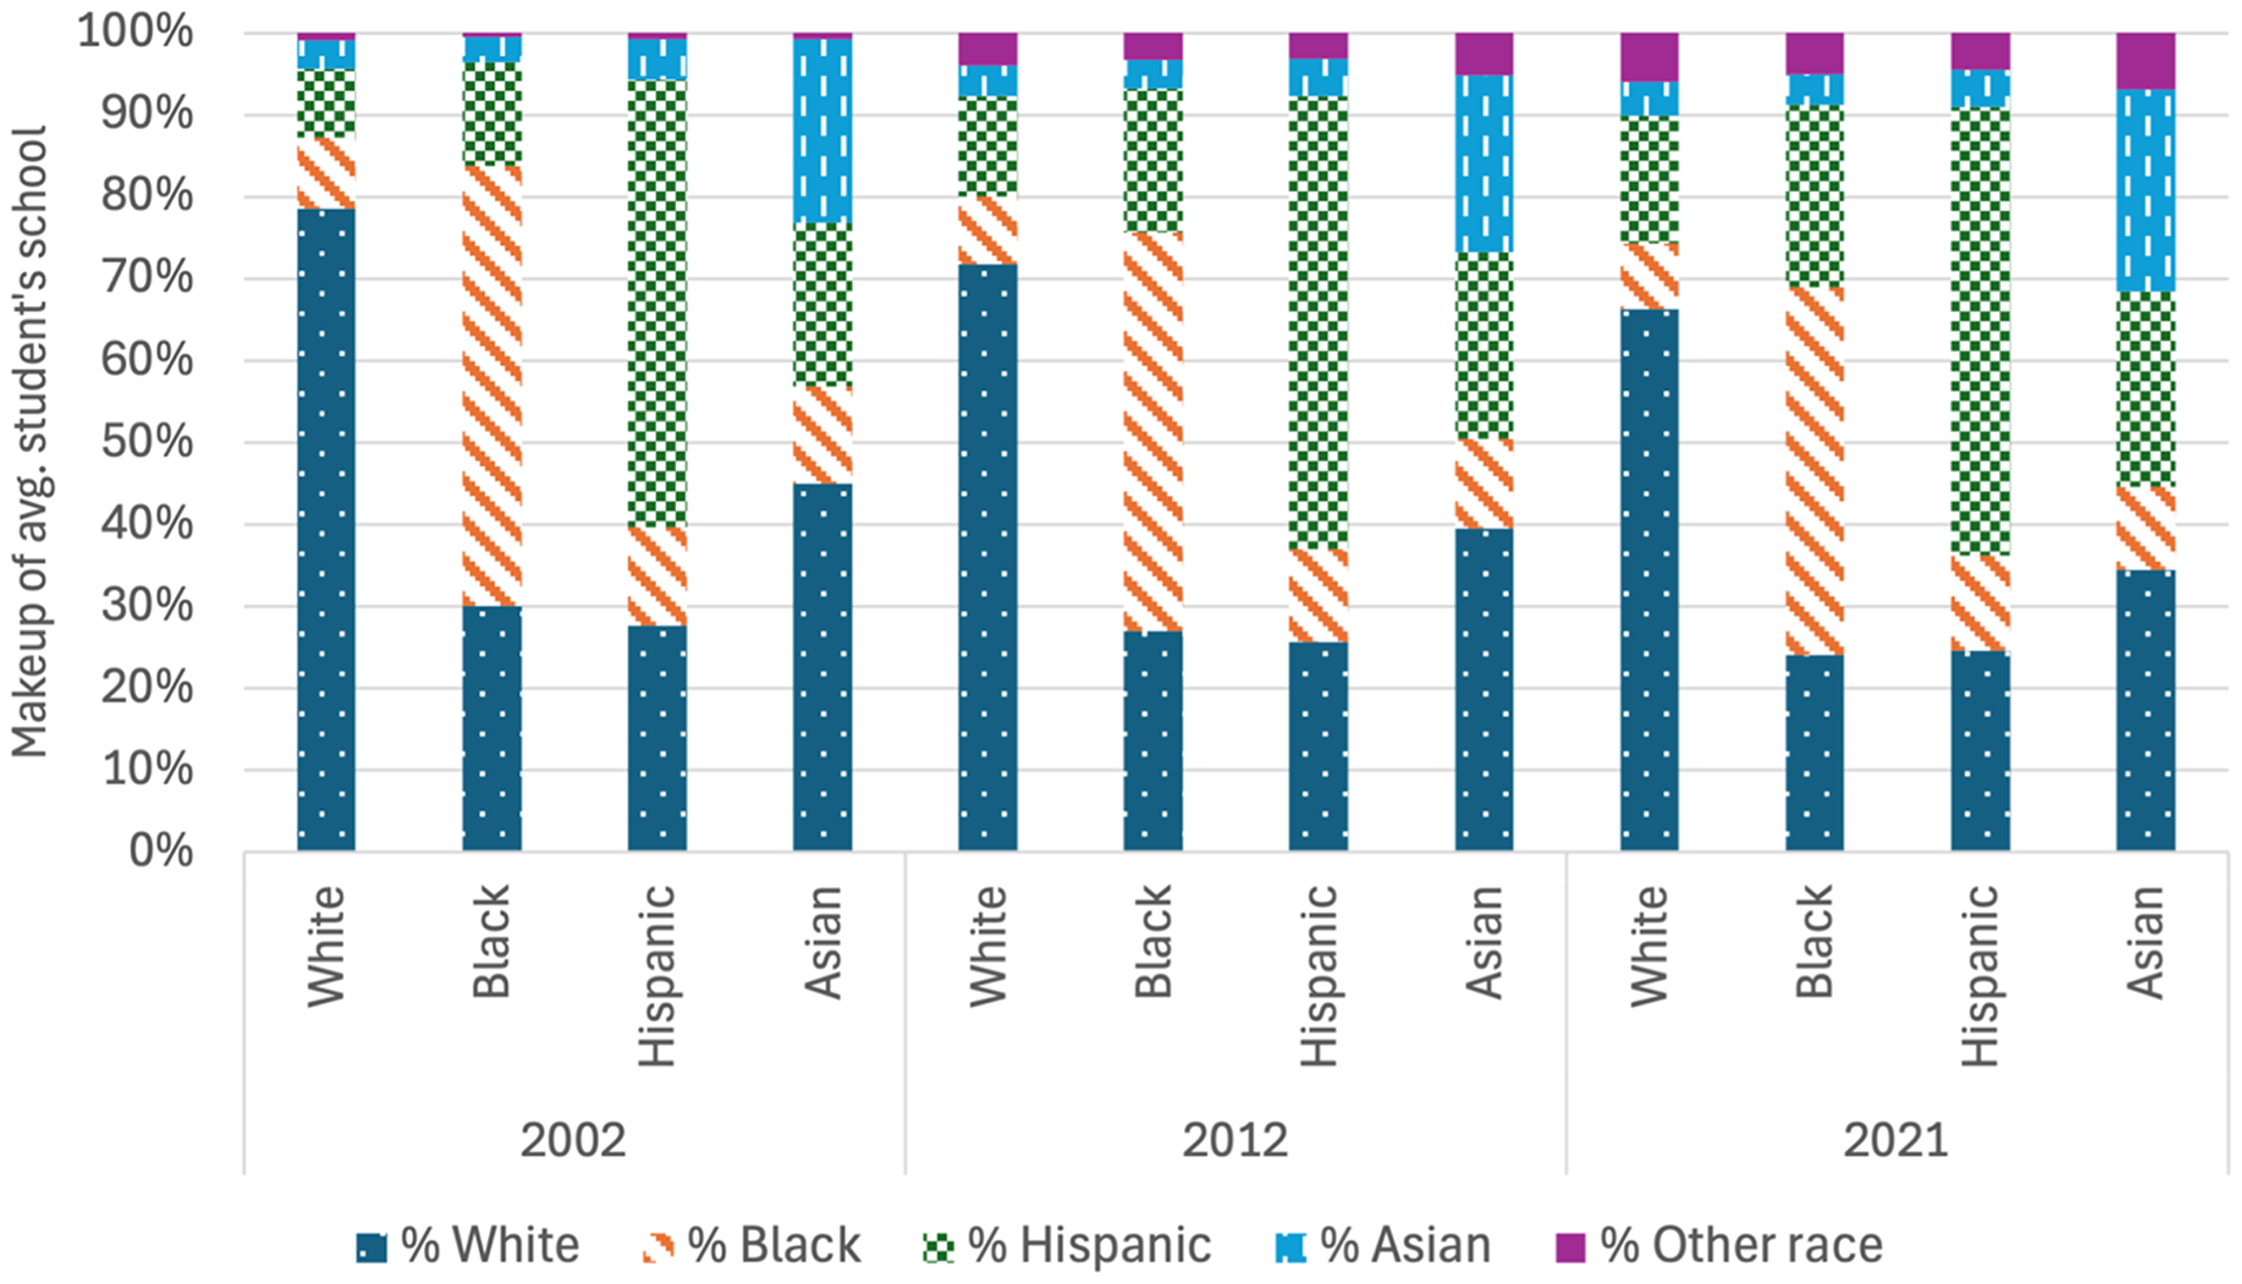
Student school-level exposure, all public schools, 2002, 2012, and 2021.
Student exposure for other groups to Hispanic students grew at varying rates. Black exposure to Hispanic students has grown more substantially during this time and is higher in 2021 than for whites, which may also indicate Black and Hispanic students being clustered together and separated from white students. White students’ exposure to Hispanic students has grown but is lower than other groups. Black and Asian students also had substantial declines in exposure to white students with less than 25% white students in their schools, on average, in 2021. Among all groups, exposure to Black and Asian students remained the most stable across time.
Exposure and isolation by region
Interracial exposure and isolation trends varied by region though some patterns remained constant, such as the substantial decline of white isolation in every region (see Appendix Figure A4). By 2021, white isolation was much lower in the West and the South, not surprising given their racial composition; white students still attended majority white schools, on average. Black isolation also declined in every region, typically not as much as white isolation. In three regions in 2021, Black isolation was approximately 50%; Black isolation was the lowest in the West. While Hispanic enrollment increased, Hispanic isolation declined in two regions, the Midwest and the South, although it remained high in the South. Hispanic isolation in the West was the highest among all regions in both 2002 and 2021. Asian isolation rose in each region, though it remained the lowest of any group. In the two regions with highest Asian isolation, the Northeast and West, it was more than 25% in 2021.
One similarity across regions is that all racial groups had increased exposure to Hispanic students, which would be expected given the rising share of Hispanic enrollment. Black students in most regions had the largest increase in exposure to Hispanic students out of all groups. In all regions except the South, Black exposure to Hispanic students was higher than the Hispanic share of enrollment, an indicator that these groups may have higher exposure to each other and less so to other groups. These changes represent substantial changes and complexity to the initial efforts to desegregate Black and white students in the immediate aftermath of Brown.
Asian students have the highest exposure to white students, though in many regions they experienced relatively large declines. In almost all regions, the decline in exposure to white students for Asian students was larger than the percentage point decline in the white enrollment, indicative of growing separation between these groups. Black exposure to white students declined in almost every region, with the largest declines in the regions with the highest shares of Black students, the South and Border. Outside of the West and the South, in less diverse regions, Hispanic students had higher exposure to white students than Black students.
Exposure to Asian students was low but generally rose across most regions. However, in the West, white, Black, and Hispanic students had declining exposure to Asian students between 2002 and 2021, while students in the Northeast had similarly higher exposure to Asian students by 2021. Most racial/ethnic groups across most regions had declining interracial exposure to Black students, with one exception being Hispanic students in the South.
Enrollment, Racial Composition, and Segregation of Urban Students
From 2002 to 2021, the total enrollment of students in urban districts in the largest 25 metros stayed relatively constant, growing by less than 30,000 students during this period (Table 2). Despite minimal enrollment change, the racial composition shifted. Notably, both white and Black student percentages dropped by 7 and 5 percentage points, respectively. As of 2021, white and Black students each comprised approximately 20% of the metro urban student population. Hispanic, Asian, and other non-Black students of color increased. The Hispanic student population had the largest increase of 7.2 percentage points and held the largest overall percentage of urban students at 45.9% in 2021.
Urban School Demographics and Changes Affecting Traditional Public Schools Enrollment, 25 Largest Metros.
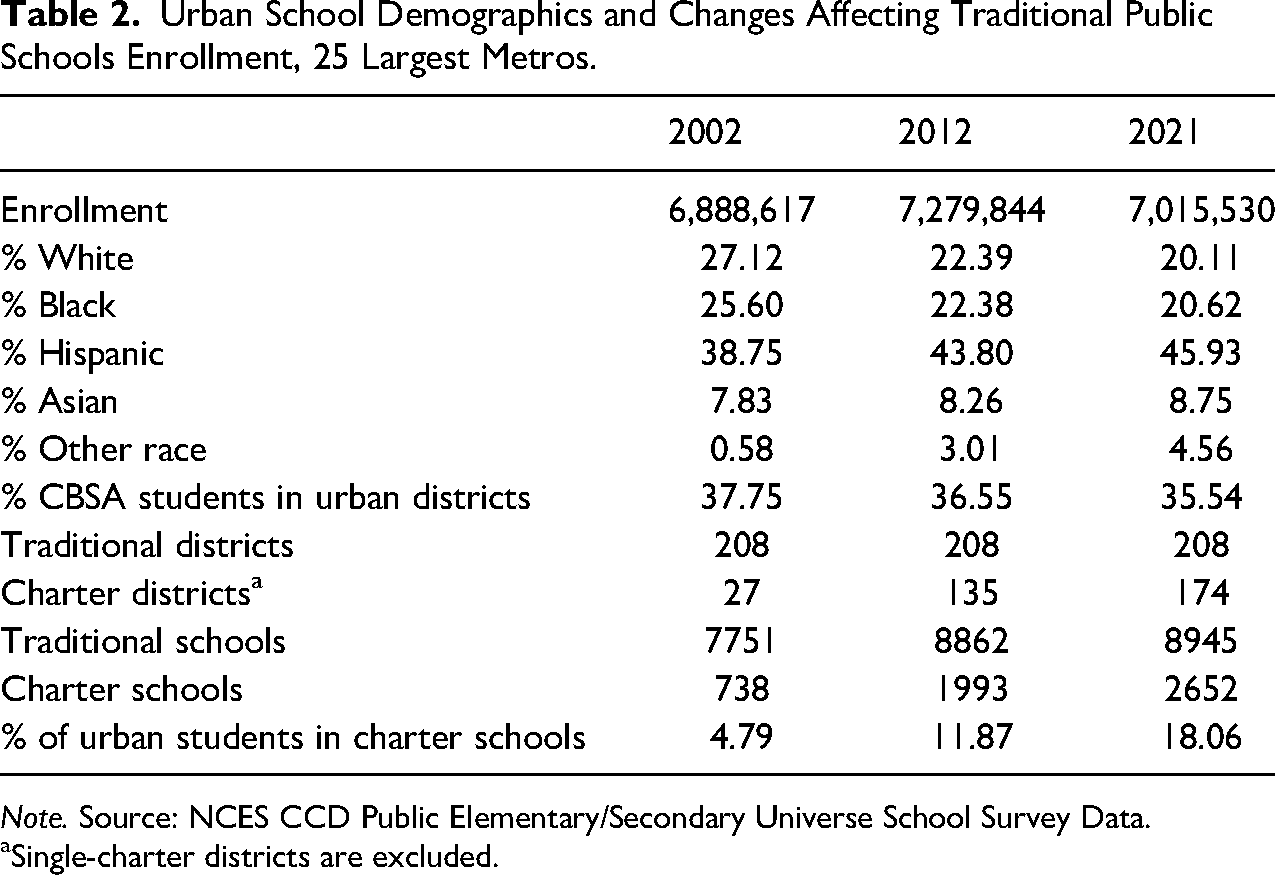
Note. Source: NCES CCD Public Elementary/Secondary Universe School Survey Data.
Single-charter districts are excluded.
Movement away from traditional public schools in urban districts
While urban enrollment slightly increased from 2002 to 2021, for many decades due to segregation and inequitable funding of urban districts within larger metropolitan areas, middle class and wealthy households with children have moved away from traditional urban school districts (Frankenberg & Siegel-Hawley, 2024; Murnane & Reardon, 2018; Saporito & Sohoni, 2007). We measure this in several ways, noting also that other ways of measuring this movement (e.g., private schools and home schooling) are not included here. To date, there are deep limitations in the data that might otherwise help researchers understand the dynamics that are driving some families away from urban schools. We posit that data limitations are a form of adaptive discrimination and means this is likely an undercount of this phenomenon (Anglum, 2023; Dee, 2023).
First, as described, the Milliken decision largely limited desegregation remedies to urban districts, leaving the suburban districts in proximity untouched. This, along with other governmental policies, facilitated the growth of suburban populations. During the period we studied, the percentage of students in urban districts among all students in the largest 25 metropolitan areas decreased from 37.75% to 35.54% (Table 2). There was an increase in the number of urban TPS during this time.
Within the urban enrollment, the second contributing factor to movement away from urban districts was the growth of charter schools. The number of charter schools increased by more than 1,900 schools from 2002 to 2021. The enrollment of charter schools also expanded, from just under 330,000 students in 2002 to 1.27 million in the urban areas of these 25 metros. Traditional public school enrollment declined 810,000 students during this time, offset by the increase of charter schools. Within urban areas, TPS districts enrolled 81.9% of students in 2021 compared to 95.2% in 2002 (Appendix Figure A5).
Except for a few aberrant years, all metros had a steady increase in percentage of urban students attending charter schools even when the number of charter schools remained stagnant or declined. This may indicate that existing schools were gradually scaling enrollment. Several of the California metros in the last five years reported substantial increases in the number of charter schools, possibly in responses to state charter school regulations and/or federal incentives.
Racial composition change in urban districts
While urban schools in the largest metros had varied racial composition and enrollment, similar patterns emerged regarding how racial composition changed. In 19 of the 25 metros, the percentage of Black and white urban students was lower in 2021 than 2002, with most of the decline occurring between 2002 and 2012 (Appendix Table A2). For example, Charlotte had a 13 percentage point decrease in urban white students from 2002 to 2012 and a 9 percentage point decrease from 2012 to 2021. In some metros, the decline in the percentage of urban white students was substantial—even in metros with a relatively high percentage of urban white students. For example, white urban students in the Portland, Oregon, metro declined from 70% to 48%. Some of the areas with high Black shares of students like Washington, DC, Atlanta, and Detroit had increasing percentages of white students. Overall, however, the number of white urban students in Detroit declined (at a lower rate than the overall urban enrollment); Washington, DC, and Atlanta had increasing numbers of white urban students. Minneapolis, Phoenix, and Tampa were the only metros with an increase in the percentage and number of Black students, but these were relatively small increases.
By contrast, the increase in the percentage of Hispanic and Asian students in urban public schools in these largest metros was more consistent across the two decades. In Charlotte, urban Hispanic students increased by 10 percentage points from 2002 to 2012 and another 9 percentage points from 2012 to 2021. In each of the 25 metros, the percentage of Hispanic students in urban districts increased, and in many, the increases were substantial, even in urban areas that had a small percentage of Hispanic students in 2002 (e.g., Seattle's 8.9% had grown to 20% by 2021). Similar increases were in majority Hispanic urban areas too, such as Riverside, which increased from 50.5% to 63.9% Hispanic students.
Enrollment trends show growth since 2002 in most metros, although in some metros there were diverging patterns between the first decade and second. The largest declines in urban enrollment were in the largest districts: New York City, Chicago, and Los Angeles. Meanwhile, urban enrollments in Washington, DC and in Texas metros experienced some of the largest overall increases. The Texas metros, however, experienced a decline in the percentage of urban students relative to other parts of the metro (Appendix Table A3), indicating that despite these large enrollment increases they did not keep pace with suburban increases.
Racial concentration in urban schools
The share of urban students in 90–100% Black and Hispanic schools has been consistently higher than the share of urban students in 90–100% Black and Hispanic districts (Figure 5). The percentage of students in 90–100% Black and Hispanic districts fluctuated but was about 3% higher in 2021 than 2002, under 20%. However, there are substantial differences in this pattern in the percentage of charter and TPS students in racially concentrated schools. From 2002 to 2021, approximately one-third of TPS urban students attended 90–100% Black and Hispanic schools, which declined slightly in most recent years. While the number of urban charter schools steadily increased over the last two decades, the percentage of those schools enrolling 90–100% Black and Hispanic students oscillated, peaking around 2014 but growing over the whole study period. Slightly less than half of urban charter students were in 90–100% Black and Hispanic schools in 2002, rising to approximately 57% in 2012.
Urban school and district concentration by sector.
As is the case nationally, the percentage of urban students in the largest 25 metros in concentrated white and Asian schools and districts declined, although in urban districts these percentages were already relatively low in 2002. By 2021, the percentage of urban students in 90–100% white-Asian schools or districts were under 1%. Combined with slight increases in Black and Hispanic concentration, there was a somewhat lower percentage of urban students in either type of racially concentrated school in 2021 than in 2002; urban Black-Hispanic concentration is much higher than among all schools nationally.
Exposure and isolation in urban schools
We also examine the exposure of urban students in the largest 25 metropolitan areas. White urban student isolation declined sharply, and there are also large declines in Asian exposure to white students (see Table 3). Black and Hispanic students already had low exposure to white students in 2002 than other groups, and thus their exposure to white students declined less. Just 10.36% of the typical urban Black student's school enrollment were white in 2021, lower than the white share of the urban enrollment.
Exposure Among Urban Students, 2002 and 2021.
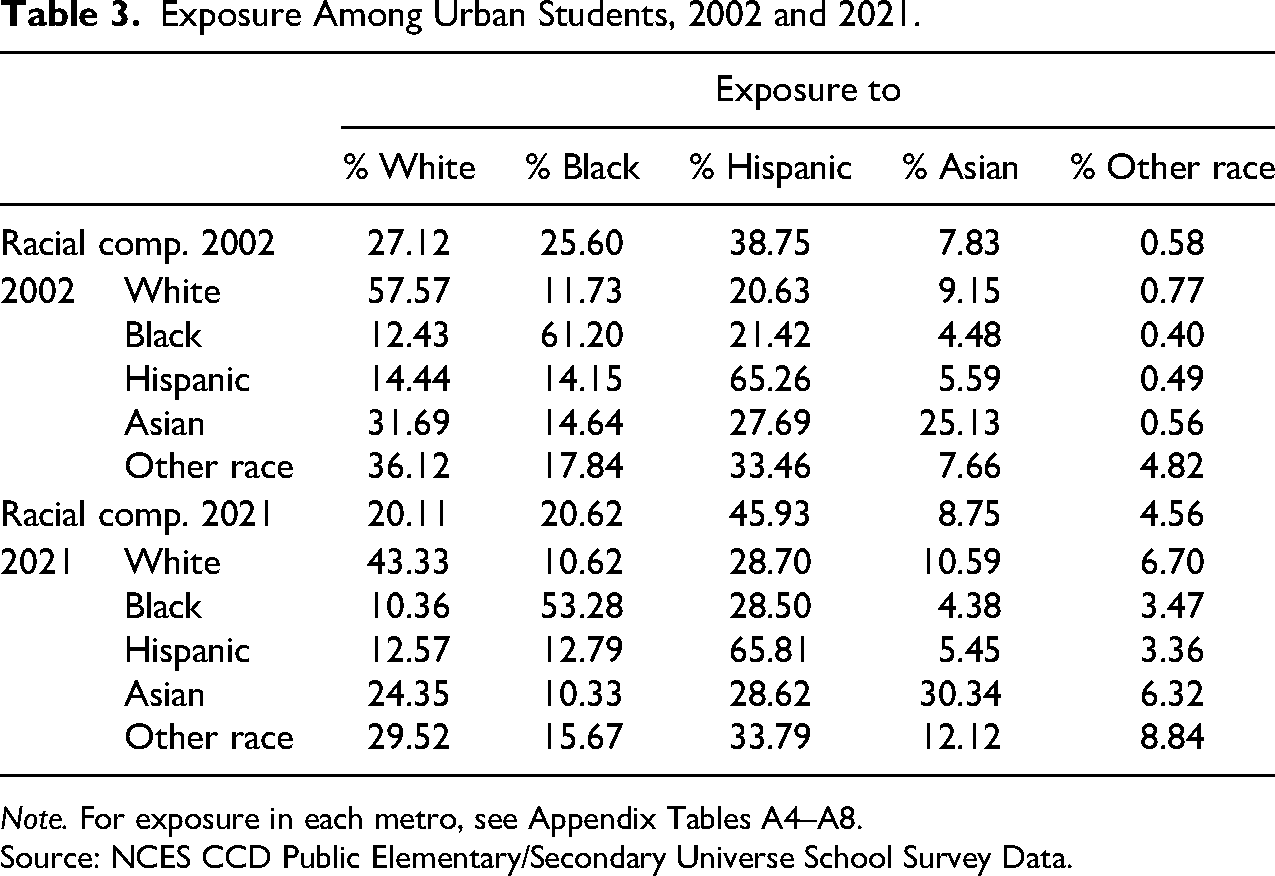
Note. For exposure in each metro, see Appendix Tables A4–A8.
Source: NCES CCD Public Elementary/Secondary Universe School Survey Data.
Black isolation also declined from 2002 to 2021; however, Black isolation was still more than 50% and that was more than 30 percentage points higher than the share of Black students in 2021. Black isolation was higher than that of white students in both years. White and Hispanic students experienced relatively small declines in exposure to Black students. White and Asian students have lowest exposure to Black students, just over 10% of students in their schools, on average, were Black in 2021.
Hispanic isolation increased slightly and was highest of all groups—nearly 20 points above the Hispanic share of urban enrollment in 2021. White and Black exposure to Hispanic students increased to similar levels in 2021 while Asian exposure to Hispanic students was virtually unchanged. Asian student isolation increased the most of any group. However, in 2021, Asian isolation was still more than 20 percentage points higher than urban Asian percent. White students had higher exposure to Asian students while Black and Hispanic had lower exposure to Asian students.
Discussion
Seven decades have passed since the Supreme Court decided Brown, declaring racial segregation in schools to be a violation of the Fourteenth Amendment's guarantee of equal protection under the law. Belated but concrete progress toward school desegregation occurred after the ruling, largely concentrated in the South and in urban districts, even as legal and political retrenchment in the form of adaptive discrimination took hold (Orfield, 2001).
The mechanisms of school segregation have adapted from legalized exclusion of Black students to race-evasive policies and mechanisms that thrive within market-driven policies and neoliberal education reforms (George, 2024). As metropolitan migrations render communities more racially and ethnically diverse, at least temporarily, the expansion of market-based reforms fragments changing communities (Scott & Holme, 2016). We also illustrated how the ascension of neoliberal modes of governance, the rollback of civil rights, and popularity of school choice and accountability function and adapt in ways that make tracking racial discrimination and segregation increasingly challenging (e.g., private school enrollment data not collected universally). Addressing that challenge is critical because, even as the forces underlying segregation have shifted across decades, the result is too often the same.
Our overarching findings point toward a continuation of several longstanding trends, including increased racial/ethnic diversity in the public school enrollment; deepening racial isolation within districts; persistent, high isolation for Black students; high but declining isolation for white students; growing isolation for Hispanic and Asian students; and substantial variation across regions. The growing scope of charter school enrollment and segregation since 2001 is striking, with especially substantial increases in many urban areas.
Growing Public School Enrollment and Increased Racial/Ethnic Diversity in Enrollment
Despite the post-pandemic dip in public school enrollment (Irwin et al., 2022), the country's public schools had a slightly higher enrollment in 2021 than in 2002. Overall growth was fueled by increases in the number of Hispanic and Asian students, particularly in the first decade with the new classification of multiracial students also accounting for rising enrollment in the second decade. The changed racial classification for public school enrollment took effect nationwide in 2011–2012, adding multiracial and Native Hawaiian/Pacific Islander students to enrollment counts in the last decade.
In urban schools across the nation's 25 largest metropolitan areas, public school enrollment held roughly steady over the past two decades. The racial/ethnic contours shifted considerably: the share of white and Black students enrolled in urban districts declined, while the share of Hispanic, Asian, and other students of color increased. Hispanic students made up the largest share—nearly half—of urban enrollment by 2021.
Deepening Racial Isolation Within Districts
Nationally, the share of students concentrated in 90–100% Black and Hispanic schools was considerably higher than the share concentrated in 90–100% Black and Hispanic districts in 2021, as school patterns reflected both concentrated district patterns and sorting within racially diverse districts that added to segregation. This suggests increasing racial segregation within school districts as adaptive discrimination in the sometimes-overlapping forms of student assignment policies, market-based choice systems, and residential segregation sort students into separate schools within the district (Boddie, 2016; Mickelson et al., 2015). This finding has been supported by other research that relied on decomposition measures to understand the contribution of within-district versus between-district segregation (Stroub & Richards, 2013).
The trend of within-district segregation was especially pronounced in the South and the West, where the share of students concentrated in 90–100% Black and Hispanic schools was very high. The end of race-conscious student assignment policies in some districts, concentrated in the South, just before or during this period, is a key form of adaptive discrimination and may have contributed to this trend (Reardon et al., 2012). The West represented the highest share of students concentrated in 90–100% Black and Hispanic schools, indicating that within-district segregation was particularly high in the most racially diverse regions of the country. The concentration of students in 90–100% Black and Hispanic southern districts was still of note, growing from 8% to 11% of the region's enrollment. This number may gradually increase given the phenomenon of school district secession, yet another form of adaptive discrimination, also concentrated in the South (Taylor et al., 2019).
Mixed Findings of Racial Isolation and Exposure
Though the share of Black student enrollment has declined slightly since 2002, the isolation of Black students remained consistent. Black students accounted for roughly 15% of the national enrollment but on average attended schools where 45% of their peers were Black. White student exposure to Black students declined slightly and was the lowest of any racial/ethnic group.
Despite declines during this period, white students experienced the highest absolute isolation of any group between 2002 and 2021. Relatedly, the share of public school students enrolled in overwhelmingly white and Asian school districts declined dramatically over the two-decade period. Those declines were particularly pronounced in the Northeast and the Midwest.
As the Hispanic and Asian shares of the national enrollment increased, so too did both groups’ isolation with same-race peers. Hispanic student isolation levels were second only to white students but rose slowly. In 2021, Hispanic student isolation was nearly 26 percentage points higher than Hispanic student enrollment. Despite high overall isolation, Black and Hispanic students increasingly encountered one another.
Asian student isolation remained the lowest of the four major racial/ethnic groups but rose in the most recent decade. By 2021, Asian student isolation was nearly 20 percentage points higher than the Asian enrollment share. Isolation may be higher for some Asian student subgroups but existing data do not allow us to explore these patterns. Treating Asian students as a monolith represents a form of adaptive discrimination because insufficient data collection can mask inequality that may disadvantage some Asian student subgroups (Boddie, 2016). Disaggregated data offers policymakers a more comprehensive understanding of education systems and outcomes to ensure schools serve all students equitably (Asson et al., 2023).
Rapid, Uneven Growth and Continued Racial Isolation in the Charter Sector
Enrollment and segregation in the charter sector has grown rapidly over the past 20 years, particularly in some urban districts. Even as student enrollment in TPSs declined over the last decade, the charter enrollment grew, now accounting for nearly 7% of the nation's enrollment.
The racial makeup of charters diverged sharply from TPSs. White students, for instance, accounted for roughly 25% of the charter sector in 2021 compared to 47% of TPS enrollment. Hispanic students comprise the largest share of the charter sector. Charter growth was uneven across metros, related to differential response to Race to the Top, which incentivized changing state charter policy. In some cities with large Black student populations charter growth was especially pronounced. Conversely, Seattle has the smallest percentage of charter school students in urban areas, largely due to state policy, but it is also a district with a relatively small Black enrollment. In some states, the formation of charters also has fragmented many metro areas into ever more school districts, which prior literature links to higher segregation (Fiel, 2013; 2015; Rich et al., 2021). Fragmentation linked to market-based reforms makes it more difficult to address segregation and inequality, again highlighting the adaptive nature of discrimination.
Policy Considerations
We conclude with policy considerations given the trends we have identified in the decades since Brown and the correlation between the expansion of adaptive discrimination in the form of market-based education policies and these demographic patterns. Broadly, as has been long acknowledged by scholars and advocates: sustaining school integration cannot be done without also addressing racial segregation and inequality that permeates society, including schools. First, ongoing federal monitoring of school segregation is needed. Recent reports from the General Accounting Office and the Department of Education should be updated regularly (The Leadership Conference Education Fund, 2022). We also need more robust data to understand adaptive discrimination, including subgroup data within racial/ethnic groups and mandatory civil rights reporting for market-based reforms like charter or private schools.
Second, federal policy should address the adaptive nature of school segregation by incentivizing race-conscious integration that prioritizes collaboration within and across districts. The next version of ESEA, for instance, should encourage regional school diversity programs that include features such as the provision of free transportation (George & Darling-Hammond, 2021). Existing magnet and charter school programs should set priorities for race-conscious diversity and intentional site selection or cross-district or sector partnerships to foster diversity. Policymakers also should remember that Parents Involved permits geography-based assignment plans that consider race at levels of neighborhood, zone, or school.
Third, attention to multi-sector reforms that cross housing, schools, and transportation sectors is also vital to address adaptive discrimination. Federal and/or state governments should incentivize cooperation across these levels (i.e., DeBray et al., 2023). Enforcement of fair housing laws, as well as the Office of Civil Rights’ enforcement of Title VI provisions, also are essential tools (Tegeler, 2016).
Finally, states have the power to consider the reorganization of school district boundaries (Haberle & Tegeler, 2018), limit the formation of new districts and boundaries, and to pass laws that attend to the drivers of segregation within increasingly diverse districts, including market-based school choice, attendance boundaries, and residential segregation. Likewise, local policymakers should carefully assess segregation trends in their districts and overall regions when crafting assignment plans; this will grow in importance with projected enrollment declines in the coming decade (Dee, 2023). Taken together, these recommendations signal concrete, contemporary steps toward realizing the still unmet vision of Brown, one that has consistently been undermined by adaptive discrimination through race-evasive policies and practices.
Supplemental Material
sj-docx-1-uex-10.1177_00420859251329310 - Supplemental material for Eroding Integration: 21st Century Segregation Trends in U.S. Public and Charter Schools and Implications for the Enduring Promise of Brown
Supplemental material, sj-docx-1-uex-10.1177_00420859251329310 for Eroding Integration: 21st Century Segregation Trends in U.S. Public and Charter Schools and Implications for the Enduring Promise of Brown by Erica Frankenberg, Caprial Farrington, Elizabeth H. DeBray, Genevieve Siegel-Hawley, Talia Leibovitz, Sarah McCollum, Janelle Scott and Kathryn A. McDermott in Urban Education
Footnotes
Declaration of Conflicting Interests
The authors declared no potential conflicts of interest with respect to the research, authorship, and/or publication of this article.
Funding
The authors disclosed receipt of the following financial support for the research, authorship, and/or publication of this article: This work was supported by the Spencer Foundation (grant number 202300192).
Supplemental Material
Supplemental material for this article is available online.
Author Biographies
References
Supplementary Material
Please find the following supplemental material available below.
For Open Access articles published under a Creative Commons License, all supplemental material carries the same license as the article it is associated with.
For non-Open Access articles published, all supplemental material carries a non-exclusive license, and permission requests for re-use of supplemental material or any part of supplemental material shall be sent directly to the copyright owner as specified in the copyright notice associated with the article.