
Abstract
We use novel information about fixture-specific water lead levels (WLLs) in Portland, Oregon schools to explore inequalities in students’ potential for exposure to lead in drinking water at school. We find that Black and Hispanic students were in classrooms with higher WLLs than white students primarily because they attended different schools. The elevated exposure of students with non-English first languages was also largely driven by sorting into different schools, although there were marginally significant differences between students within the same school. Our findings underscore the importance of broadly targeted remediation efforts like those implemented in Portland to address environmental injustices.
Decades of exclusionary residential practices and environmental injustices have produced conditions where low-income children and children of color reside in neighborhoods and attend schools with greater environmental health hazards than their white and more affluent peers (Clark et al., 2014; Milner, 2012b; Sampson, 2012). One well-documented and hazardous example of this inequality is the disproportionate representation of children in urban settings, children of color, and low-income children among those with elevated blood lead levels in the United States (Aelon & Davis, 2019; CDC, 2005; McFarland et al., 2021; Muller et al., 2018). Even low levels of lead exposure can result in adverse educational outcomes (Aizer et al., 2018; Canfield et al., 2003; Lanphear et al., 2005). Despite the known elevated risk of exposure to lead, researchers have been unable to fully account for the physical sources that contribute to the disproportionality in lead burden (Moody et al., 2016; Sampson & Winter, 2016; Vivier et al., 2011).
Recognizing the importance of the built environment on children's health, President Biden's proposed infrastructure plan allocates $15 billion dollars to eliminate lead pipes and service lines nationwide, affecting 400,000 schools and childcare facilities (White House, 2021). Although water lead exposure risk can vary substantially within a city, and even within the same building (Chowdhury et al., 2018; Triantafyllidou et al., 2021), the majority of the literature on exposure to lead uses data that is aggregated at the city level or examines households within a city (Edwards et al., 2009; Hanna-Attisha et al., 2016; Lanphear & Roghmann, 1997). Research spanning the methodological spectrum—from quantitative methods to community-based partnerships—has consistently shown that children with intersecting disadvantaged identities remain disproportionately exposed to lead in residential environments (Morello-Frosch et al., 2002; White et al., 2016). However, less work examines how schools may contribute to inequalities in exposure (Lambrinidou et al., 2010) even though multiply-disadvantaged children have historically attended—and remain in—schools where they are disproportionately exposed to environmental hazards (Milner, 2012b; Pais et al., 2014; Pastor et al., 2006).
The presence of a persistent disproportionate lead burden among children in urban schools underscores the importance of investigating the magnitude and variation of potential lead exposure from in-school sources to advance environmental justice (Strife & Downey, 2009). This study leverages unique fixture-level data on water lead levels (WLLs) in schools to describe the potential student exposure to lead in Portland schools. In doing so, we extend prior environmental justice research on lead, which has mostly focused on exposure in home environments, to consider whether disadvantaged students have higher potential exposure to water lead at school (Young, 1990). We focus in particular on whether differences in the potential exposure to water lead occur primarily between school (i.e., because students attend schools with different average levels of lead) or within school (i.e., because students within the same school are in classrooms with different levels of lead).
Environmental Inequalities and Urban Schools
Decades of disinvestment, discrimination in the housing market, and decisions by public officials have exacerbated school segregation and funding inadequacies in urban settings (Owens et al., 2016; Richards et al., 2020; Shertzer & Walsh, 2019; Vaught, 2009). Researchers have also documented segregation across classrooms within schools (Billingham & Hunt, 2016; Clotfelter et al., 2003; Mitchell & Mitchell, 2005; Owens, 2020; Reardon & Owens, 2014). In fact, Black-white and Hispanic-white segregation within individual schools accounts for a significant portion of a district or state's total segregation (Conger, 2005; Mickelson, 2001), and Hispanic students are more isolated than their Black peers within schools (Clotfelter et al., 2020). This consistent pattern of segregation within and across schools underscores the possibility of differences in exposure to environmental toxicants between students attending different schools, and within students attending the same school.
Research has consistently shown race- and class-based environmental inequalities in schools (Chakraborty & Zandbergen, 2007; Duncan & Brooks-Gunn, 1997; Pastor et al., 2006). Schools in urban settings are closer to automobile and truck traffic, as well as government-identified hazardous sites, than schools in suburban and rural settings (Bullard, 1983; Gunier et al., 2003; Stretesky & Lynch, 2002; Wu & Batterman, 2006). Black, Hispanic, and economically disadvantaged students are also less likely to be in classrooms with air conditioners that remediate the negative effects of hot school days (Guo et al., 2008; Kweon et al., 2016; Park et al., 2020). We thus argue that it is important to study inequalities in exposure to environmental toxicants as matters of education policy, and particularly for urban education policy.
Like the unequal burden of exposure to traffic pollution and hazardous waste sites in schools, children's lead burden in the United States is not equally shared (Cassidy-Bushrow et al., 2017). Spatial analyses of water lead exposure find that neighborhoods with a higher percentage of families living in poverty—which tend to have older buildings and pipes in comparatively poorer condition—have higher levels of water lead than other neighborhoods in the same city (Sampson & Winter, 2016). Academics and investigative reporters have discovered and made public incidents of elevated water lead in schools in Montana, Arizona, and Florida (LaGrone, 2019; Sierra Club, 2018; Viano, 2002). However, systematic data on lead levels in schools is rare, as is oversight. 1 For over 90 percent of US schools there is no local, state, or federal entity required to ensure WLLs are low (Lambrinidou et al., 2010). Although the Safe Drinking Water Act of 1986 banned new lead pipes in the potable water network, the majority of US schools were built before 1986, and millions of lead service lines remain in use.
An environmental justice framework provides a lens through which the classroom can be understood as a microenvironment that can contribute to disproportionate exposure to lead in schools. The amount of lead that leaches into water dispensed from specific fixtures can vary systematically due to differences in plumbing age, with older pipes typically leaching more lead into water than newer pipes (Del Toral et al., 2013; Katner et al., 2018; Ngueta et al., 2014). Thus, students in schools of different ages and with different levels of upkeep have the potential for dramatically different levels of lead exposure. Further, depending on when school extensions were built or renovations were done, variation can be present within a single school campus so that students who spend their time in different sections of a building may be exposed to higher WLLs than peers within the same school.
Thus, if disadvantaged students are systematically sorted into older schools or classrooms within schools with older or more poorly maintained pipes and faucets, they may face greater levels of lead exposure not only at home, but also at school.
Portland, Oregon, and the Current Study
We use data from Portland, Oregon, which is the 26th largest metro area in the United States and similar in size to Las Vegas, Oklahoma City, and Detroit (U.S. Census Bureau, 2019). Portland can be conceptualized as an Urban Emergent context (Milner, 2012a), and like many such cities became a commercial hub due in part to its location at the confluence of two rivers, a developing railroad system, and land suitable agro-industrial endeavors (Page & Walker, 1991). Portland is the whitest big city in America (around 70 percent white, 6 percent Black, 9 percent Asian, and 10 percent Hispanic), a product of particularly severe racially exclusive policies, which forbade Black people from living in the state until 1859 (Semuels, 2016; Strochlic, 2021; U.S. Census, 2021). Further, a rich oral history provides evidence that people of color were warned to be out of town by sundown until the 1970s. In this regard, Portland is similar to many midwestern cities, including Ferguson, Missouri, which were known as “Sundown Towns” (Loewen, 2005). As in many cities across the United States, the effects of entrenched racism and ethno-centrism are felt in economic, residential, and educational aspects of life in Portland today, providing important parallels to cities in other regions of the country (Bates et al., 2014; Hannah-Jones, 2011).
The median school building in Portland was built in 1949, and was 65 years old at the time of the study. This is slightly older than the current national median school building age of 56 years, suggesting that many schools across the country, have or will soon have pipes that are of similar age to those in Portland at the time of this study (NCES, 1999; Portland Public Schools, 2021). 2 In 2016, Oregonians became aware that some of Portland's schools had elevated WLLs, following an investigation of an attempt to cover up the results of water lead testing across the district (Monahan, 2016). On May 27, 2016, administrators directed all water to be shut off to schools, and the district supplied bottled water to all schools while they replaced all lead service lines to permanently remediate the WLLs. 3 Importantly for our purposes, unlike other school districts with elevated WLLs, Portland Public Schools (PPS) subsequently made all data publicly available on the district website.
In this study we examine differences in the potential exposure to lead in school water fountains by estimating the average differences in the WLLs of the water fountains in students’ classrooms. We use lead data from the PPS website that we match with administrative data containing information on demographics and the physical classroom assignments of individual students to examine racial, ethnic, and socioeconomic differences in children's exposure to water lead in their classrooms.
For children to be variably exposed to water lead, they must first be unevenly distributed across schools or across classrooms within schools by one or more of these characteristics. Thus, we first examine whether disadvantaged students are evenly distributed across schools, and across classrooms within schools. We then look at whether elevated WLLs in students’ classrooms are associated various student characteristics by constructing individual-level lead exposures and examining how they vary across a number of student social characteristics. This is the first study to examine students’ potential exposure to water lead across a school district with information at the classroom level, allowing us to examine if inequities in potential exposure are explained by processes that place a disproportionate share of disadvantaged students in a given school, or processes that sort students to different classrooms within schools. This study is guided by the following research questions:
Methodology
Data
Lead data
In May and June of 2016, the city of Portland, Oregon contracted with TRC Solutions and state-certified labs to complete initial district-wide water testing of every cold-water fixture in all public-school buildings and made the results available on their website. An example of the data available is provided in Figure 1. In Figure 1, each row is a separate fixture. Fixtures were labeled using the type (i.e., sink, drinking fountain, faucet) and location (i.e., hallway, classroom, bathroom). Each fixture has a “result”, which is the ppb water lead detected from a first-draw sample of the fixture. 4 The fixtures that exceeded the Environmental Protection Agency's (EPA) threshold of 15 ppb were highlighted in yellow in the district's documents. For the current study, we restrict the lead data to include only fixtures labeled as water fountains and those that are labeled as located within a classroom to be able to isolate and disaggregate student exposure to lead within schools among students’ most likely sources of drinking water that are not shared in common spaces.
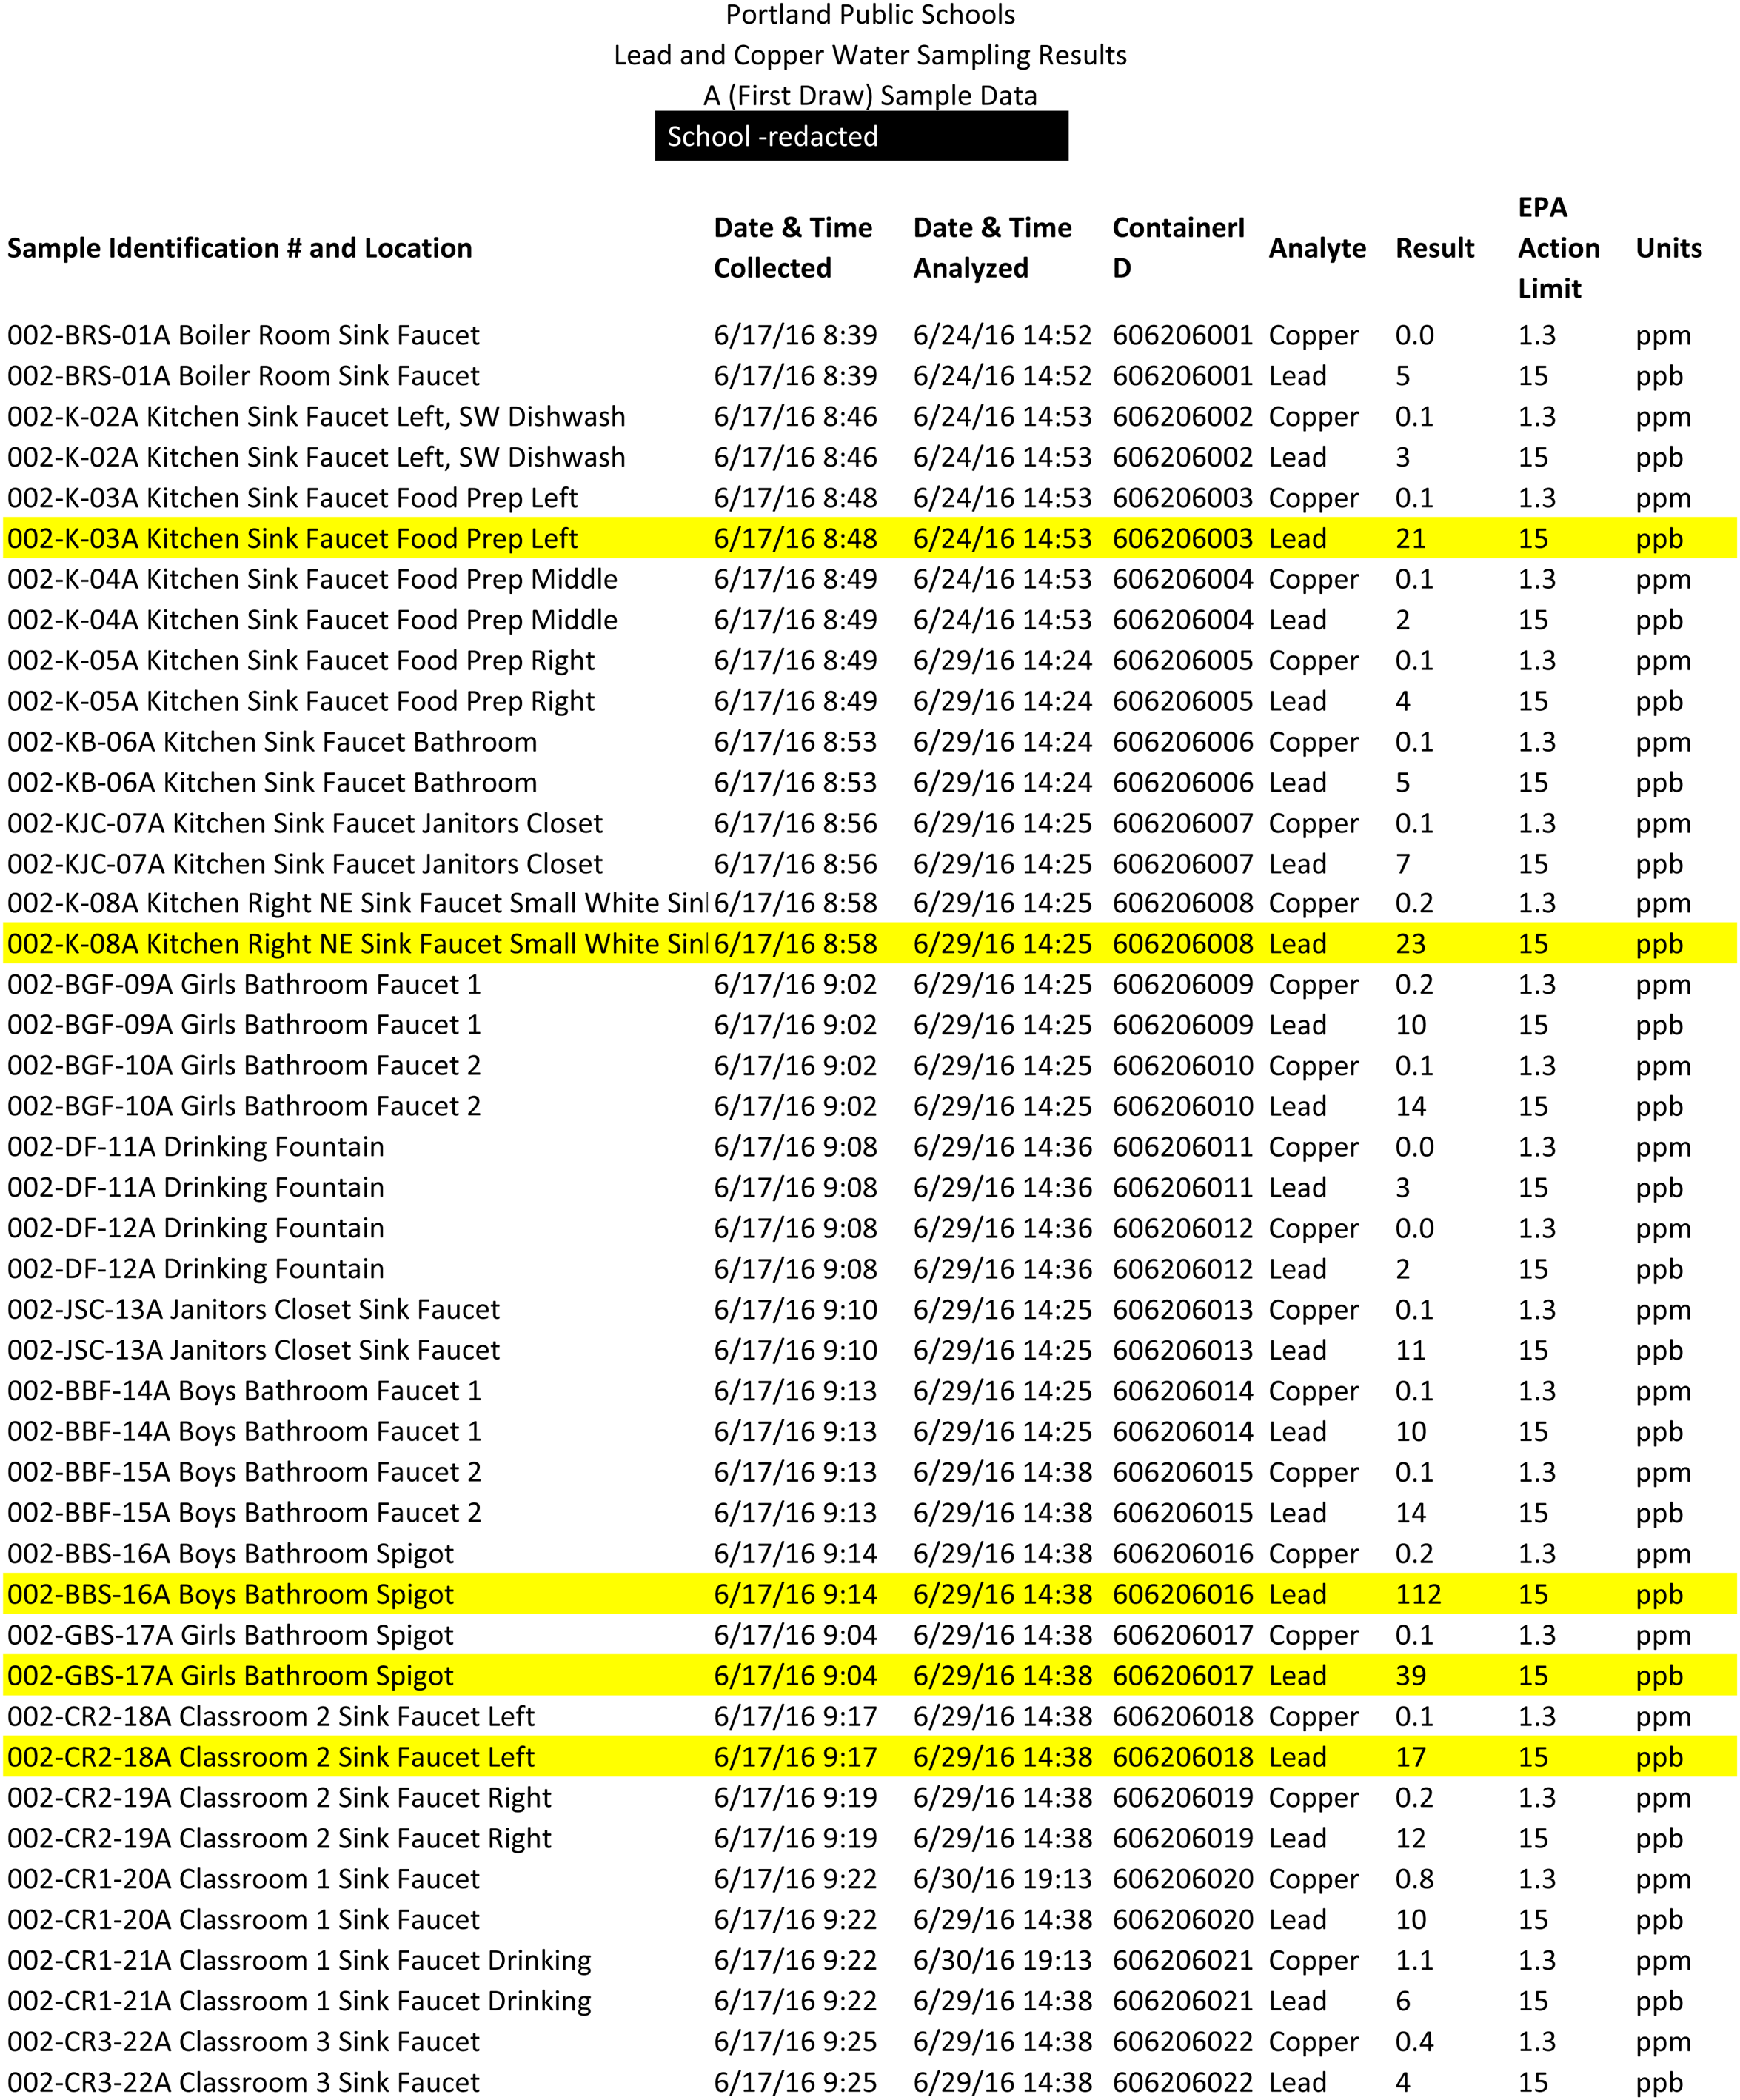
Example of available water lead data. Notes. This is an example of the lead reading data publicly available on Portland Public Schools' website. This example comprises one of six pages of fixture-level lead readings for one specific school. Each fixture appears twice with results for lead and copper testing. The first column includes information about the fixture location and type. This paper uses only lead results from fixtures that are labeled as used for drinking and that are located in classrooms. The sixth column includes the results from the test in parts per billion (ppb). Fixtures than tested above the EPA's Action Limit are highlighted in yellow. Other information provided includes the dates and times the sample was collected and analyzed and the container ID.
Student data
We use de-identified student-level administrative data from the Oregon Department of Education, which includes all students enrolled in PPS in academic year 2015–2016. 5 The data include classroom indicators for students in grades K-12 and the number of school days spent in each classroom, which we use to construct a student-level metric of potential exposure. Also included in the data are students’ race and ethnicity, 6 whether they were identified as economically disadvantaged, whether they were enrolled in special education, and whether they are identified as speaking a language other than English as their first language.
Importantly, we do not have any information about which students did and did not drink water from the water fountains in their classrooms, or how much water students drank. As such, rather than describing our results as capturing exposure to water lead, we instead interpret them as describing the differences in potential exposure to water lead.
Sample
Table 1 reports student characteristics for our analytic sample (students in Portland, Oregon that are in classrooms with water fountains) and as well as for all students in Portland, Oregon. There are 19,791 students that spend time in a classroom with water fountains across 64 schools, which accounts for 71 percent of all students in PPS.
Demographic Characteristics of Students in Classrooms with Water Fountains and all Students in Portland.
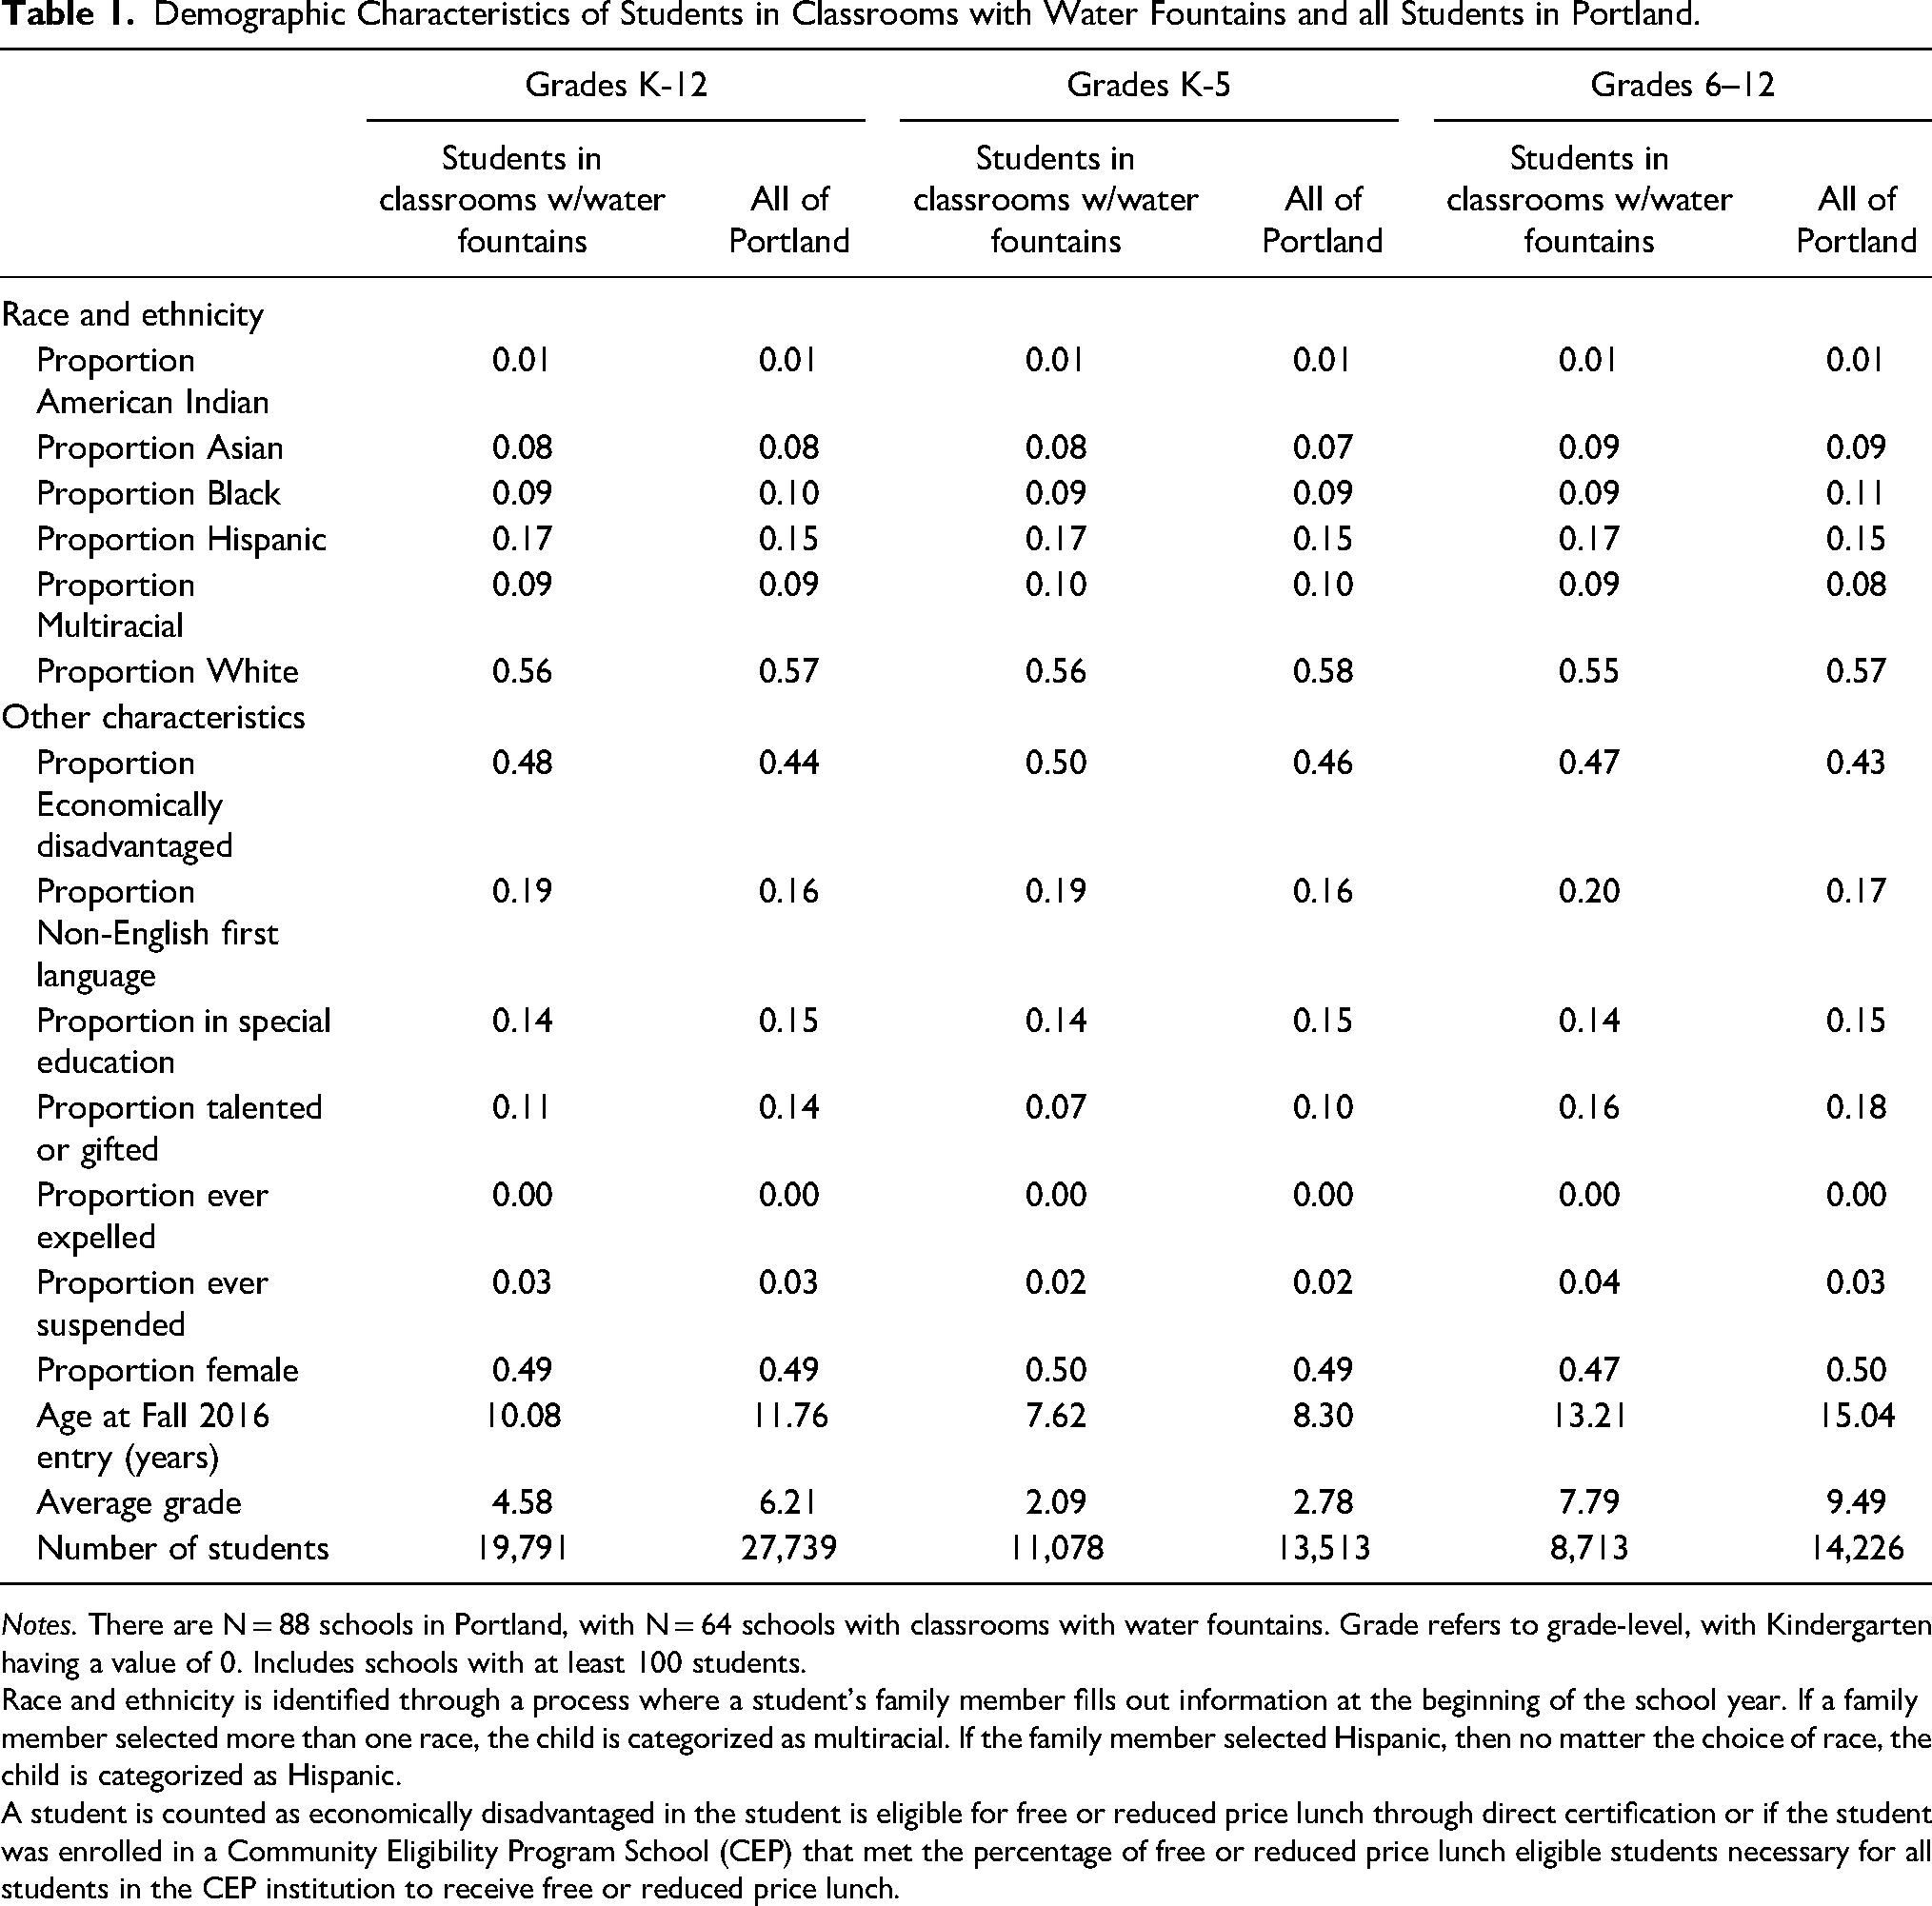
Notes. There are N = 88 schools in Portland, with N = 64 schools with classrooms with water fountains. Grade refers to grade-level, with Kindergarten having a value of 0. Includes schools with at least 100 students.
Race and ethnicity is identified through a process where a student's family member fills out information at the beginning of the school year. If a family member selected more than one race, the child is categorized as multiracial. If the family member selected Hispanic, then no matter the choice of race, the child is categorized as Hispanic.
A student is counted as economically disadvantaged in the student is eligible for free or reduced price lunch through direct certification or if the student was enrolled in a Community Eligibility Program School (CEP) that met the percentage of free or reduced price lunch eligible students necessary for all students in the CEP institution to receive free or reduced price lunch.
Students in classrooms with water fountains
Table 1 indicates that our analytic sample is 56 percent white, 9 percent Black, 17 percent Hispanic, 8 percent Asian, and 9 percent multiracial. Nearly half (48 percent) of the sample is economically disadvantaged, 19 percent are identified by the district as students who had a non-English first language, 14 percent are in special education, and 11 percent are identified as gifted or talented. 7
Analytic Approach
We begin by graphically summarizing the variation in the racial composition of classrooms in Portland. For heuristic purposes, we calculate the percent of “racially or ethnically isolated” schools and classrooms, defined as classrooms where the percentage of the race or ethnicity of students deviates by more than 15 percentage points from the percentage at the school-level (see Mickelson, 2001). We then present the variation in classroom water lead within schools graphically. In order to find disproportionate potential exposure to water lead in classrooms both the racial composition and WLLs need to vary across classrooms (e.g., if all classrooms had the same amount of water lead, student classroom assignment would not relate to differences in their potential exposure).
We next examine inequalities in potential exposure to classroom water lead by estimating models of the form:
As our omitted racial group is white, the coefficients of interest can be interpreted as the difference in classroom water lead exposure between white students and students who are Black, Hispanic, Asian, Native American or multiracial. Subsequent models (equation not depicted) add school fixed effects to equation (1), so that we are only comparing students to others in the same school. Comparing the coefficients from models with and without fixed effects allows us to understand whether differences in lead exposure are explained by the processes sorting students into schools, or by processes that sort students within the same school into different classrooms. For example, dividing the Black coefficient from the fixed effect model by the Black coefficient from the non-fixed effect model provides the percent of the Black-white disparity that is attributable to within-school sorting.
Because the negative effects of lead exposure are more pronounced for younger children than older children (Leggett, 1993), we also estimate the models separately for grades K-5 and grades 6–12. Finally, we report differences in lead exposure between students in other disadvantaged groups including economic disadvantage, special education status, and whether students spoke a non-English language as their first language. 8
Results
Distribution of Students and WLLs between and within Schools
Figure 2 shows the distribution of student race and ethnicity between and within schools, including only students with classroom water fountains. 9 Each horizontal black line represents a different school. Schools are sorted in descending order by the proportion of students of the relevant race/ethnicity category, which is represented as a square. The two dots on each line represent classrooms with the 25th and 75th percentile proportion of the relevant race/ethnicity within that school. The length of each school line represents the variation in classroom proportion of Black, Hispanic, Asian, or multiracial students within each school. Longer lines indicate greater variability in classroom proportions of each group. The solid red vertical line in each plot represents the proportion of all students in the analytic sample that identify as that racial/ethnic group, and the dashed red lines represent 15 percentage points above and below the solid line.
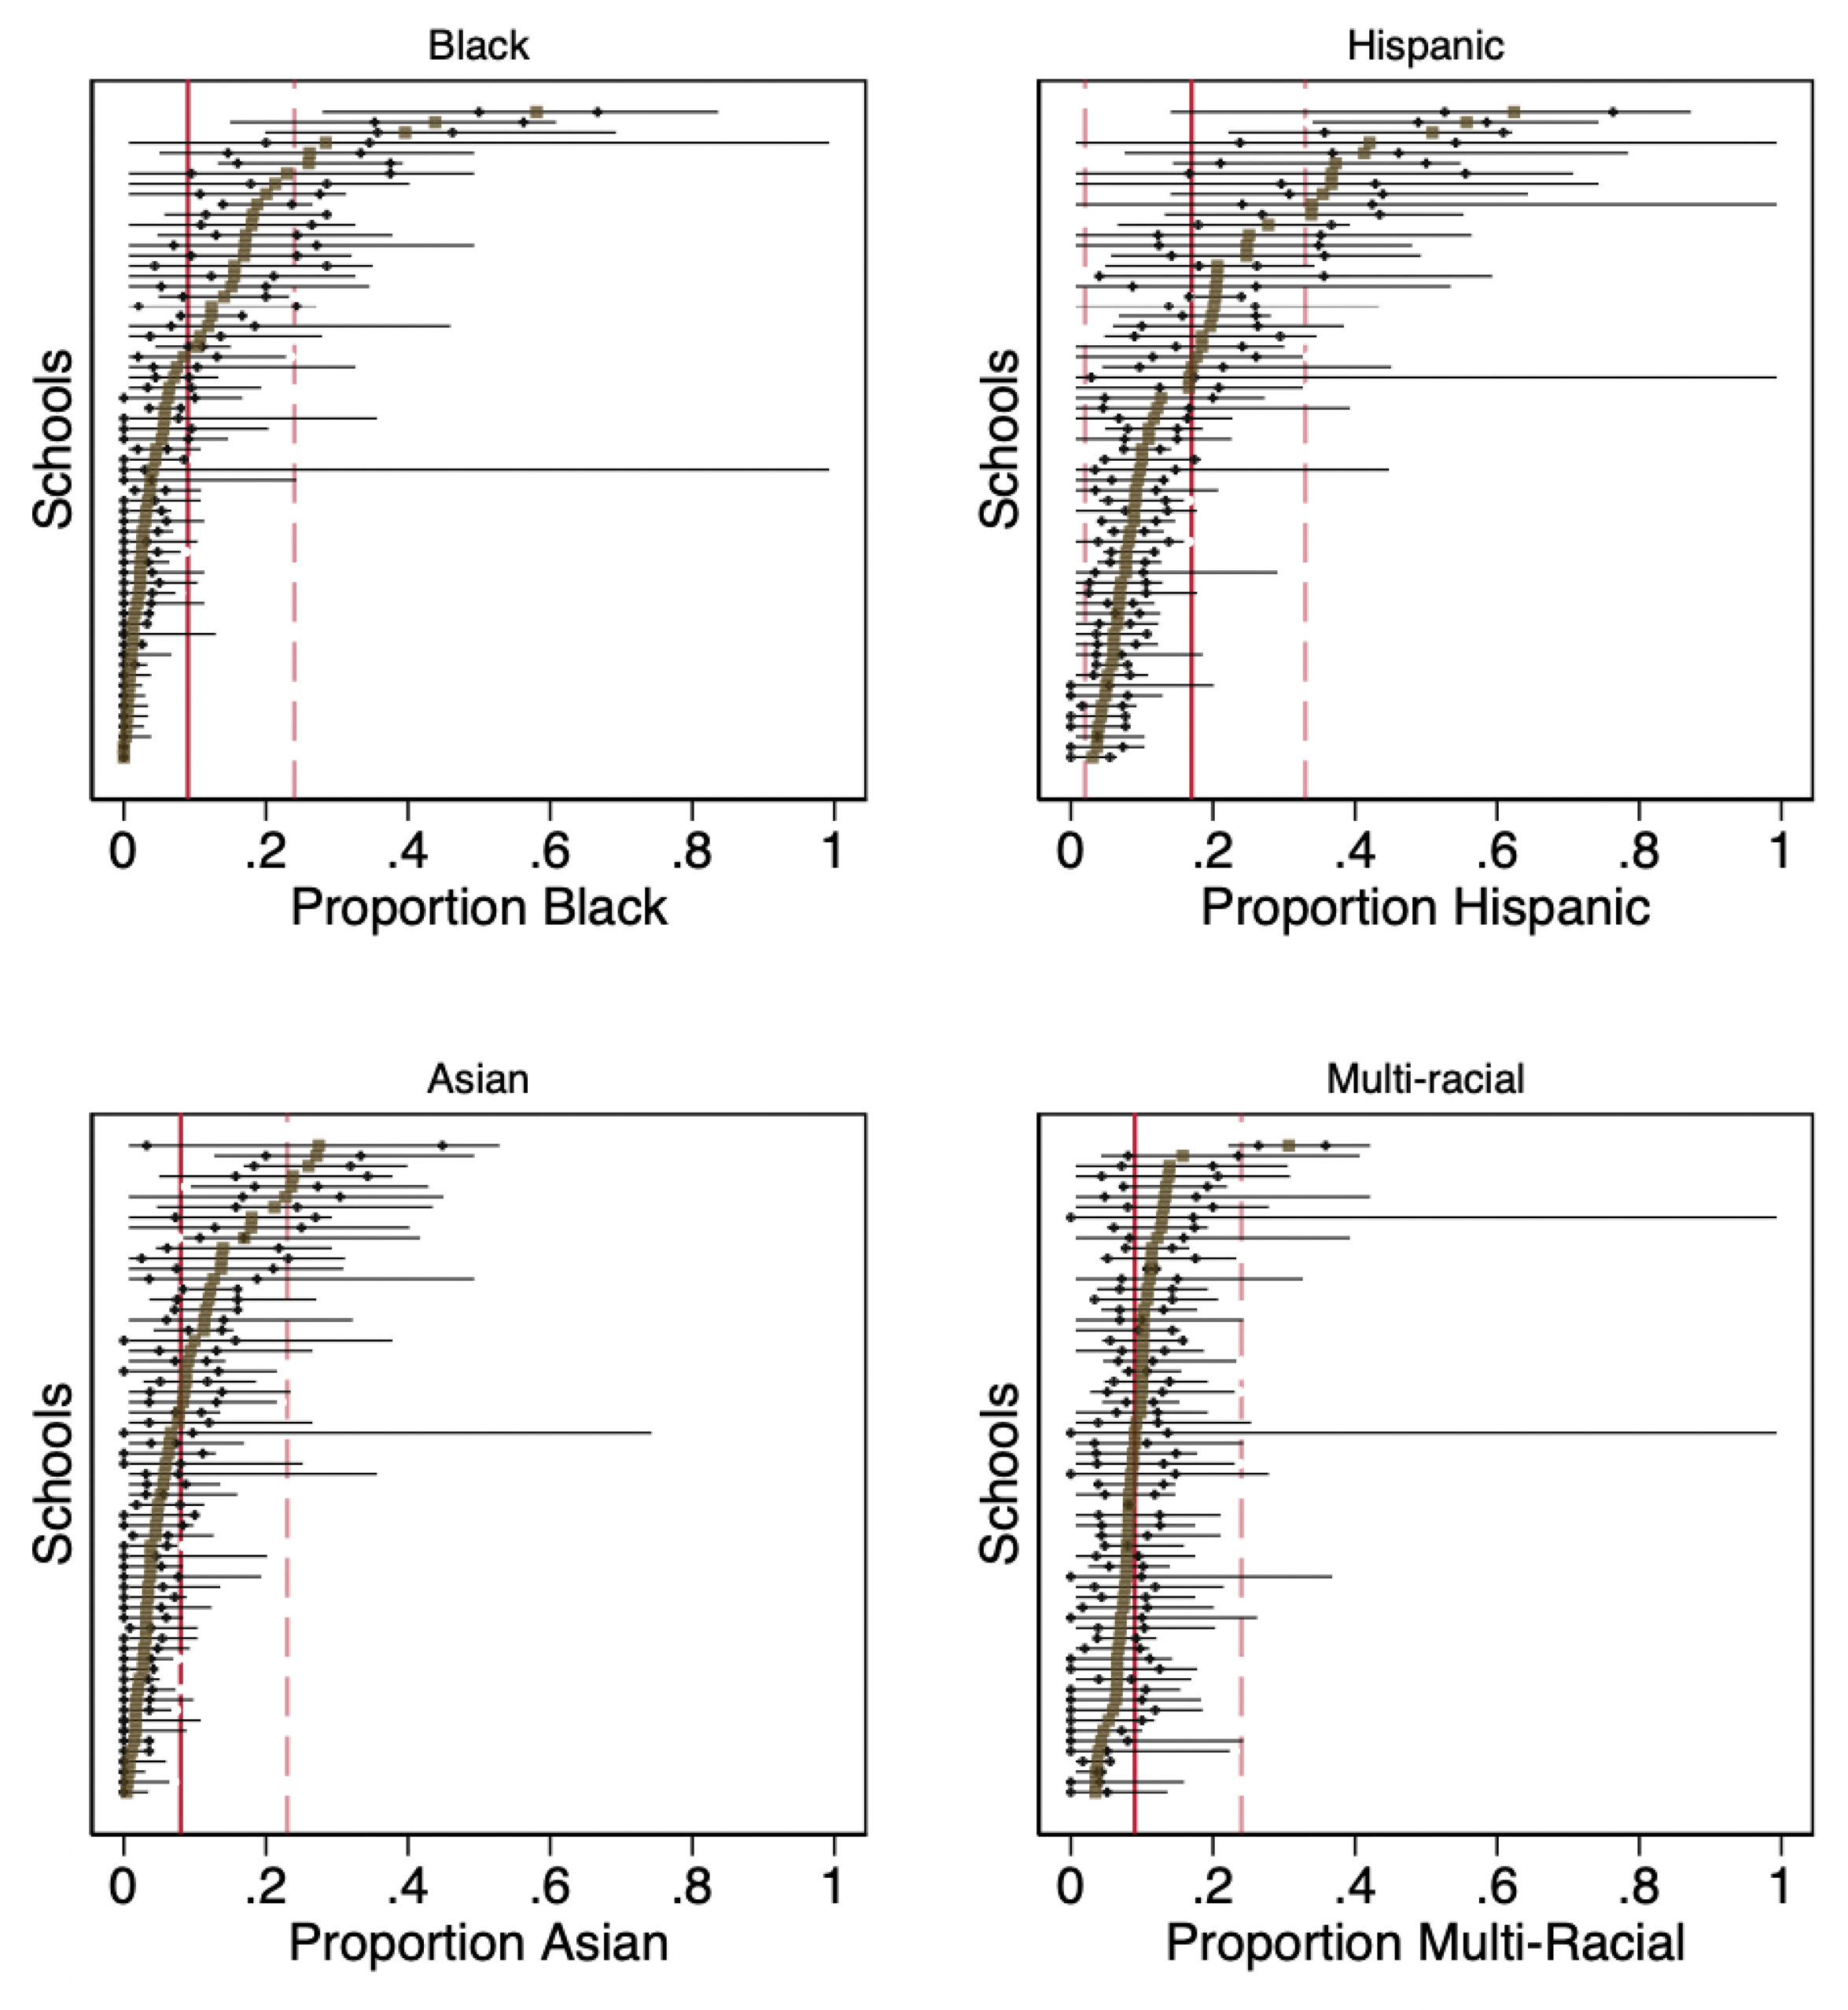
Range of racial and ethnic composition of classrooms within schools. Note. Includes 64 schools and only students in classrooms with water fountains. Schools are in rank order by proportion of the given racial/ethnic characteristic. Squares represent school mean and black dots represent 25th and 75th percentiles. Solid vertical lines represent the average of the whole sample. Dashed verticle lines are 15 percentage points above and belove the study sample average. Squares outside of these dashed lines represent schools that Mickelson’s (2001) defines as isolated.
We first look at the racial/ethnic distribution across schools. We follow Mickelson (2001) in examining racial isolation across these schools, meaning schools where the proportion of students from particular groups diverges from that in the analytic sample by 15 percentage points or more. This is shown in Figure 2, where schools with squares to the right or left of the dashed vertical lines are considered racially isolated. There are 6 schools (9 percent), for which the percent Black at the school varies from the percent Black in the analytic sample by at least 15 percentage points, 11 schools (18 percent) for which the percent Hispanic at the school varies from the percent Hispanic in the larger sample by at least 15 percent, 5 schools (8 percent) where Asian students are over-represented, and 1 school where multiracial students are over-represented. Although not depicted in Table 2, there are 24 schools (or 38 percent) where the percent of white students diverges from the analytic sample by at least 15 percent, and we find 2 schools where both Black and Hispanic student percentages diverge from the analytic sample by at least 15 percent.
Associations between Race and Ethnicity and Exposure to Lead in Classroom Water Fountains ppb Water Lead.
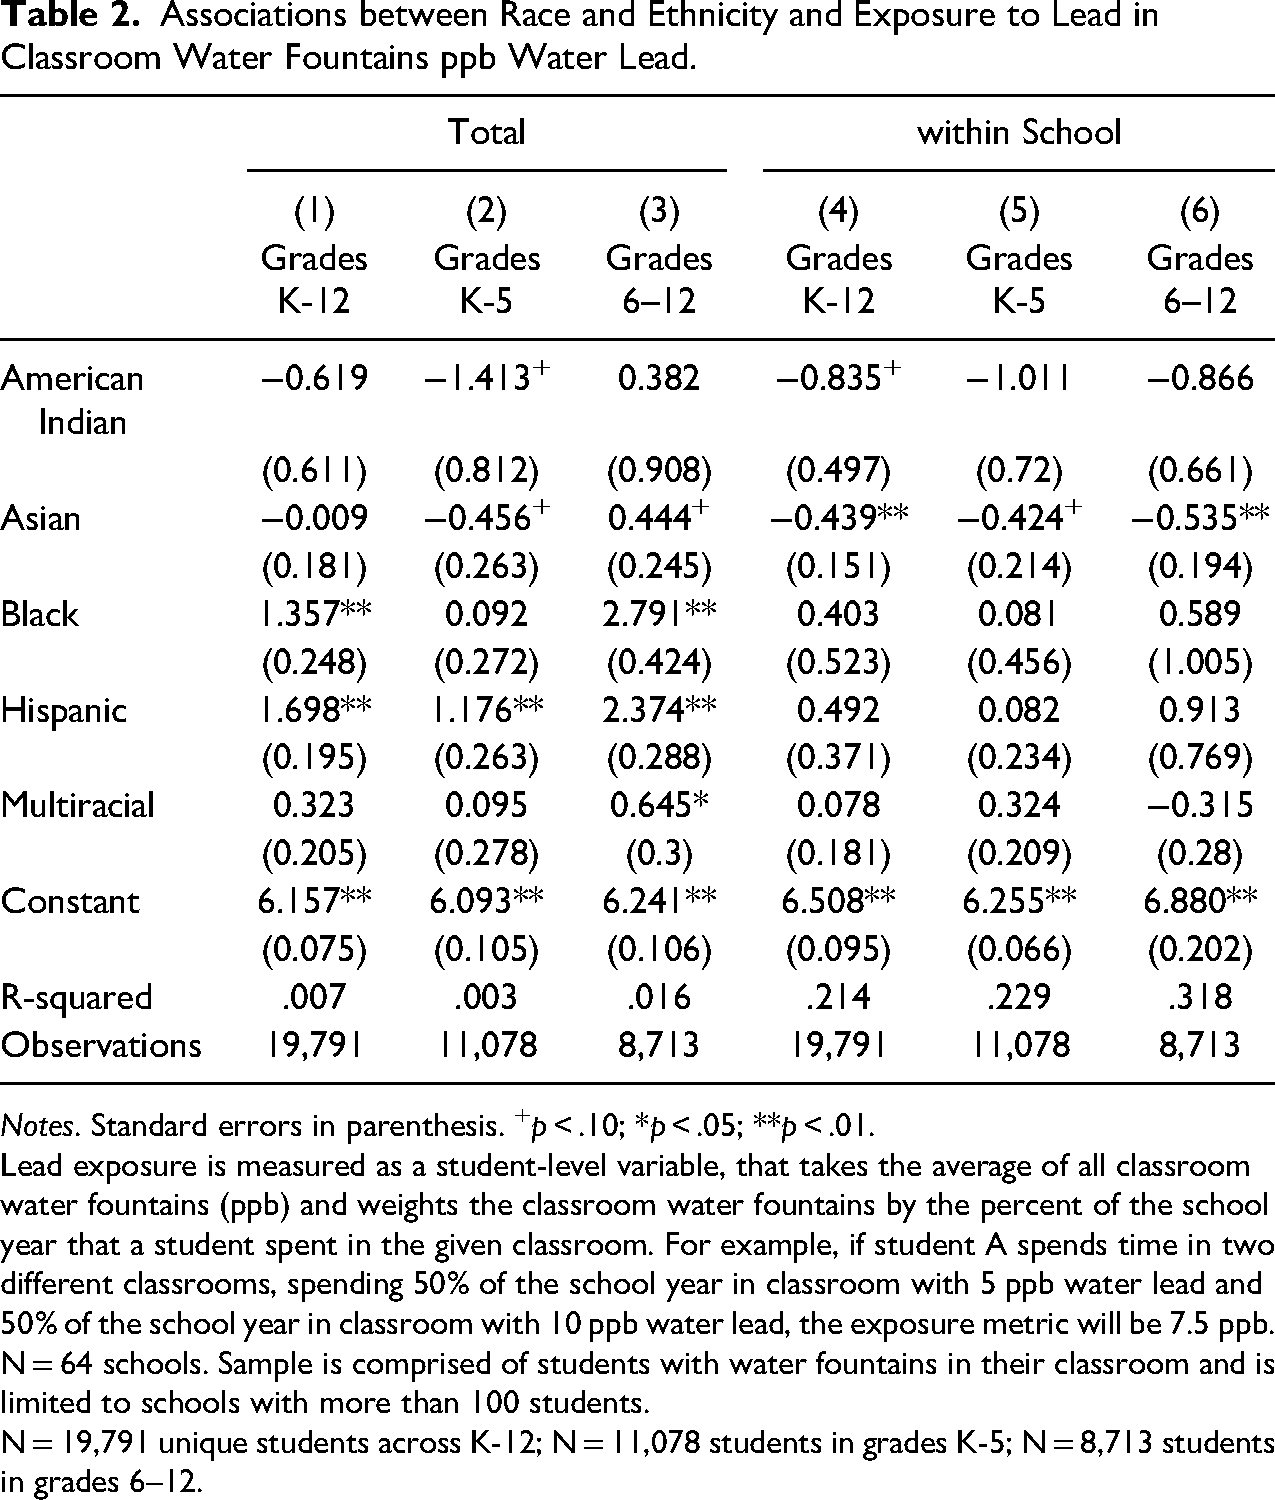
Notes. Standard errors in parenthesis. +p < .10; *p < .05; **p < .01.
Lead exposure is measured as a student-level variable, that takes the average of all classroom water fountains (ppb) and weights the classroom water fountains by the percent of the school year that a student spent in the given classroom. For example, if student A spends time in two different classrooms, spending 50% of the school year in classroom with 5 ppb water lead and 50% of the school year in classroom with 10 ppb water lead, the exposure metric will be 7.5 ppb.
N = 64 schools. Sample is comprised of students with water fountains in their classroom and is limited to schools with more than 100 students.
N = 19,791 unique students across K-12; N = 11,078 students in grades K-5; N = 8,713 students in grades 6–12.
Figure 2 also depicts the sorting of students across classrooms within schools by race and ethnicity. Using the same definition of racial isolation as above (Mickelson, 2001) we find 6 schools (10 percent) with at least one Black-isolated classroom, meaning that the percent of Black students in that classroom diverges from the percent of Black students in that school by at least 15 percent. Figure 2 shows that 11 schools (17 percent) have at least one Hispanic-isolated classroom, 5 schools (8 percent) have an Asian-isolated classroom, and 25 schools (39 percent) have a white-isolated classroom. Appendix Figure A depicts the sorting by non-English first language status. We find that 15 schools (23 percent) have at least one classroom that is isolated by non-English first language status.
Figure 3 shows the variation in classroom water lead for the 64 schools and 648 unique classrooms that had classroom water fountains. Each horizontal line shows the range of WLLs within the school and the plus signs indicate the 25th and 75th percentile lead levels in each school. Longer lines represent greater within-school variability in water fountain lead levels. The number of classrooms per school ranges from one to 24. All but one school has more than one classroom with a water fountain. We find that 22 percent of the WLL variation is between schools, with 78 percent occurring within schools. 10 Classroom lead is on average 7.4 ppb, with a median of 4 ppb and an interquartile range of 6 ppb.
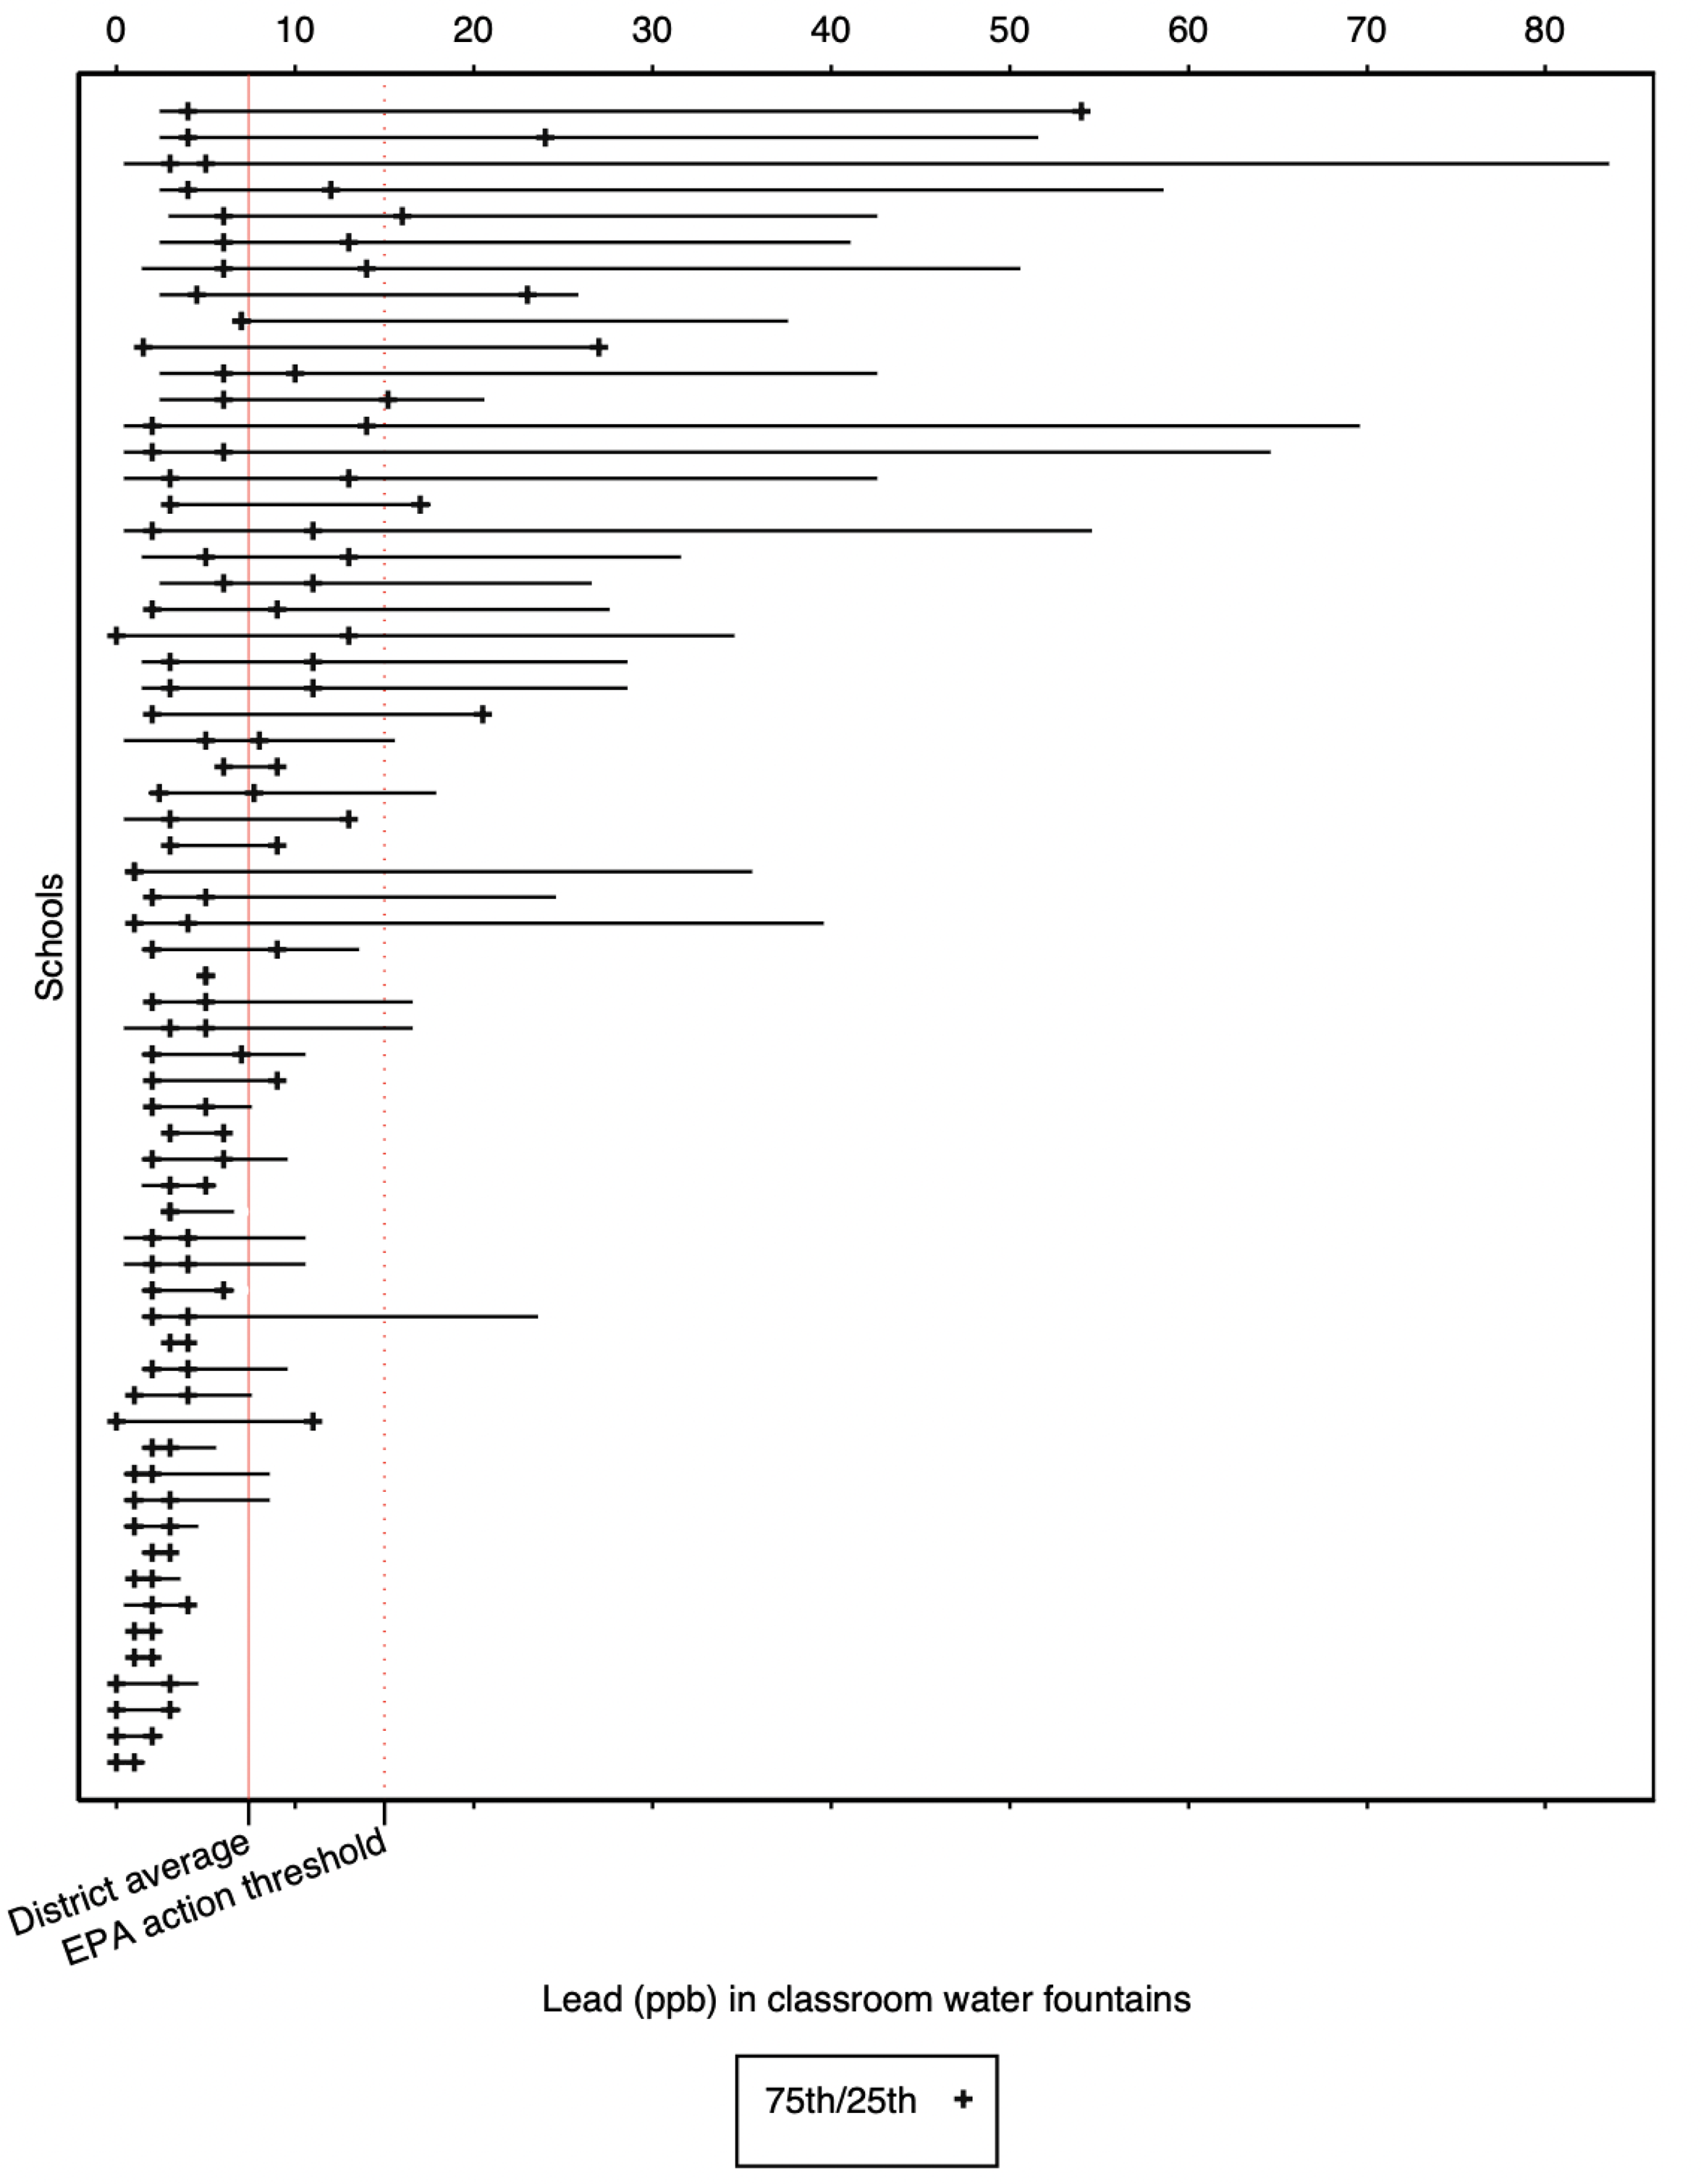
Range of classroom water fountain lead (ppb) within schools. Note. Includes all schools for which there are lead readings for classroom water fountains. N=64 schools and 648 classrooms. There are 13 classrooms per school on average, with a median of 15. Schools are ordered by the average lead in the classroom water fountains. 12% of classrooms had fountains with lead above the EPA’s action threshold of 15 ppb.
Student Exposure to Lead in Schools by Demographic and Educational Characteristics
Table 2 presents results from models estimating the association between classroom WLLs (ppb) and the race/ethnicity of students in that classroom. The first three columns show the results from OLS models examining these differences across the district as a whole. Column 1 pools students across grades K-12. The constant term indicates that white students are in classrooms where water fountains have an average WLL of 6.2 ppb, while Black and Hispanic students are in classrooms with higher average WLLs in water fountains (1.4 and 1.7 ppb more, respectively). The average Black potential exposure is 7.5 ppb and the average Hispanic potential exposure is 7.9 ppb.
Columns 2 and 3 of Table 2 present results separately by primary and secondary grades. The constants in columns 2 versus 3 suggest that white students have similar potential exposure in grades K-5 and 6–12 (6.1 and 6.2, respectively). Column 2 shows that Black students have a similar level of potential exposure to water lead as white students in grades K-5 (b = .092; se = .272; p > .05), while Column 3 indicates that in grades 6–12 Black students have higher potential exposure to WLLs (b = 2.791; se = .424, p < .01) than their white peers. Hispanic students, by contrast, are in classrooms with higher WLLs in both K-5 (b = 1.176; se = .263; p < .01) and grades 6–12 (b = 2.374; se = .288; p < .01).
Columns 4 through 6 in Table 2 mirror columns 1–3, but additionally include school fixed effects, and thus report within-school differences in exposure to classroom water lead. Comparing students to others in the same school, we find that the coefficients on Black and Hispanic decrease in magnitude and are no longer statistically significant. Surprisingly, we find that Asian students have statistically significantly less potential exposure to water lead than white students within the same school (b = −.439; se = 1.51; p < .05 for grades K-12).
Comparing columns 1 and 4 provides an indication of the proportion of the total racial/ethnic differences in potential exposure to water lead (Column 1) that occurs within schools (Column 4). This simple decomposition shows that, on average across grades, between 25 and 30 percent of the overall differences in potential exposure to water lead between white students and their Black and Hispanic peers is occurring within schools, with the rest occurring between schools. This indicates that differences in potential water lead exposure between Black and Hispanic students and their white counterparts are primarily due to the school they attend, and less about the classrooms that they are in within a particular school.
Table 3 builds on Table 2 by adding four additional student characteristics to the model: economic disadvantage, whether students had a non-English first language, whether the student is in special education, and whether the student is identified as talented or gifted. Comparing the racial differences that we observe in Tables 2 and 3, we see that the differences between white students and their Black and Hispanic counterparts are smaller once we include these additional covariates, but that significant differences remain.
Associations between Educational Characteristics and Exposure to Lead in Classroom Water Fountains ppb Water Lead.
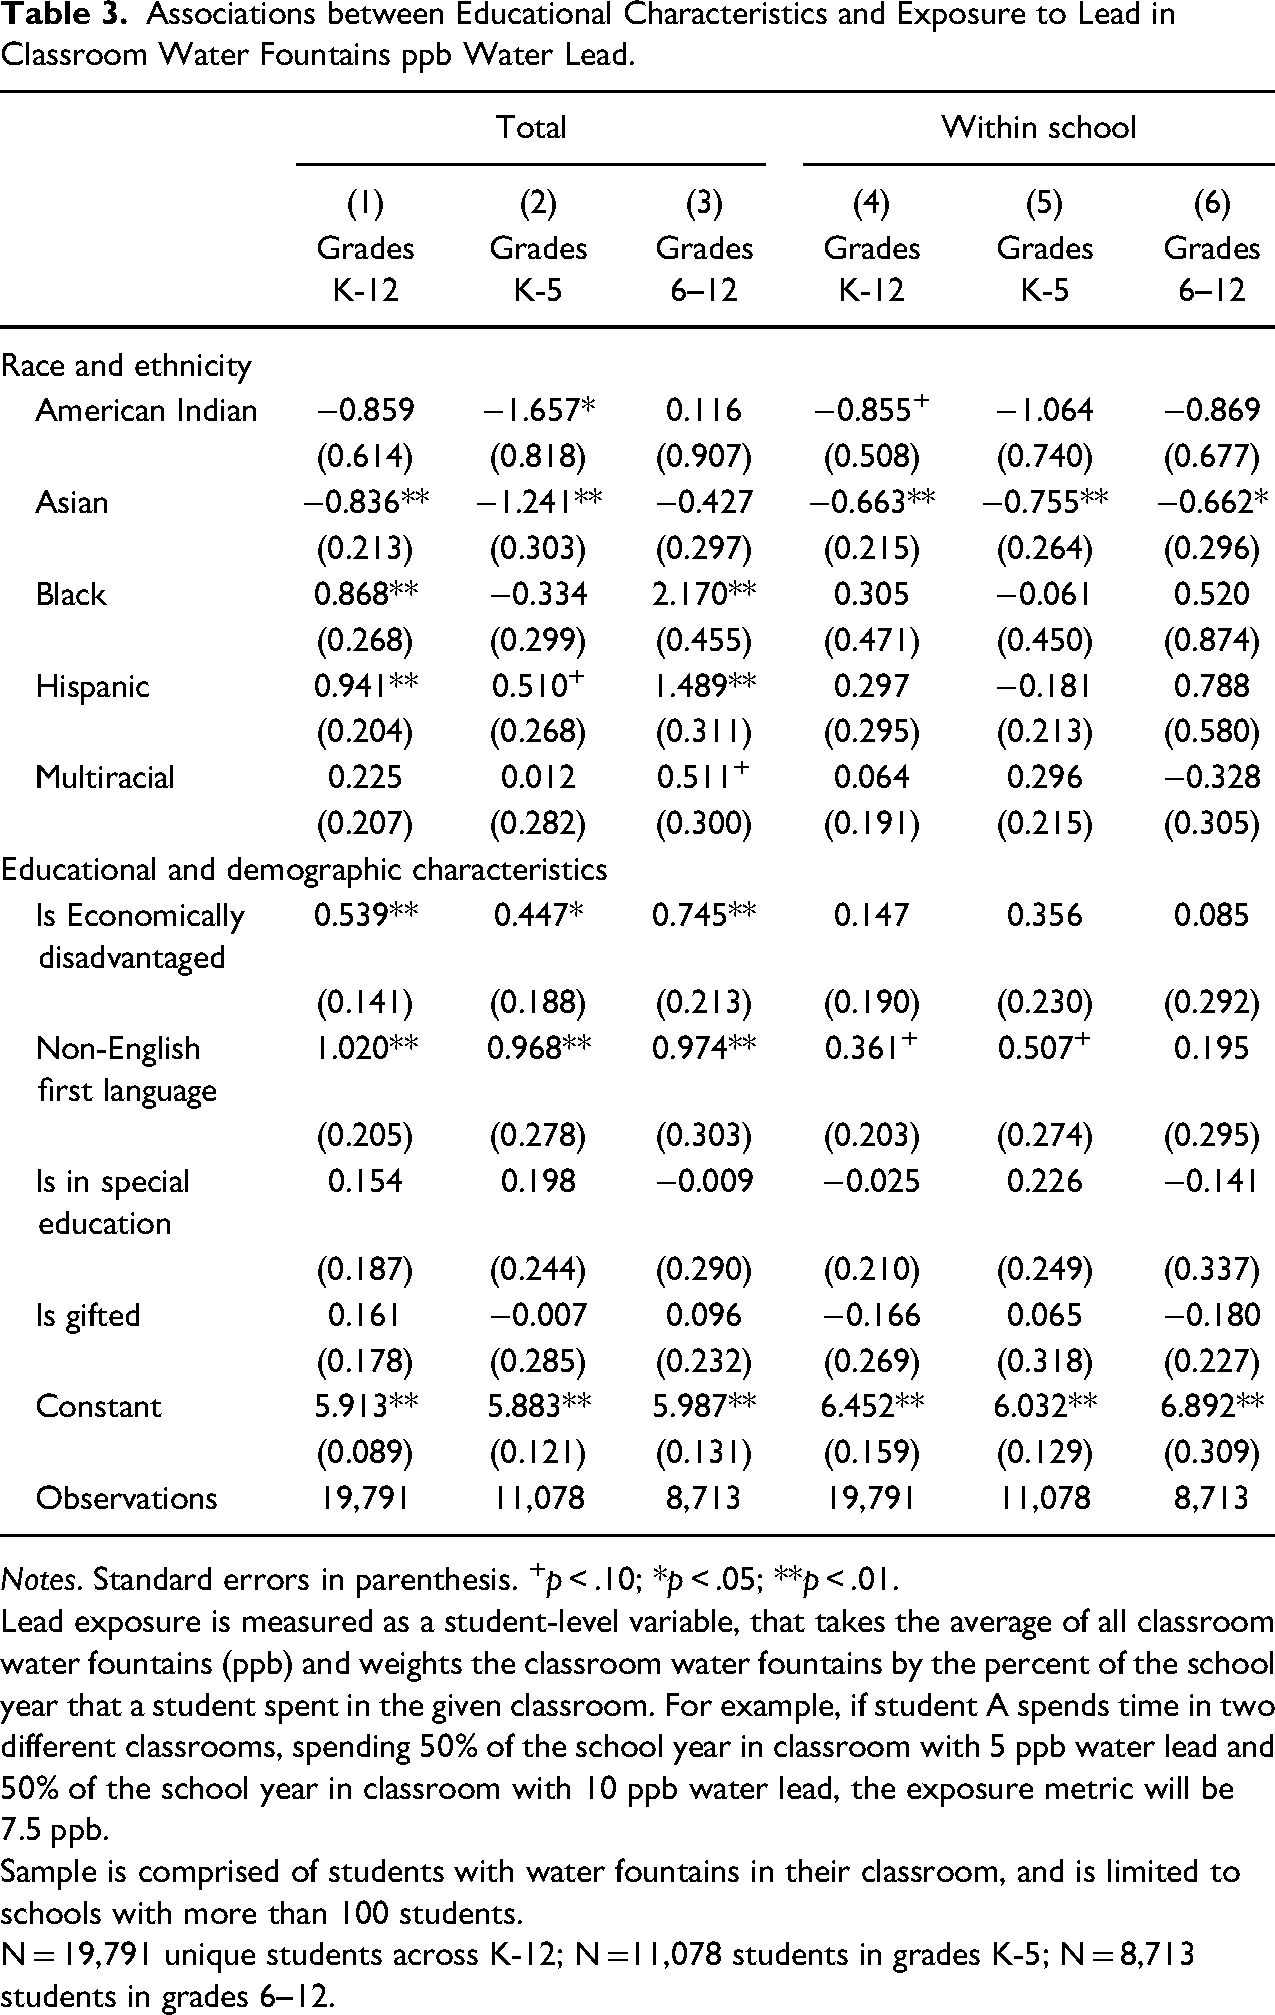
Notes. Standard errors in parenthesis. +p < .10; *p < .05; **p < .01.
Lead exposure is measured as a student-level variable, that takes the average of all classroom water fountains (ppb) and weights the classroom water fountains by the percent of the school year that a student spent in the given classroom. For example, if student A spends time in two different classrooms, spending 50% of the school year in classroom with 5 ppb water lead and 50% of the school year in classroom with 10 ppb water lead, the exposure metric will be 7.5 ppb.
Sample is comprised of students with water fountains in their classroom, and is limited to schools with more than 100 students.
N = 19,791 unique students across K-12; N =11,078 students in grades K-5; N = 8,713 students in grades 6–12.
We also find noteworthy differences in students’ potential water lead exposure along two of these other dimensions. Comparing students across Portland, we see in column 1 that students whose first language was not English are in classrooms with an average of 1.02 ppb (p < .01) more water lead than students whose first language was English. Economically disadvantaged students are in classrooms with slightly more classroom water lead (b = .539 p < .01) than their non-economically disadvantaged peers across the district. The elevated WLLs of both students whose first language was not English and economically disadvantaged students are primarily driven by sorting into different schools, though it is worth noting that even within schools students identified as having a non-English first language are in classrooms with marginally significant higher WLLs than students whose first language was English in the same school (b = .361; p < .10). By contrast, students in special education and students identified as gifted are in classrooms with largely similar levels water lead as their non-special education and non-gifted peers both district-wide and within the same school. As in Table 2, comparing columns 1 and 4 suggests that somewhere around a third of the noteworthy differences that we observe overall are due to within school sorting processes that sort students in the same school into classrooms with different WLLs, and that the majority of the differences we observe are due to sorting students into different schools.
Discussion
Urban schools create inequality between different groups of students in a number of ways, but research on these inequities often focuses on disparate instructional and curricular opportunities rather than differences in physical learning environments (Flores & Gunzenhauser, 2021; Lacoe, 2020; Milner, IV, 2014; Mirra & Rogers, 2020; Moller & Stearns, 2012; Neuman & Moland, 2019; Strayhorn, 2008). The primary contribution of this study is its ability to examine an overlooked disparity in the built environment with the potential for lasting physical consequences for students: higher WLLs across and within urban schools along racial, ethnic and other student characteristics using novel data linking students to classroom-level drinking fountain lead data. Our findings provide clear evidence of disparities in classroom WLLs to which students are exposed, with the greatest potential burdens borne by historically--and currently--disadvantaged students. Black and Hispanic students are exposed to more water lead in their classroom water fountains than their white peers. There are also notable differences in classroom lead exposure across schools along economic lines, with economically disadvantaged students being exposed to greater lead levels than their economically advantaged peers. Finally, students with a non-English first language are in classrooms with higher levels of water lead than their peers at the same school who spoke English as their first language.
These differences largely occur because students are sorted into schools with different average levels of water lead, and to a lesser degree from the sorting of students into different classrooms within schools. As such, this study highlights how residential segregation and school enrollment policies that link neighborhoods to specific schools can lead to racial differences in lead exposure not only in home environments, but also at school (Frankenberg, 2013; Hanna-Attisha et al., 2016; Marcotte & Dalane, 2019; Owens, 2020; Yeter et al., 2020). To the degree that districts are differentially responsive to maintenance issues, upgrades, and parental pressure (Billingham, 2015; Johnson, 2013; Khalifa et al., 2014; Sosina & Weathers, 2019), these processes are likely to exacerbate environmental injustice.
Although sorting into schools accounts for the majority of the differences that we observe, the marginally significant differences between the classroom WLLs of students who spoke a non-English language as their first language and students at the same school for whom English was their first language are noteworthy. Even though the majority of the differences that we observe are driven by between school sorting, if these within school differences are replicated by future work, they would indicate that within school sorting processes are important for assignment to high WLL classrooms. These findings are thus perhaps suggestive of the fact that considerations like tracking can create not only important differences in students’ opportunities to learn and social worlds, and can also serve to differentially expose students to harmful physical environments. This is consistent with prior research showing disparities in the physical quality of classrooms between English language learner students and special education students and their peers (Gándara et al., 2003; Holland, 2019).
Limitations
The results presented in this paper demonstrate inequalities in water lead exposure in a single city and may not be generalizable to other cities. Further, the amount of lead in water from a single tap can vary depending on the time of day, the season, and the frequency of use of the fixture. This can lead to instances where lead is missed (Triantafyllidou et al., 2007), so that the results presented in the paper may be lower bounds for the true lead exposure. On the other hand, fixtures were tested in the spring when the temperature in Portland, Oregon is relatively warm and results may be higher than during other parts of the school year. Future efforts collecting multiple water samples throughout the school year from the same fixture could help to minimize students’ WLL exposure over time. Future research documenting which fixtures are highly utilized, and by which students would allow researchers to move beyond understanding the potential for students to be exposed to this harmful neurotoxin at school, and more accurately capture their actual exposure to lead in the water at schools.
Implications and Recommendations
Although no level of lead is viewed as safe for children to consume and any differences are a cause for concern, it is perhaps helpful to interpret the differences in average potential exposure that we observe in light of the EPA's action level. The EPA recommends remediation when lead levels in water delivered to users of public drinking water systems reaches 15 parts per billion (Agency for Toxic Substances and Disease Registry, 2019). The marginal differences in classroom lead exposure that we observe translate to an expectation that 8.3 percent of white students will exceed this level of exposure, compared with 11.3 percent of Black students and 12 percent of Hispanic students.
Environmental justice policies specifically aim to reduce the disproportionate burden of environmental exposures on disadvantaged groups (Milner, 2012b). Our results suggest that the lead exposure differences between schools account for the majority of racial and ethnic differences in potential exposure to lead at school. Remediation efforts should thus focus not only on shutting off specific fixtures with highly elevated lead levels, as is typically done in remediation efforts, but rather on replacing all lead service lines throughout the school.
Schools in New York City, for example, recently replaced fixtures with lead levels above the EPA threshold (15 ppb) (Williams, 2021). Although New York City's remediation efforts lead to a 4 percent decrease in the percent of fixtures with elevated lead in the average Black student's school, racial disparities in lead exposure remained (Latham & Jennings, 2022). If schools in Portland had taken this more typical approach, while all students would have been exposed to less lead than they were pre-remediation, Black and Hispanic students would have remained in classrooms with significantly higher WLLs than white students. 11 Even if schools in Portland had replaced individual fixtures above the 75th percentile of the water lead distribution (which in this context corresponds to 8 ppb and higher), significant differences in potential exposure would have remained. Although these remediation strategies would have reduced the disparities in potential exposure, Black and Hispanic students in Portland would have still been going to school in classrooms with significantly more lead than white students. Thus, from an environmental justice perspective, replacing individual fixtures fails to remediate the disproportionate lead exposure burden for disadvantaged groups, and broader efforts like those taken in Portland are necessary.
Supplemental Material
sj-docx-1-uex-10.1177_00420859221107611 - Supplemental material for Inequities in Student Exposure to Lead in Classroom Drinking Fountains: Descriptive Evidence Comparing Students within and Across Schools in Portland, Oregon
Supplemental material, sj-docx-1-uex-10.1177_00420859221107611 for Inequities in Student Exposure to Lead in Classroom Drinking Fountains: Descriptive Evidence Comparing Students within and Across Schools in Portland, Oregon by Michelle Spiegel, Emily K. Penner and Andrew Penner in Urban Education
Footnotes
Declaration of Conflicting Interests
The author(s) declared no potential conflicts of interest with respect to the research, authorship, and/or publication of this article.
Funding
The author(s) disclosed receipt of the following financial support for the research, authorship, and/or publication of this article: This work was supported by the National Institute of Child Health and Human Development (grant number R01HD094007).
Supplemental Material
Supplemental material for this article is available online.