



Abstract
The aim of investigations here was to examine whether cellulose fibers dyed with CI Sulfur Black 1 (SB1), either alone or in combination with indigo (CI Vat Blue 1), may be dissolved and regenerated into fresh fibers with the viscose process. Hence, dyed cellulosic fibers dyed were subjected to the viscose process of spin dope preparation and regeneration to determine whether the dyestuff(s) survived in the cellulose or leached out into the process liquors. Multiple levels of the process parameters, as reported in literature, were examined. The results indicate that the SB1 dye, both alone and in combination with the indigo, survived in the cellulose and did not leach out. However, a change of color appearance was observed in the regenerates from fibers containing both SB1 and indigo, which is attributed to rearrangement in the distribution of dyestuff molecules. The research is part of a fiber-to-fiber recycling effort, where fiber polymers are to be extracted from used textiles and respun into fresh fibers for the production of new textiles. If the dyestuff could be retained in the polymer through dissolution/regeneration it would eliminate the need both for prior dyestuff removal and later redyeing of the regenerated fibers.
One element in the circular economy strategy for textiles is to recover fibers from used articles and employ them to create new products. A direct reuse of fibers is often not feasible, and thus it is of interest to explore avenues of manufacturing fibers afresh from the polymeric material. 1 With cellulosic fibers (e.g., cotton and viscose), the process of conversion into new fibers involves dissolution of the polymer in solvent, and then reprecipitating it in fiber form, in nonsolvent (i.e., regeneration). The technologies available for cellulose fiber regeneration include the viscose process, lyocell process, and the use of ionic liquids, among others. 2
The cellulose fiber regeneration technologies differ primarily in the solvent and non-solvent employed. In the viscose process, cellulose is treated with NaOH, then reacted with CS2 to yield the derivative cellulose xanthate, which is then dissolved in NaOH, and extruded into an acidic bath to decompose the cellulose xanthate back to cellulose and reprecipitate the polymer in filament form that may be cut into staple fibers of desired lengths. 3 In the lyocell process, the cellulose is dissolved in the solvent N-methyl morpholine-N-oxide (NMMO), and then extruded into water to reprecipitate the polymer. 4 Ionic liquids are also solvents for cellulose and the technology is similar to the lyocell process, in that the cellulose is dissolved in an ionic liquid (e.g., 1,5-diazabicyclo[4.3.0]non-5-ene acetate) and extruded into water for reprecipitation of the polymer. 5 The lyocell and ionic liquid technologies are considered more environmentally benign than the viscose process as the solvents may be recovered to near-complete levels at the end of fiber spinning. The disadvantage of the viscose process is the use of sulfur-based reagents, which have the potential for significant damage if released into the environment. However, over the years, there have been significant improvements in the technology of CS2 recovery and entrapment of process wastes, that have allowed for production of viscose fibers to continue.3,6 At the present time, the viscose process supplies the bulk of the annual output of regenerated cellulose fibers (approximately 80%), followed by the lyocell process (approximately 4%), and other processes that contribute minor proportions. 7 To the best of the authors’ knowledge, fiber production from ionic liquid processes have not yet attained commercial scale. Therefore, the viscose process is a reasonable choice as avenue for investigations on cellulose fiber-to-fiber recycling.
Fibers in clothing are typically colored, and thus the question arises on the fate of dyestuff(s) in conversion of the polymer into new fibers. The options are to either remove the dyestuff prior to processing or attempt to retain it in the polymer and produce colored fibers. The latter option has the advantage that energy and material inputs required for both removal of dyestuff, and later dyeing of fresh fibers, are avoided. Efforts towards treatment of dyeing process wastewater are also avoided. However, for this to be viable with cellulosic fibers, the dyestuff should not be degraded, leach into the solvent and nonsolvent during the dissolution/regeneration process, or interfere in the process of fiber spinning.
Dyestuffs employed for coloration of cellulosics stem predominantly from the application classes of direct, fiber reactive, azoic, vat, and sulfur; with chromogenic entities typically based on azo (mono-, dis-, tris-), anthraquinone, phthalocyanine, fused ring polycyclic, and indigoid chemistries. 8 Among all dyestuffs from the different application classes, the two most employed for the coloration of cellulosics are perhaps indigo (CI Vat Blue 1) and CI Sulfur Black 1 (SB1), with estimated annual production volumes in the regions of 70,000 tonnes 9 and 100,000 tonnes, 10 respectively. A significant area of application for both is in the coloration of denim, a product which accounts for about 10–12% of the annual global output of cotton fibers.11,12 Indigo produces the characteristic blue color, and sulfur black is utilized to yield black or grays. Moreover, both may be employed in tandem to vary color tone of the blue, either by dyeing cellulosics first with SB1 and then with indigo (termed “bottoming”) or in the reverse order (termed “topping”). 13
The exact molecular structure of SB1, which is produced by heating a mixture of sodium 2,4-dinitrophenolate and sodium polysulfide in water, remains elusive; but a speculative molecular structure, consistent with its elemental constitution, is shown in Figure 1(a). 10 Indigo is synthesized from aniline, cyanic acid, and formaldehyde through the “Pfleger” route, and it has a defined structure, shown in Figure 1(b). 9 Both dyestuffs are similar to the extent that they are applied through a redox process. The parent forms of the dyestuffs, which are insoluble in water, are made soluble through reduction, adsorbed onto cellulosics, and there, reoxidized back to their parent form. The complete reduction, and therefore solubility, of indigo is achieved at a redox potential of approximately −700 mV, 9 whereas SB1 becomes soluble without complete reduction of all reducible groups at a redox potential of about −400 mV, 14 though the highest affinity of the dye for cellulosics is observed at around −600 mV. 15
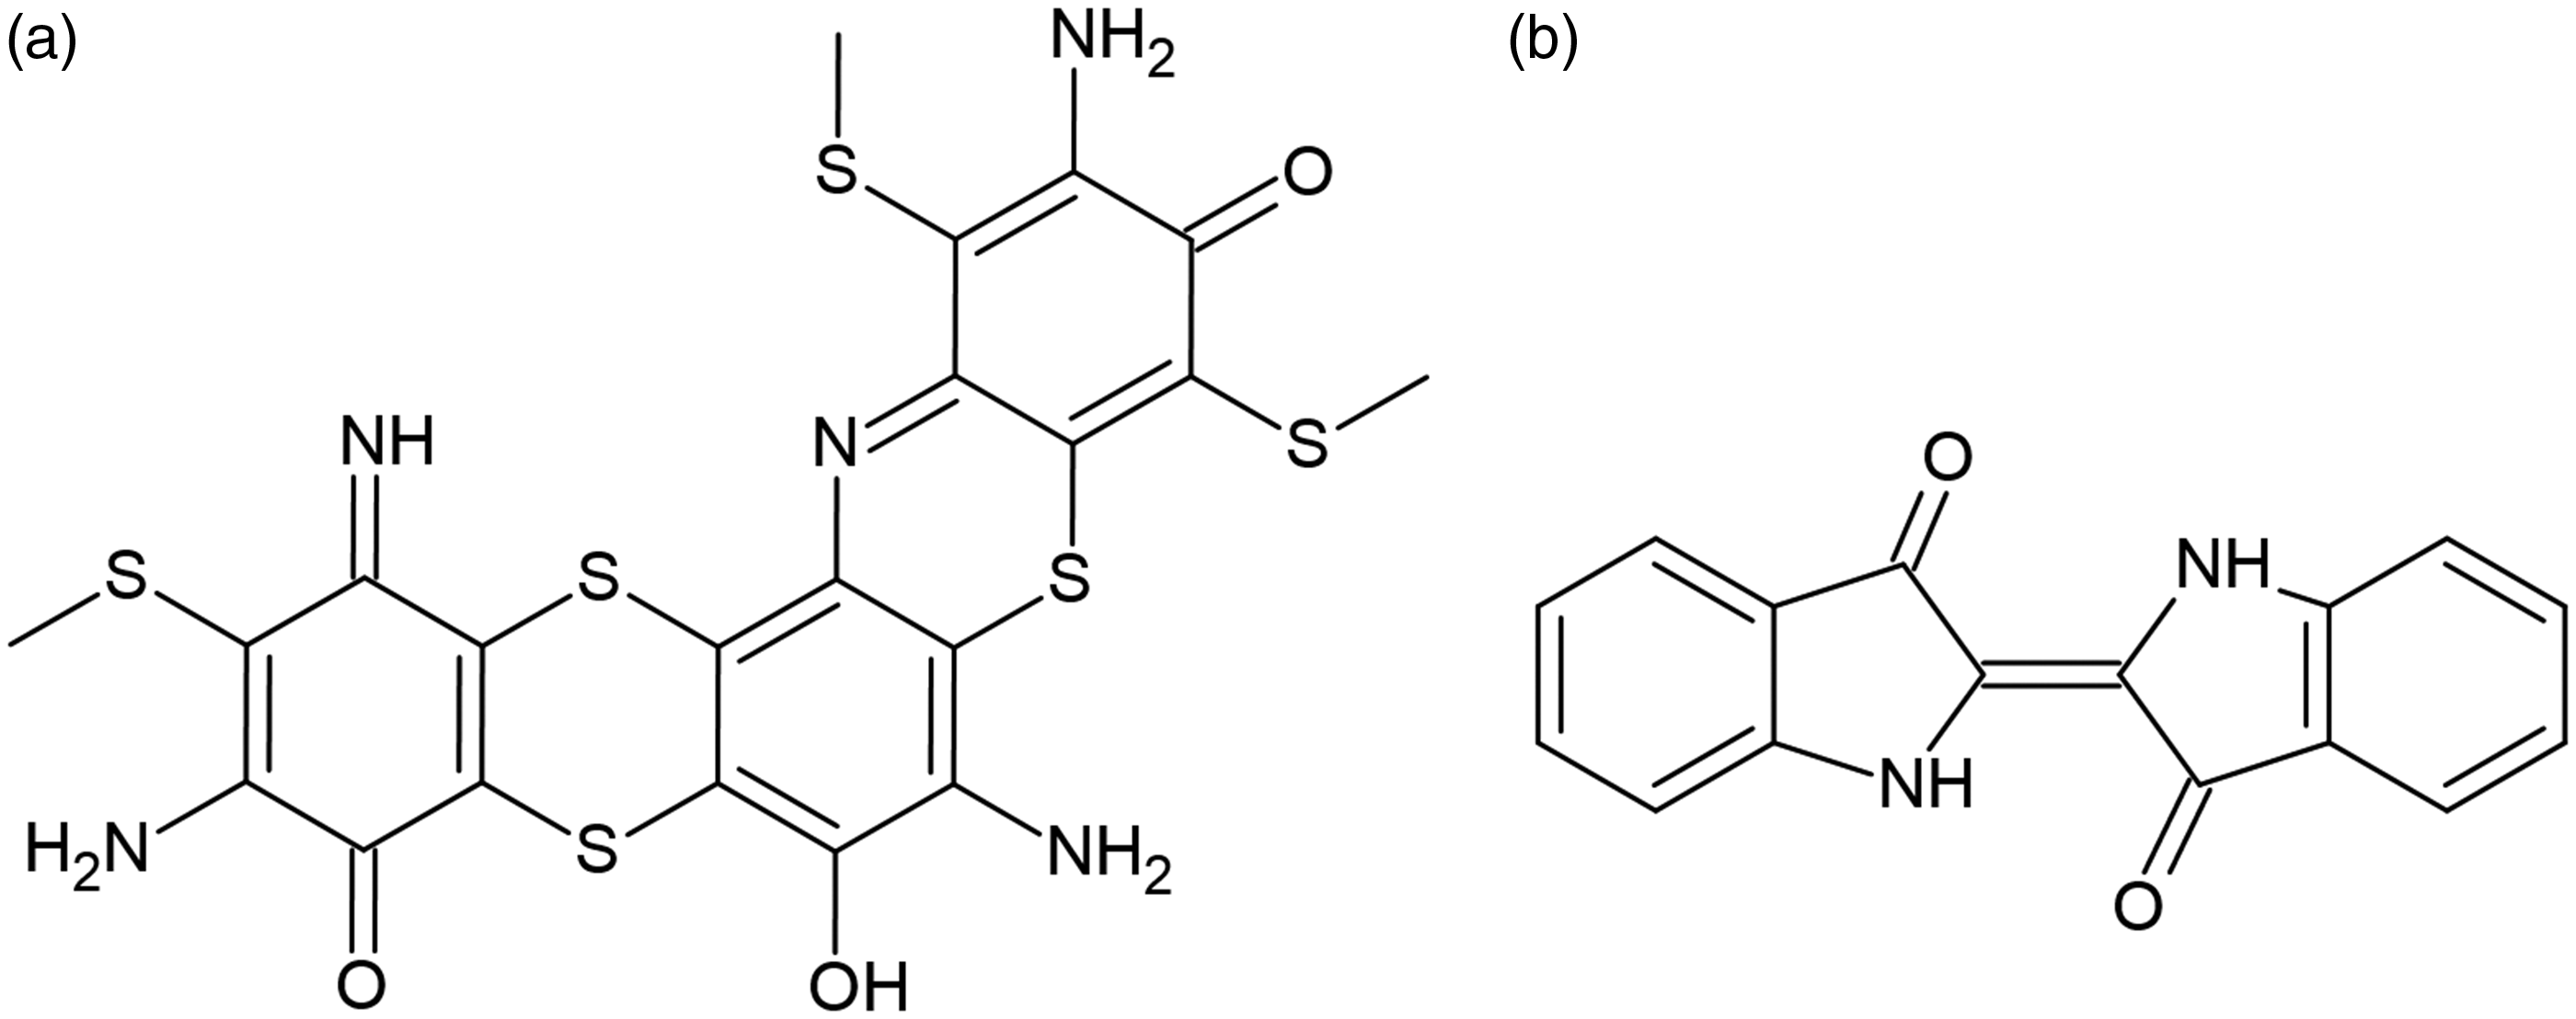
Dyestuff structures: (a) CI Sulfur Black 1 (speculative) 10 and (b) Indigo (CI Vat Blue 1).
The work presented here is part of ongoing investigations aimed at determining the feasibility of regenerating fresh fibers from colored cellulose recovered out of waste textiles, without removing dyestuff(s). With viscose technology chosen as the targeted regeneration process, it is critical to consider the reducing conditions that persist in the process due to the added CS2 and the evolution of di- and tri-thiocarbonates, Na2S and H2S as byproducts.16,17 The research initially concentrates on indigo and SB1, the two most commonly employed dyestuffs for cellulosic fibers. It was previously determined that indigo-dyed cellulosics may be subjected to the viscose process without leaching of the dyestuff into the dissolution or regeneration baths. 18 An explanation for that is the redox potential developed during the viscose process did not exceed −700 mV, a potential at which indigo begins to become solubilized. However, as stated previously, SB1 becomes solubilized at lower redox potential magnitudes and therefore it is of interest to determine the fate of SB1 when cellulose containing the dye is subjected to the viscose process
This report presents the results of similar investigations on cellulosics dyed with SB1, both alone and in combination with indigo (topping). The primary focus was on fate of dyestuff during cellulose regeneration through the viscose process. This lead to the following choices in the design of experiments.
The investigations were performed on freshly dyed cellulosics and not those recovered from waste material, to avoid any influence of polymer recovery processes on the dyestuffs. Cotton constitutes about two-thirds of all cellulosics employed in the manufacture of textiles,
7
and is also the fiber type predominantly used in the manufacture of denim,
19
where SB1 and indigo are widely used. Thus, typical examples of cellulosics dyed with SB1 and indigo will be cotton fibers. However, the high degree of polymerization (DP) in cotton makes it unsuitable for direct regeneration through the viscose process, and thus hydrolytic pretreatments become necessary to adjust the DP. However, as reported by others,
20
hydrolytic pretreatments of colored cotton may contribute to dyestuff leaching and/or degradation, and make it difficult to determine the role of dyestuff interaction with cellulose dissolution/regeneration media. Thus, to avoid interference from the influence of hydrolytic pretreatments, the cellulosics employed for dyeing with indigo and SB1 were viscose fibers.
Materials
Viscose fibers of fineness 1.7 dtex and length 40 mm (Danufil® F) were kindly donated by Kelheim Fibres GmbH (Germany), and used as received. The following commercial products were used in the dyeing experiments: a liquid formulation of prereduced SB1 (Diresul® Liquid Black RDT, Archroma Specialty Chemicals, Switzerland), wetting agent, reducing agent, and stabilizer (Leonil KS fl., Sulfhydrat F 150, and Stabilisal S fl., respectively; Dystar Textilfarben GmbH & Co. KG, Germany). All other reagents were of analytical grade. Deionized water of conductivity less than 10 µS/cm was employed in the formulation of solutions.
Methods
The investigations consisted of the following elements.
The redox potential was monitored as dyed fibers were subjected to the viscose process. The aim was to assess the likelihood of dye loss from fibers, based on the measured values and knowledge of dye reduction and solubilization as function of redox potential. SB1 dyed cellulose, as well as mixtures of SB1 dyed and undyed cellulose, were subjected to dissolution and regeneration through the viscose process. The aim was to assess differences in dye content between the fibers (before dissolution) and regenerates (i.e., after the viscose process). Further, if mixing virgin pulp with recovered cellulose becomes necessary for improving fiber quality, the homogeneity of dyestuff distribution throughout the cellulose mass will be crucial. Therefore, a further aim was also to assess whether SB1 present in recovered cellulose would be distributed evenly across the entire cellulose mass. The experiments tested a range of values for CS2 content in the xanthation step, 30–75% relative to the mass of cellulose, as reported in the literature.21,22 Powder X-ray diffraction (PXRD) analyses of the regenerates were performed to assess any potential agglomeration of dyestuff molecules, as dyed fibers were dissolved and regenerated through the viscose process.
Dyeing with SB1
The procedure followed was that recommended by the supplier. Approximately 10 g of fibers were immersed, under constant stirring, in 200 ml dyebath composed of 2 g/l prereduced SB1, 2 g/l Leonil KS fl., 7.5 g/l each of Stabilisal S fl. and Sulfhydrat F 150, 5 g/l Na2CO3; heated to 40–50°C, and maintained at that temperature for 10 min. Then, NaCl (5 g/l) was added, the temperature raised to 90°C, another dose of NaCl (5 g/l) was added, the temperature maintained at 90°C for 30 min, before allowing the dyebath to cool to 50°C. The fibers were then removed, rinsed under cold running water, and then subjected to an oxidation step by immersion, under constant stirring, in 200 ml solution containing 1 ml/l of 30% w/w H2O2 and 0.7 ml/l of 80% w/w CH3COOH at 50°C for 20 min. The fibers were then taken out, rinsed under running cold water, and dried in ambient atmosphere. All operations were performed in open vessels (beakers). Fibers were dyed in multiple batches, and a 3.9% coefficient of variance was observed in their dye contents as measured from their nitrogen content (see the following), which was deemed acceptable.
Topping of indigo-dyed fibers with SB1
Viscose fibers dyed with indigo from previous work, 18 were dyed as described earlier, but from dyebaths containing 1 g/l prereduced SB1.
Regeneration through the viscose process
The dyed fiber samples were cut into short lengths (of approximately 2 mm) and subjected to a viscose process of fiber regeneration, derived from descriptions in literature.21,22 The procedure consisted of the steps listed in Table 1, each of 60 min, with intermittent agitation of the mixtures (stirring, shearing) about every 10 min using a glass rod.
Viscose process of fiber regeneration

These experiments were performed on fibers dyed with SB1, and mixture of fibers dyed with SB1 and undyed fibers (25% and 75% by mass, respectively). In commercial viscose production, the amount of CS2 employed may be varied to adjust for cellulose pulp quality as well as final fiber properties. 21 Therefore, a range of CS2 contents was included in this investigation.
Continuous monitoring of redox potential during the viscose process
A separate set of experiments were performed to monitor the evolution in redox potential of mixtures during the viscose process. The process employed was essentially the same as described previously, but with some changes to accommodate the immersion of electrodes. The differences were: 6 g of fiber samples were immersed in 144 g NaOH (20% w/w) for steeping with no liquor squeeze off at the end; for xanthation, carbon disulfide totaling to 55% on mass of cellulose was added in three steps (0.9, 0.9, and 1.2 g at minutes 37, 69, and 101, respectively, of the experiment); for dissolution, 100 ml deionized water was added to dilute the NaOH concentration in mixture to about 12% w/w and there was no refrigeration. The regeneration was achieved by transferring the mixture into 150 g H2SO4 (33% w/w). The regenerated mass was filtered, rinsed with deionized water and allowed to dry in ambient atmosphere. See Figure S1 for pictures from a typical experiment showing the sequence of steps.
A platinum electrode and Ag/AgCl reference electrode (SenTix® ORP 3 M KCl, WTW, Germany), calibrated with redox buffer solution (0.528 g K4(Fe(CN)6), 0.411 g K3(Fe(CN)6), 0.180 g KH2PO4, and 0.390 g Na2HPO4 per 100 ml), were employed for monitoring of the redox potential. The electrodes were connected to an Orion Expandable Ion Analyzer EA 940 (Orion Research Incorporated, USA), where the potential was recorded every minute over the duration of the experiment.
These measurements were performed on fibers dyed with SB1, mixtures of indigo dyed fibers and SB1 dyed fibers (50% by mass each), and indigo dyed fibers topped with SB1.
Analyses of fibers and regenerates
The nitrogen contents were determined on approximately 0.3 g specimens by the Dumas method on a rapid N III nitrogen analyzer (Elementar Analysensysteme GmbH, Germany).
The reflectance in the visible range (400–700 nm), specular component excluded, was measured on a d/8 spectrophotometer with pulsed xenon lamp as light source (Model CM 3610d, Konica Minolta, Japan). The diameter of the measurement area was 8 mm. The reflectance values were transformed into L*, a*, b* coordinates of the CIE 1976 color space (D65 illuminant, 10° observer) 23 with the onboard software. The fibers were directly measured, but the regenerates, which were in the form of particulates, were sandwiched between two microscopy glass slides before measurement, to avoid contamination of the device. It was determined separately on fibers that the glass slides did not significantly change reflectance spectra when the specular component was excluded (see Figure S3).
The fibers (ball-milled into small pieces) and regenerated particulates were subjected to PXRD on a X’Pert PRO device (Malvern PANalytical Inc., The Netherlands). Diffraction patterns were recorded using a Cu-Kα1,2 radiation source at a tube voltage of 40 kV, current of 40 mA, with a step size of 0.013° 2θ in the angular range of 5–40° 2θ at 400 s per step (multichannel mixed signal).
Intact fibers were cut into short lengths (of approximately 2 mm) and regenerates were ball milled, prior to the analyses. In case of PXRD measurements, the samples were additionally milled on a Retsch ZM300 device.
Results and discussion
For ease of understanding, a set of codes is employed to label the different samples, as listed in Table 2.
Codes to denote the different materials and experiments in this work

The symbol (a) denotes experiments on regeneration through the viscose process and (b) denotes experiments on monitoring of redox potential.
The mass of cellulose was 3 g in experiments denoted (a) and 6 g in experiments denoted (b).
Results from the undyed and indigo dyed fibers have been reported previously. 18
Redox potential monitoring
The evolution in redox potential over time, when dyed fibers (with SB1, indigo and their combinations) were subjected to the viscose process, are shown in Figure 2. Results from undyed fibers are also included for reference. In all cases, including undyed fibers, a drop in redox potential towards more negative values was observed on introducing cellulose fibers into the NaOH solution (20% w/w; marker t1 in the figure), from approximately −140 mV to around −450 mV, even prior to the first addition of CS2 at minute 37 of the experiment (marker t2 in the figure). The drop may be attributed to the presence of reducing end groups in the cellulose. The indigo dyed fibers exhibited very similar profiles to the undyed in evolution of redox potential up to minute 37, suggesting no influence of the dye (see Figure 2(d)).

Evolution in redox potential over time during the viscose process with: (a) SB1 dye alone and fibers dyed with SB1 (“C”); (b) mixtures of equal parts SB1 dyed and indigo dyed fibers (“I”); (c) indigo dyed fibers topped with SB1 (“J”); (d) indigo dyed fibers (“L”). All plots include values from the original undyed fibers for reference (“A”). Each line trace denotes the mean of three repetitions and shaded regions denote the standard deviation. The values from the undyed and indigo dyed fibers have been reported previously. 18 The markers (t1–t5) denote points in time: t1 at approximately 2 min, when fibers were added; t2 at approximately 37 min, with first addition of CS2 (of 0.9 g); t3 at approximately 69 min, with second addition of CS2 (of 0.9 g), t4 at approximately 101 min, with final addition of CS2 (of 1.2 g); and t5 at approximately 134 min, with addition of 100 ml deionized water to initiate the dissolution step.
In contrast, fibers containing SB1, either alone or in mixtures with indigo, showed a steeper drop in redox potential compared with untreated fibers, in the time leading up to the first addition of CS2 (Figure 2(a)–(c)). A similar steep drop was also observed in the measurement performed with the SB1 dye alone (Figure 2(a)). A prereduced, liquid formulation of SB1 was used in the dyeing of fibers, containing reducing agents for dye solubilization and stabilization, which may explain the observed steep drop in redox potential with the dye alone. Although the fibers after dyeing with SB1 were rinsed extensively with water, subjected to an oxidation step with H2O2, further rinsed, and dried in ambient atmosphere, it is possible that some reducing agent residues persisted on fibers despite the extensive post-treatments after dyeing, and contributed to the observed drop in redox potential. Another possible cause is the potential of SB1 in fibers to act as an “antioxidant/reducing buffer” due to the numerous quinoneimino and disulfide groups present in the dye structure (see Figure 1(a)). 14
An asymptotic reduction in redox potential towards more negative values was observed following the first and subsequent two additions of CS2 (at markers t2, t3, and t4, respectively). In contrast, a sudden rise towards less negative values occurred upon addition of water at around minute 134 of the experiment (marker t5). It may be attributed to the presence of dissolved oxygen in the water and the dilution of reducing agents in the system. After this point, the potentials continued their downward trajectory towards more negative values, which indicates persistence of reducing conditions in the system.
After the first addition of CS2, the redox potential observed with dyed fibers was generally of lower magnitude than that with undyed fibers, but the differences between the indigo dyed and undyed fibers were smaller than those between the SB1 containing fibers and the undyed fibers. In addition, the upward spike in redox potential on addition of water (at marker t5) was smaller with SB1 containing fibers as compared with the indigo-dyed and undyed fibers. These observations also highlight the redox buffering action of the SB1 dye. A close similarity between the undyed and dyed fibers in evolution of redox potential was observed only in the 50/50 mix of SB1 and indigo dyed fibers (Figure 2(b)), which indicates that the relative proportions of these two dyes will exert influence on the development of redox potential in the viscose process.
As discussed previously, 18 the redox potential during the viscose process with indigo dyed fibers did not exceed −700 mV, a potential at which indigo begins to become solubilized, which minimizes the likelihood of dye leaching from the cellulose. With SB1 dyed fibers in the process, the redox potentials appeared to stabilize in the region of −600 mV, which is the level where solubilized dye molecules exhibit greatest affinity for cellulose. The latter also would minimize the likelihood of SB1 leaching out of the cellulose.
Dye content in fibers and regenerates
It was of interest to determine the content of SB1 and indigo in the fibers and regenerates, to assess any potential loss of dyestuff when substrates were subjected to the viscose process. In previous work on indigo-dyed substrates, dye quantification was accomplished by extraction of the dye in a reduction medium and using photometric analysis of the dyestuff in extracts.18,24 As also reported elsewhere, 10 the high affinity of SB1 for cellulose made its extraction infeasible, and all attempts resulted only in partial extraction. Another method of estimating dye contents is analyzing the intensities at absorbance maxima in the reflectance spectra of dyed substrates. 25 However, since the substrates in this work are black, their reflectance spectra exhibited uniform intensities across the visible range (400–740 nm) without distinct absorbance peaks (see representative examples in Figure S4; all reflectance data are available in Supplementary material 2). Thus, the decision was made to estimate dye contents from the nitrogen content of fibers, as the dye molecules contain nitrogen in their structures (see Figure 1). The results are shown in Figure 3.

The nitrogen content (wt%) in fibers and regenerates. The columns denote the mean of nine repetitions and error bars the standard deviation. The x-axis labels correspond to the sample codes in Table 2. The horizontal dashed line denotes mean nitrogen content in the original undyed fibers. The measurements on B and K were performed on fibers cut into short lengths (of approximately 2 mm), and all others were on regenerates after ball milling into fine-sized particulates.
Although there was interference from atmospheric nitrogen, as evinced by the nitrogen content of approximately 0.105 ± 0.012 wt% in undyed fibers (substrate A), the nitrogen content of dyed fibers was sufficiently high in general, to allow detection of changes. In general, no significant differences were detected between fibers dyed with SB1 (substrate B) and the regenerates from redox potential monitoring or tests of the viscose process (substrates C–F), where the CS2 amounts employed ranged between 30% and 75% of the cellulose mass. Substrates G and H were regenerates from experiments on mixtures of SB1 dyed and undyed fibers (25% and 75% by mass, respectively), but the nitrogen contents were in range of the original undyed fibers. Nitrogen contents of about 0.066 wt% were expected (i.e., a quarter of the levels in substrates B–F), but this value is below the detection limit against the atmospheric background. Nevertheless, the color appearance of the regenerates was uniformly black (see Figure S5), which is evidence for the persistence of dye in the cellulose. In addition, there was no evidence of dye leaching in the regeneration bath from the appearance of filtrates (see Figure S1f,g) and in their UV–visual absorbance spectra (see Figure S2). Thus, there is reason to surmise that there was no dye loss from the mixes of undyed and SB1 dyed fibers.
The nitrogen levels in samples I–K likely reflect contributions from both SB1 and indigo as both dyes contain nitrogen in their molecular structure. Estimation of the expected nitrogen content from mixtures of the two dyes is challenging due to uncertainty of the SB1 structure (the nitrogen content per unit mass of SB1 is not clear). However, it is noteworthy that the nitrogen contents in samples I and K were greater than in the fibers dyed with SB1 alone (B), but similar to fibers dyed with indigo alone (L). The nitrogen levels in sample J were higher than in the other samples containing indigo, though the reason is not clear. In previous work, 18 no loss of indigo dye was observed when subjecting cellulose containing the dyestuff to the viscose process. In this study, no difference in SB1 content (as estimated from nitrogen contents) was detected between fibers dyed with the dyestuff (B) and the regenerates after the viscose process (C–F). The supernatant in regeneration baths were also clear of any color (see Figures S1 and S2). Thus, it is surmised that there was no loss of dyestuff (SB1 or indigo) from cellulose when subjected to the viscose process.
As discussed earlier, reflectance levels are inversely proportional (i.e., absorbance levels are directly proportional) to the dye content. It may be observed in Figure S4, that despite the similarities in nitrogen content (and, therefore, dye content) among samples B–F, the reflectance of substrate B was greater than those of C–F. One possible reason is that the measurements of substrate B were on intact fibers (cut into short lengths) and substrates C–F were regenerates in the form of milled particulates. All other factors being equal, powders exhibit lower reflectance due to greater trapping and scattering of light as compared to fibers. However, such differences were not observed between substrates J (powder) and K (fiber). Another possible reason is changes in molecular size of SB1 during reduction/oxidation, which exerts impact on the dye reflectance properties.26,27
Color appearance
The substrate reflectance spectra (Figure S4), were transformed into CIE L*a*b* as well as the C* and h coordinates, that are plotted in Figure 4. The L*, a*, b* coordinates describe a three-dimensional color space, with the L* axis denoting lightness and the a*, b* axes denoting chromaticity. On the a* axis, positive values denote color in the direction of red, and negative values in the direction of green. On the b* axis, positive values indicate color in the direction of yellow and negative values in the direction of blue. Values in the region of zero on both axes denote achromaticity. Values on the L* axis range between 0 (black) and 100 (white). The L*, C*, h system describes color with cylindrical coordinates. Values on the L* axis have the same significance; the C* values denote chromaticity with low values denoting achromaticity and high values denoting high chromatic intensities; and h describes the hue angle: 0° (red), 90° (yellow), 180° (green), and 270° (blue).

The color coordinates L*, a*, b*, C*, h (D65 illuminant, 10° observer, CIE 1976 color space) derived from sample reflectance spectra. The x-axis labels correspond to the sample code in Table 2. The columns denote the mean of nine repetitions and error bars the standard deviation.
The values for substrates B–H were consistent with that expected for black-colored materials: L* values toward the lower end of the axis, and a* and b* values (on average of −0.13 ± 0.20 and −1.12 ± 0.36, respectively) in the achromatic region of the color space. The L* values of substrates G and H (on average 27.65 ± 4.25) were greater than those of substrates B–F (on average 13.07 ± 1.22), which reflects the effect of diluting dyed fibers with undyed fibers in the regeneration process. In consonance with their L* values, it may be observed in Figure S4 that substrate G was lighter in color than substrate H despite the lack of evident differences in their dye contents (i.e., nitrogen contents) or indications of dye loss in the cellulose regeneration medium. The reason for the difference in color appearance remains unclear.
Substrates I–K exhibited L* and a* values (on average of 11.76 ± 1.29 and –0.10 ± 0.22, respectively) similar to those of substrates B–H, but evidence for the presence of indigo was observed in their b* values, which ranged from –3.30 to –5.59. The b* values of regenerates (substrates I and J) were similar to each other, but lower than that of the SB1 topped indigo-dyed fibers (substrate K). A possible reason may be the difference in sample form during measurement (fibers versus milled particulates), but also that the regeneration resulted in a redistribution of dye molecules within the cellulosic mass. It also points to the potential for changes in color appearance when subjecting cellulose fibers dyed with a mix of SB1 and indigo, to a viscose regeneration process. The values of C* and h reflect the trends observed in a* and b* values.
PXRD analysis
In Figure 5, the diffraction pattern of indigo dye is representative of allomorph B,28,29 with peaks at 2θ positions 10.6°, 14.6°, and 26.4° corresponding to reflections from the lattice plans (100), (10–2), and (210) respectively. The dried residues of the SB1 dye formulation showed peaks at 2θ positions 16.5°, 16.9°, 21.5°, 23.4°, 32.4°, 33.6°, 36.3°, and 38.0°, which resembles those of sodium sulfide and polysulfides. 30 The observed pattern may arise from reducing agents in the dye formulation, as there are no reports available to indicate that the dye is crystalline.

Representative PXRD results from fibers and regenerates containing (a) SB1 and (b) a mix of SB1 and indigo. The labels of individual traces correspond to the sample code in Table 2. Results from undyed fibers (A) and SB1 dyed fibers (B) are included in both parts as reference. Part (a) includes the results from measurements on dried SB1 dye formulation and part (b) includes results from the indigo dye powder (it was also reported previously 18 ).
All fibers and regenerates showed the typical diffraction pattern of the cellulose II allomorph, 31 with peaks at 2θ positions 12.2°, 20.0°, and 22.0° corresponding to reflections from the lattice planes (1–10), (110), and (020), respectively. As observed in previous work, 18 the regenerates from indigo containing fibers showed evidence for presence of the dye but no difference was observed in crystallite size of the indigo between the dyed fibers and regenerates. The same was also observed in this study. The only “foreign” peak in the PXRD pattern of regenerates from SB1 containing fibers was a minor peak at 2θ of 23.0°, which corresponds to a peak in the original dye formulation, suggesting that a small amount of a component from the original dye formulation may have been entrapped in the regenerates.
Conclusions
The measurements performed in this study suggest that there is no loss of SB1 dye from cellulose, when dyed fibers were subjected to dissolution and regeneration through the viscose process. This was observed with fibers containing SB1 alone as well as combinations of indigo and SB1. The redox potential developed during the xanthation and dissolution stages did not reach levels required for solubilization and desorption of dye molecules. There was also no difference of dye content (as measured indirectly through nitrogen content) between the original dyed fibers and their regenerates from the viscose process, and this held true over a wide range of CS2 contents during xanthation (30–75% of the mass of cellulose). Although firm evidence of no change in dye content was difficult to obtain with fibers containing both indigo and SB1, here too, all indications pointed to no dye loss. When undyed fibers were mixed with dyed fibers for dissolution and regeneration, in imitation of mixing virgin pulp along with colored cellulose recovered from waste, the dyestuff was observed to be uniformly distributed through the regenerated mass. PXRD analyses of regenerates yielded evidence of indigo when present in the fiber mass, and while no direct evidence of SB1 dye could be discerned, there were indications that some components from the SB1 dye formulation may have been entrapped in the regenerates. The color appearance of regenerates was proportional to dyestuff levels in the cellulose, and did not change between the different levels of CS2 in the xanthation stage. With fibers containing both indigo and SB1, a color difference was noted between the original fibers and regenerates (ΔE*ab = 3.29; ΔH*ab = 0.33), which is attributed to a redistribution of dyestuff molecules.
The focus in this work was on the fate of dyestuff. Apart from this, the quality of cellulose xanthation (degree and uniformity), polymer dissolution levels, and properties of the regenerated fibers are also important to be considered. Although the findings indicate no difference between dyed and undyed cellulose in dissolution and regeneration, further confirmation is needed through trials of fiber spinning from SB1 dyed cellulose, and comparisons of their properties with those of fibers spun from virgin cellulose, which will be the focus of future work.
Footnotes
Acknowledgment
Felix Netzer is acknowledged for assistance with nitrogen analyses.
Data availability
The data that support the findings of this study are available from the corresponding author, APM, upon reasonable request.
Declaration of conflicting interests
The author(s) declared no potential conflicts of interest with respect to the research, authorship, and/or publication of this article.
Funding
The author(s) disclosed receipt of the following financial support for the research, authorship, and/or publication of this article: Open access funding provided by University of Innsbruck and Medical University of Innsbruck. The research leading to these results was performed in the frame of the project “Textile Competence Center Vorarlberg 2 (Project No. 882502)” funded under the COMET program—Competence Centers for Excellent Technologies—by the Federal Ministry for Climate Protection, Environment, Energy, Mobility, Innovation, and Technology (BMK) and the Federal Ministry for Digitization and Business Location (BMDW), with cofinancing from the federal province of Vorarlberg. The COMET program is administered by the Austrian Research Promotion Agency (FFG).

Supplementary material
Supplemental material for this article is available online.