
Abstract
In this study, we investigate the temporal and spatial evolution of wetting saturation during spontaneous imbibition in anisotropic fibrous porous media using both experimental and numerical methods. We present a novel experimental approach to systematically study spontaneous imbibition in these media, allowing for a comprehensive assessment of how microstructure influences wicking performance. The experimental method, which exhibits high reproducibility, was used to validate the numerical model. The numerical model was parameterized using only the porosity and filament diameter of the porous media in conjunction with the material properties of the imbibing fluid. The essential capillary saturation curve for the numerical model was derived using the pore morphology method. The numerical results effectively replicated the experimental results.
Our experimental and numerical observations revealed a diffusive wetting front within the porous media, which progressively expanded and decelerated during the imbibition process. The results highlight the significant influence of filament size on the wetting saturation dynamics and the height of the wetting front during spontaneous imbibition.
Thin anisotropic fibrous porous media are an integral part of a wide range of technologies including energy, agriculture, geoengineering, medical applications, textiles and the manufacture of fiber reinforced materials.1 –6 The orientation of filaments or fibers is advantageous in many applications. A relevant aspect for many applications is the interaction of the fibrous media with liquids. In many fibrous porous media, liquid uptake occurs when they are brought into contact with the liquid due to capillary forces. This capillary driven flow phenomenon is known as spontaneous imbibition or wicking. It is particularly relevant where liquid (moisture) management is of primary importance; for example, in sportswear, medical textiles or capillary-fed devices.7 –9
Spontaneous imbibition has been a subject of study for many decades. In order to gain a mechanistic understanding, modeling of spontaneous imbibition plays an important role. Several models based on different approaches have been developed and compared to experiments. Traditionally, porous media has been modeled as bundles of capillaries. This allows the calculation of the wicking height as a function of time with varying simplifying assumptions, with the simplest form being the classic Washburn equation. 10 Many extensions of this equation have been proposed, to include the shape of the pores and include more physical effects, like inertia and dynamic effects, Cai et al. give an overview over many Washburn-type models. 11
The second common approach is the effective continuum approach. It is based on an averaging of the mass and momentum balance of the fluid in the porous structure. The imbibition can be considered as either a Darcy single-phase flow (sharp front approach) or a Darcy two-phase flow leading to expressions for the flow field and saturation distribution of the wicking fluid, respectively. 12
However, the selection of an appropriate model for predicting the wicking behavior in fibrous porous media is challenging. Conclusions regarding the applicability of established models are mixed. While some studies have validated the Washburn equation for anisotropic porous media such as yarns,13 –16 others have provided evidence for a diffuse front is given by others.17 –19 Even statistical pore filling events and stepwise uptake behaviors have been reported for very thin yarns with a small number of pores and could only be modeled by dynamic pore network models.20 –22
In this study we model the spontaneous imbibition with the Darcy two phase flow, the well-known Richards equation. The model has been applied successfully to model liquid transport in thin fibrous isotropic porous media.
23
However, the constitutive correlations that parametrize the transport equation were determined by fitting to experimental data,
24
or determined by extensive experimental work.
25
In our study we determine the constitutive correlations, based only on easily accessible structural parameters, namely the porosity
Comparison with experimental results is essential to evaluate the performance of the model. Due to the soft texture, a non-destructive investigation is essential. Parada gives a comprehensive overview of visualization techniques of the moisture transport in textile material. 32 Experiments range from relatively simple tests using available laboratory equipment and manual recording of data 17 to very advanced imaging techniques such as synchrotron imaging. 21 In our study we employ the backlight imaging technique which is a robust and reliable method for obtaining saturation distributions in thin, porous media.19,33,34
This technique allows us to develop an automated setup for investigating spontaneous imbibition in fibrous porous media based on visible light imaging coupled with the Richards equation to model the spontaneous imbibition. The main objective is to enable predictions of the wicking behavior based solely on easily accessible properties: the contact angle, the filament diameter and number. Finally, the model was validated with experimental data from three different materials and two different liquids.
This study aims to give a better understanding of the spontaneous imbibition process in thin anisotropic fibrous media. The proposed methodology can serve as a foundation for modeling the liquid transport in yarn material and consequently fabrics. Additionally, the experimental setup presented for investigating spontaneous imbibition enables a reproducible method for obtaining consistent data. The results and methodology contribute to the identification of promising candidates for technical applications or textiles requiring specific liquid transport properties.
Experimental method
Materials
The study focuses on anisotropic fibrous porous materials comprising three distinct drawn textured polyethylene terephthalate yarns (DTY), each characterized by approximately circular filament cross-sections. While the yarns share a similar fineness (weight per unit length), they vary in filament count, resulting in comparable porosity but with fundamentally different filament diameters. This design enables the exploration of the impact of different filament sizes. The yarn materials are visually represented in Figure 1.
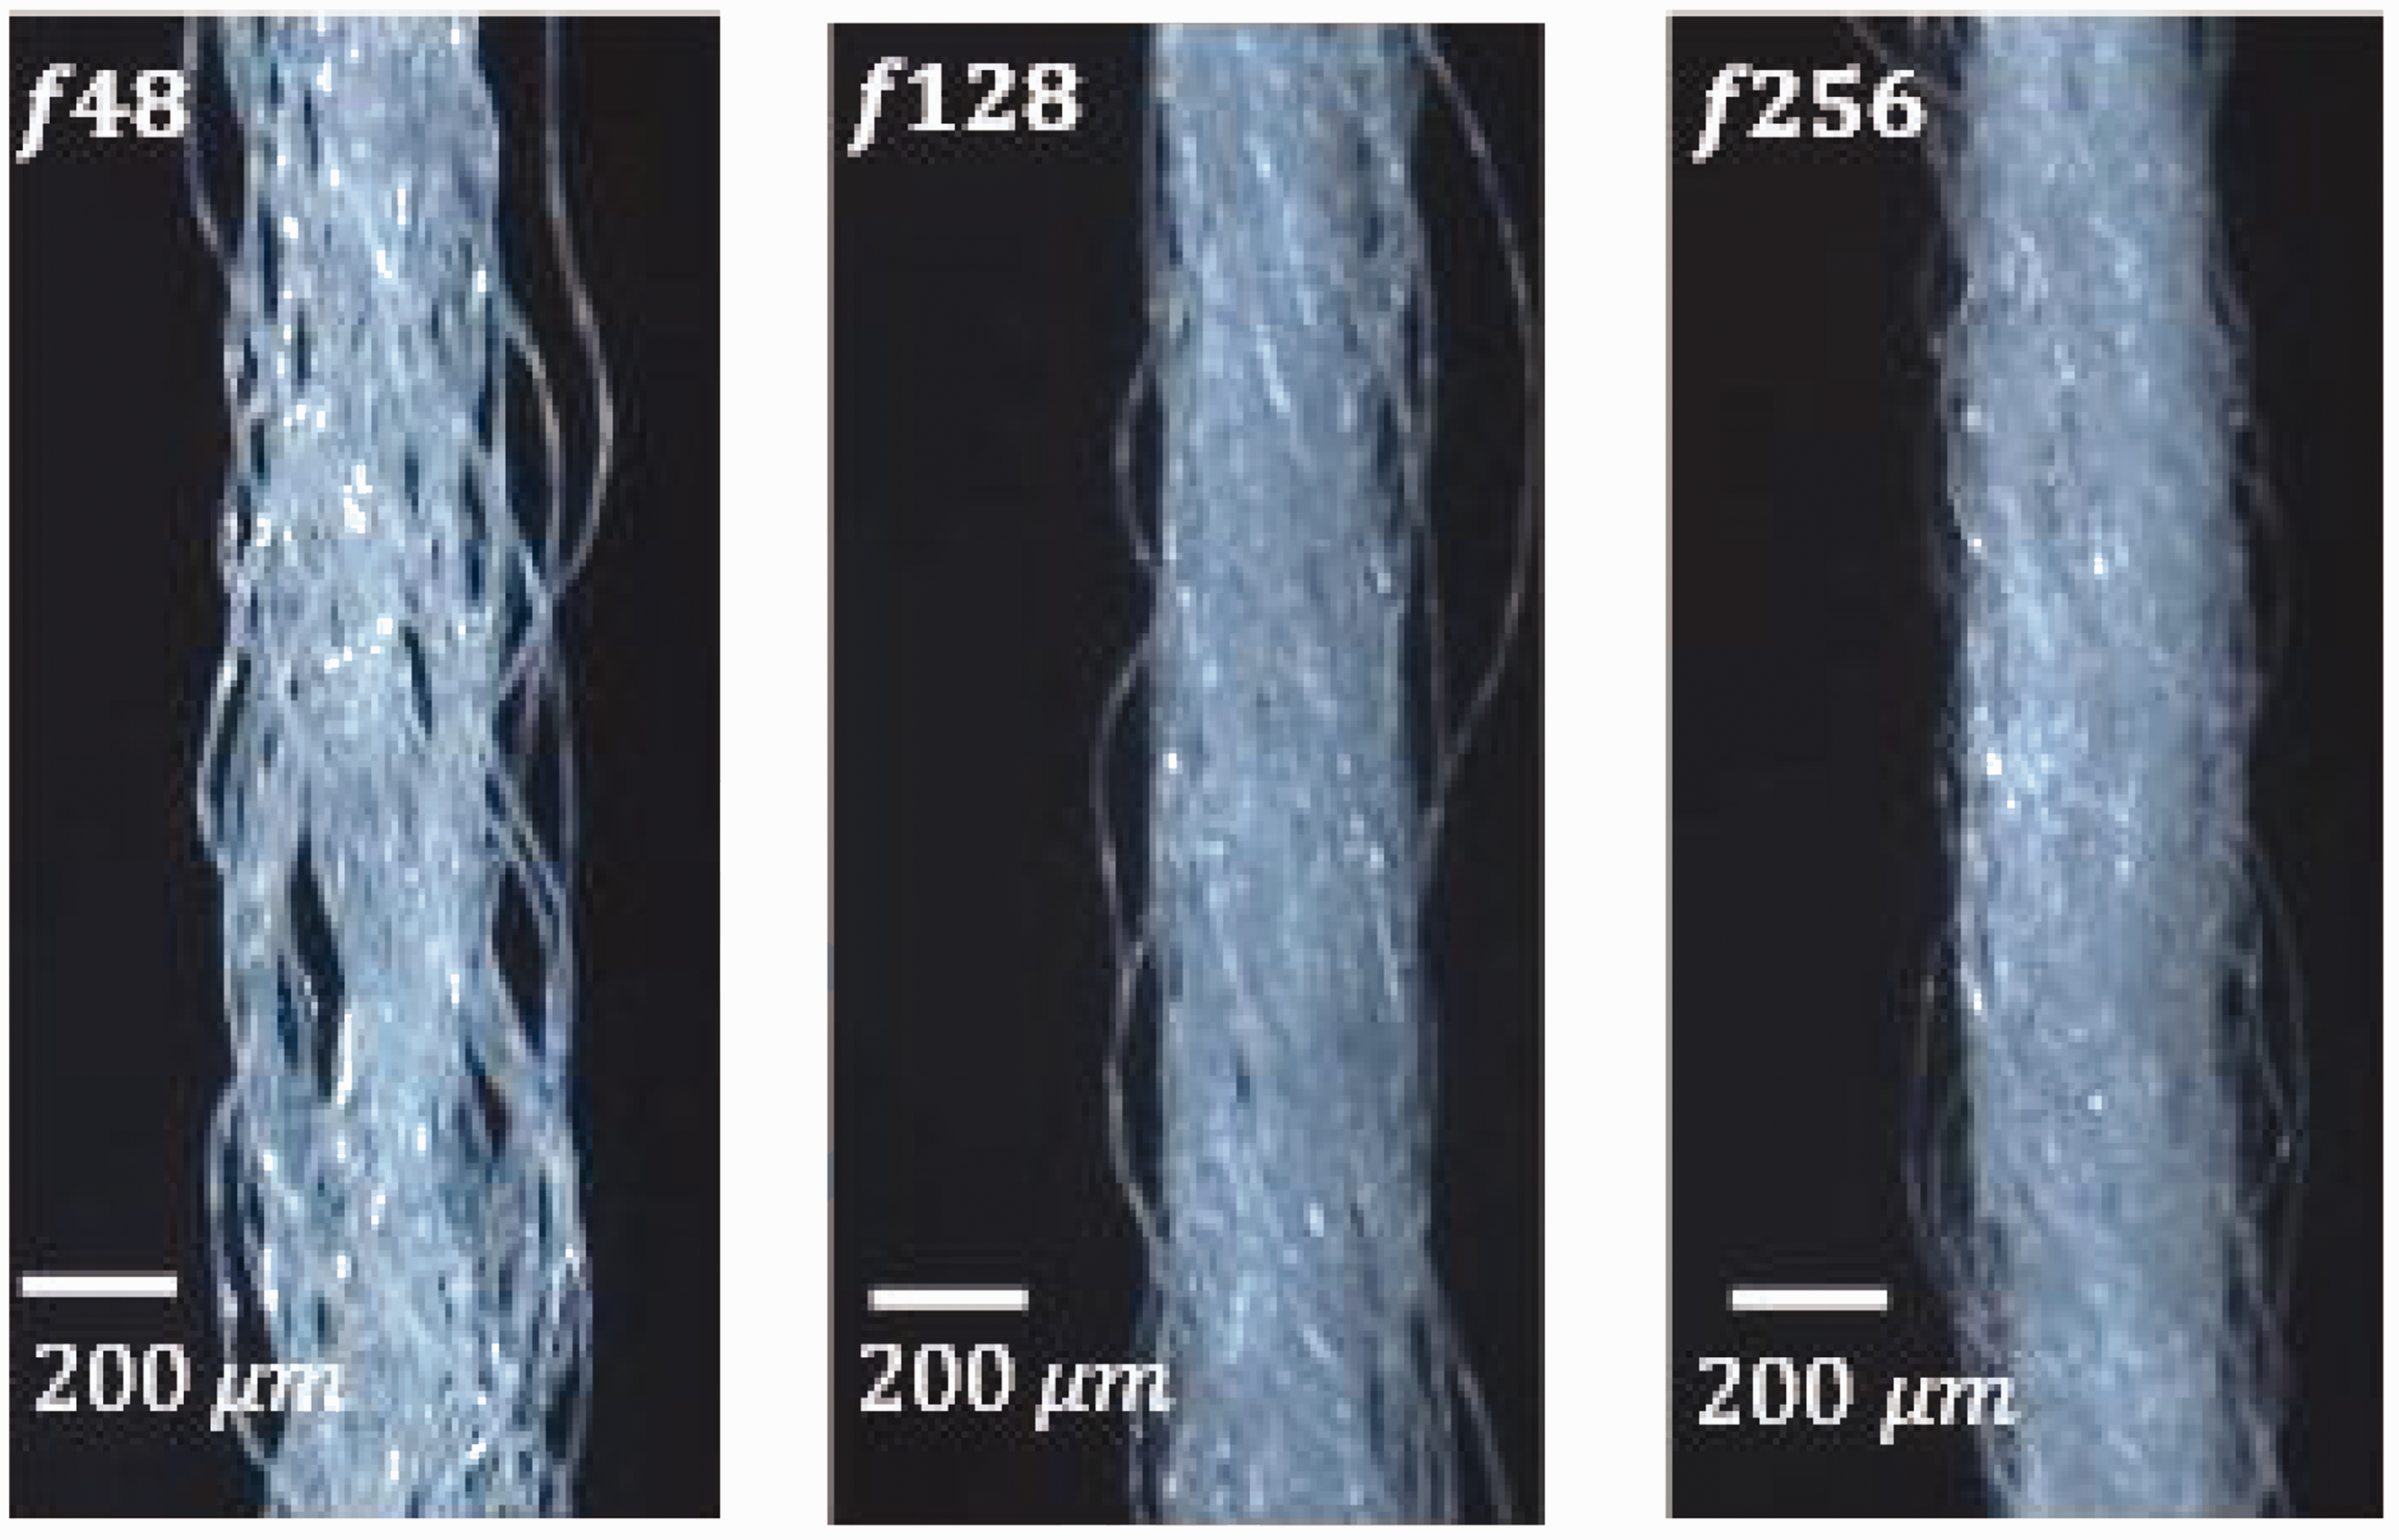
Light microscope images of the three different porous drawn textured yarns (DTY) made from polyethylene terephthalate (PES) used in this study.
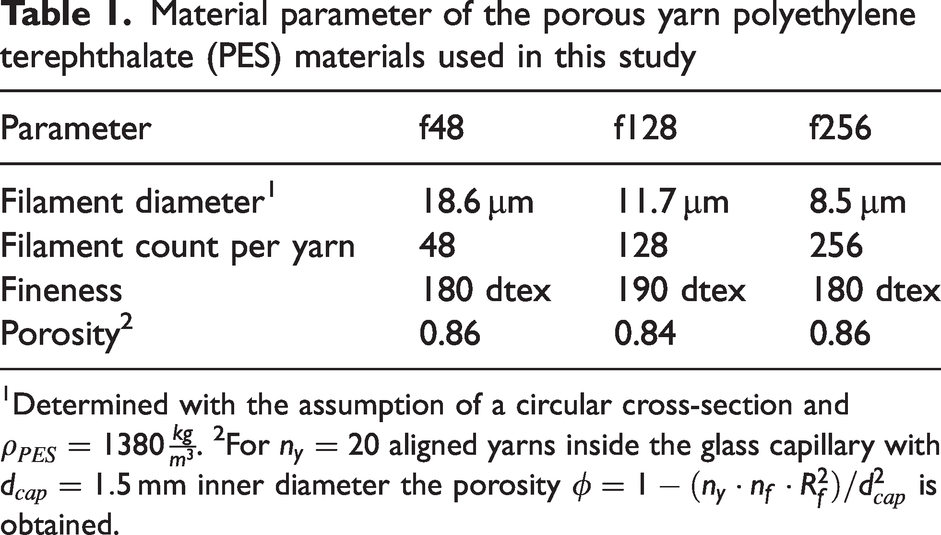
To ensure consistent porosity, the porous material samples were prepared following the procedures outlined in the subsequent section before undergoing examination with the experimental setup detailed in the ‘Experimental setup’ section. Table 1 provides the material parameters of the porous material for reference.
Material parameter of the porous yarn polyethylene terephthalate (PES) materials used in this study
Determined with the assumption of a circular cross-section and
To explore spontaneous imbibition in fibrous porous media, two wetting fluids – polyethylene glycol (PEG) 400 and ethylene glycol (EG) – were employed. Both fluids strongly wet polyethylene terephthalate (PES) and have a low saturation vapor pressure, making them ideal to study the spontaneous imbibition without considering evaporation at significant wicking heights. The fluid parameters are detailed in Table 2. For enhanced visual observation and improved contrast during the investigation of spontaneous imbibition, 5 ml of a blue dye (BASF Basacid 762) was added to each liter of PEG or EG.
Fluid parameters of the imbibing fluids polyethylene glycol (PEG) 400 and ethylene glycol (EG) at 298.15 K
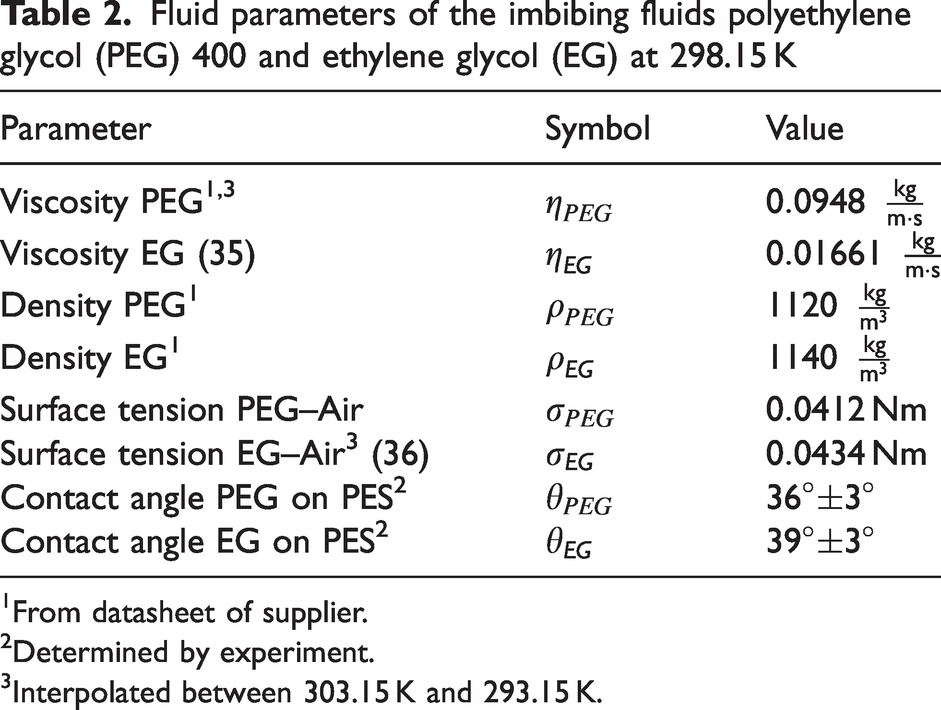
From datasheet of supplier.
Determined by experiment.
Interpolated between 303.15 K and 293.15 K.
The contact angles of the wetting fluid were assessed by depositing small droplets of the fluid onto the PES fibers, and subsequently measuring the wetting contact angle from the captured images. An illustrative grayscale image depicting this is presented in Figure 2.
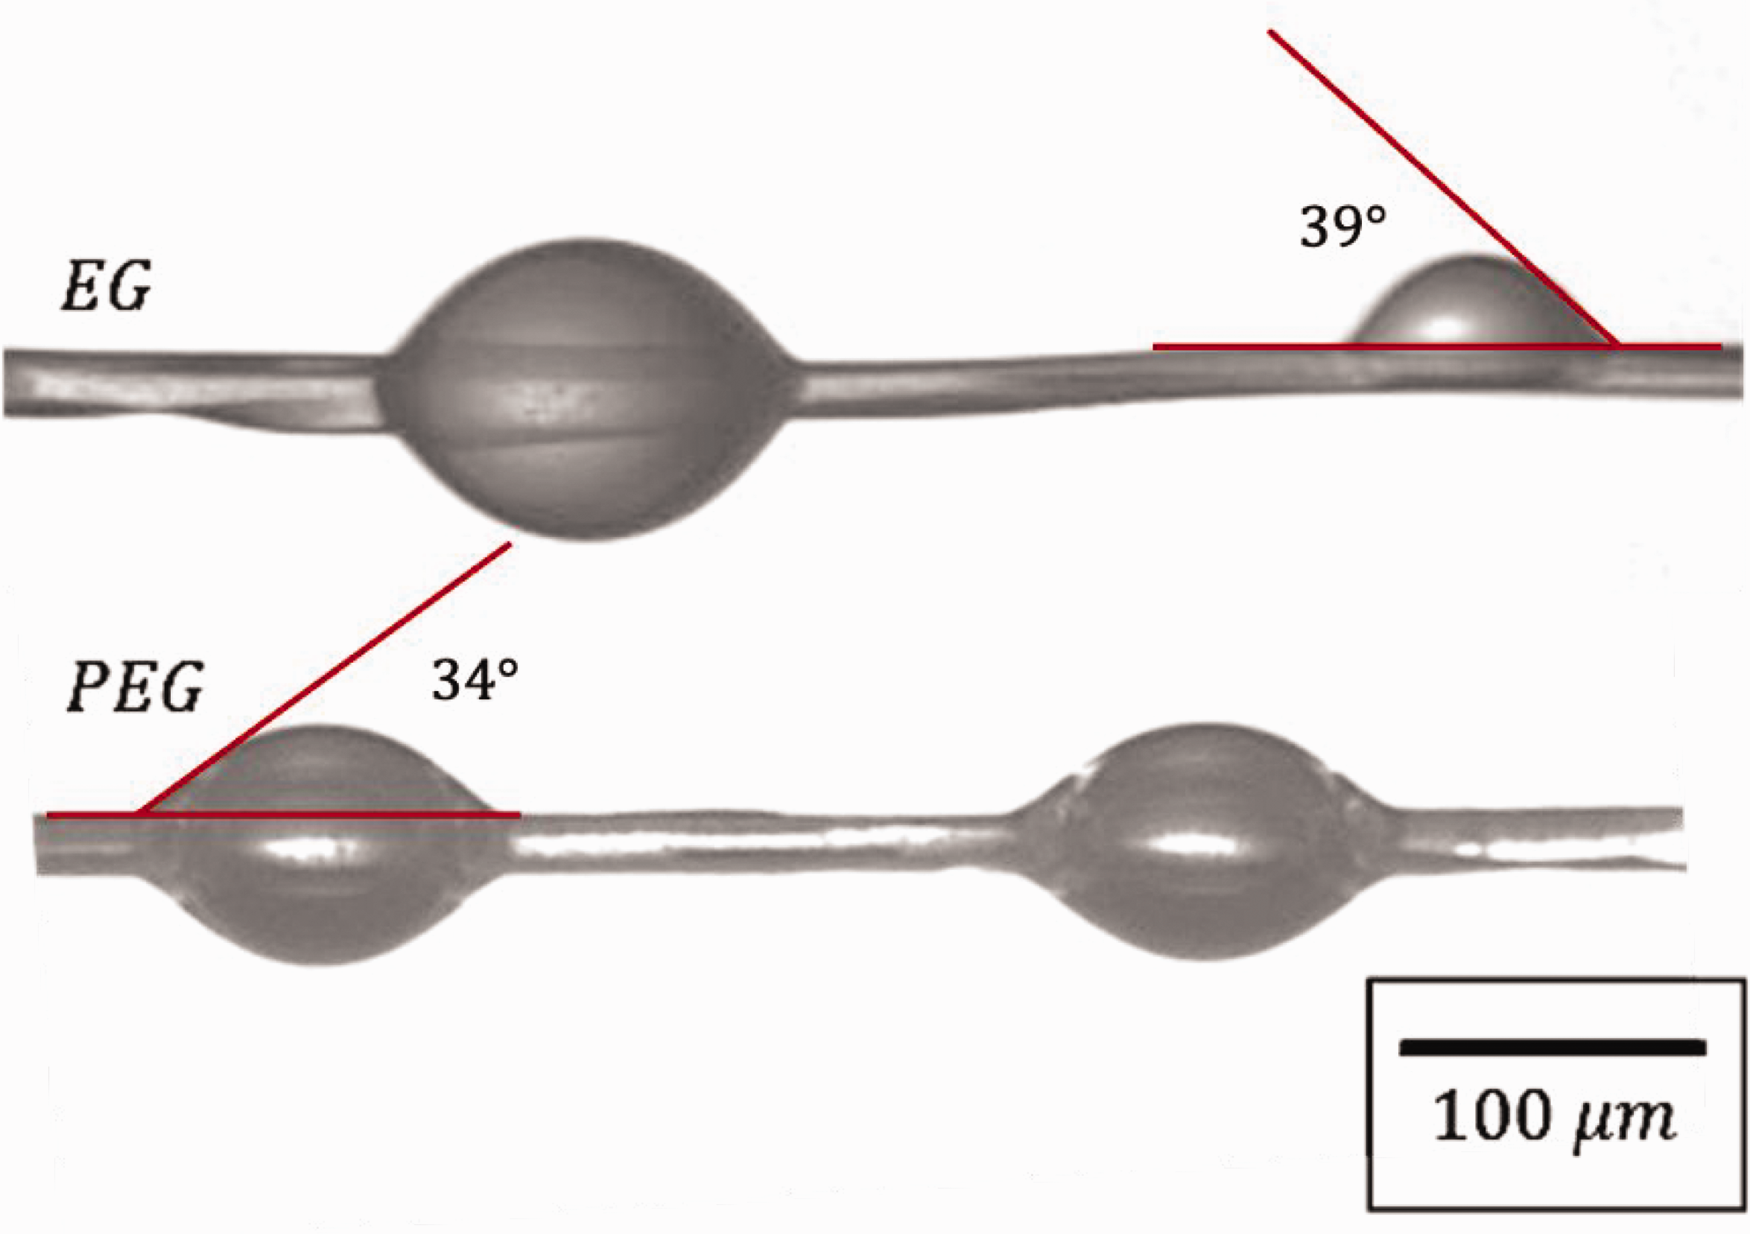
Light microscope image of ethylene glycol (EG) (top) and polyethylene glycol (PEG) (bottom) droplets on polyethylene terephthalate (PES) filament to determine the wetting contact angle.
Sample preparation
The fibrous material sample investigated in this study underwent a specific preparation, to achieve three main objectives: firstly, to increase the diameter-to-length ratio, thereby improving resolution in the radial direction and enhancing the visibility of the imbibing liquid. Secondly, to establish a uniform radius for the porous media. In contrast, free-hanging yarns exhibit considerable variability in radius along their axes due to their high porosity. By limiting the outer radius of the yarn material, a more homogeneous structure can be obtained, facilitating better reproducibility of experiments, and enabling a thorough investigation of the microstructure’s influence on spontaneous imbibition. Thirdly, high speed micro computed tomography (micro-CT) and synchrotron studies by Fischer et al. and Parada revealed that in spontaneous imbibition within yarns with a low number of fibers (and consequently a low number of pores), individual pore-filling events dominate the overall wicking dynamics.21,22 To comprehensively study the dynamics of spontaneous imbibition of the yarn material and not the individual pore-filling events, a larger number of pores is necessary. Therefore, 20 yarns were used to establish a clear scale-separation between the characteristic microscopic length (filament radius) and the macroscopic length (radius of the porous material), allowing the modeling of spontaneous imbibition with an effective approach, specifically a Darcy model. To investigate the impact of microstructure on spontaneous imbibition and compare experimental data to the numerical model outlined in the ‘Modeling of spontaneous imbibition’ section, 20 yarns were meticulously aligned and drawn into a glass capillary as illustrated in Figure 3.
The image features a backlit view of two capillaries containing 20 yarns each, with a light shadow revealing the presence of the capillary.
To minimize the influence of the glass capillary, the glass surface was treated. The objective is to decrease the glass’s wettability specifically for the polar imbibition liquids being used. This adjustment is made solely for the purpose of investigating imbibition within the fibrous media, rather than focusing on the interaction at the glass–fiber interface. The surface treatment ollows that outlined by Giang et al. 37 Initially, the capillary is cleaned in an ultrasonic bath and with acetone. Subsequently, the capillary is immersed for 30 minutes in a 50/50 concentrated hydrochloric acid-hexane solution. Afterward, the capillary is rinsed with water and dried in a vacuum oven for 30 minutes. Following this, the capillary is immersed in a 5% Trichloro(octyl)silane/hexane solution for 15 minutes and dried in an oven for 3 hours at 60°C. The result is a silanized glass surface of the capillary. This treatment significantly increases the contact angle of EG, PEG and water. The non-wetting surface of the treated capillaries for the considered fluids facilitates an investigation of spontaneous imbibition in the fibrous material without a major distortion due to the glass-sides.
Experimental setup
The experimental configuration, as illustrated schematically in Figure 4, comprised a light-dense enclosure housing a fluid reservoir, a CMOS camera (Sony ILCE-6400) equipped with a macro lens (Sony SEL30M35.AE), a sample holder, and a surface LED light source (MBJ DBL-1020-WT-s).
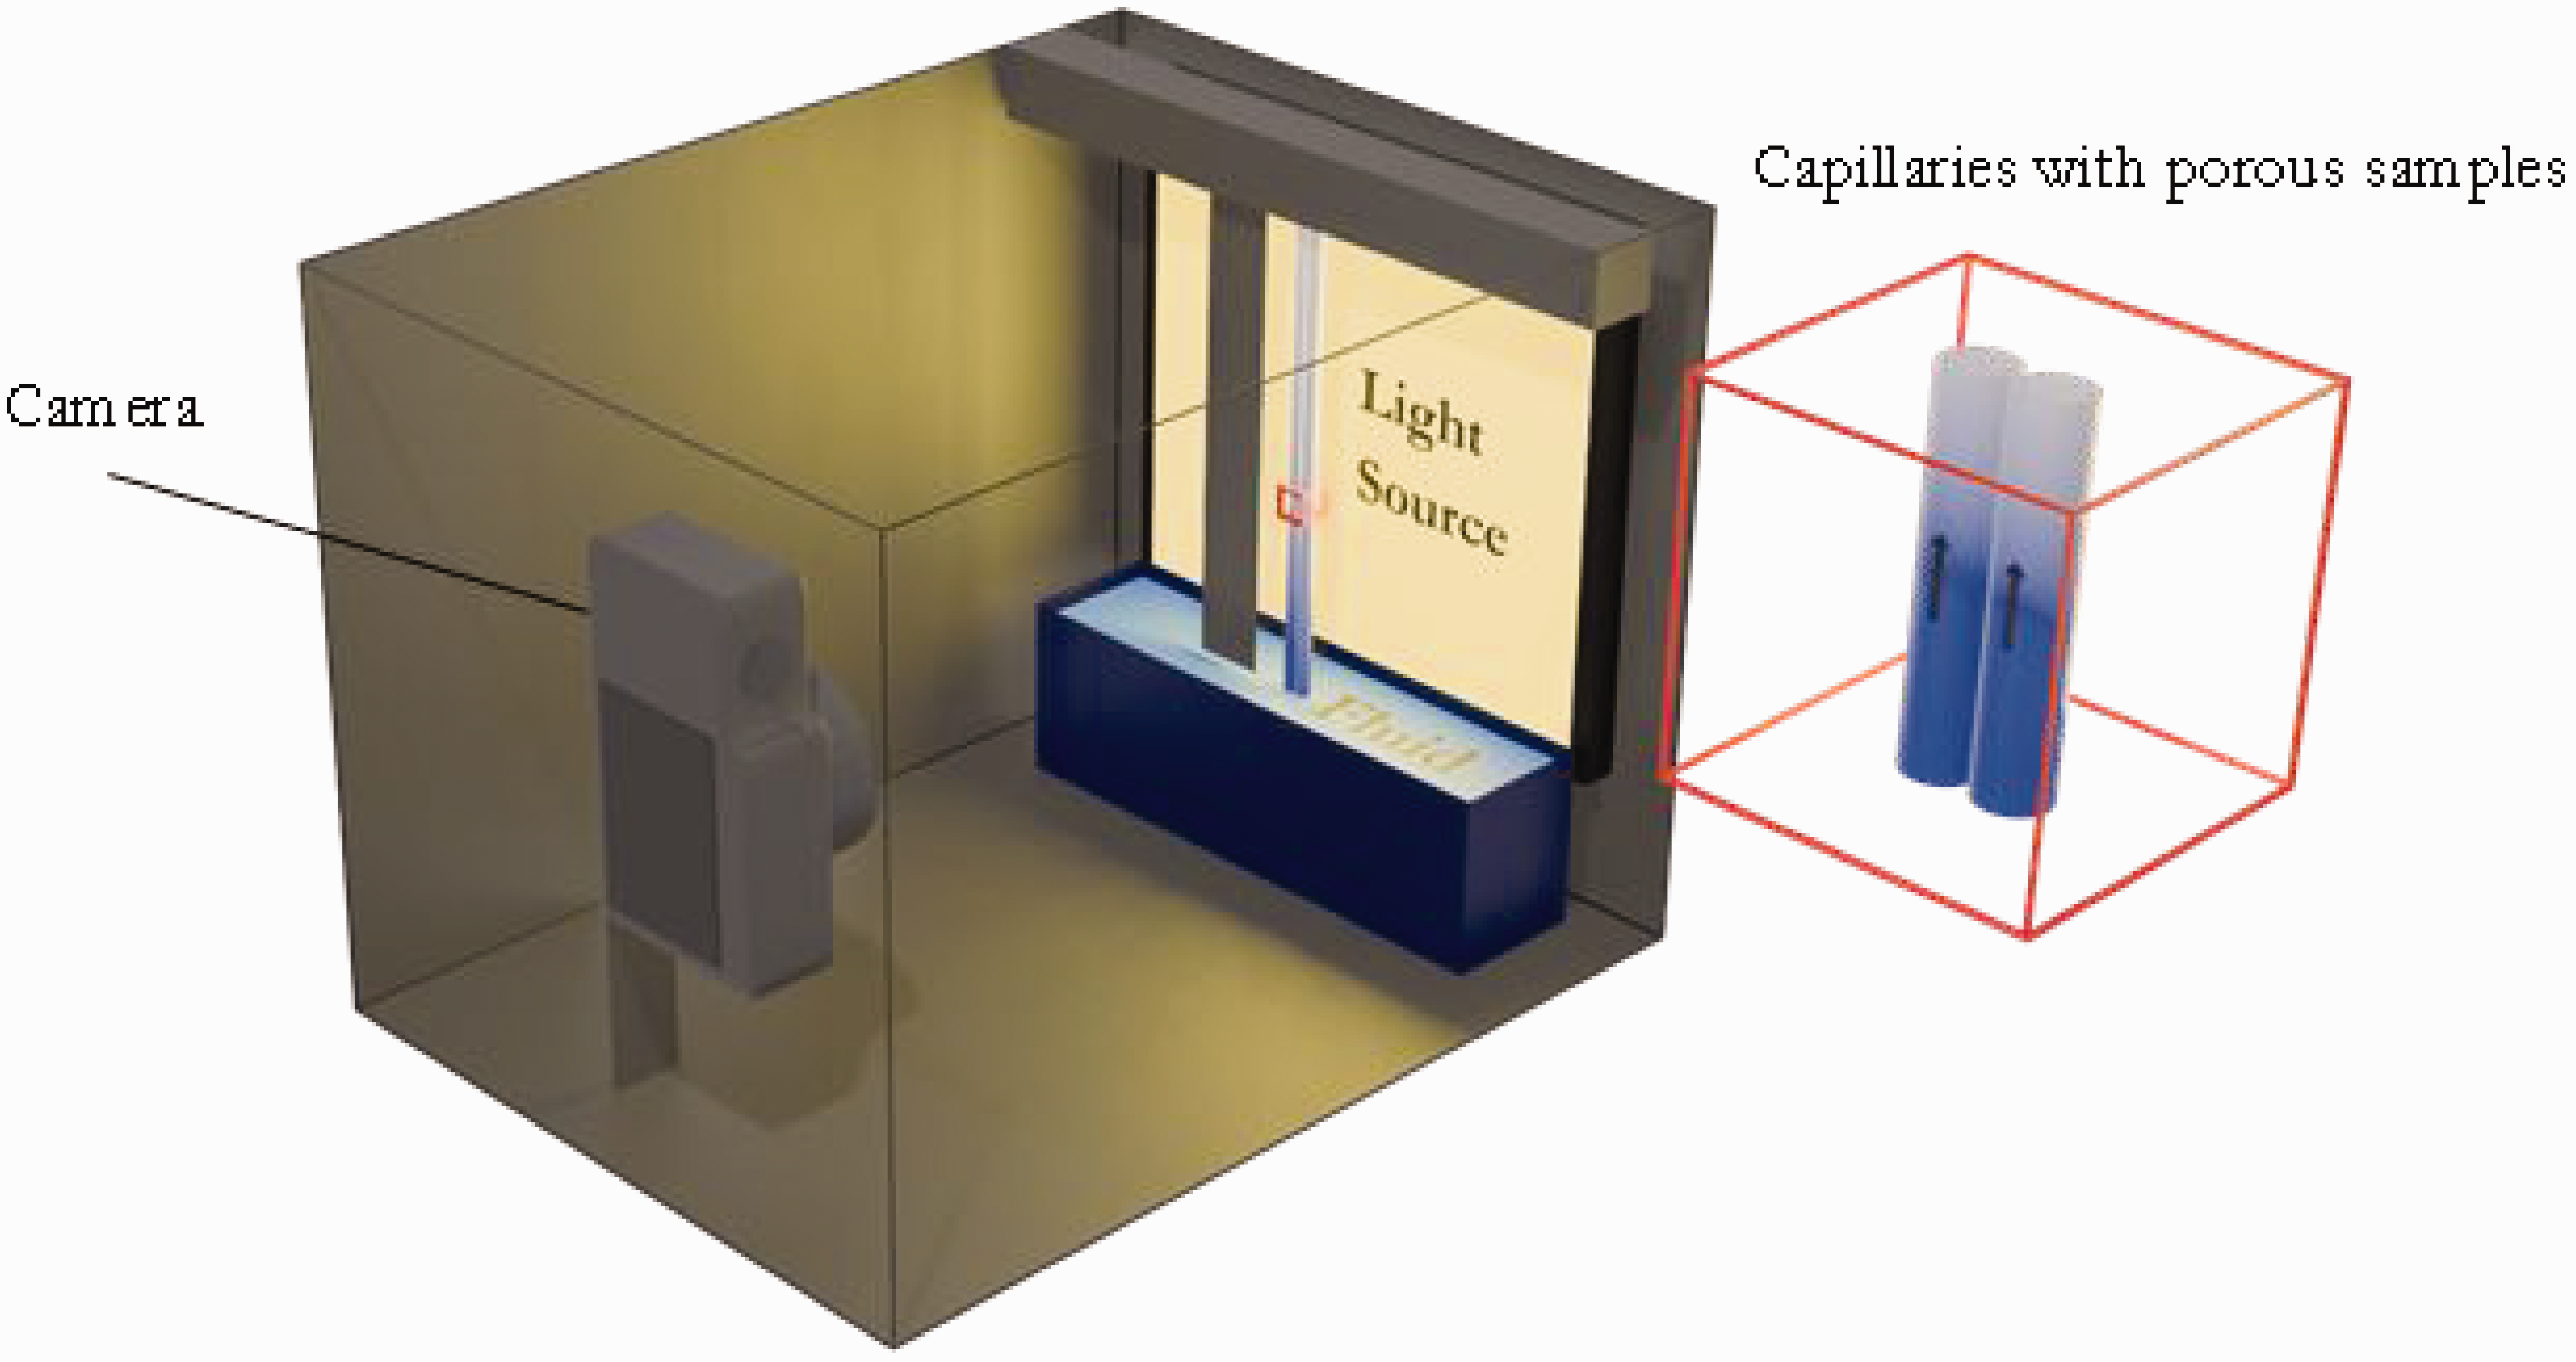
Schematic three-dimensional rendering of the experimental setup.
Capillaries containing the porous material were secured in the sample holder in front of the surface light source. A yellow illumination foil covered the light source to enhance contrast between saturated and non-saturated areas. The liquid reservoir’s level could be automatically adjusted. Initiating an experiment involved clamping the capillaries in the sample holder and starting image acquisition. High-resolution images of the imbibition process were captured every five seconds. By opening a valve connecting the fluid reservoir to a container atop the reservoir, the liquid level was gradually increased until reaching the samples, after which the valve was closed to maintain the level. To prevent liquid level changes due to imbibition in the porous media, only two samples were investigated per experiment. Upon concluding the designated investigation time, the fluid level was lowered using a piston pump, allowing for sample replacement. Temperature was recorded throughout the experiments (TinkerForge MAX31856). The setup and data acquisition were automated using PythonTM 3.1 and TinkerForge Microcontrollers.
Visualization of the spontaneous imbibition
To assess the saturation in the fibrous porous media the images were analyzed with PythonTM 3.1 OpenCv library. The schematic workflow of evaluation the local saturation in the porous material is illustrated in Figure 5.
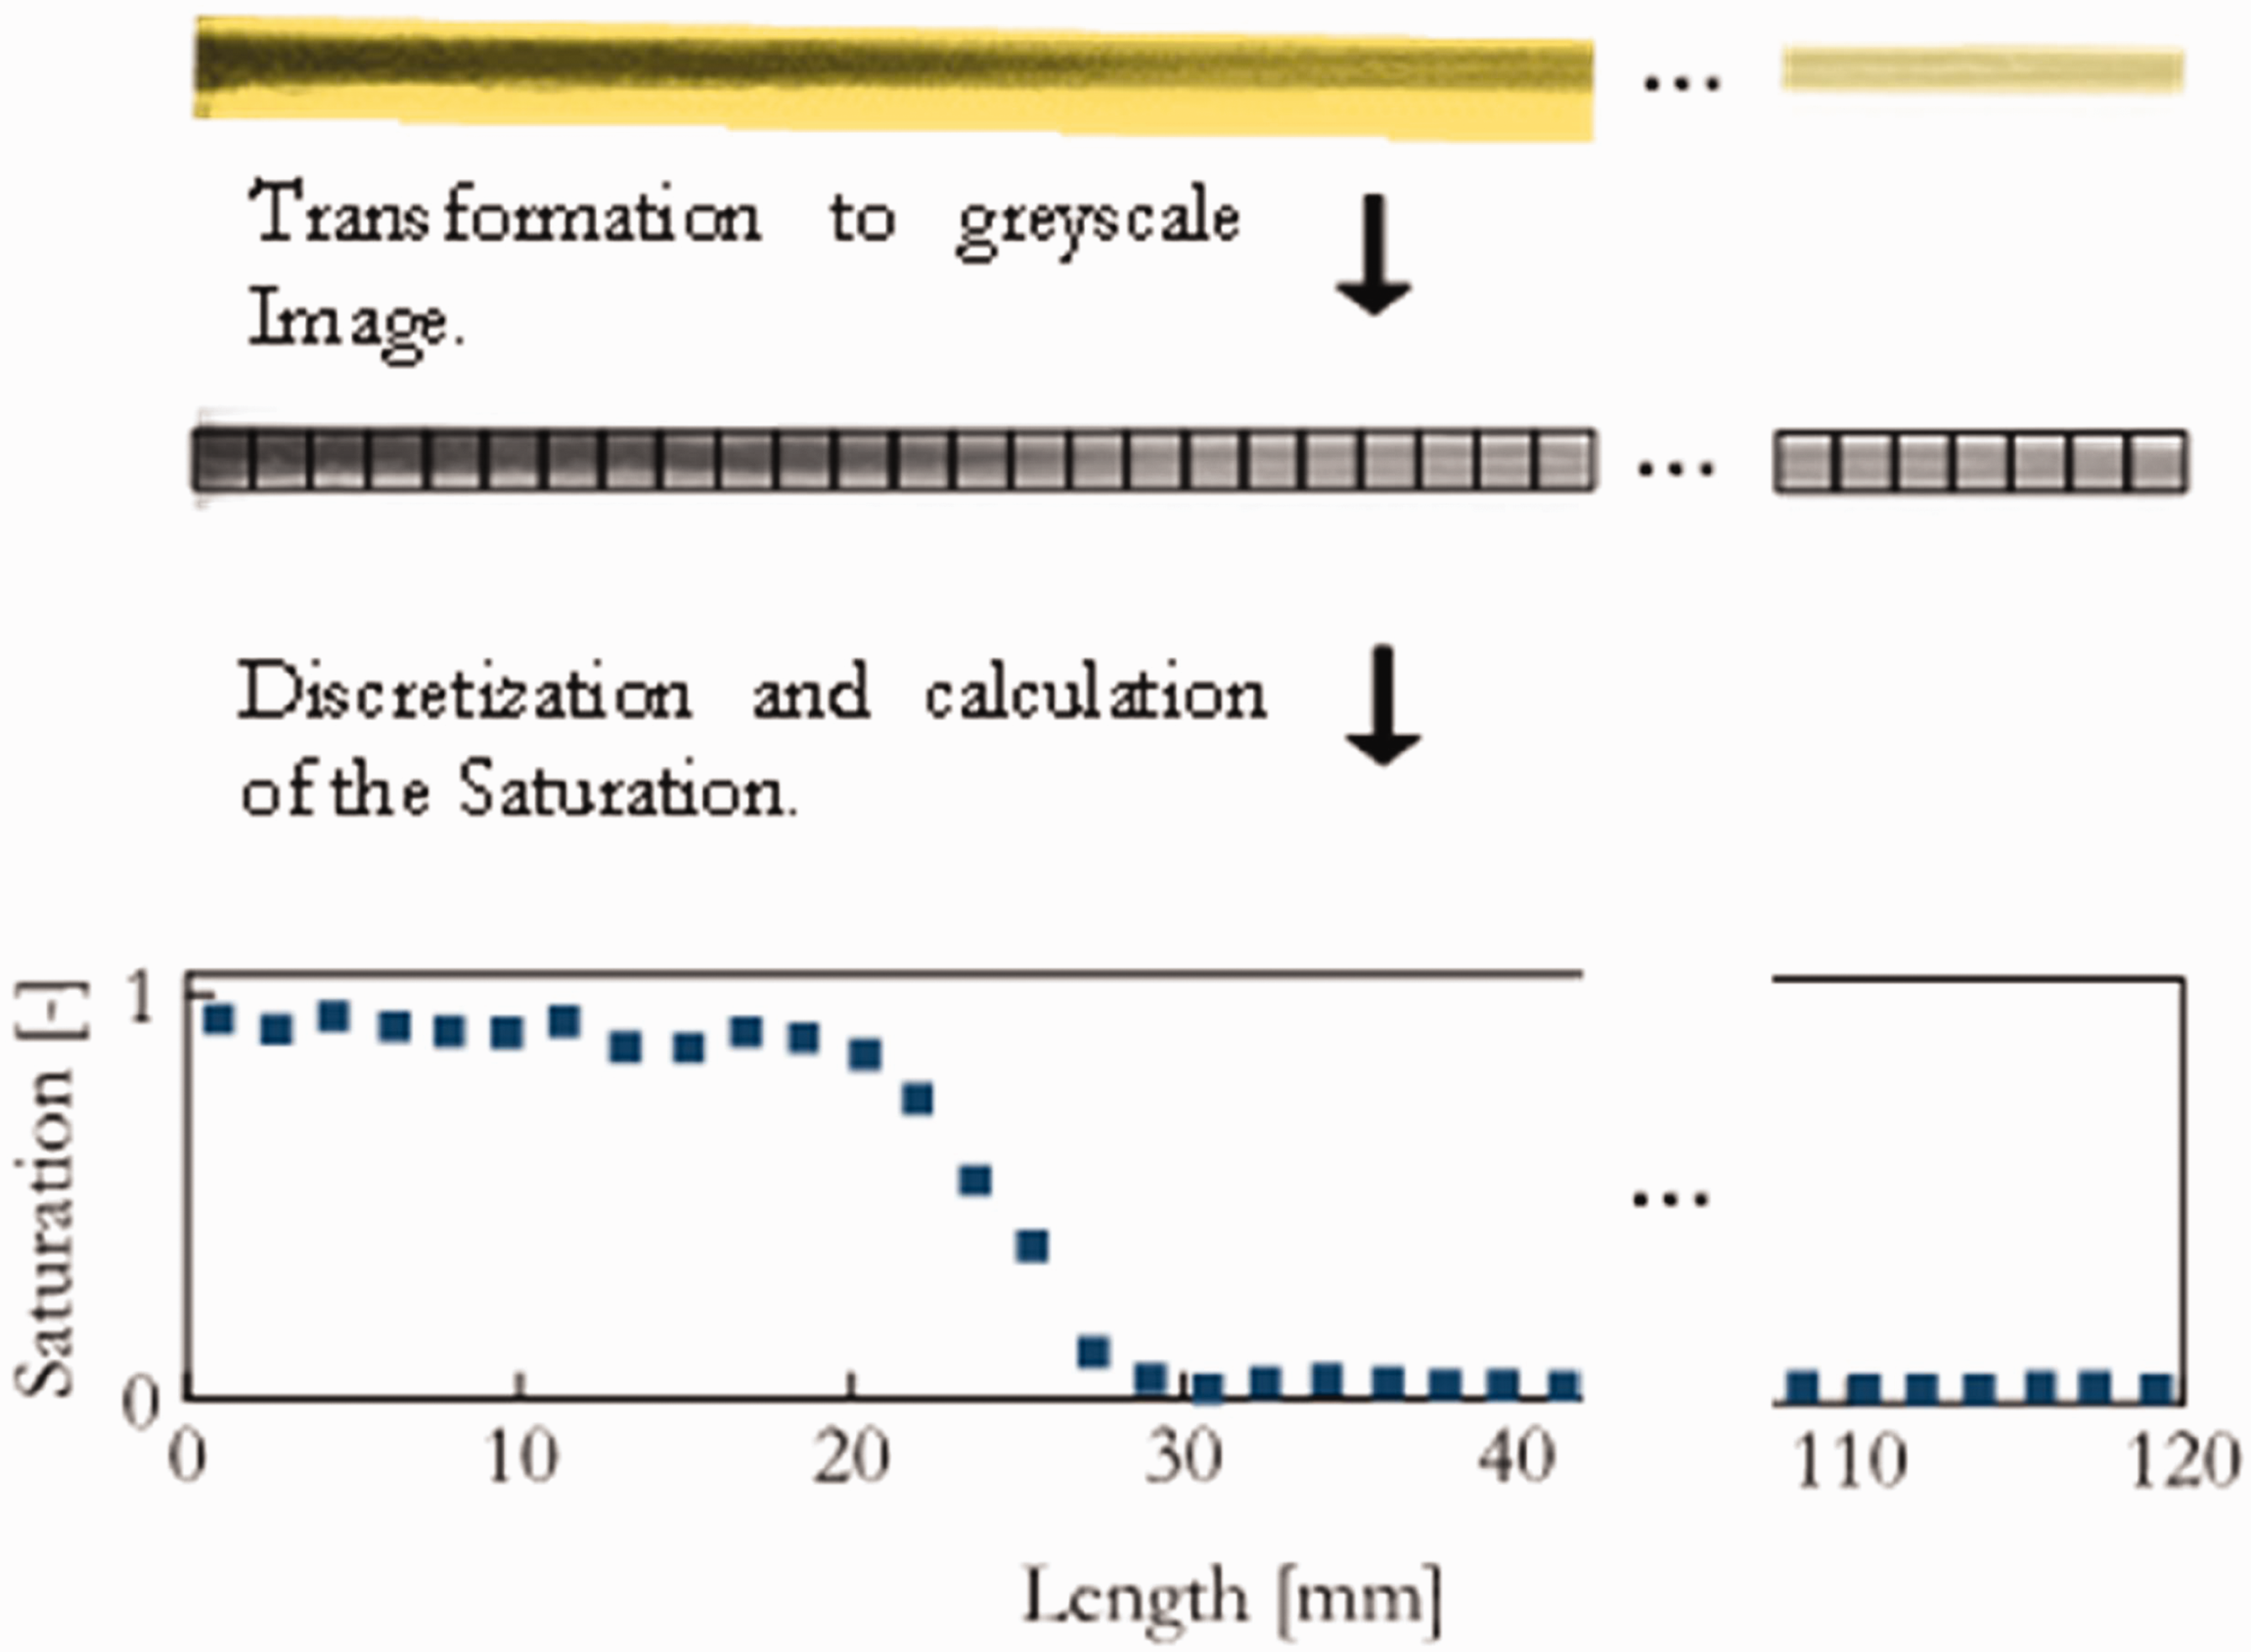
Schematic workflow of evaluation the local saturation in the porous material.
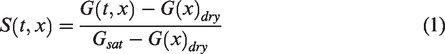
In a first step the images were transformed into a grayscale image. Afterwards the contour of the capillary was extracted and discretized into 1.5 × 1.5 mm squares. In each square the average gray value was computed. With the expression
In the considered gray value range (
Comparison of linear and logarithmic scaling to determine the saturation.
Additionally, the average saturation
This metric offers valuable insights into the global behavior of the imbibition process.
Modeling of spontaneous imbibition
Numerical model
To model the spontaneous imbibition the Richards equation
39
is used:

In the given expression, 
By reformulation the diffusion form of the Richards equation is obtained:

Where the moisture diffusion coefficient is:
However, 
The constitutive equations to parameterize 

In several publications the formula was successfully applied in combination with Van Genuchten’s formula for the capillary pressure to model the imbibition in fibrous porous media.18,23,38 The absolute permeability is determined based on a correlation from Gebart which was derived from first principles (Navier-Stokes equation) for parallel fibers:
43
The correlation gives the absolute permeability
The numerical model was applied to a one-dimensional domain with the length of
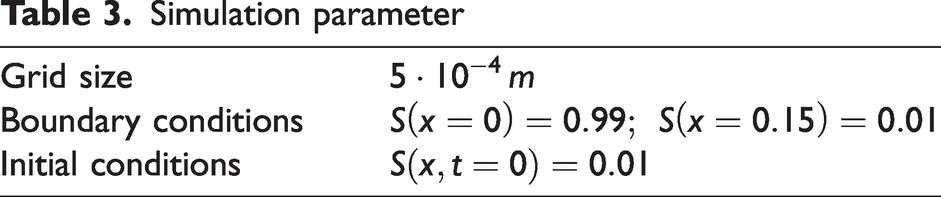
Simulation parameter
For solving the partial differential equation (6), the equation was spatially discretized with classical finite volume method with linear interpolation of the fluxes. 44 The system of differential equation was solved with PythonTM 3.1 with SciPy’s ODE solver ‘solve_ivp’ and the ‘LSODA’ method; a method employing Adams/BDF-method with automatic detection of stiffness and subsequent switching.45,46 A mesh-study was conducted to ensure a mesh independent solution (see ‘Grid study’ in Supporting information).
Capillary saturation curves simulated with the pore-morphology method
To determine the crucial capillary saturation curve of the considered porous material for spontaneous imbibition the pore-morphology method was used. This computational method is based on imaging algorithms. The method uses a quasistatic geometric approach for obtaining a relationship between saturation distribution and capillary pressure within a unit cell. Assuming a local thermodynamic equilibrium, comparable to quasistatic pore network simulations, this method was first developed by Hazlett,
47
and later used by Hilpert and Miller
27
for porous media such as soil and has been used for fibrous media as well.12,28,48,49 In the pore-morphology method, the void spaces in a given porous structure are fitted with spheres which represent the wetting phase and they are all superimposed and interconnected, establishing a continuous pathway originating from a reservoir of wetting fluid set at the side of the considered unit cell. The radii of spheres correspond to predetermined capillary-pressure values, calculated with the Young-Laplace equation:
In order to determine capillary saturation curves with the pore-morphology method a digital representation of the porous material is necessary. To obtain a representative capillary pressure saturation curve a digital geometry of the porous media a so-called representative elementary volume (REV) is necessary. With the knowledge of the porosity and the filament diameter and the assumption of parallel filaments with a circular cross-section the porous material considered in this study is digitally reconstructed. In our study we assume parallel fibers, therefore the computational domain reduces to two dimensions. Following the approach of Maier et al., 50 circles are randomly placed in a quadratic rectangle. The size of the quadratic rectangle is determined by the porosity, filament diameter and the number of filaments in the REV. In Figure 7 four different REVs are shown.
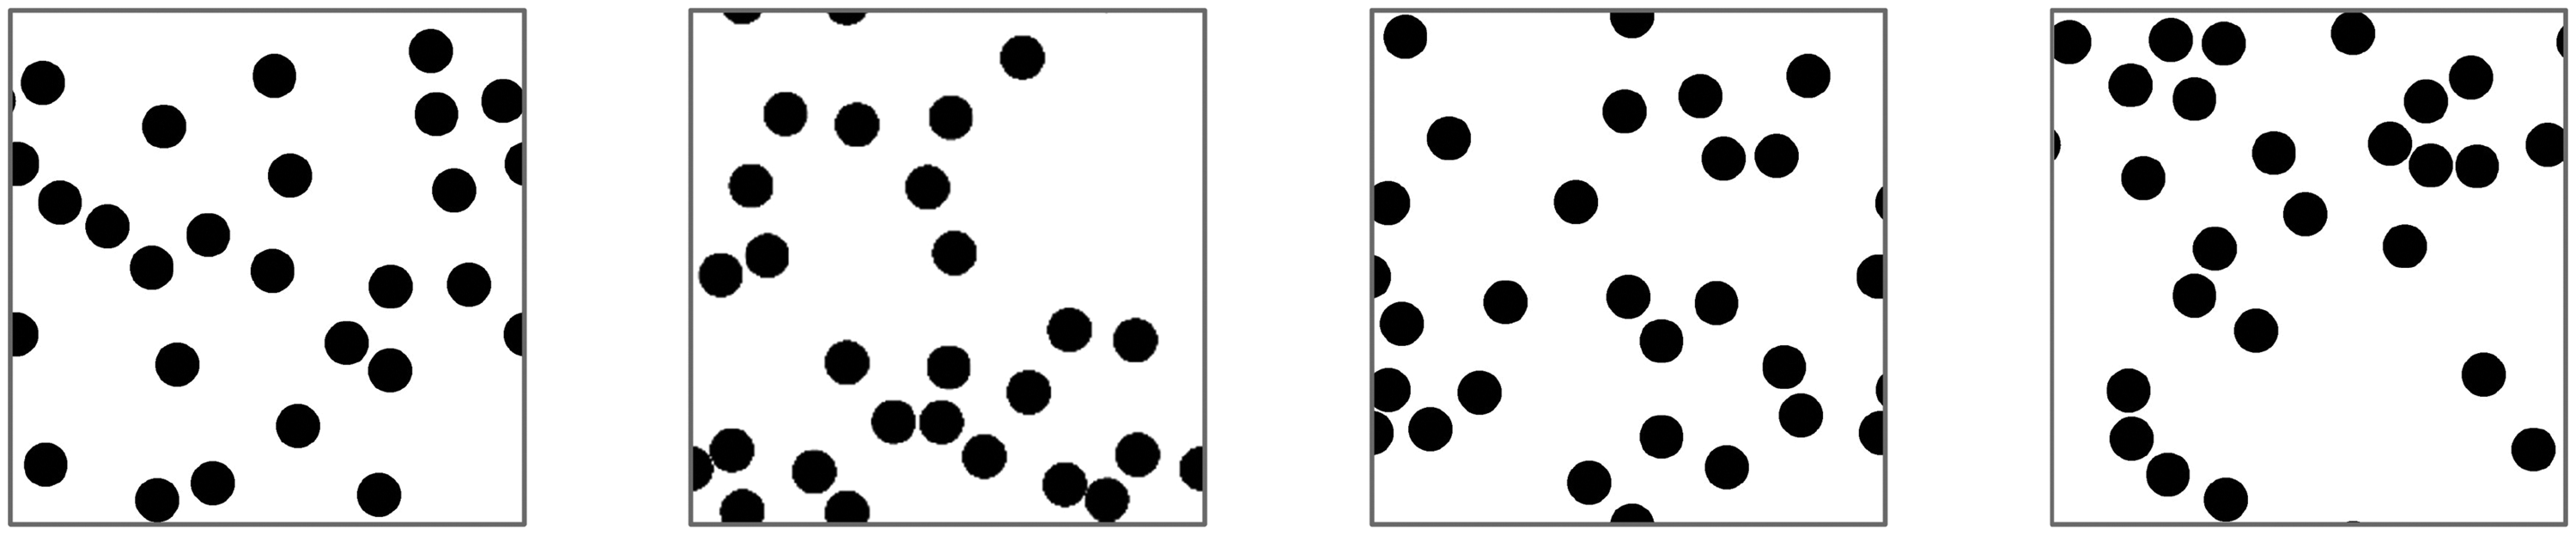
Four different randomly generated representative volume elements (REVs) representing the f128 material.
In Figure 8 the fundamental steps of the pore-morphology method are depicted.
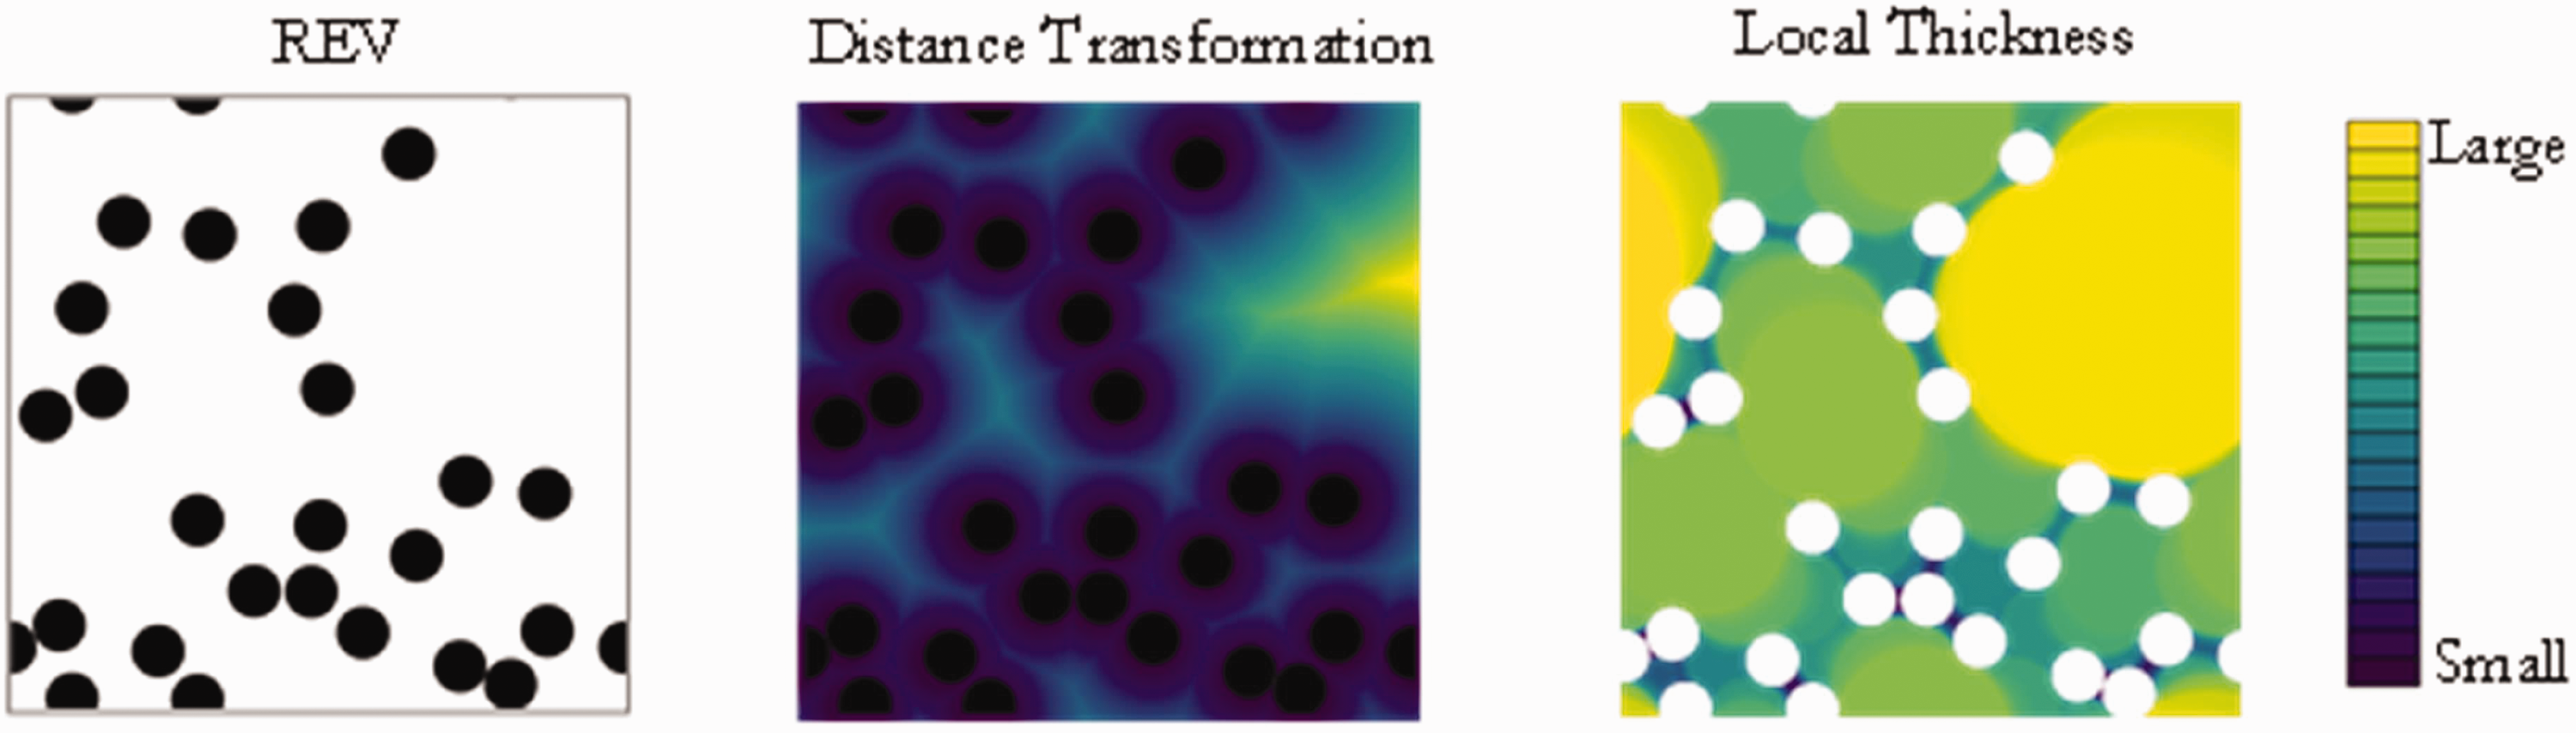
The fundamental steps of the pore-morphology method encompass the application of distance transformation and sequential voxel dilatation, referred to as local thickness, for a representative volume element (REV).
In the pore-morphology method, a distance transform is initially computed for the pore space, establishing distance values from each pore voxel to the nearest solid phase. Subsequently, the pore space undergoes dilation using digital disks, with the process commencing at the smallest radius and incrementally increasing. From the result of this dilation, a capillary pressure map is calculated, based on the young Laplace equation shown in equation (12).
The sequential filling and computation of the corresponding capillary pressure is shown in Figure 9.
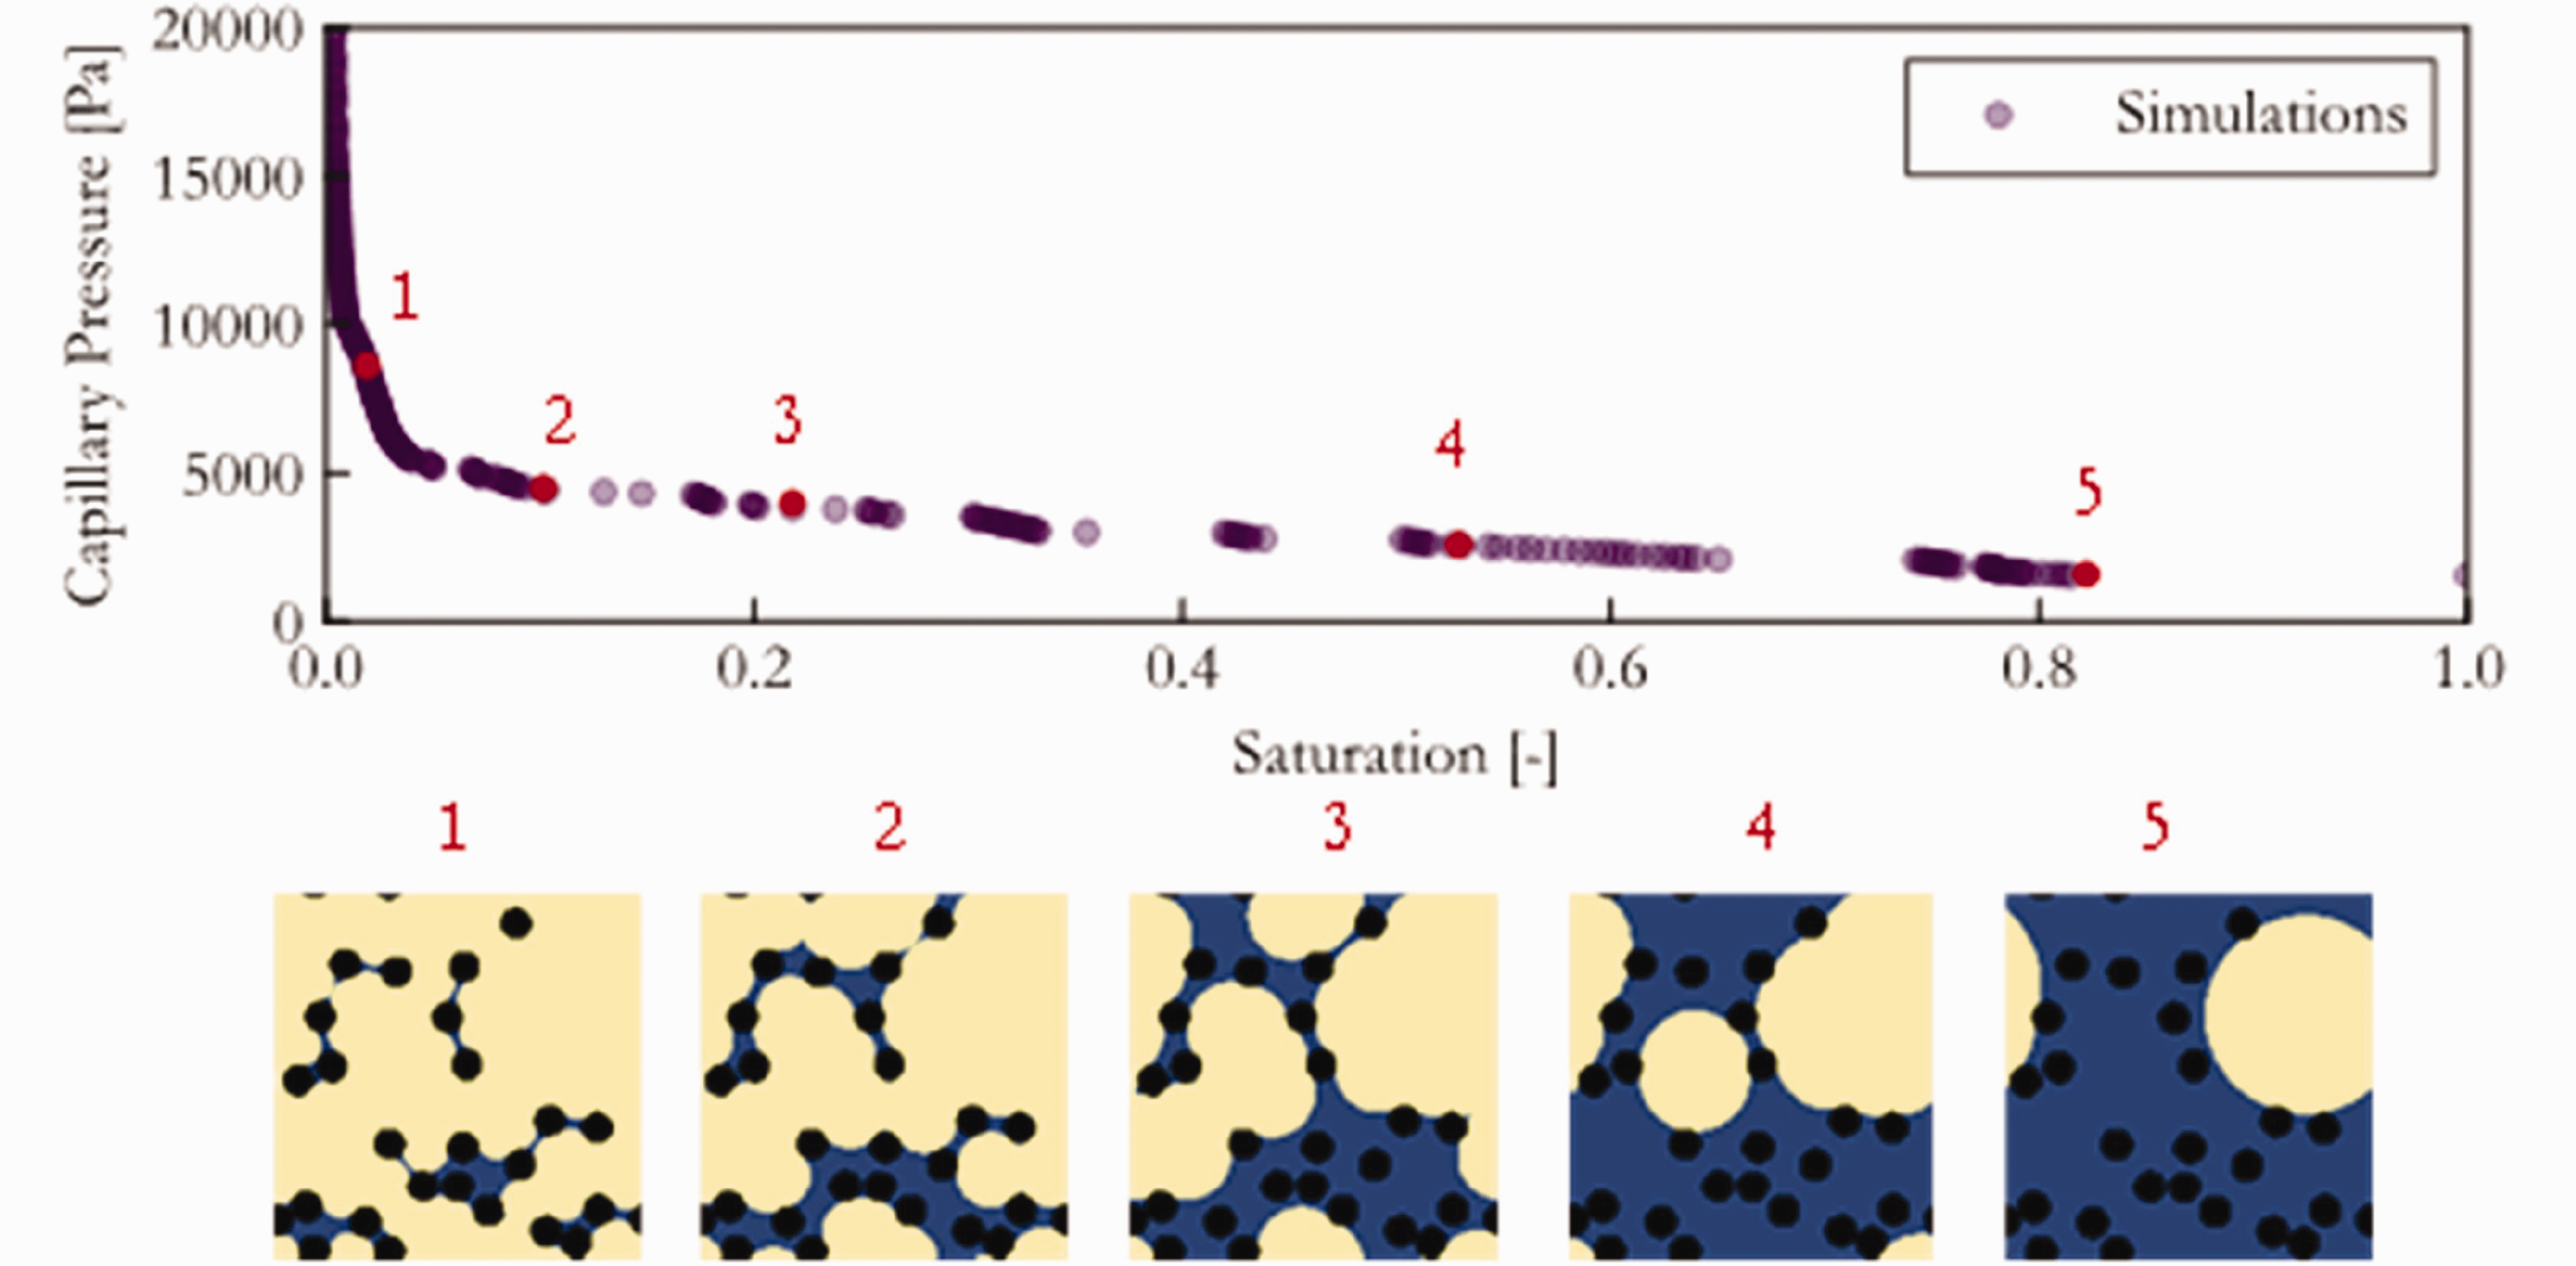
Illustrated schematic stages of a pore-morphology simulation. At the top, data points for capillary pressure with the corresponding saturation are displayed, while at the bottom, the corresponding representative elementary volume (REV) is presented with associated saturations.
Following this, a stepwise approach is employed to record saturation. Spheres of the smallest diameter are inserted everywhere they can fit, and all uncovered space is considered filled with wetting phase. The saturation is then quantified as the volume fraction of the pore space that is filled by the wetting phase (i.e. not overlapped by spheres). This process is iteratively repeated for subsequent pressure steps, with each iteration utilizing a larger digital disk. Because the process is simulating imbibition of a wetting phase with relatively low viscosity it was assumed that wetting films proceeded the invasion allowing wetting fluid to access anywhere within the domain. For this reason, connectivity of the invading phase to the inlet reservoir was not enforced. In a future study, the bending of the fibers might be considered, making it necessary to simulate the sequential filling in three dimensions making a trapping of non-wetting fluid possible. The original pore-morphology method is developed for totally wetting porous media. However, we follow here Schulz et al. and employ
To reduce the computational cost and to reduce the influence of wall effects we employed periodic boundaries. Therefore, the method graphically outlined in Figure 10 was employed.
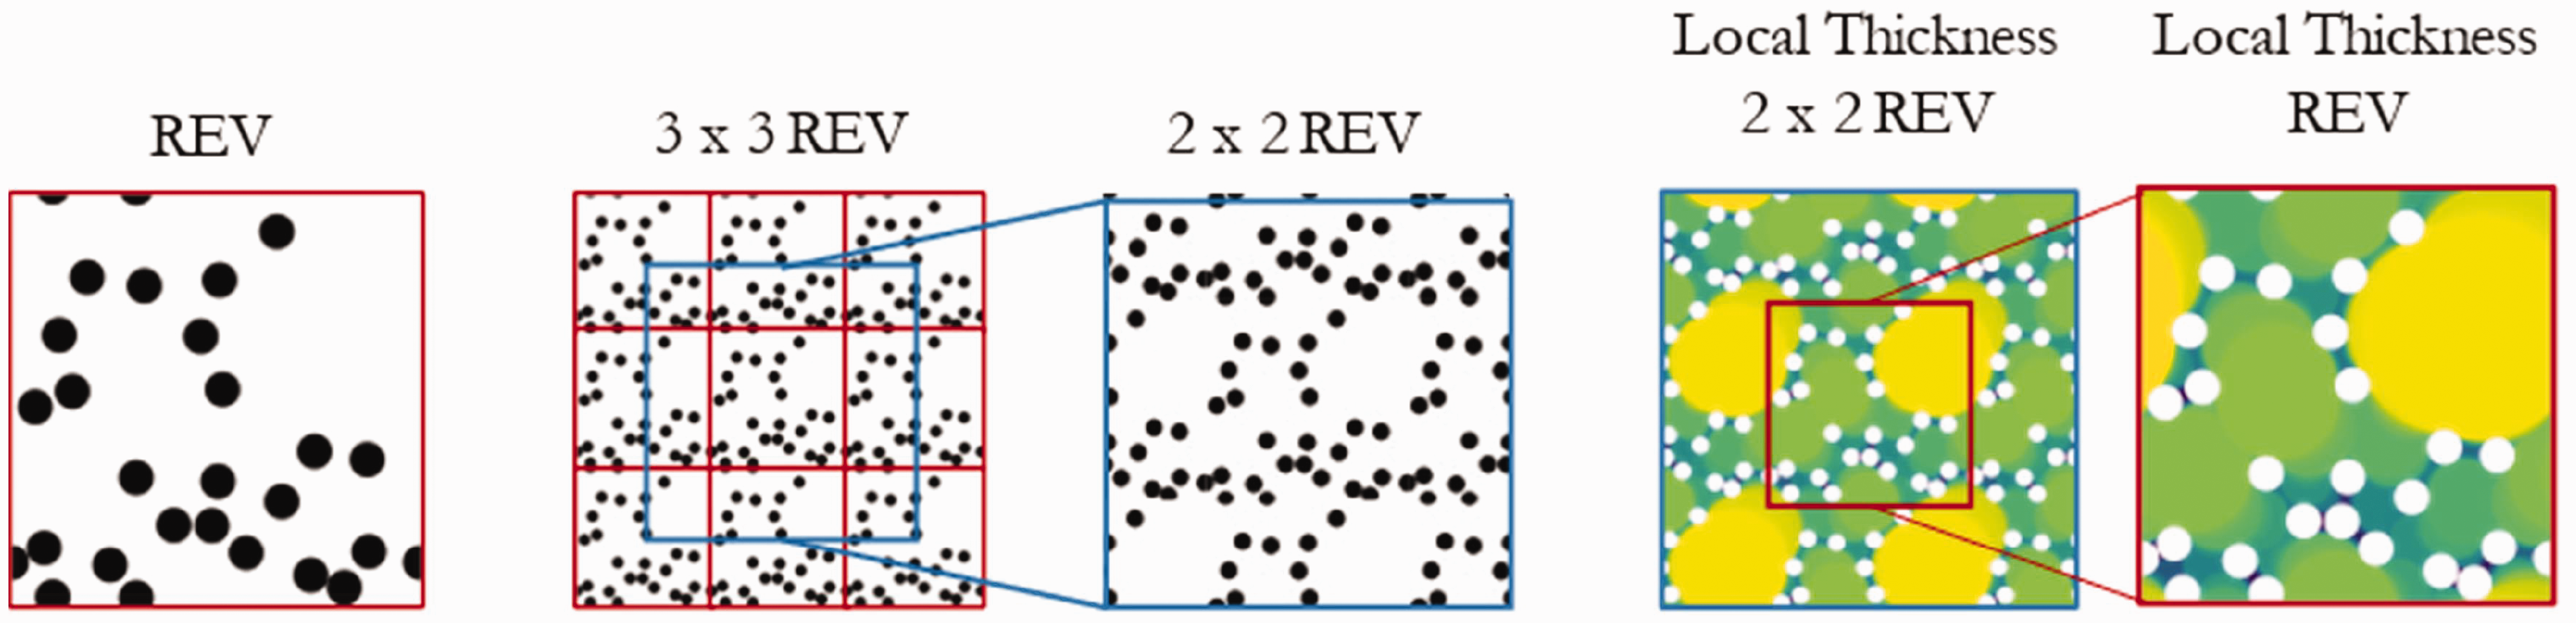
Illustration of the periodic boundaries in the context of the pore-morphology method.
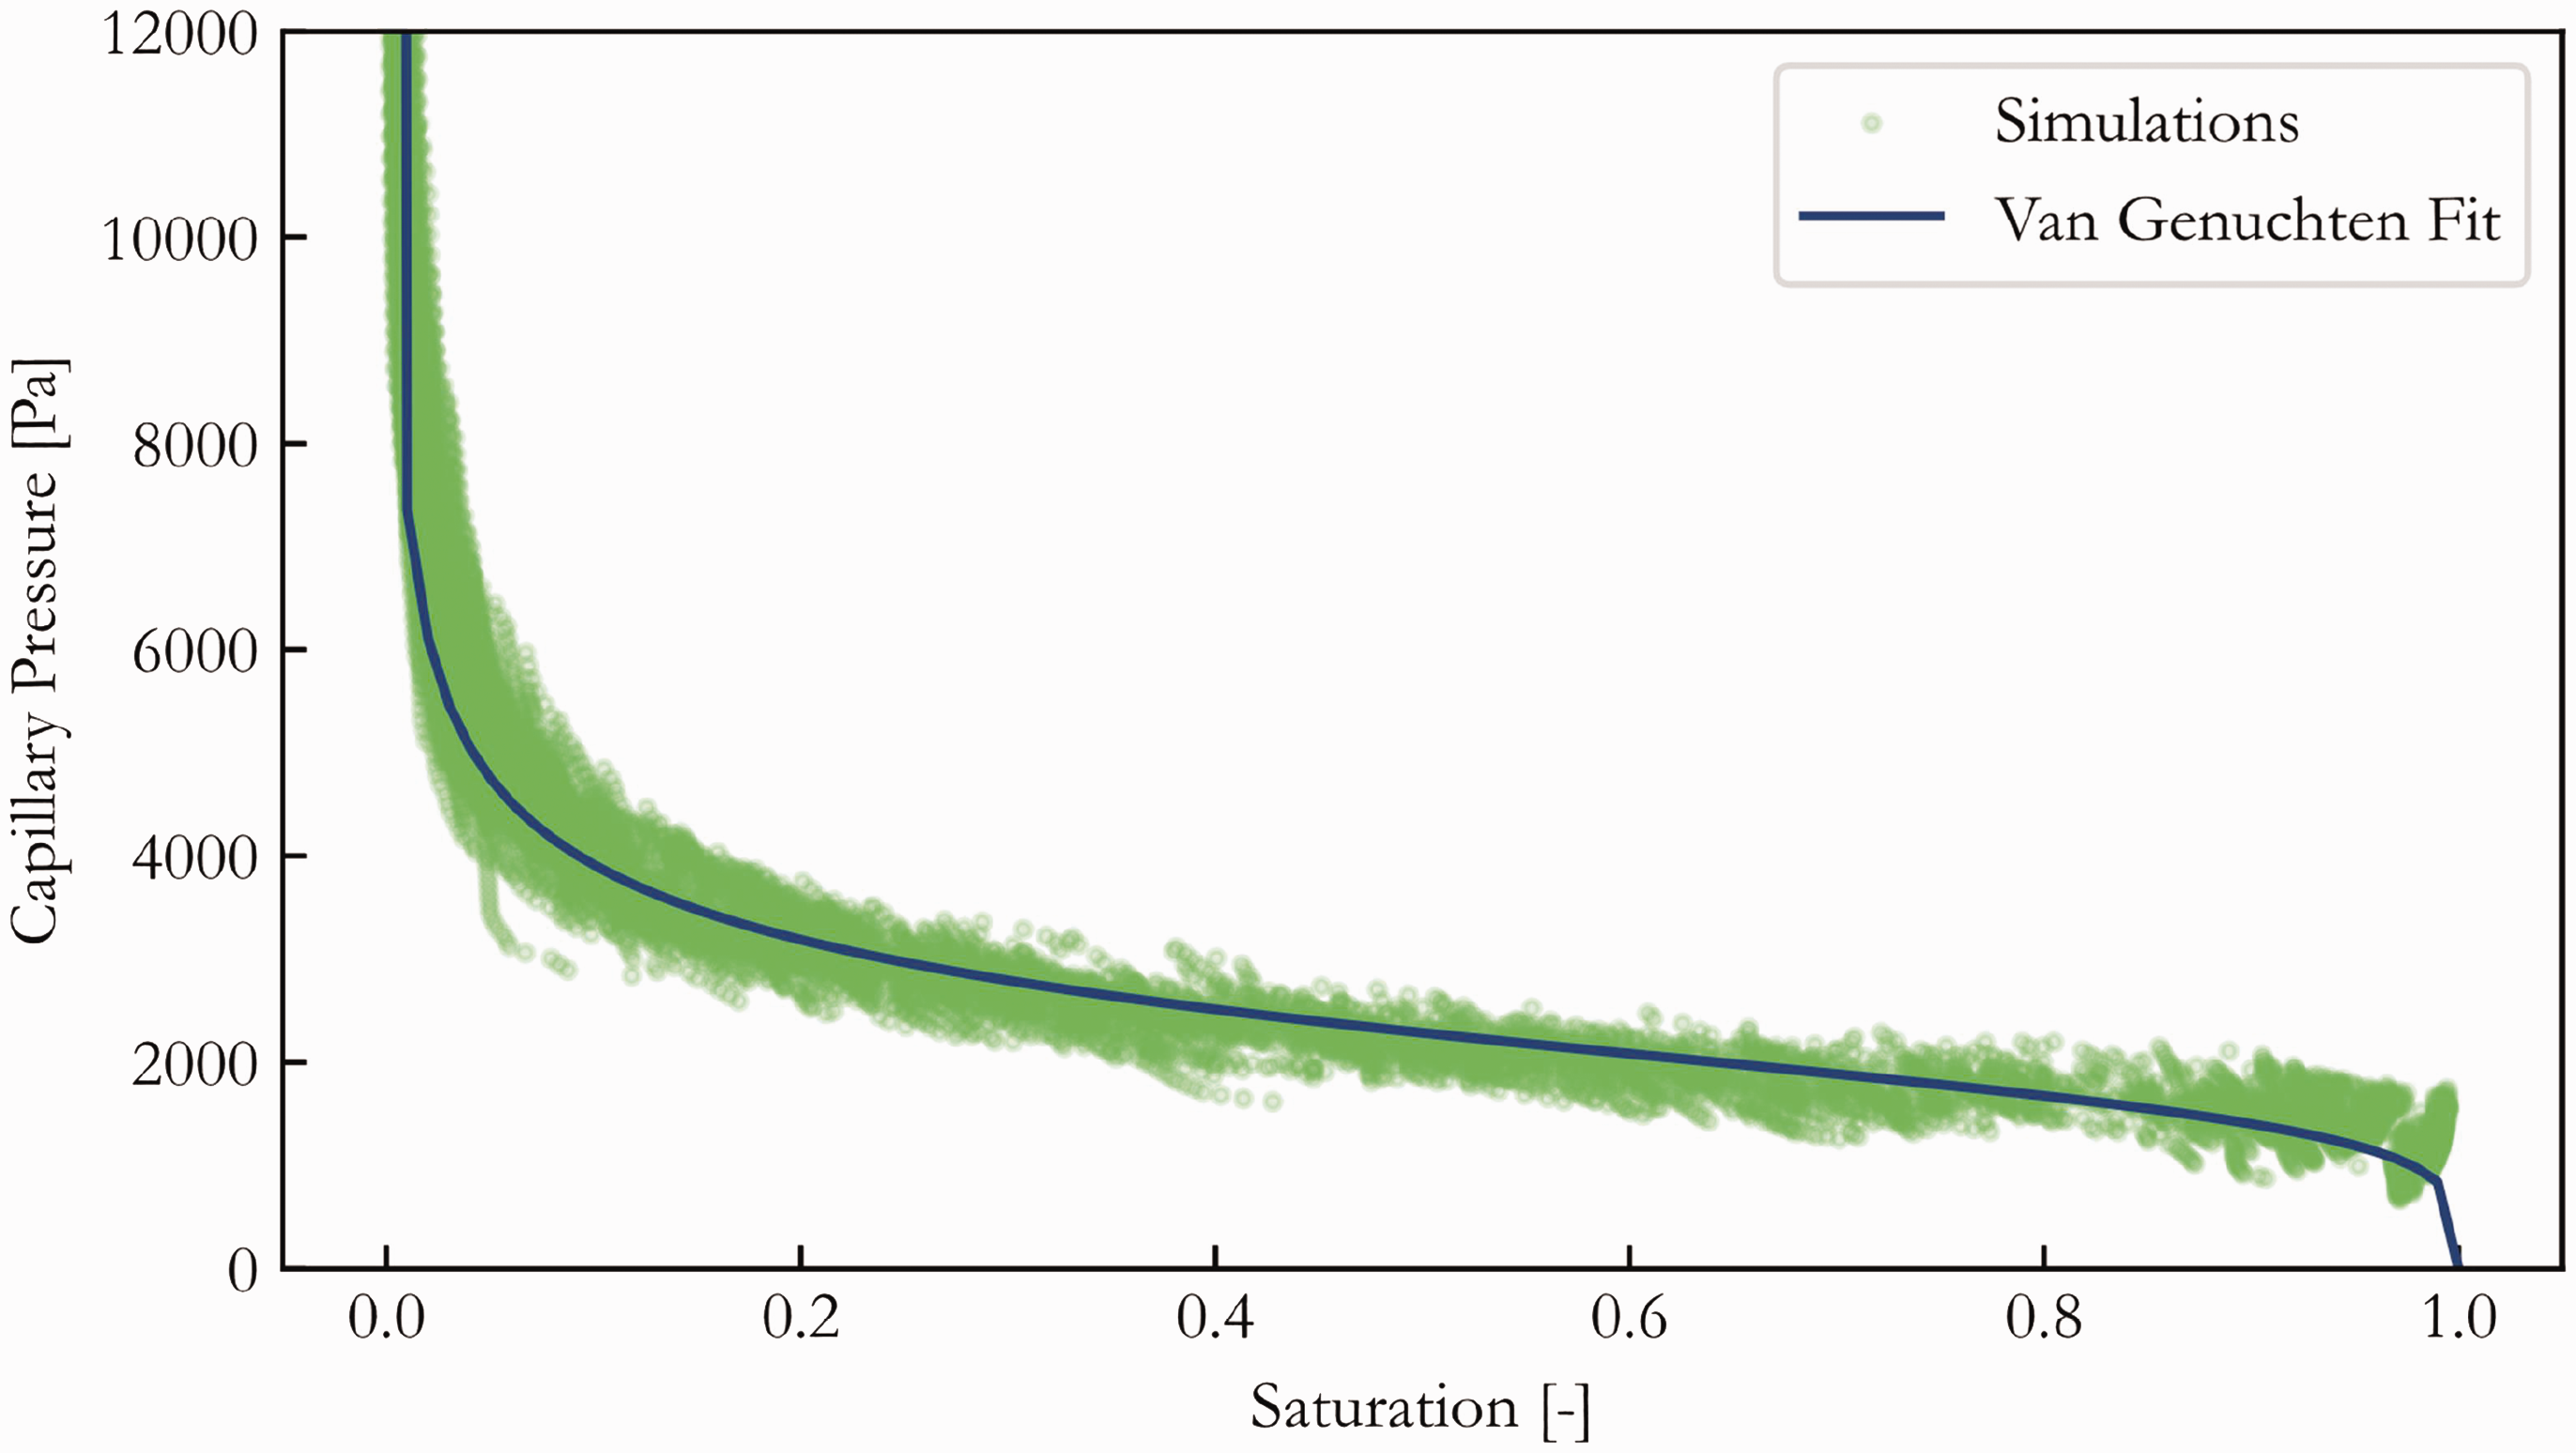
Capillary pressure – saturation data obtain from pore-morphology simulation and the corresponding fitted Van Genuchten equation for the f256 fibrous porous media with polyethylene glycol (PEG) as imbibing fluid.
Three-by-three REVs were assembled. Subsequently, a 2 by 2 REV size was extracted, and the local thickness was calculated for the image. From this resulting local thickness map, another REV was excised to establish periodic boundaries for the sequential computation of capillary pressure and wetting saturation data.
Capillary pressure – saturation data is gathered for each representative volume element (RVE). Simulating the fibrous porous media considered in this study involved generating 500 randomized RVEs for every material sample.
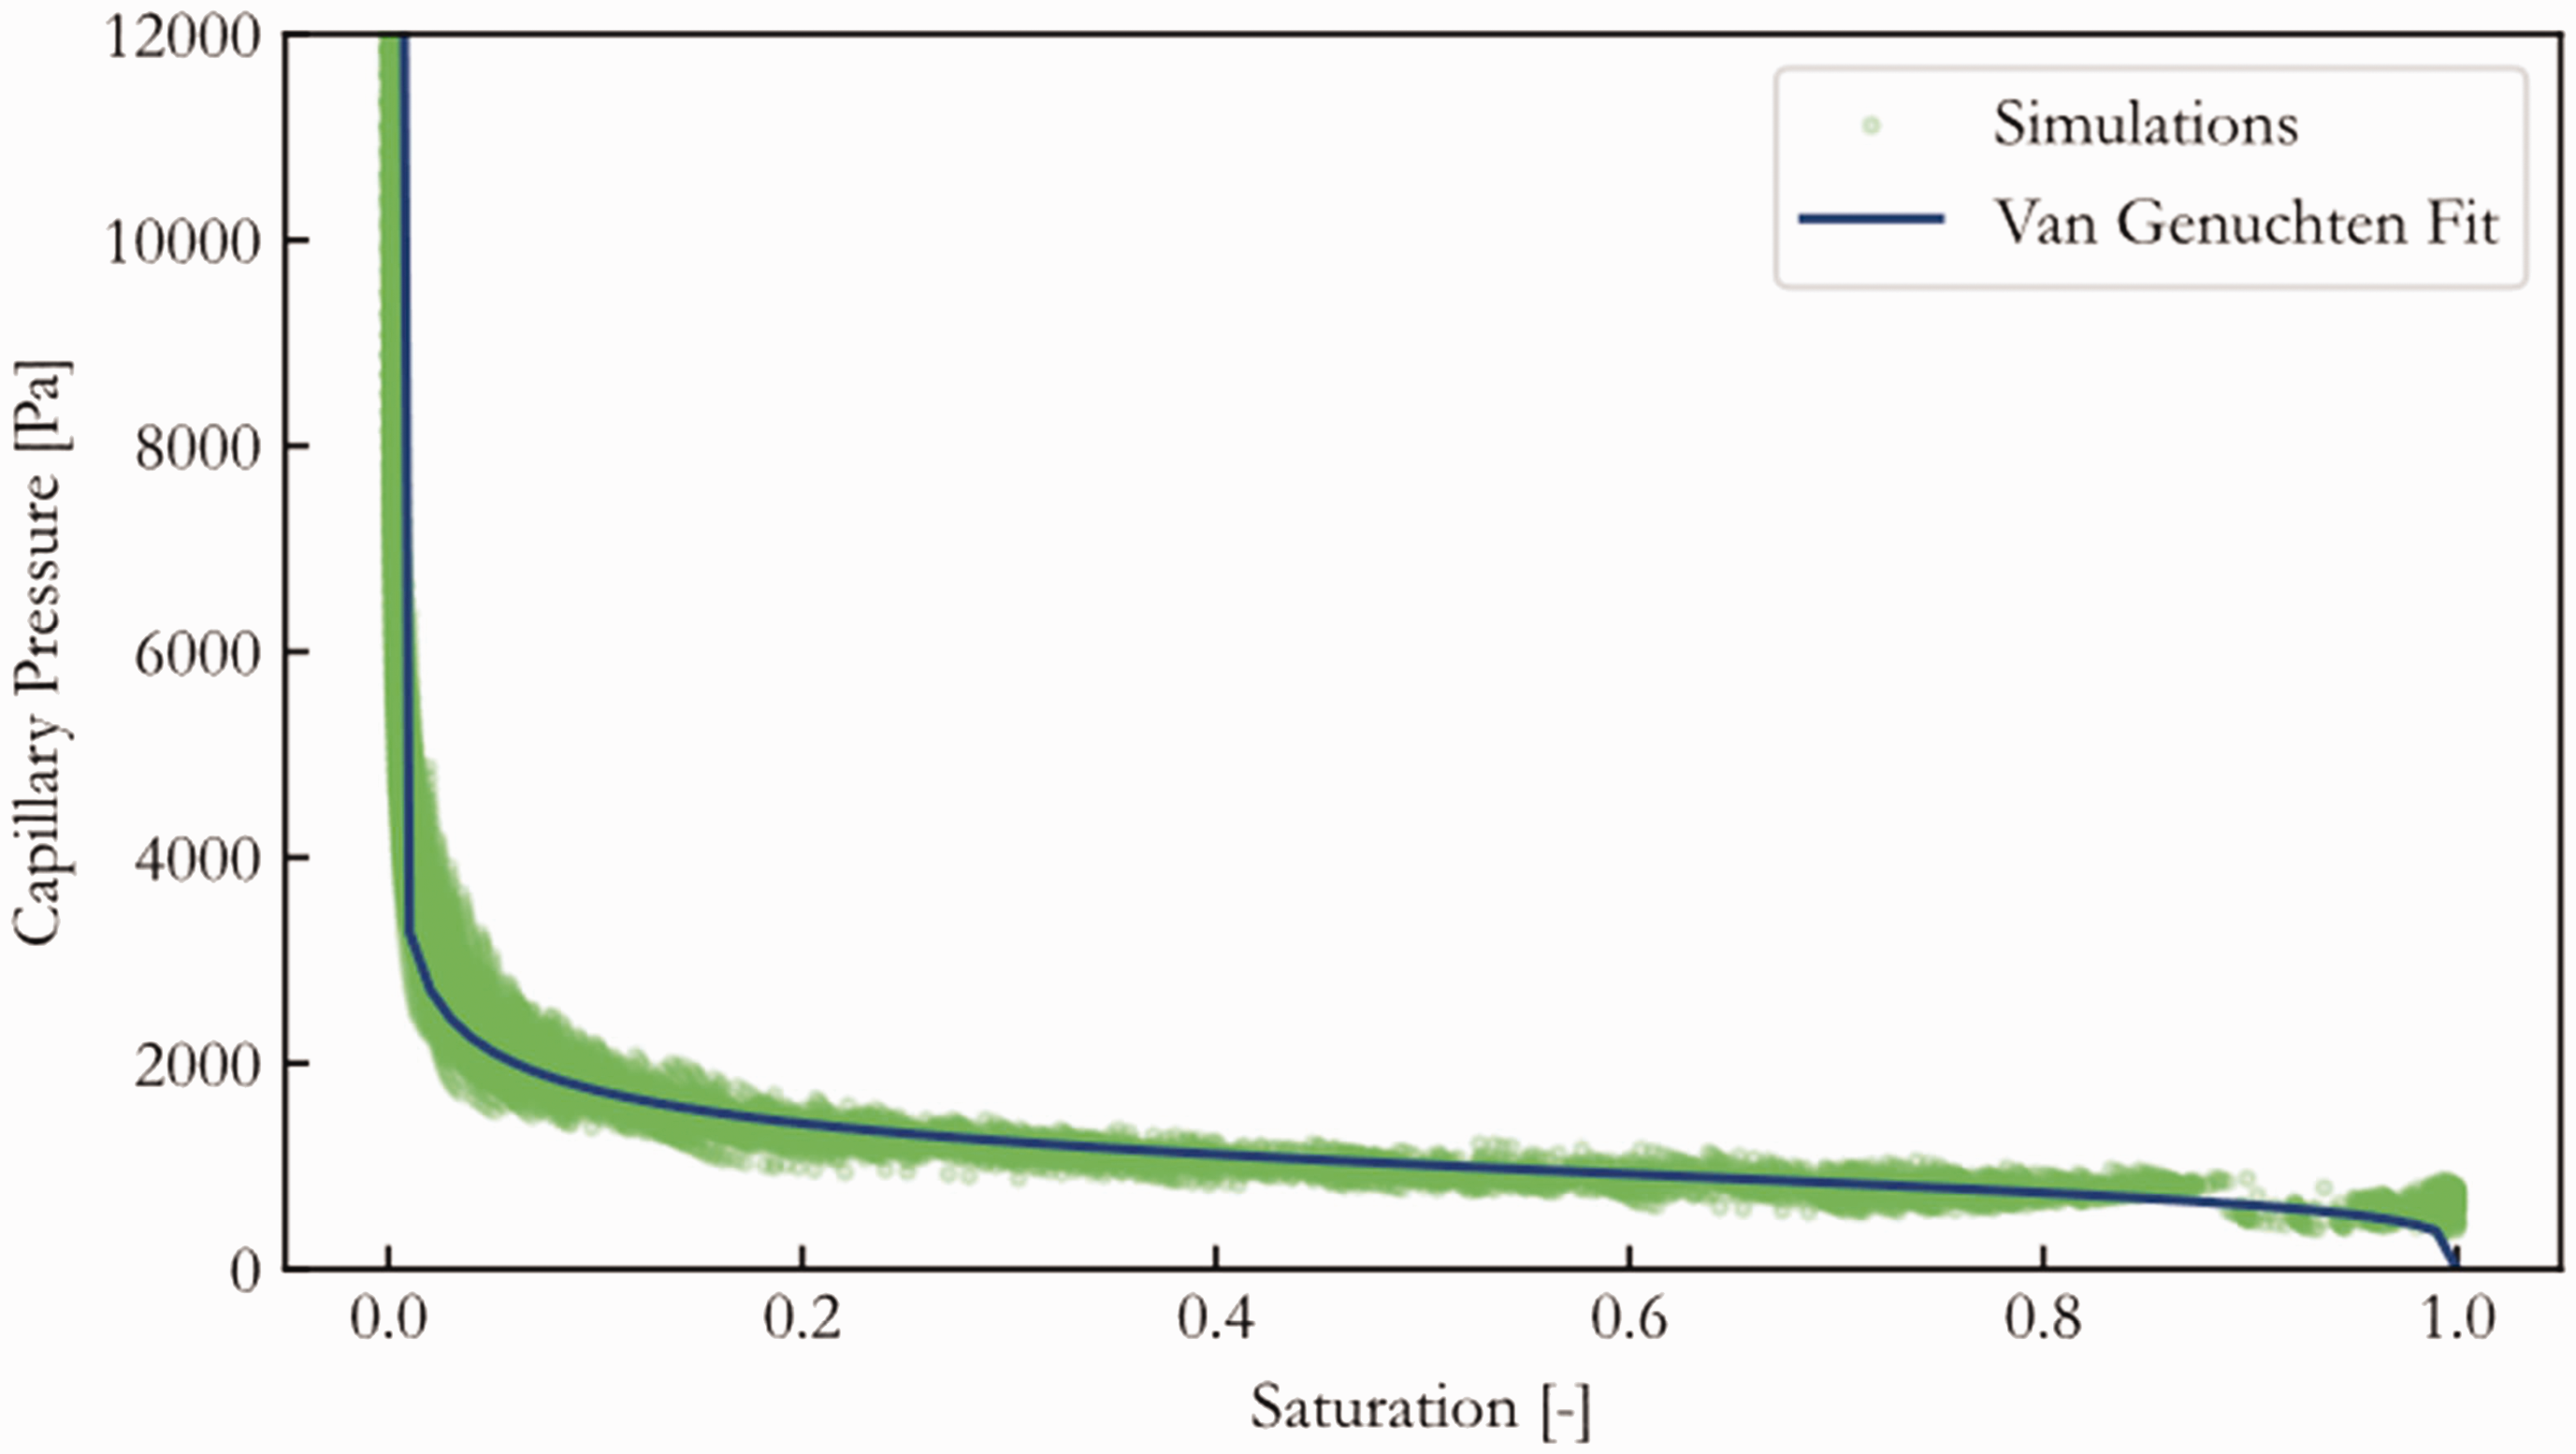
Organizing the data for each sample was achieved by fitting the Van Genuchten equation (9) using curve_fit from the Scipy library in PythonTM 3.1. The fitting process was conducted in logarithmic space, aimed to eliminate biases towards large capillary pressures. Additionally, the data underwent sampling with the library pandas to ensure a balanced distribution across the entire saturation range. An example of the data and the corresponding curve fitting is shown in Figure 11.
Results and discussion
Experimental result
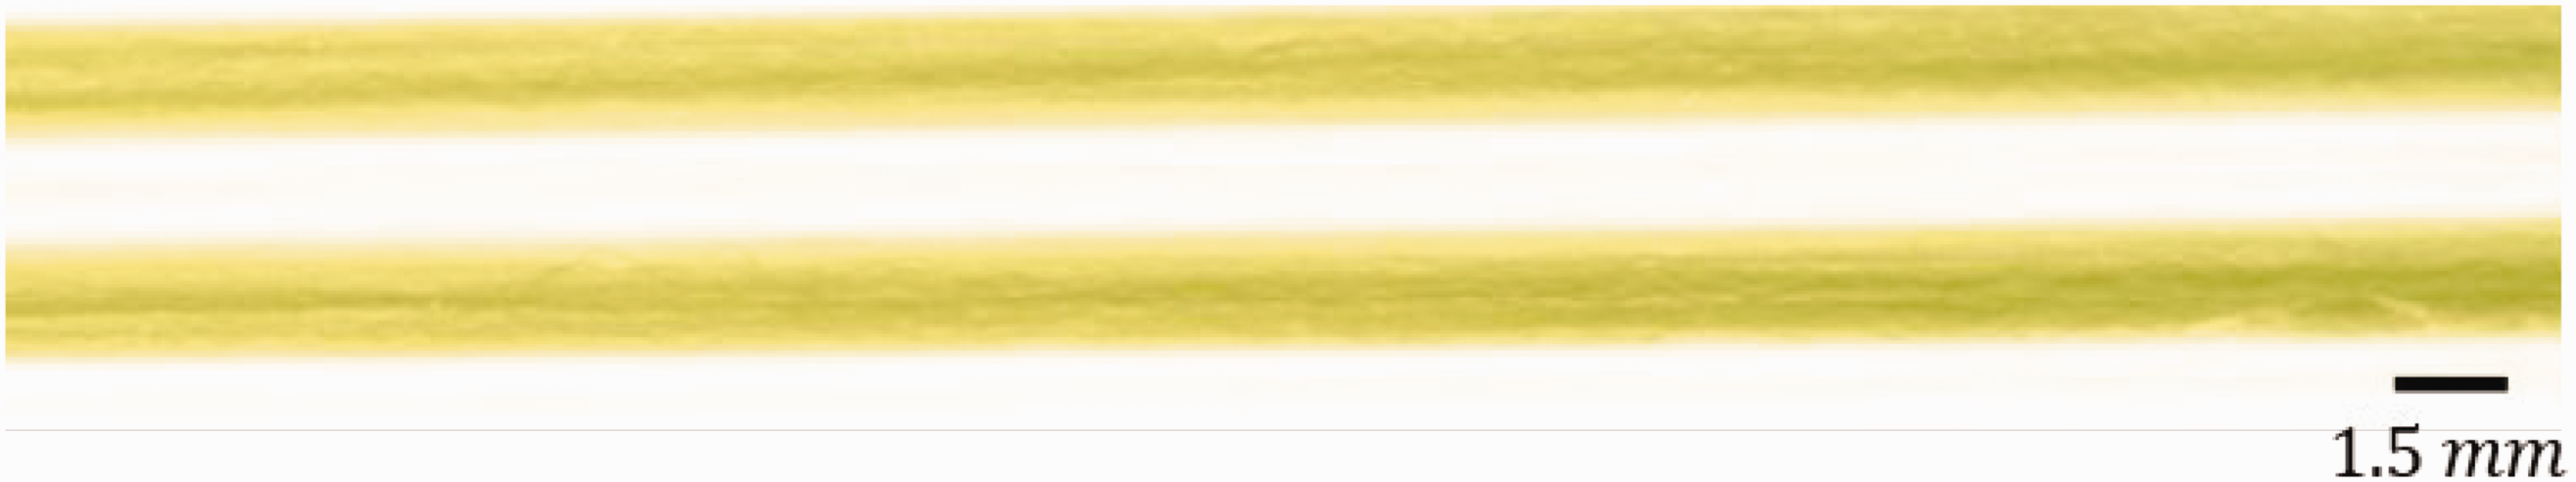
Representative images captured during the experiment are depicted in Figure 12.
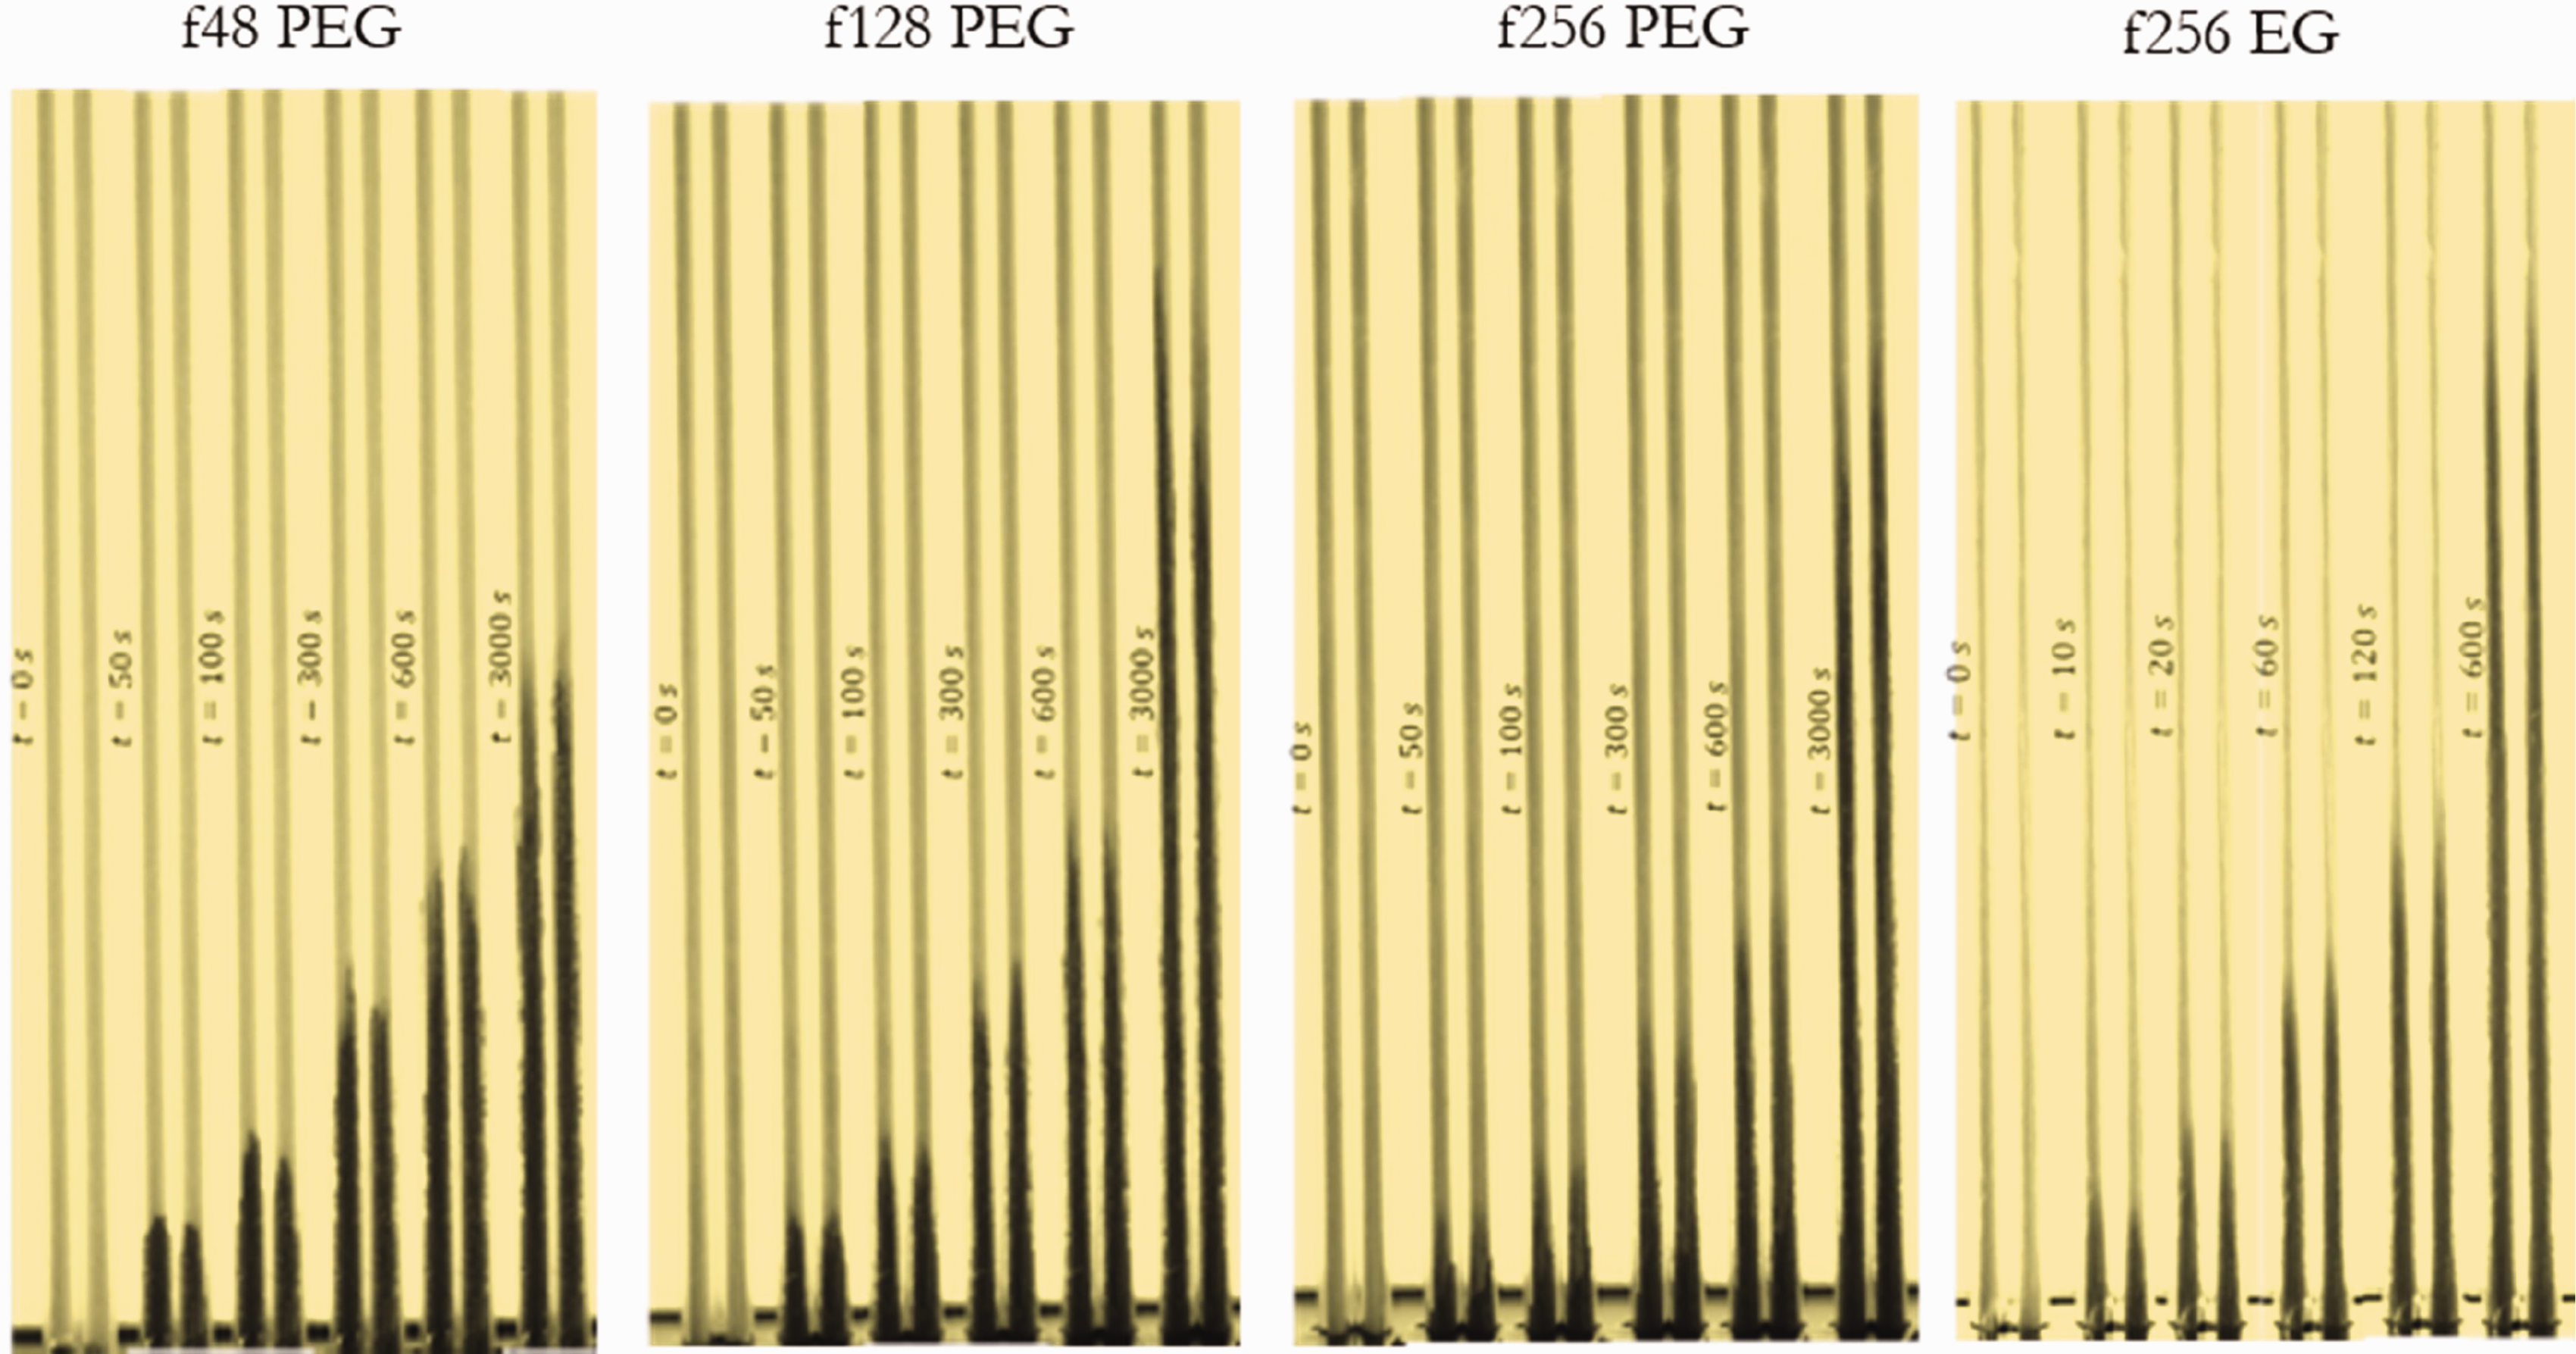
Images with enhanced contrast from spontaneous imbibition of blue-colored polyethylene glycol (PEG) and ethylene glycol (EG) in different yarn material.
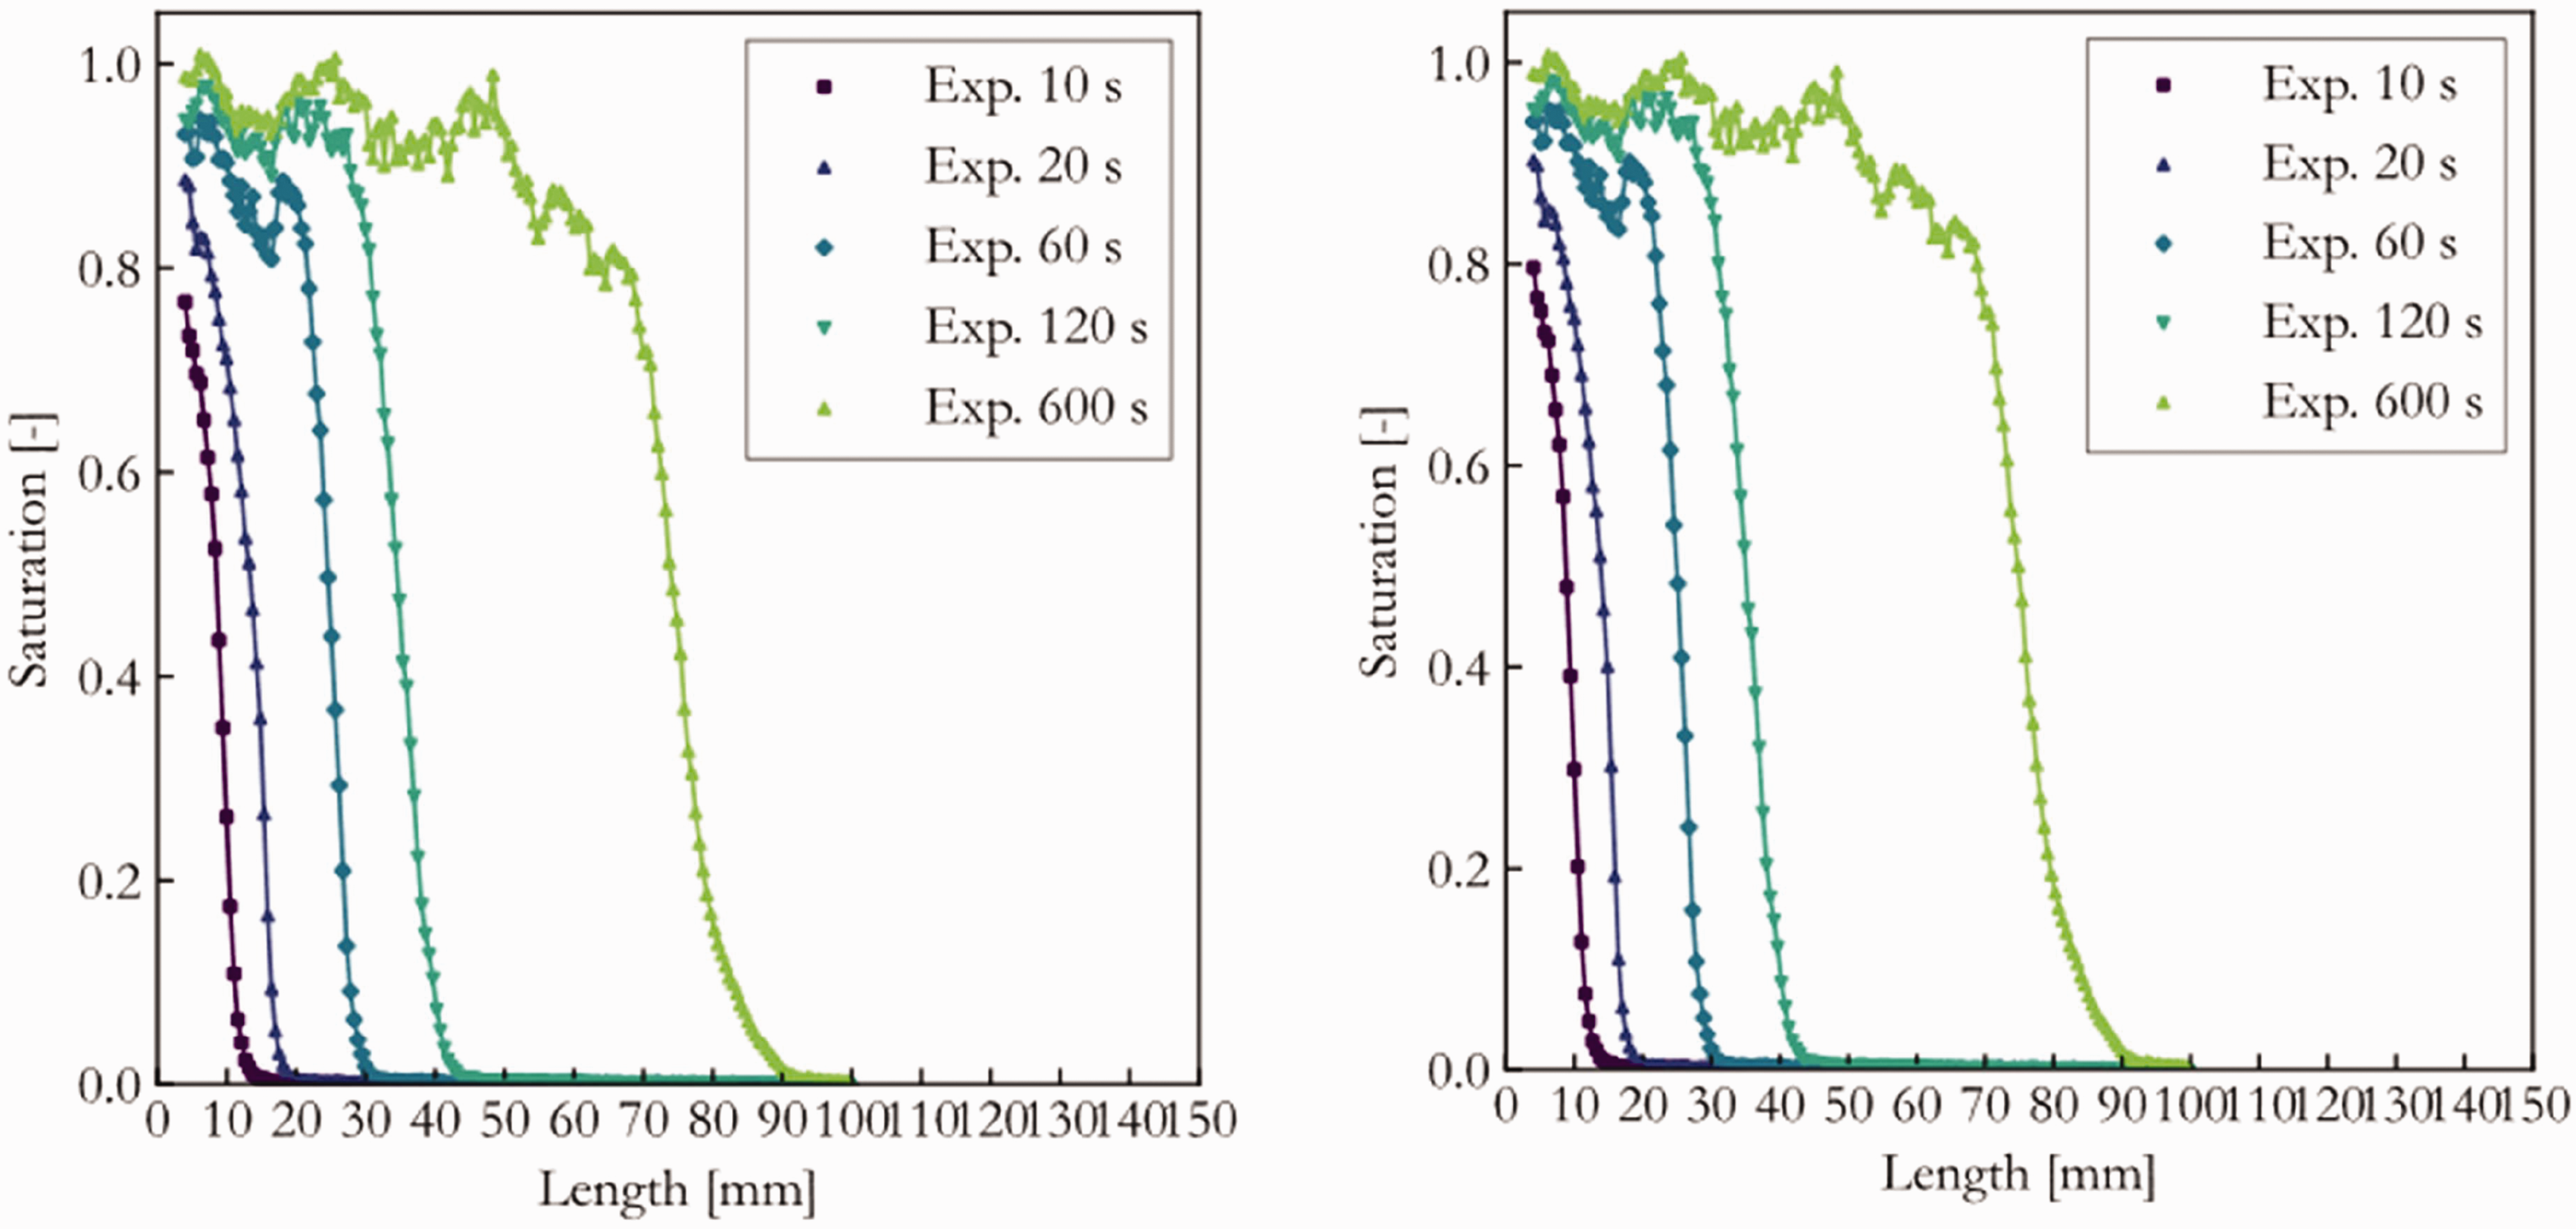
The simultaneous investigation of two samples highlights the reproducibility of the experiments; in total, four experiments for each material were conducted. This indicates that the substantial variability observed in terms of wicking height and the dynamics of spontaneous imbibition across different samples of the same yarn material might be due to the small number of pores when considered a single yarn, as noted. 22 The inclusion of a greater number of fibers, leading to an increased pore count, allows for the observation of an average behavior in spontaneous imbibition. This approach is not only more realistic but also more applicable in practical scenarios, as numerous yarns are typically woven or knitted for diverse textile applications, thereby contributing to a more representative understanding. The yarn being in a glass capillary comes closer to the geometrical situation of dense fabrics like weaves or knits where the yarn is compressed and surrounded by neighboring yarns.
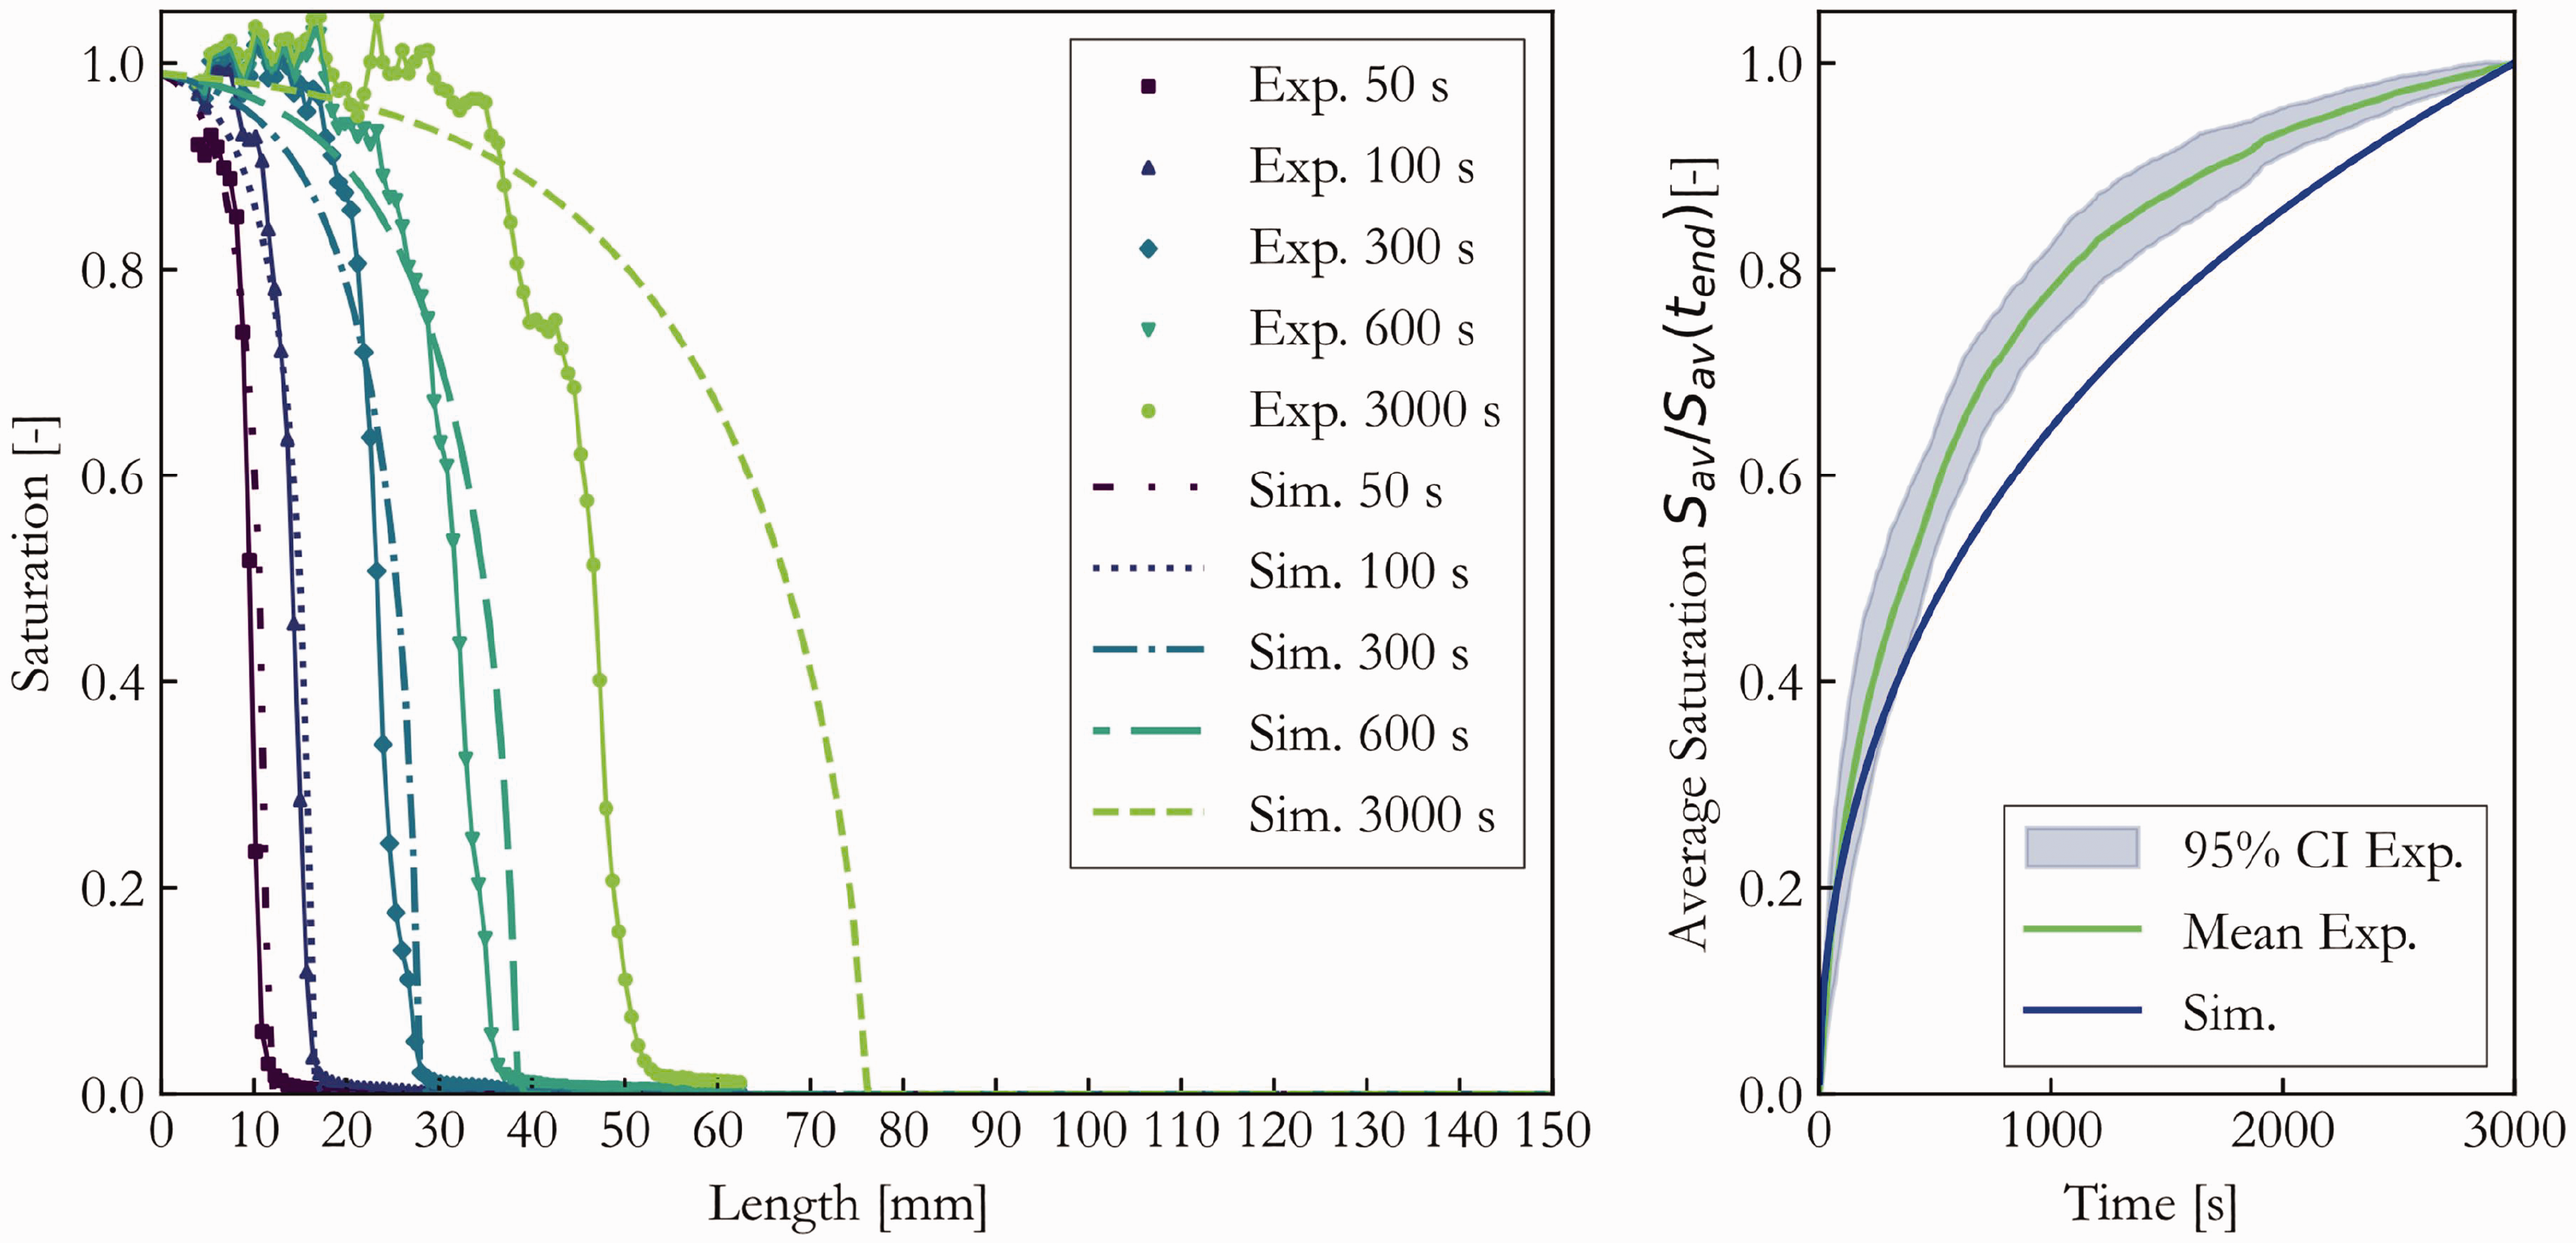
Figure 13 presents the experimental outcomes of spontaneous imbibition with PEG. Each plot presents a typical experiment. The graph illustrates the saturation distribution along the length of the sample and the scaled average saturation over time. In the initial stages of spontaneous imbibition across all experiments, a relative sharp front is evident. However, as the process progresses, the wicking gradually decelerates, and the front becomes more diffuse in the later stages. The findings suggest that while a smaller fiber radius leads to a slower wicking rate, it also results in a more constant behavior in the later stages, contributing to a higher wicking front and, consequently, a greater fluid adsorption capacity. The fundamental mechanisms at play are that reduced filament size results in diminished pore dimensions. These smaller pores elevate capillary pressure and enforce viscous resistance. Elevated capillary pressure enhances the fluid absorption capacity, whereas heightened viscous resistance attenuates the wicking dynamics.
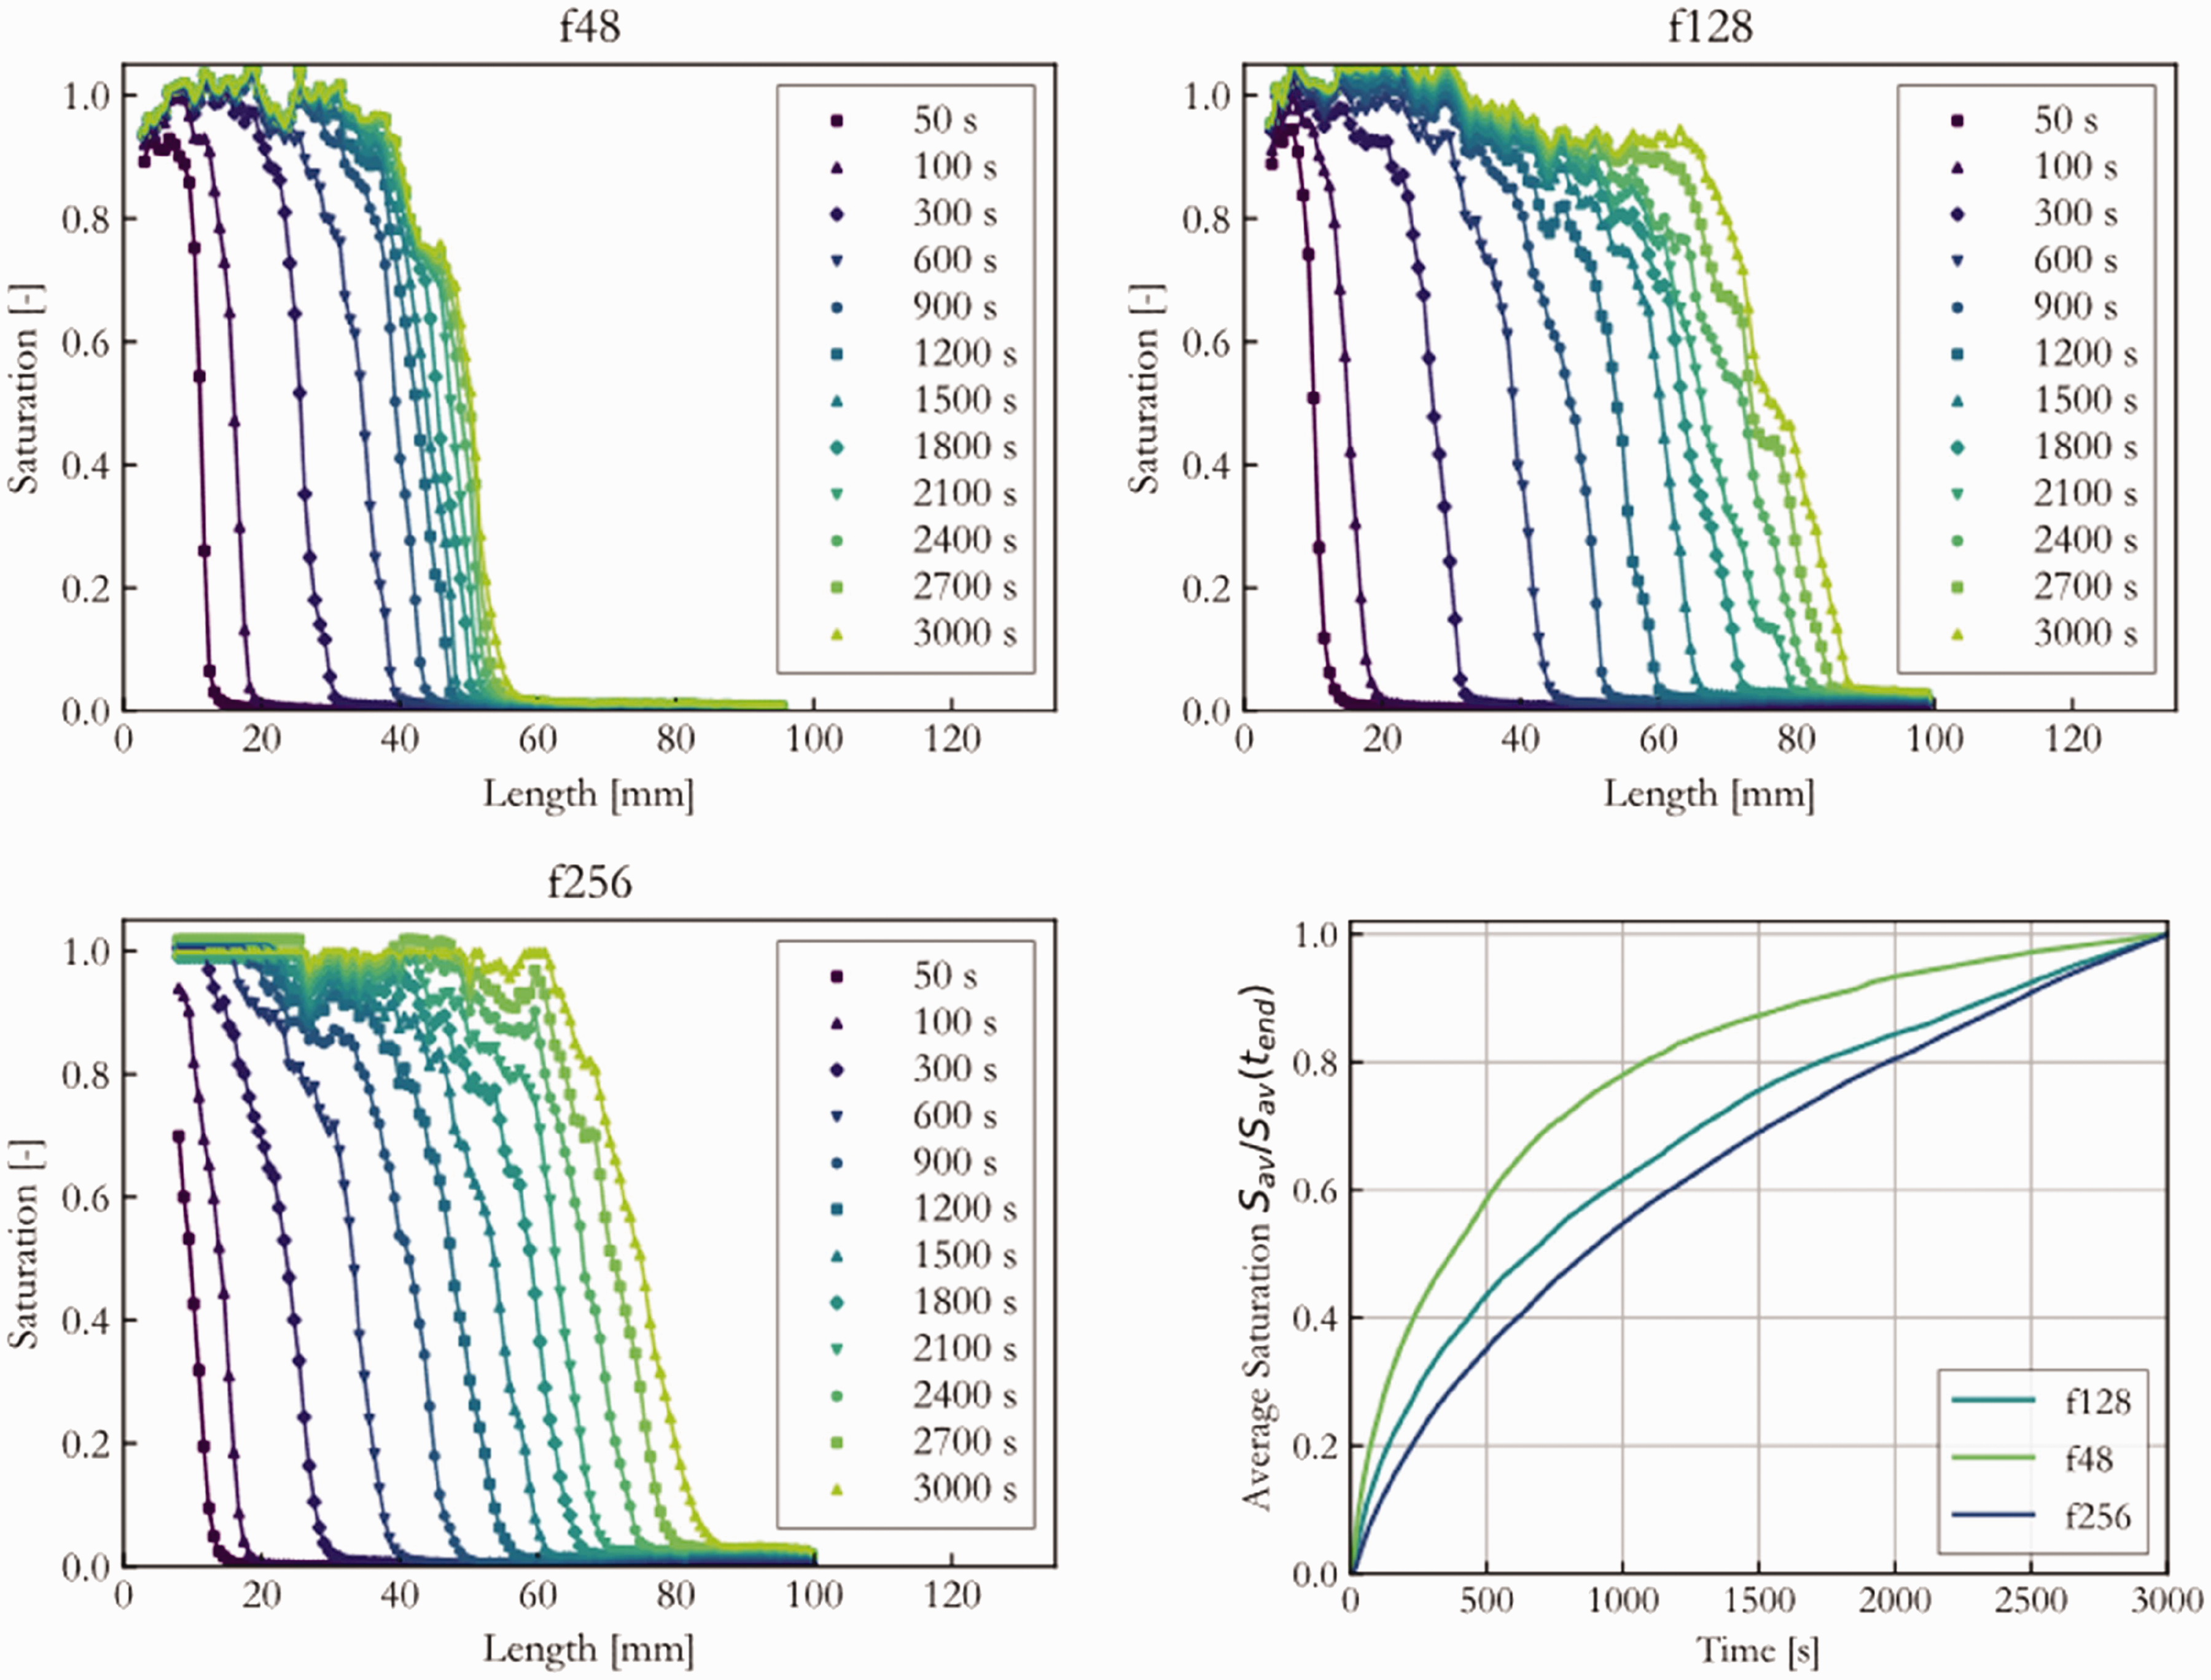
Experimental results of the spontaneous imbibition of polyethylene glycol (PEG) in f256, f128 and f48 fibrous media. Left: saturation distribution over the length in the porous media. Right: scaled average saturation over saturation.
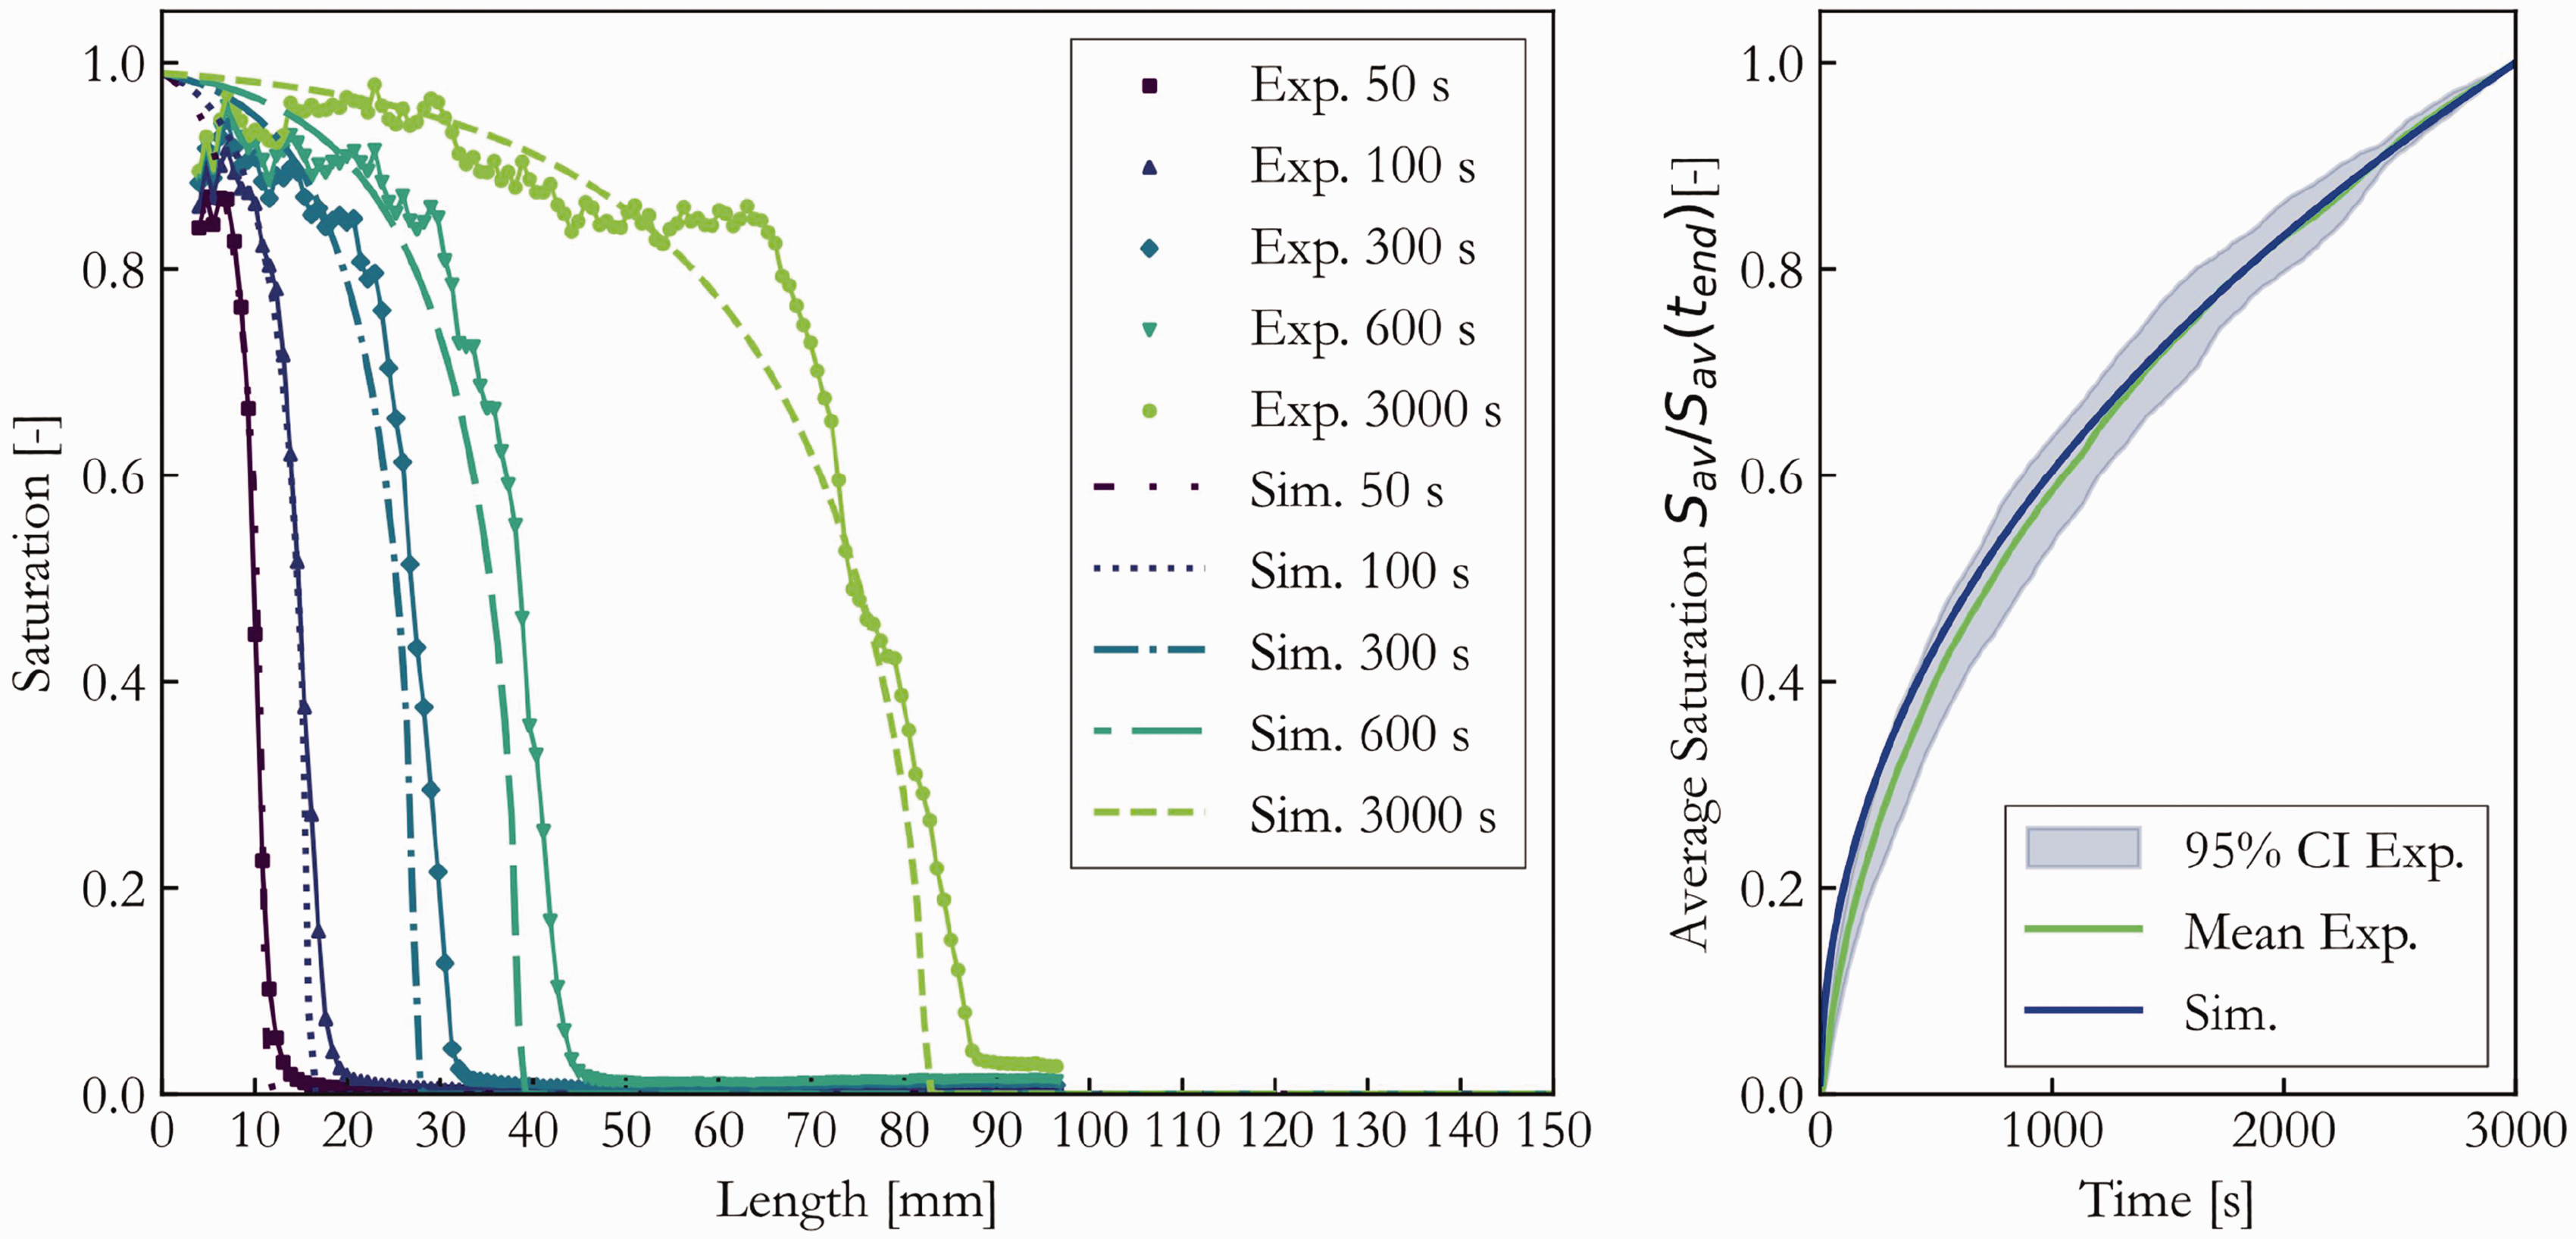
In Figure 14, the experimental results of spontaneous imbibition with EG are depicted. In contrast to the experiments with PEG, the imbibition of EG exhibits faster dynamics while maintaining similar characteristics, such as the presence of a relative sharp front at the beginning of the imbibition process. This can be attributed to the viscosity of EG, which is more than five times smaller than that of PEG. Since the surface tension and wetting contact angle of EG exhibit values similar to PEG (see Table 2), the wicking height and wicking front display comparable characteristics to the experiments involving PEG. Additionally, the results reveal a more diffuse saturation distribution at lower saturations in the later stages of spontaneous imbibition compared to the experiments with f256 and PEG.
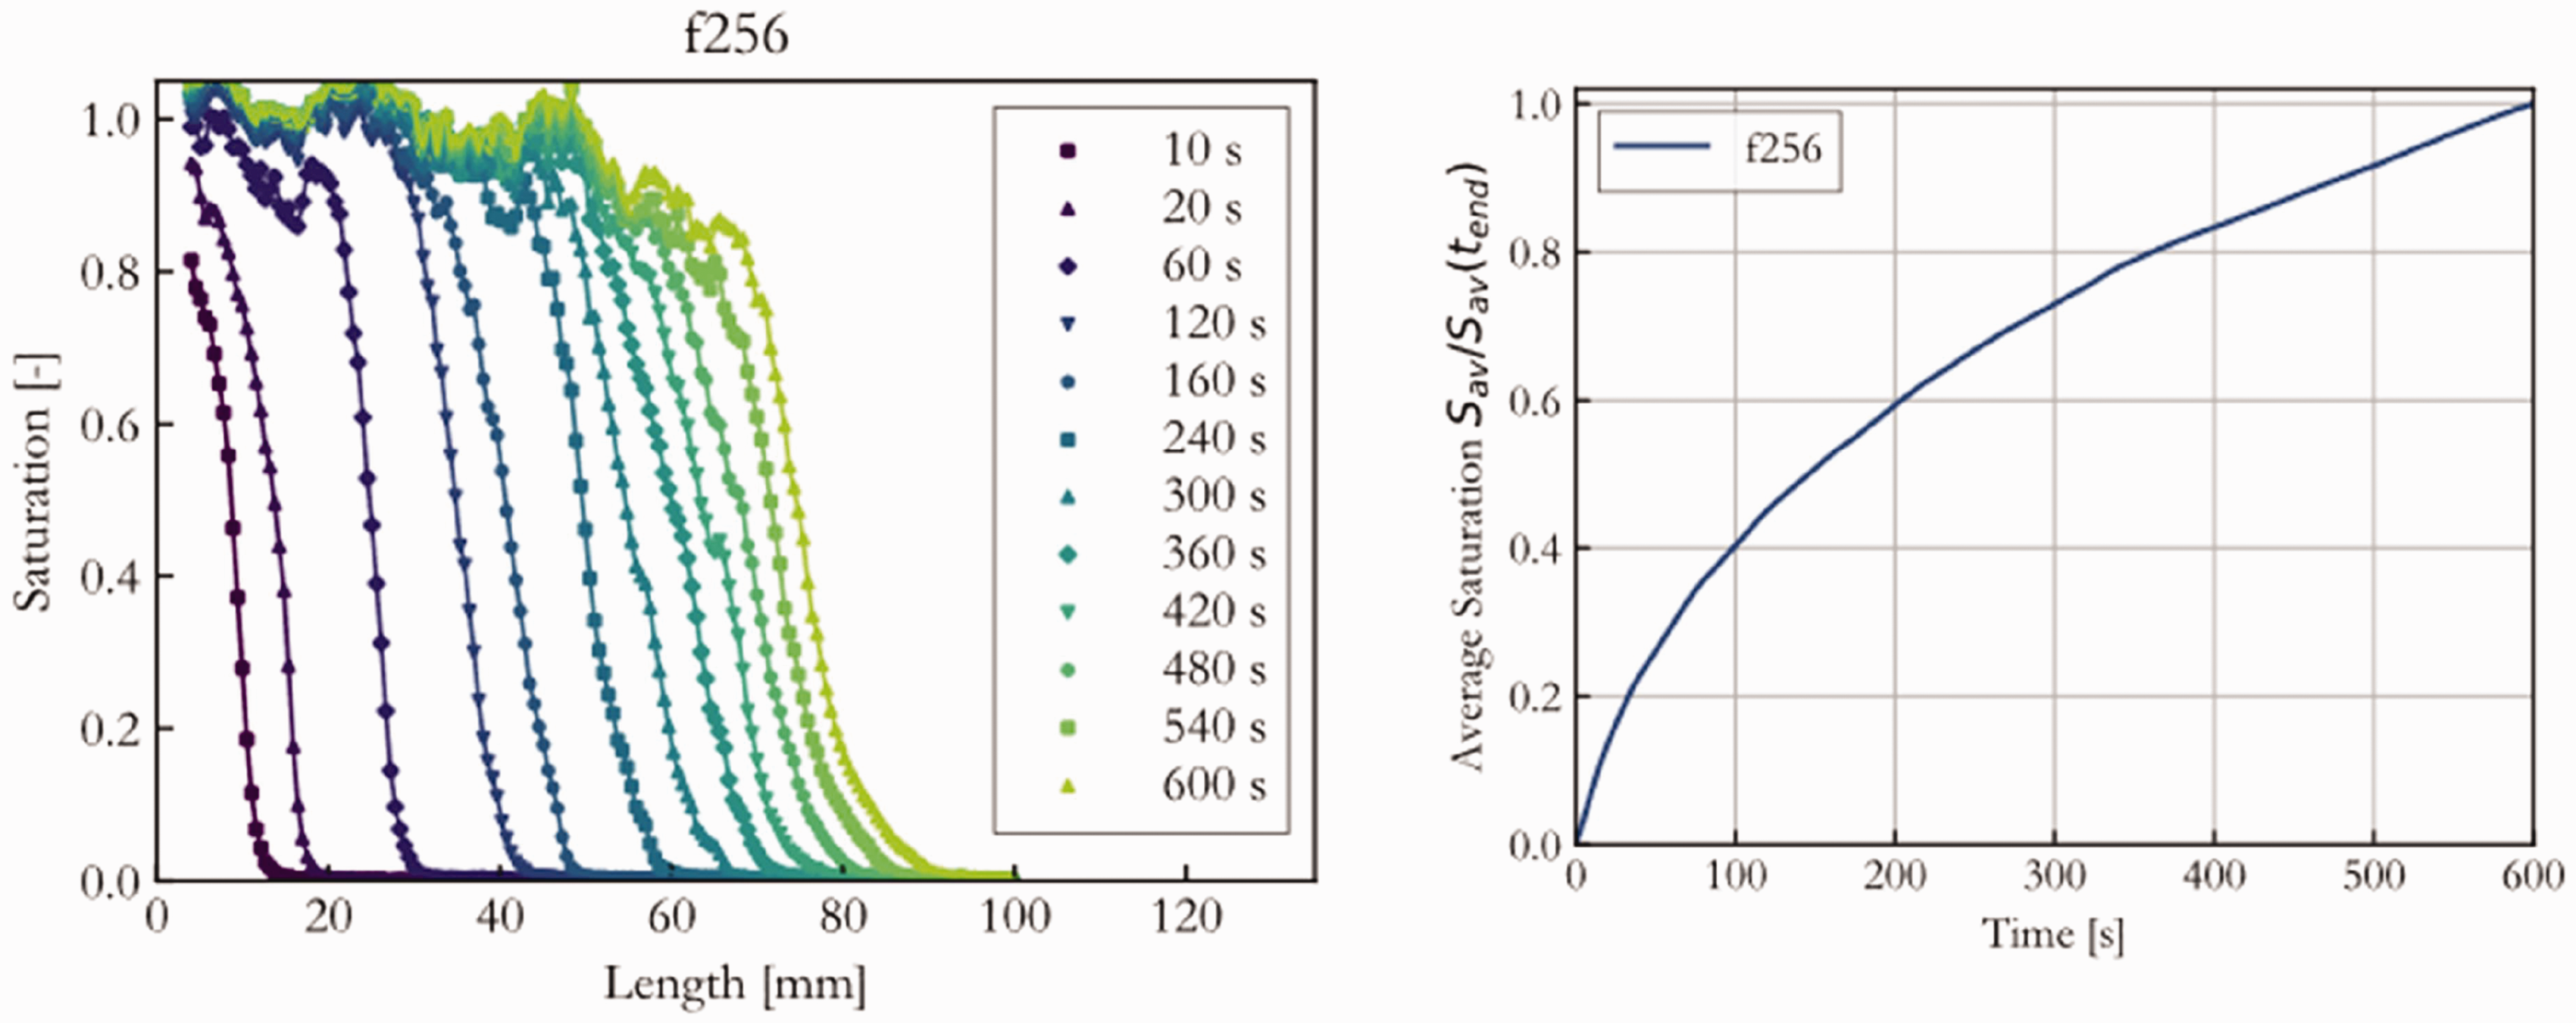
Experimental results of the spontaneous imbibition of ethylene glycol (EG) in f256 fibrous media. Left: saturation distribution over the length in the porous media. Right: scaled average saturation over saturation.
Determination of filament number inside the REV
Ensuring the establishment of a representative capillary pressure–saturation curve the size of the REV and therefore the number of filaments containing the REV must be determined. To determine this, 500 RVEs were generated, each with varying numbers of fibers (
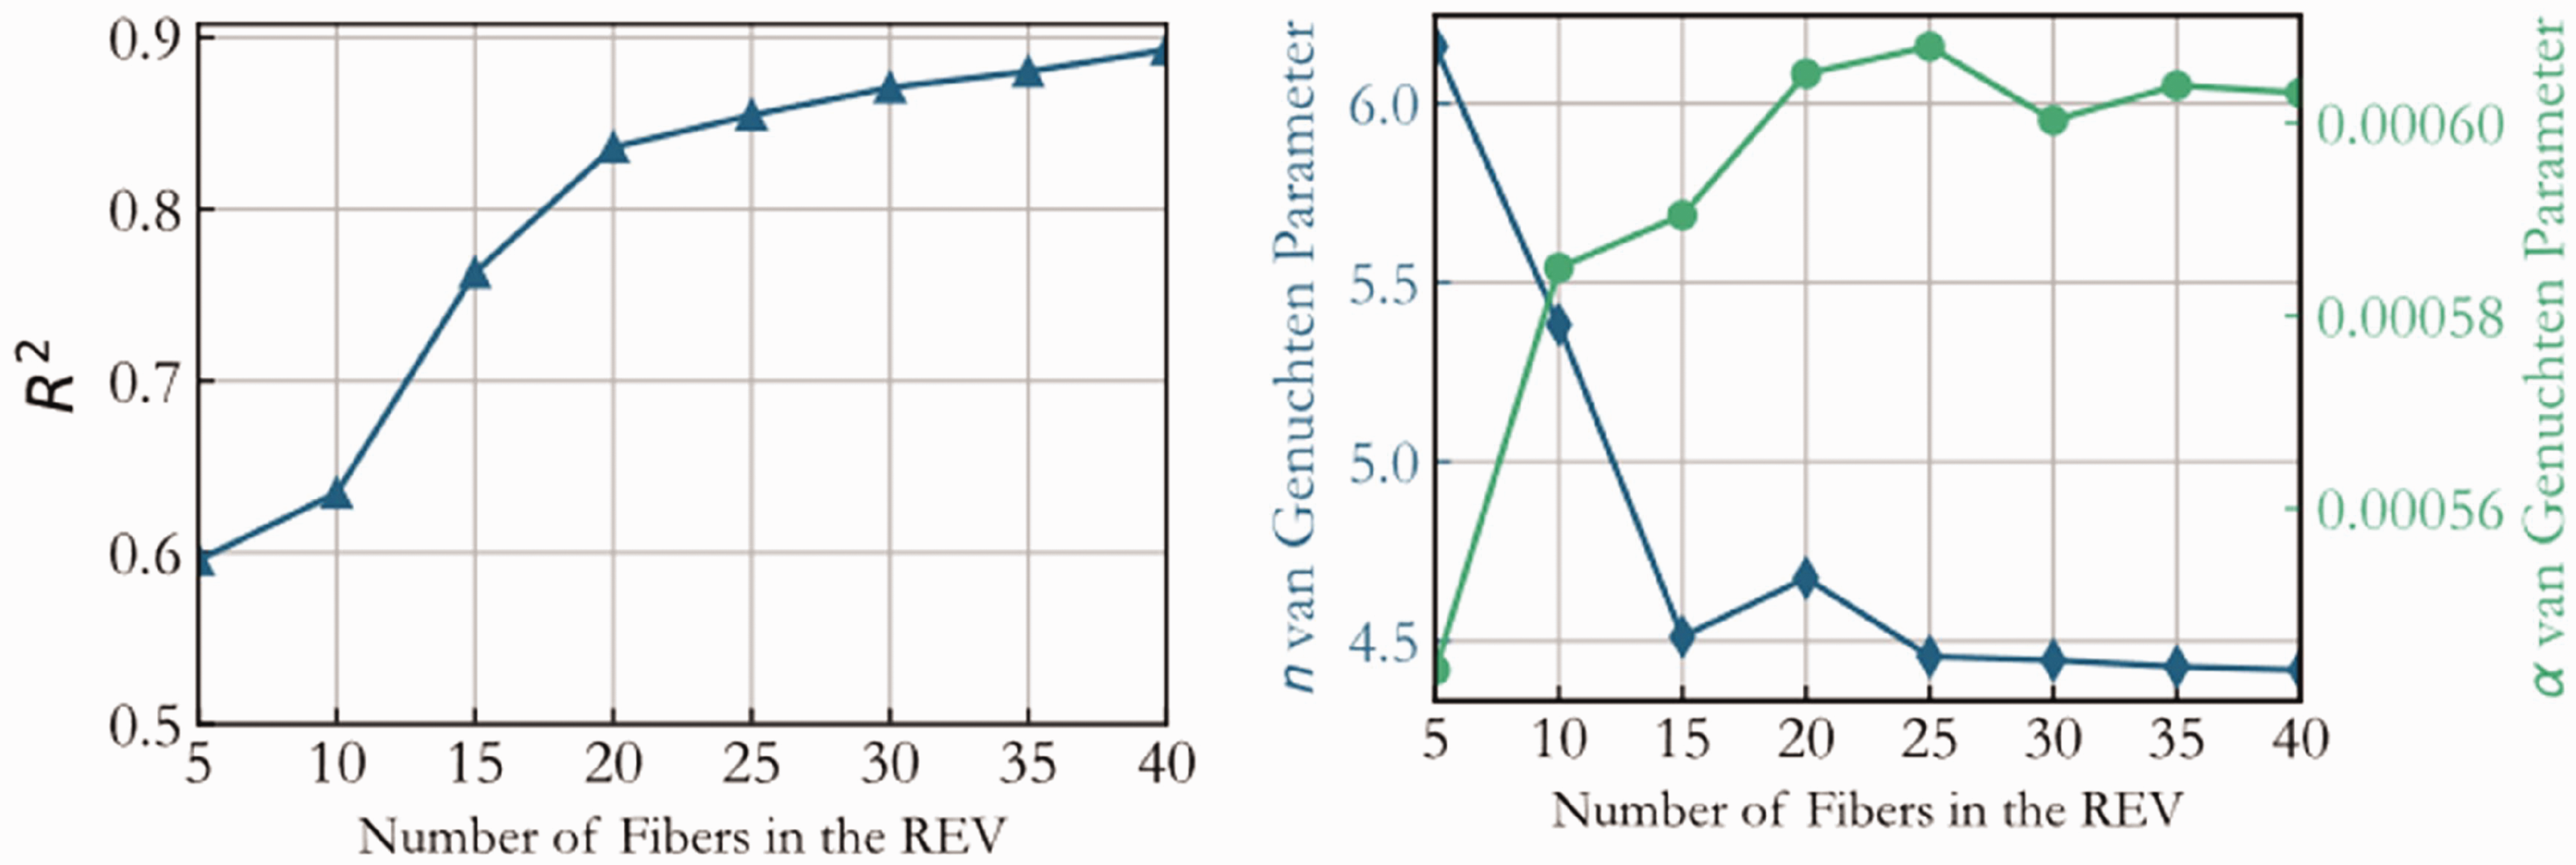
Left: R-squared value of the fitting of the Van Genuchten equation to data from representative volume elements (REVs) with different filament numbers. Right: Van Genuchten parameter for different filament numbers.
The results indicate that for smaller fiber numbers, the fit is relatively poor due to a considerable spread in the data. Moreover, there are noticeable jumps between data points at high saturations, reflecting the sparsity of data resulting from a smaller number of pores in an REV with fewer fibers. While generating more REVs could address this issue, the computational expense of pore-morphology simulation is higher than that of REV generation. Consequently, a larger number of filaments was employed to improve data density by keeping computational effort low.
The goodness of the fit significantly improves with 20 fibers, and the Van Genuchten parameters appear to converge. To ensure reliability, 25 filaments were eventually used in the analysis, providing a more robust representation of the capillary pressure–saturation relationship.
Capillary saturation curves
To determine the Van Genuchten parameters for the material under investigation in this study, 1000 REVs were generated for each material, incorporating the corresponding material characteristics such as porosity and filament diameter and the fluid characteristics such as contact angle and surface tension. With 25 filaments in each REV, capillary pressure saturation data was simulated using the pore-morphology method, and the Van Genuchten equation was subsequently fitted to the simulated data, following the procedures outlined in the ‘Experimental method’ section. The resulting parameters are presented in Table 4.
Fitted parameters to simulation capillary pressure–saturation data from pore-morphology method
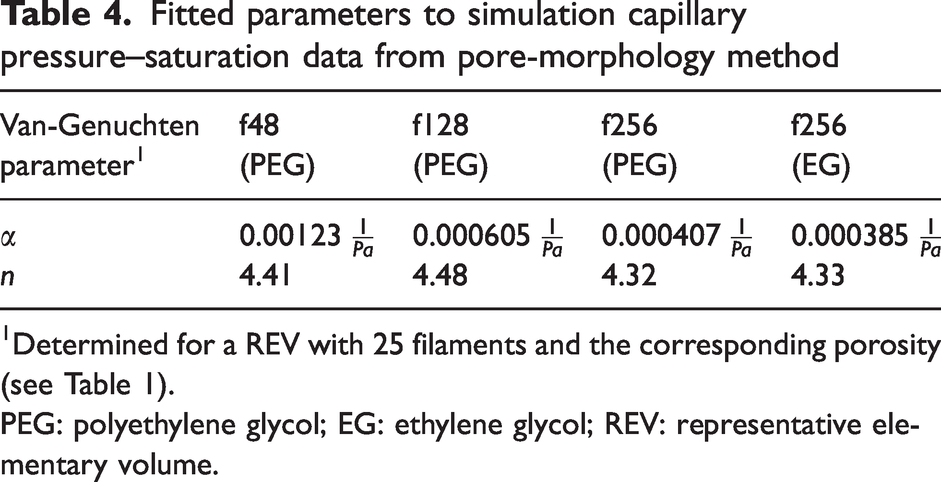
Determined for a REV with 25 filaments and the corresponding porosity (see Table 1).
PEG: polyethylene glycol; EG: ethylene glycol; REV: representative elementary volume.
The obtained parameters suggest that a smaller filament radius leads to a reduction in
Modeling of spontaneous imbibition
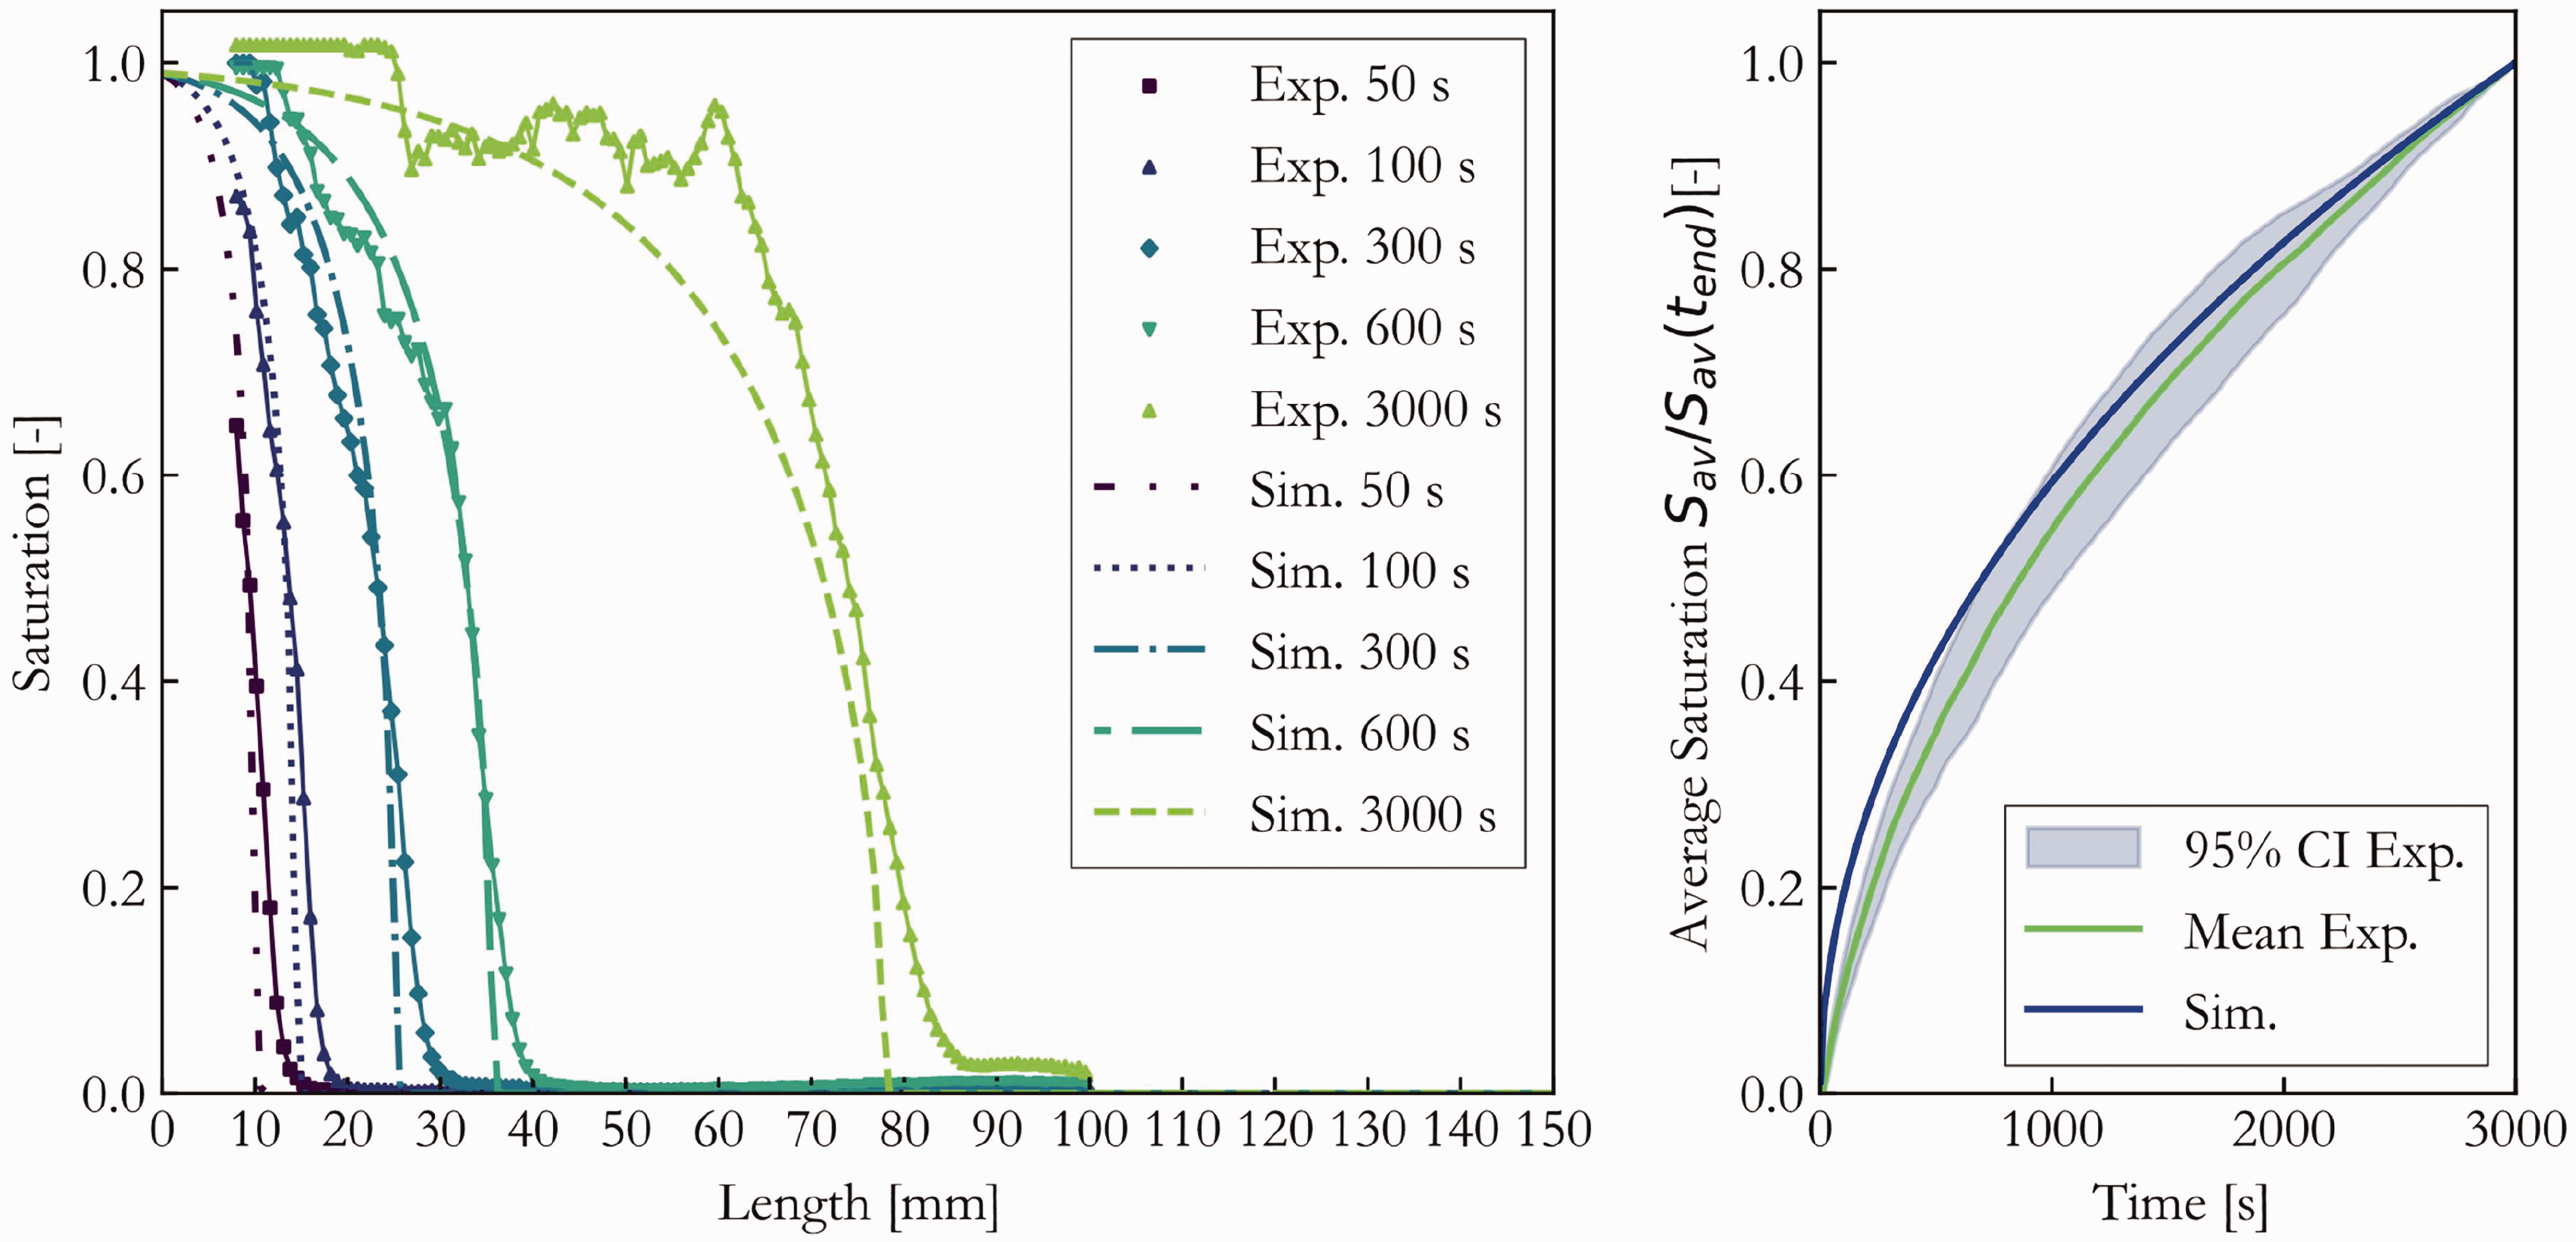
In this section the simulated spontaneous imbibition is compared with the experiments. Figure 16 shows the simulated spontaneous imbibition and the experiment of PEG in the f48 porous material.
Comparison of spontaneous imbibition of polyethylene glycol (PEG) in the f48 porous material.
The simulation reproduces in the beginning the steep imbibition front and the dynamics are very similar in the first timesteps. However, when the process proceeds the imbibition dynamics of the slowdown earlier than in the simulation, from the plot of the average saturation it becomes clear that the experiment is much closer to the equilibrium height than the simulation, since the gradient of the average saturation is much flatter than the one from the simulation. This discrepancy indicates that the simulation tends to overestimate the average capillary pressure, denoted as alpha in the Van Genuchten formula. One potential explanation for this overestimation lies in the cross-section of the filaments. During the texturing process, the filaments undergo slight heating and compression, resulting in a more hexagonal shape for the filament cross-section. From optical investigations this is more pronounced at the f48 material. Research by Masoodi
48
suggests that the cross-sectional to perimeter ratio is proportional to the average capillary radius in uniform porous materials. This observation may explain the underestimation of
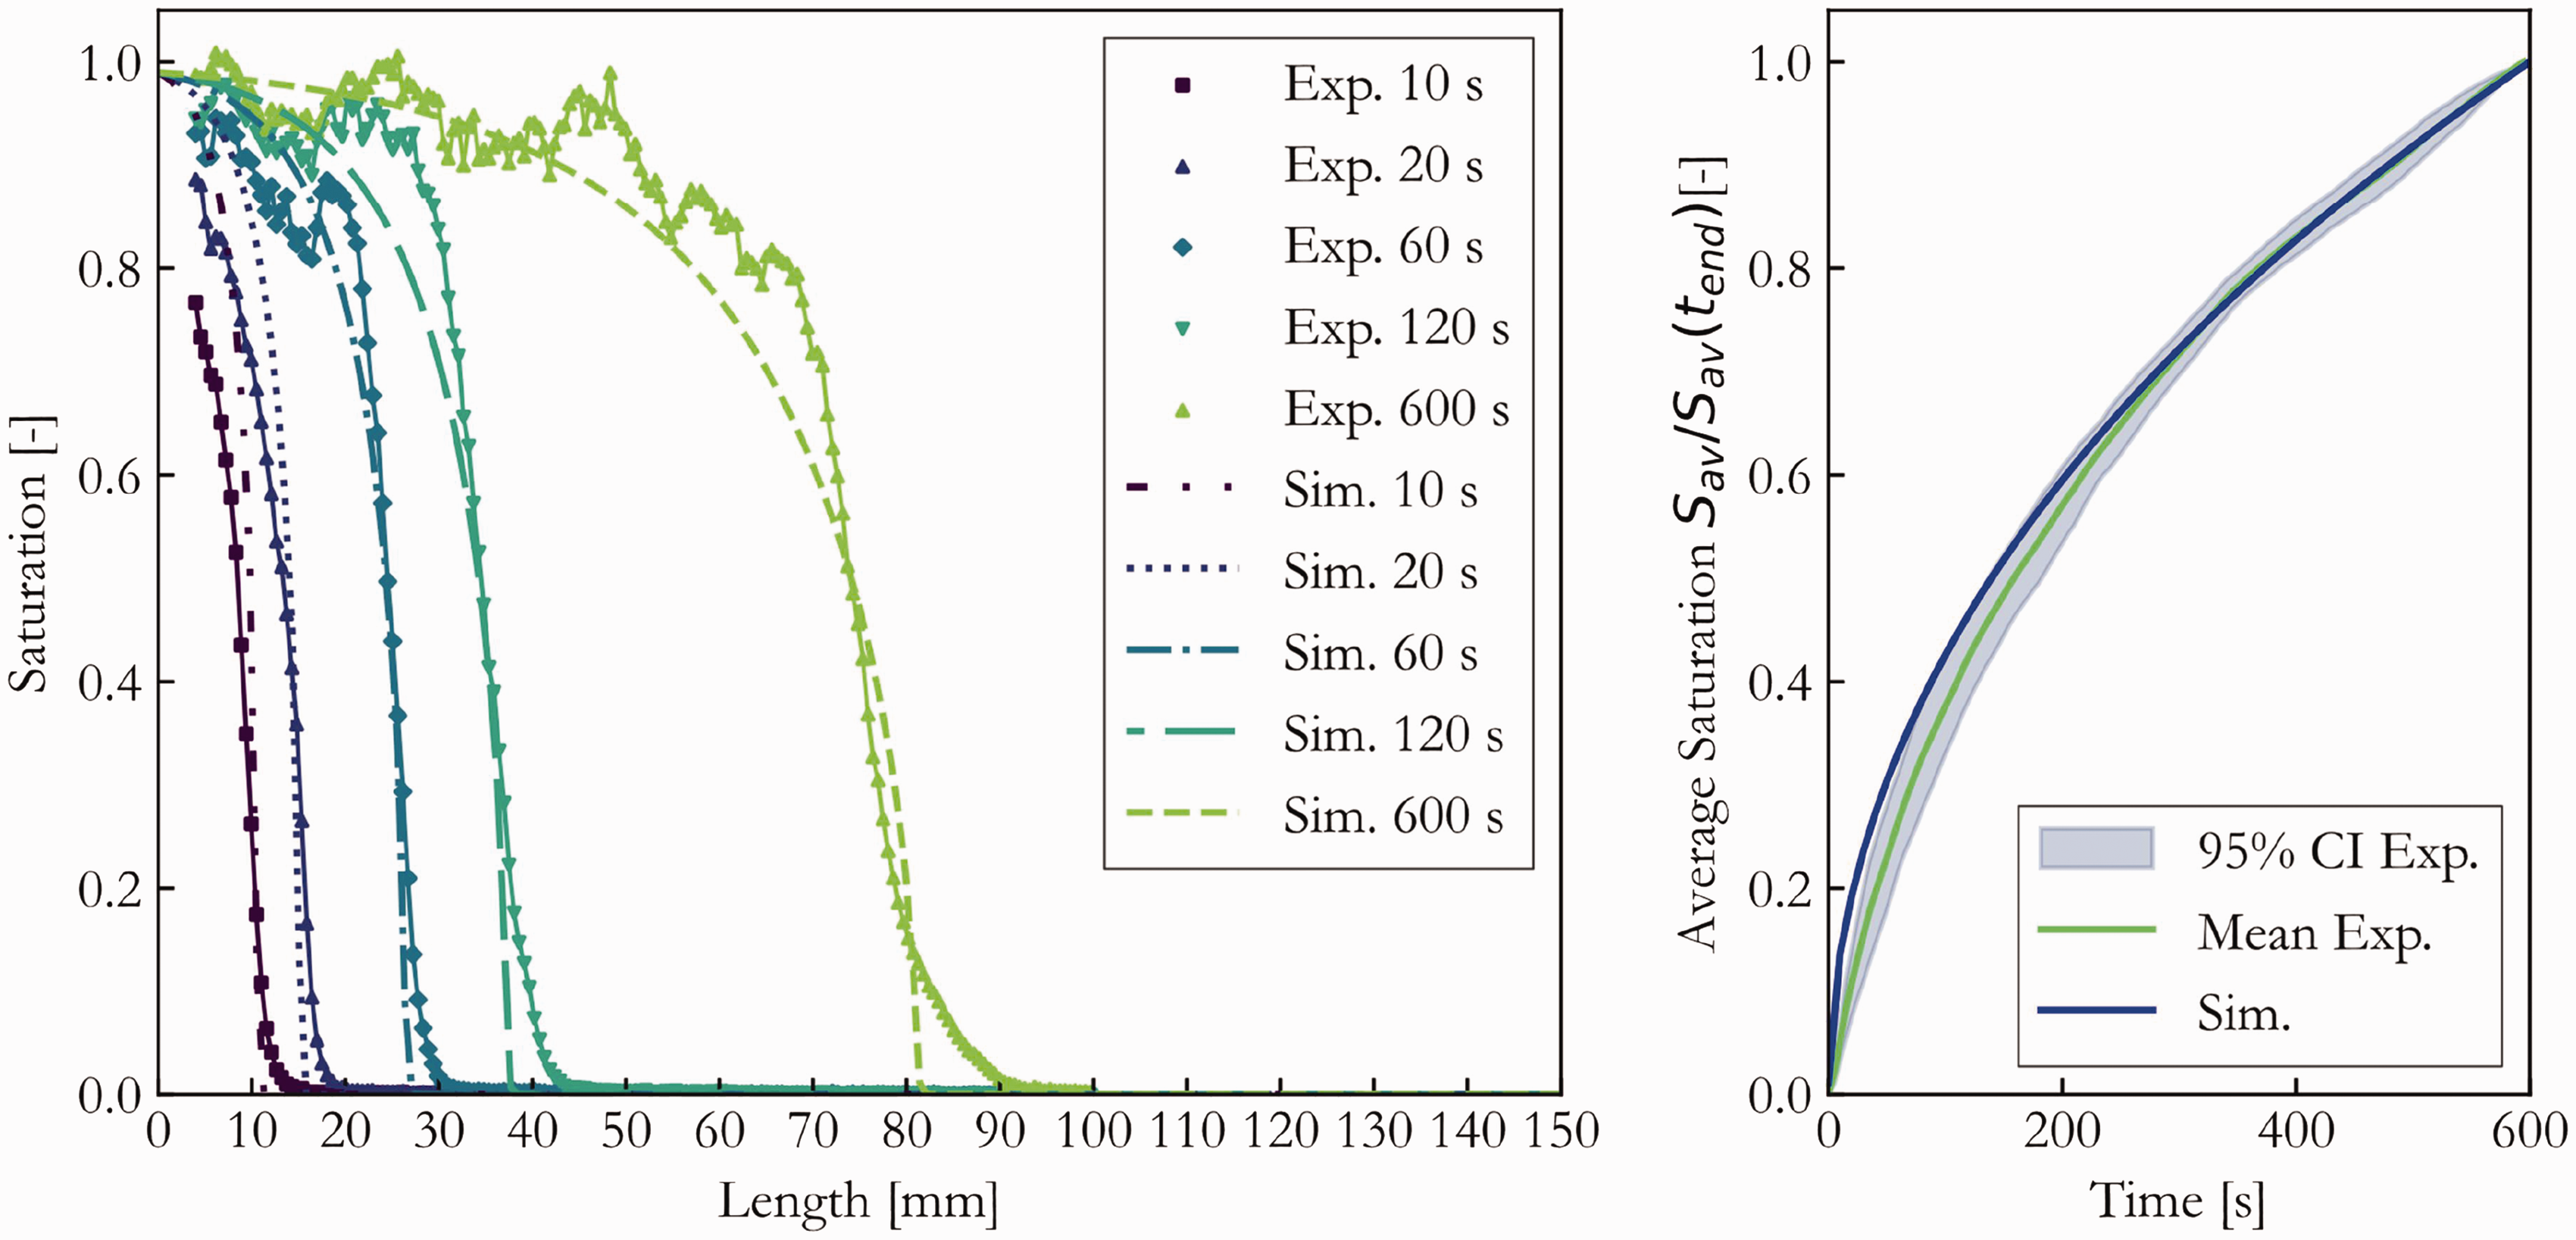
Figure 17 shows the simulated spontaneous imbibition and the experiment of PEG in the f128 porous material.
Comparison of spontaneous imbibition of polyethylene glycol (PEG) in the f128 porous material.
The model predicts the wicking dynamics remarkably well. The average saturation over time data indicates that in the first timesteps the model overestimates the dynamics slightly compared to the experiment. The model does not account for a dynamic contact angle. Particular in the first moments of the process, the velocity of the imbibing fluid is the highest resulting in a decrease of the contact angle due to the dynamics. 40
In Figure 18 and Figure 19, a comparison is drawn between experiments and simulations for the f256 material using PEG and EG as imbibing fluids.
Comparison of spontaneous imbibition of polyethylene glycol (PEG) in the f256 porous material.
Comparison of spontaneous imbibition of ethylene glycol (EG) in the f256 porous material.
Similar to the f128 material, the model demonstrates predictive capabilities for the imbibition process. The initially steep imbibition front becomes more diffuse in later stages.
However, an interesting disparity emerges as the experiment exhibits a more diffusive front, especially at lower saturations, and this distinction becomes more pronounced in later stages. Unfortunately, the model fails to capture this specific behavior. Moreover, both datasets exhibit an overestimation of dynamics in the first stages of the process, a point previously noted for the f128 material. Notably, even though EG has a viscosity more than five times lower than PEG, resulting in dynamics over five times faster, this effect is not significantly more pronounced than in experiments with PEG as the imbibing fluid. Remarkably, the saturation front in the f256 material reaches almost the same height as that observed for the f128 material. Upon comparing average saturation over time data, it becomes evident that imbibition in the f256 material is more consistent than in f128 or f48 materials. While the fluid dynamics in f128 are faster initially, they slow down earlier due to the lower capillary pressure.
In general, the model reasonably predicts spontaneous imbibition, capturing core features such as the diffusive front’s shape and dynamics. Even minor saturations and hence subtle contrast changes in the images may not be detected by the experimental setup, due to limitation in the camera technology. Additionally, the experiment is not entirely isothermal. Although the LED surface light used does not emit much heat, the material sample may gradually heat up over time, leading to a slight change in viscosity over time.
The investigations further reveal that smaller filament diameters influence spontaneous imbibition in two ways. The smaller filament size results in smaller pores, leading to a higher average capillary pressure. However, the smaller pores also increase viscous resistance, causing slower imbibition dynamics compared to a larger filament radius.
These findings indicate that in applications like wound care or sportswear, where rapid absorption of sweat or wound fluids within seconds is crucial to keep the skin or wound dry, larger filament diameters appear beneficial due to reduced viscous resistance.In contrast, in scenarios like textiles used in passive plant-watering systems in agriculture, where a consistent supply over minutes is sufficient for effective irrigation, smaller filaments are more appropriate due to their higher absorption capacity.
This finding is crucial in developing technical applications where spontaneous imbibition is a key feature, such as capillary-fed cooling devices or textiles.
Conclusion
In this study, we have investigated the spatial and temporal evolution of wetting saturation during spontaneous imbibition through anisotropic porous fibrous media, using a combination of experimental and numerical approaches. Our optical experiments revealed a diffusive wetting front in the porous media, which gradually expanded and decelerated during the imbibition process. Numerical studies, utilizing the Richards equation, demonstrated its effectiveness in predicting the transition phenomenon of wetting saturation.
Evaluation of our models involved analyzing spatio-temporal variations and averaged saturation from experimental results. In particular, the Richards equation demonstrated its ability to predict the wetting saturation transition. However, an important observation emerged – our numerical model tended to over-predict the dynamics in the initial stages of the imbibition process. This discrepancy can be attributed to the model neglecting the dynamic capillary effect.
It is important to note that our numerical model was only parameterized with the porosity and filament diameter of the porous media, together with material parameters from the imbibing fluid. The crucial capillary saturation curve for parameterizing the Richards equation was simulated using the pore-morphology method.
Despite this initial over-prediction, which was particularly noticeable in materials with the largest filament diameter, the model performed reasonably well in accurately capturing the overall imbibition process. This study not only provides insight into spontaneous imbibition, but also lays the groundwork for modeling applications in engineering contexts. Importantly, our results highlight the significant influence of filament size on the dynamics and front height of wetting saturation during spontaneous imbibition.
Supporting information
Comparison of (1) and (2) for computing the saturation of equation (1) and equation (2).
In Figure 20 a comparison of the different approaches to compute the saturation based on the gray value is given.
Comparison of the different scaling approaches for computing the saturation based on the average gray value for f256 ethylene glycol (EG). Left: linear scaling. Right: logarithmic scaling.
The difference between the resulting saturation curves is barely visible: only at high and low saturations a difference can be observed.
Capillary pressure–saturation curves
Figure 21, Figure 22 and Figure 23 depict the capillary saturation data obtained through pore-morphology simulations, crucial for parameterizing the Richards model and subsequently predicting spontaneous imbibition.
Capillary pressure–saturation curve of f48 with polyethylene glycol (PEG) as imbibing fluid.
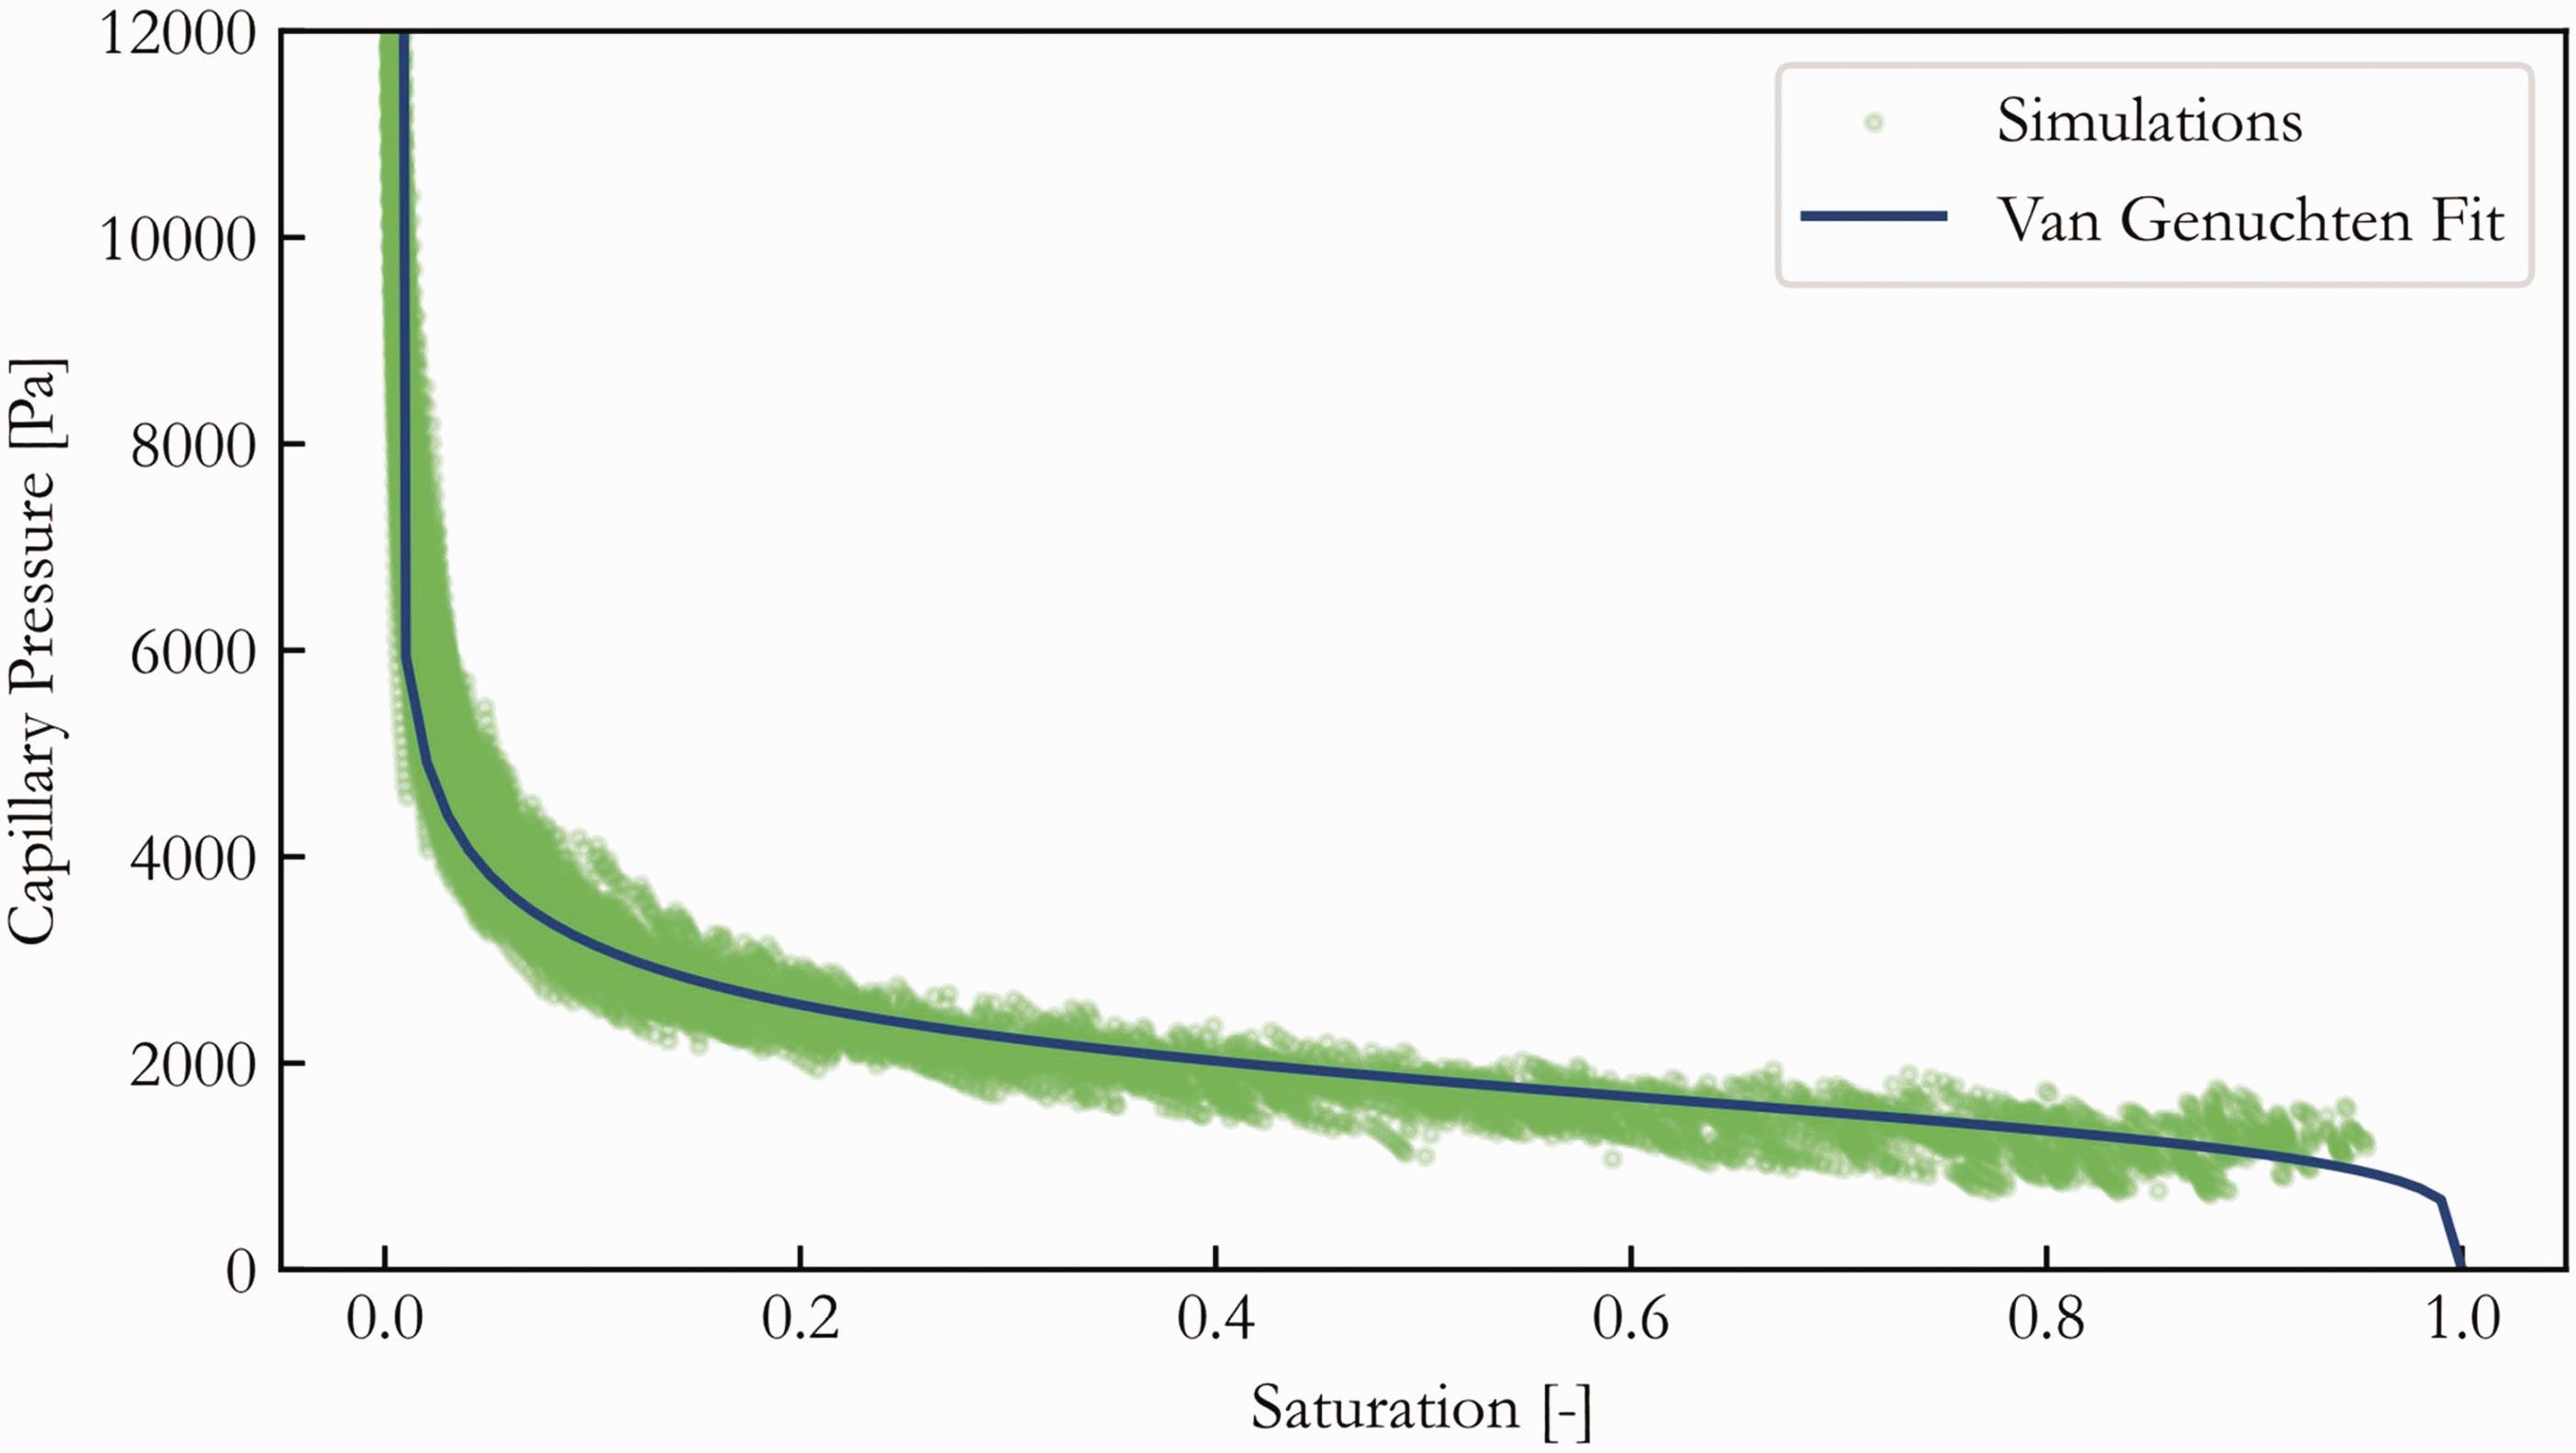
Capillary pressure–saturation curve f128 and polyethylene glycol (PEG) as imbibing fluid.
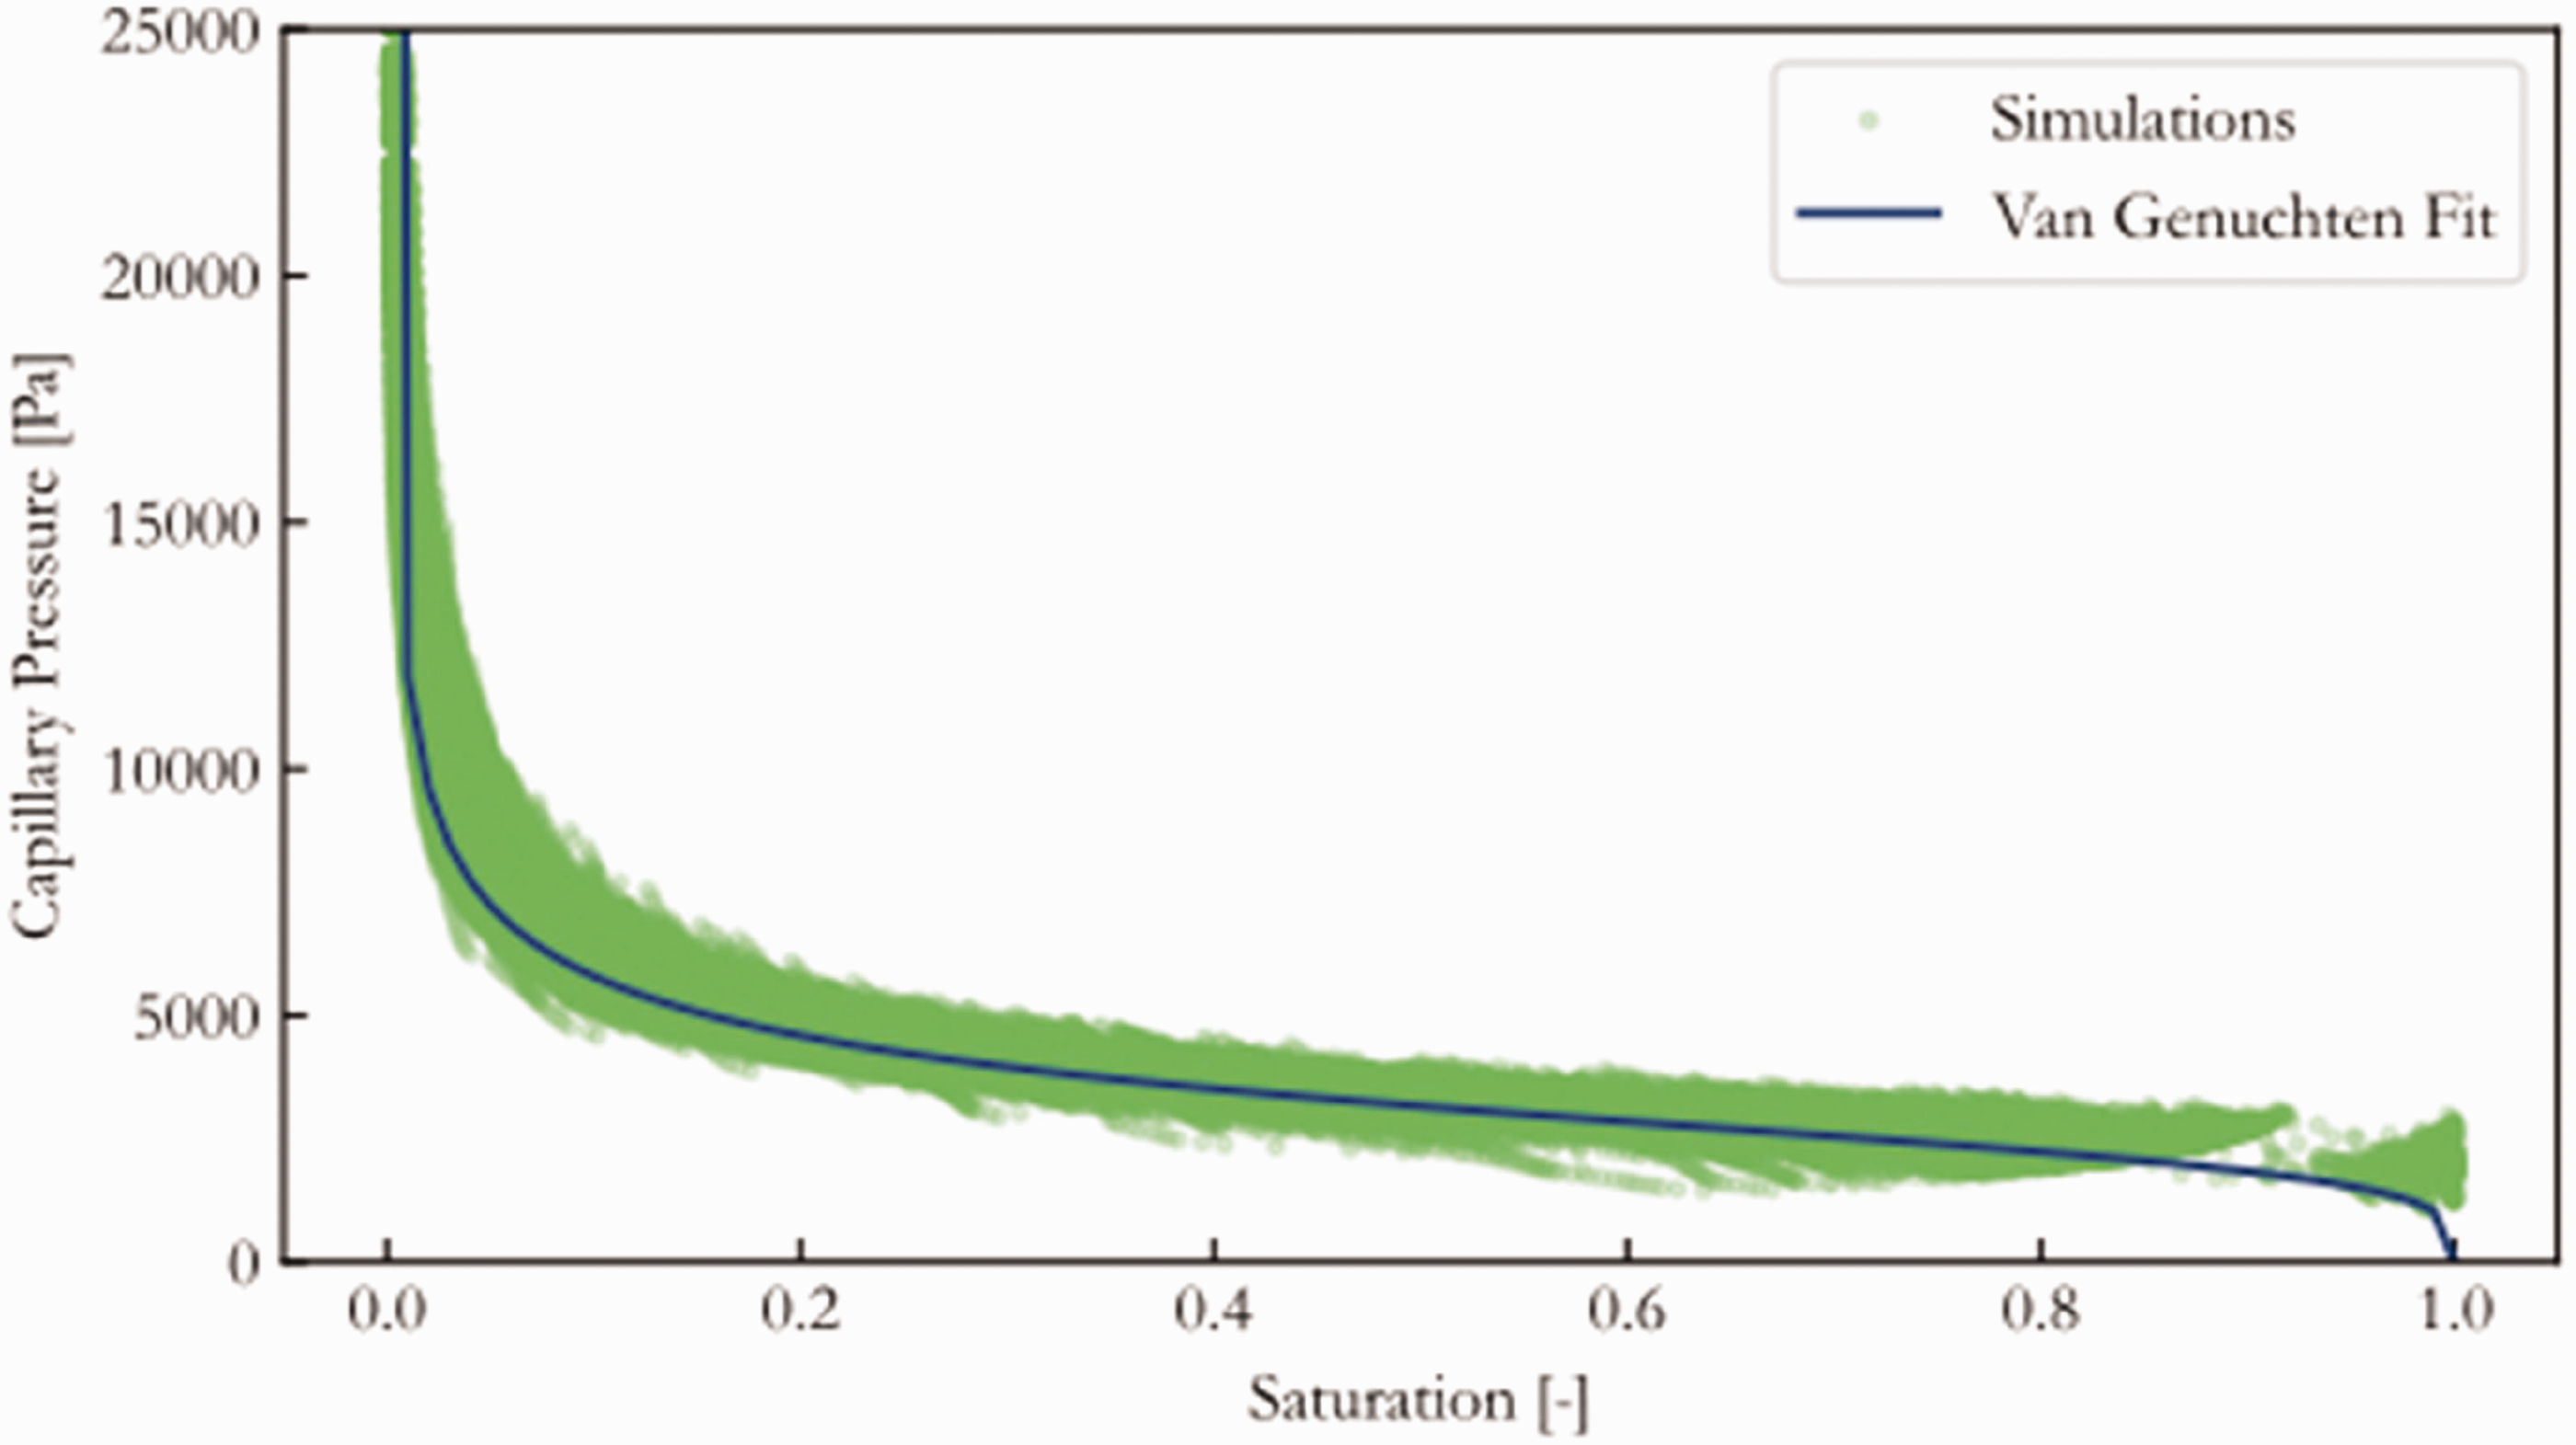
Capillary pressure–saturation curve of f256 with ethylene glycol (EG) as imbibing fluid.
Grid study
In Figure 24 simulations of the spontaneous imbibition of PEG in f128 for four different grid sizes are shown.
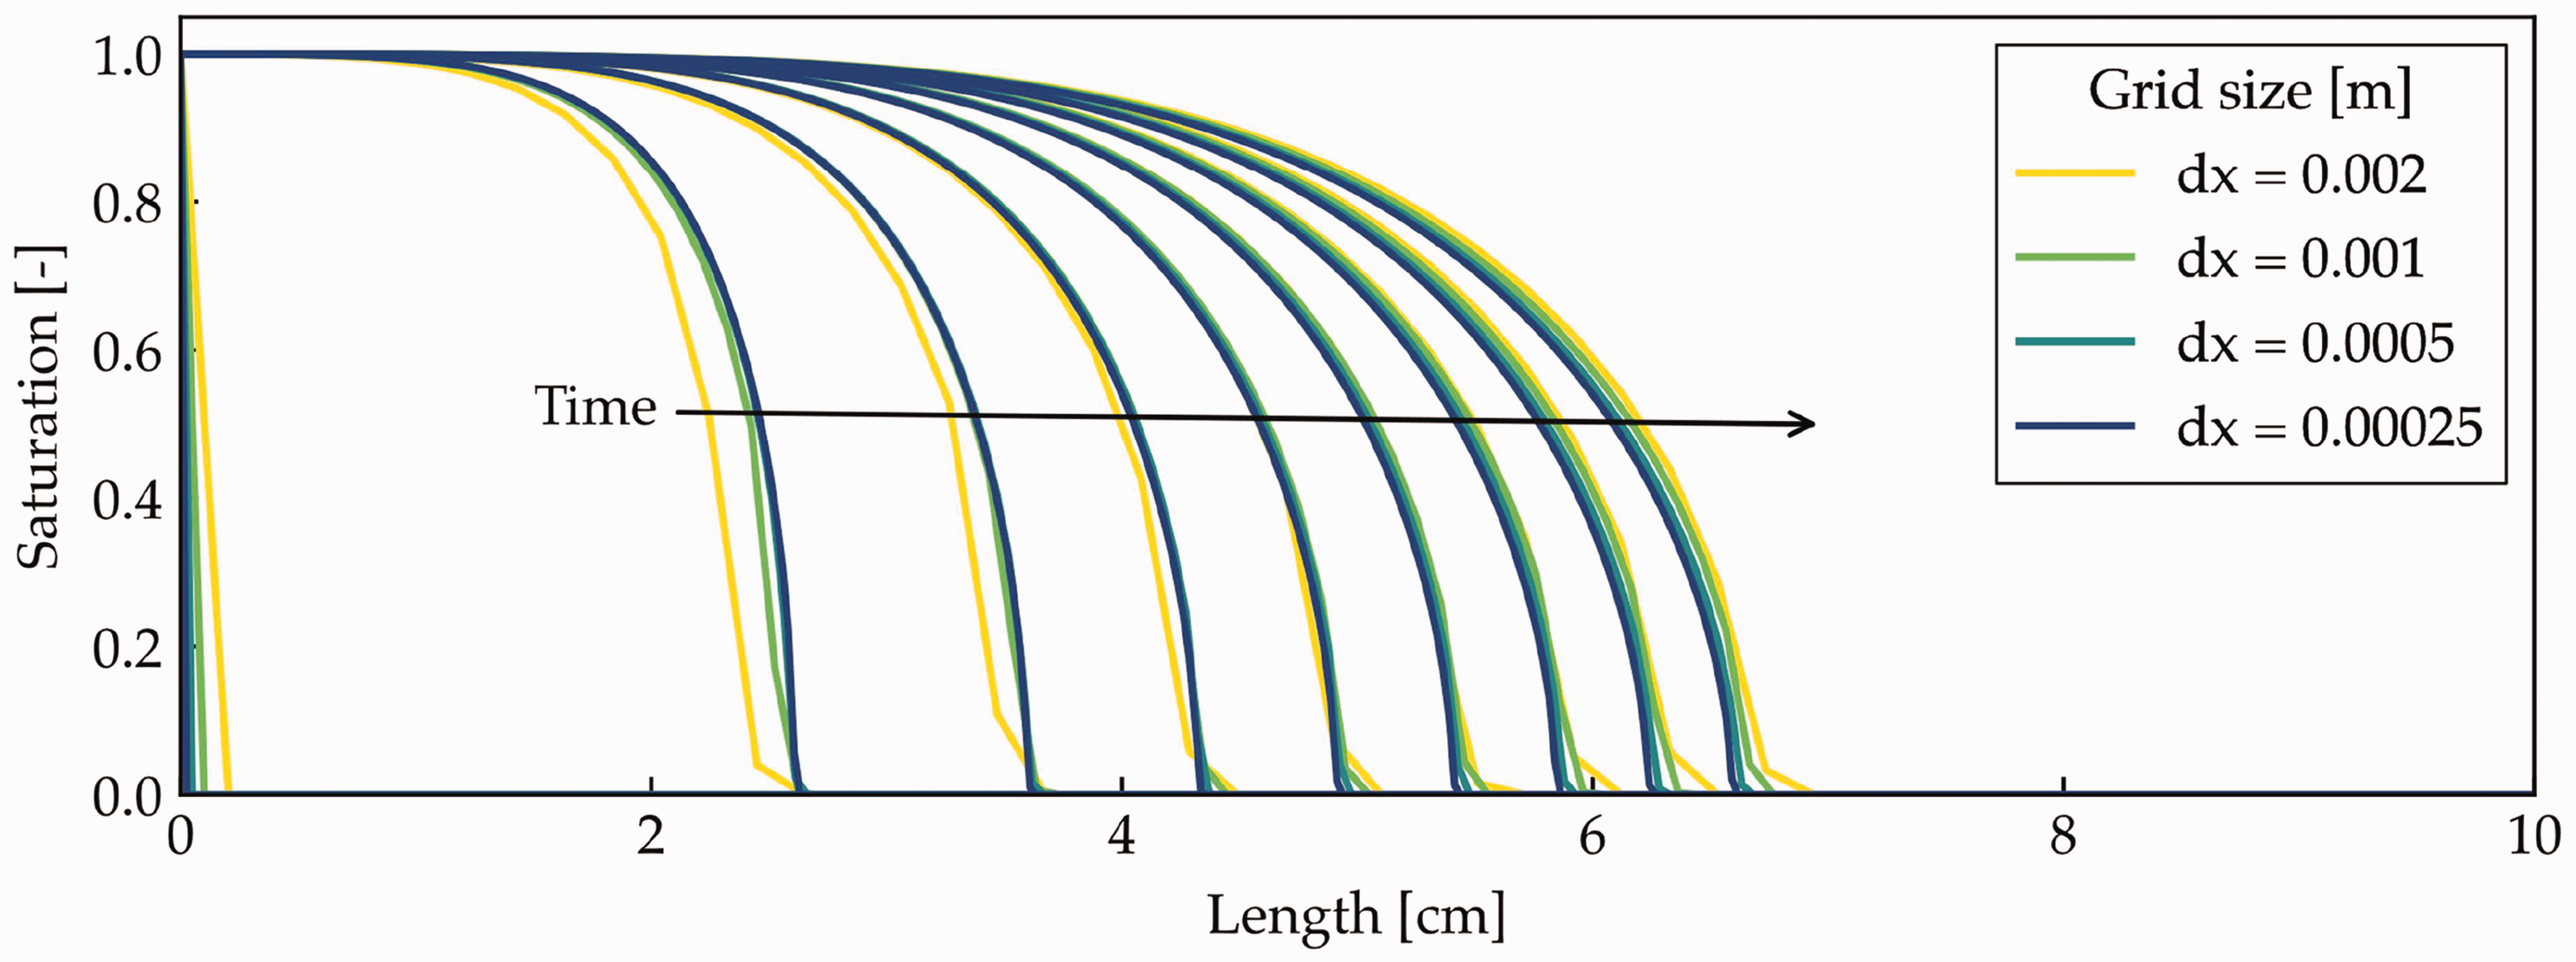
Grid study on a spontaneous imbibition simulation for the f128 yarn material with polyethylene glycol (PEG) as imbibing fluid.
The data show that this simulation is grid independent for a grid size for
Footnotes
Acknowledgment
The authors gratefully acknowledge the funding of the German Research Council (DFG) – Project Number 453311482.
Data availability
The datasets generated during and/or analyzed during the current study are available from the corresponding author on reasonable request.
Declaration of conflicting interests
The author(s) declared no potential conflicts of interest with respect to the research, authorship, and/or publication of this article.
Funding
The author(s) disclosed receipt of the following financial support for the research, authorship, and/or publication of this article: This work was supported by the German Research Council (DFG) – Project Number 453311482.