
Abstract
The paper introduces a principle of iso-quantities for investigating the distribution of a number of fibers in a two-ply yarn cross-section in a regular grid. The main aim is to map the two-ply yarn inner structure and changes of this structure to various ply twists. So far, modifications of two-ply yarn in different ply twists have been explained only indirectly from a macroscopic point of view by observation of the process of two-ply yarn retraction. This paper applies cross-sections and the method of iso-quantities to find the causes of these macroscopic changes. The ratio of the twist coefficients of the twisted and single yarns αs/αj was used to indicate the internal changes of the two-ply yarn. Using the iso-quantities method and the x–y difference curves of the fiber distribution in the two perpendicular directions of the cross-section, it was shown that counter-plying causes a change in the fiber distribution in the cross-section, resulting in the occurrence of negative values of the retraction, insignificant changes in the external geometry of the two-ply yarn, and a constant breaking strain behavior. These manifestations appear only up to the values of the ratio αs/αj of 1.2 or less. After this limit, the extreme value of the x–y difference settles down, the retraction begins to take on positive values, and the breaking strain of the two-ply yarn begins to increase as the two-ply yarn twist increases.
Information about the inner structure of textile formation and the distribution of fibers in the yarn is always interesting and important, but also difficult to acquire. Usually, the process begins with the execution of the textile cross-sections, continues with the acquisition of cross-sections’ microscopic images, and ends with the finalization of image analysis. The same approach can be found in many research works. They differ in the philosophy of image analysis, and the hypothesis about the fiber assembly in the cross-section.
The first suggestion was proposed by Schwarz 1 and further extended by Balakrishna and Phatarford. 2 They assumed that fibers are arranged in a perfectly hexagonal configuration. Other perceptions3 –5 suggested that fibers are assembled in the regular annulus of a defined radius. Grishanov et al. 6 proposed, on the other hand, a concept of ‘virtual locations’. This method is based on a combination of circular and hexagonal distribution of fibers.
Neckar et al. 7 suggested radial packing density as a ratio of the whole area of the fibers’ cross-section to the total area of the annulus with these fibers. The packing density determines the distribution of fibers in each annulus by some means. Driscoll and Postle 8 extended this approach. They defined fibers’ assembly as the ratio of fiber volume to the yarn volume, and took into account also the obliquity of fibers. Morris et al. 9 described a geometrical model of possible fibers’ locations. The authors counted with some randomness caused by the technological process and properties of fibers.
All described methods apply to free yarn, that is, when the yarn is nondeformed. Yarn deformation is usually present in final fabrics or ply yarns. The yarn cross-section then changes its shape due to the fibers’ movement. Previous theories about fibers’ assembly obviously cannot be used. Turan et al. 10 replaced the deformed yarn cross-section with an ellipse. Then, they counted the ratio between areas as in previously mentioned works. The simulation of the deformed shape of a two-ply yarn cross-section is dealt with in Grishanov et al. 11 and Sriprateep and Singto. 12 The calculation of the packing density of the whole two-ply yarn as a complex without dividing it into sectors is addressed in Kilic et al., 13 in which the authors cropped acquired images of two-ply yarn cross-sections in a rectangular shape that covers all fibers, and yarn areas were defined as an elliptical shape that fits in the cropped image.
The connection between the internal structure of the two-ply ring and compact yarns and mechanical properties is discussed in Ishtiaque et al. 14 The authors calculated the packing density from the structural parameters of the yarn and fibers. After plying, they found greater packing density of the two-ply yarns. Through the tracer fiber method, they found that counter-plying causes parallelization of fibers in single yarns, resulting in increased strength and decreased breaking strain due to plying.
Neckar and colleagues15,16 proposed using the principle of iso-densities to observe the distribution of packing density in the cross-section of yarn in the woven fabric. Generally, the iso-lines are, according to the Cambridge Dictionary, 17 the lines connecting points in the map with the same quantitative values. The iso-densities connect places with the same packing density in the yarn cross-section. The suggested method of iso-densities is based on the calculation of packing density in each box of a grid placed in the yarn cross-section.
Drasarova 18 used the idea of iso-lines, but took into account only the number of centers of fibers’ facets in the yarn in each field of the grid. The output is then information about the distribution of a number of fibers in the yarn cross-section, so-called iso-quantities. The author investigated the yarn cross-section in the woven fabric.
The presented contribution results from the last idea about iso-quantities. This method will help to understand changes in the two-ply yarn inner structure in different ply yarn twists. At the same time, possible changes in the external dimension and in the breaking strain of the two-ply yarn, which probably result from changes in the internal structure, will be presented. Last but not least, the limit of the ratio of the twist coefficients of two-ply and single yarns will be determined using the method of iso-quantities, and the x–y differences of the distribution of fibers in two perpendicular directions of the cross-section, when the process of loosening of the internal structure of the two-ply yarn is established. The aim will be to determine whether this limit corresponds to a change in the process of retraction and breaking strain, as a function of the ratio of these twist coefficients.
Theoretical assumptions about the behavior of two-ply yarn with different twists
The influence of the counter twisting on two-ply yarn proportions and the inner structure was introduced in detail in Vysanska 19 and Dhamija et al., 20 in which this dependence is observed for different types of single yarns in terms of their technology. Just a summary then, the counter-plying process (usually, the single yarn has ‘Z’ and two-ply yarn has ‘S’ direction of twist Zs [1/m]) can be divided into two main parts – untwisting of single yarns in two-ply yarn, and subsequent twisting in the same direction as two-ply yarn. This statement illustrates the dependence of two-ply yarn retraction (twist take-up) δ on two-ply yarn twist, see Figure 1. Three characteristic points A, B, and C can be observed. In point A, the length of two-ply yarn has its maximum; the structure of single yarns should be totally open. In point B, the untwisting of single yarns is completed, and the opposite twisting begins. The single yarns should be without a twist. In point C, the single yarn length is equal to the two-ply yarn length, and two-ply yarn retraction δ is equal to zero. From this point, the two-ply yarn retraction increases towards positive values.
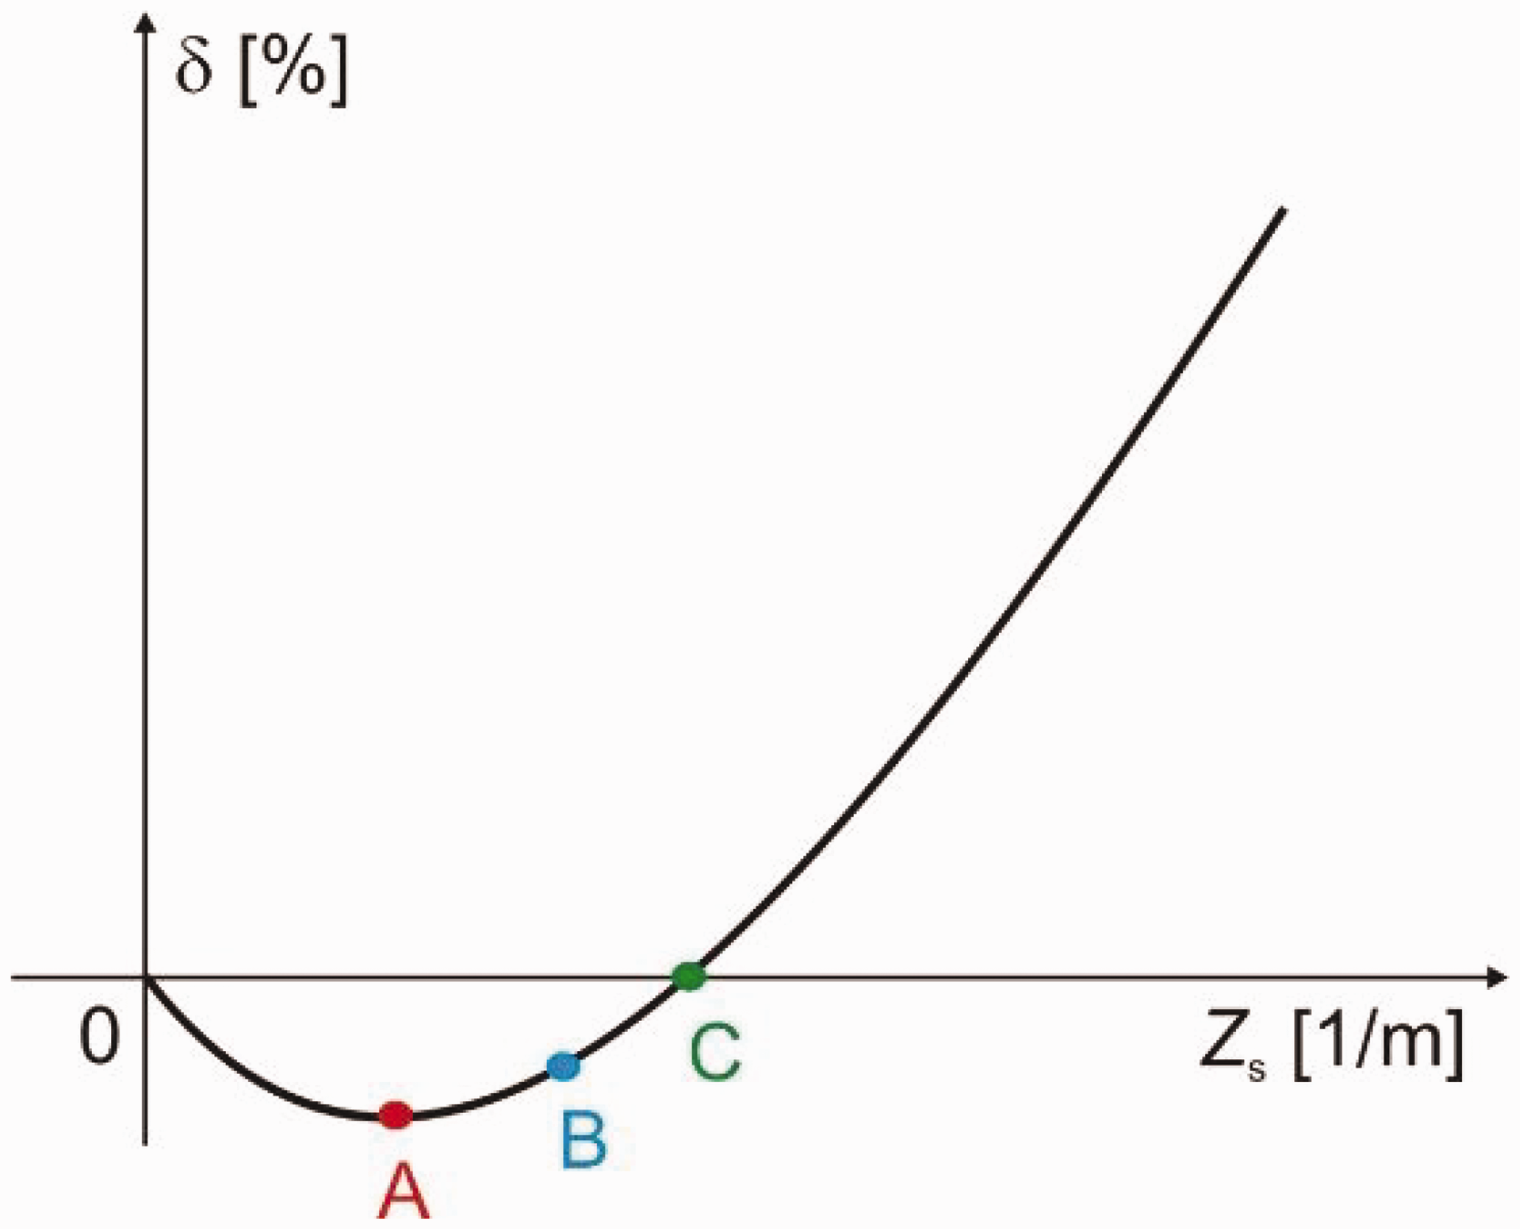
Relation between the two-ply yarn retraction and ply twist.
Principle of the suggested method
The basic principle of the method is to process the images of cross-sections of some discrete formation (single, two-ply, one-component free yarn, and also the yarn in the woven or knitted fabric) to get the centers of gravity of each fiber in the cross-section. Images are analyzed in the system of image analysis NIS Elements, and subsequently the obtained data are evaluated by a program in the MatLab environment, with the aim of acquiring information about fiber distribution in the observed formation.
The method is divided into two phases. The first step is preparation and capturing the two-ply yarn cross-section. The second phase consists of cross-section processing in image analysis NIS Elements and final data evaluation in MatLab.
Cross-section preparation
The cross-section of yarn is a section perpendicular to the direction of the output material, and the longitudinal section is a section parallel to the direction of material output. For yarns and silk, the twist needs to be fixed so that no untwisting occurs. An impregnation is used for that purpose.
The impregnation is applied in three steps, each in one day. The first impregnation is prepared by mixing dispersion glue with a powerful soaking agent in a ratio of 1:2. It is then dosed on the textile and dried. The second impregnation is mixed in a ratio of 1:1, and the last impregnation consists of dispersion glue only. Drying occurs in a standard atmosphere. The transparent impregnation layer secures the position of fibers, significantly affecting the quality of the image resolution of fiber sections under a microscope.
The fixed sample is put onto a tinny tub, as shown in Figure 2.
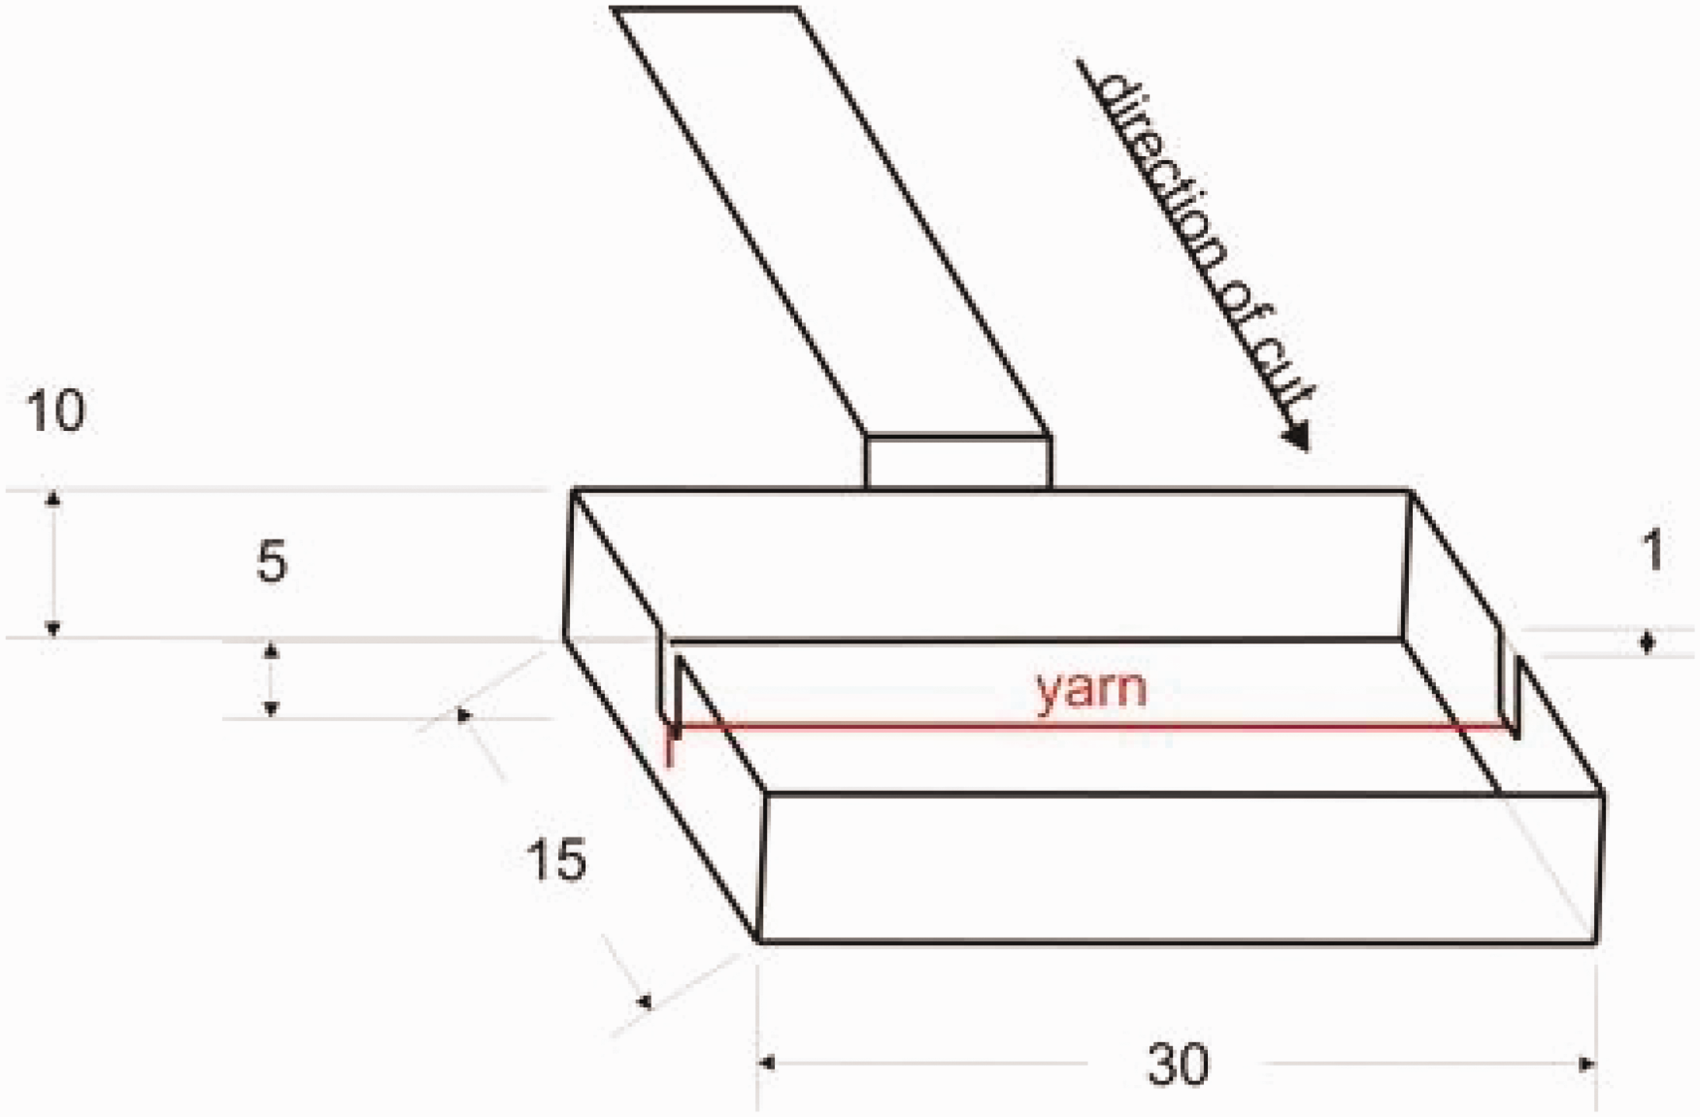
Tub for immersing linear textile with a mixture of bee wax and paraffin.
The tub edges must be sealed with gluing tape to prevent mixture leakage. After cooling the wax in the tub, the sample is placed in a freezer until it hardens. The hardened block is removed from the tub, and cut into the form of a quadrilateral pyramid with the textile sample at the center. The block is then clamped to a microtome Leica RM 2155. The thickness of the slice is set (about 13–25 µm for linear textile). A drop of xylen is put on each slice; xylen dissolves wax. Then, the light microscope Nikon Eclipse E200 captures the sections using transmitted light. The microscope is connected to a digital camera (JENOPTIK ProgRes CT3) and a computer with the system of image analysis NIS Elements. All images had the same resolution of 640 × 480 pixels; the dissections were magnified 120 times. An example of a real cross-section of a 2 × 29.5 tex two-ply yarn with a 600 1/m ply twist is shown in Figure 3.
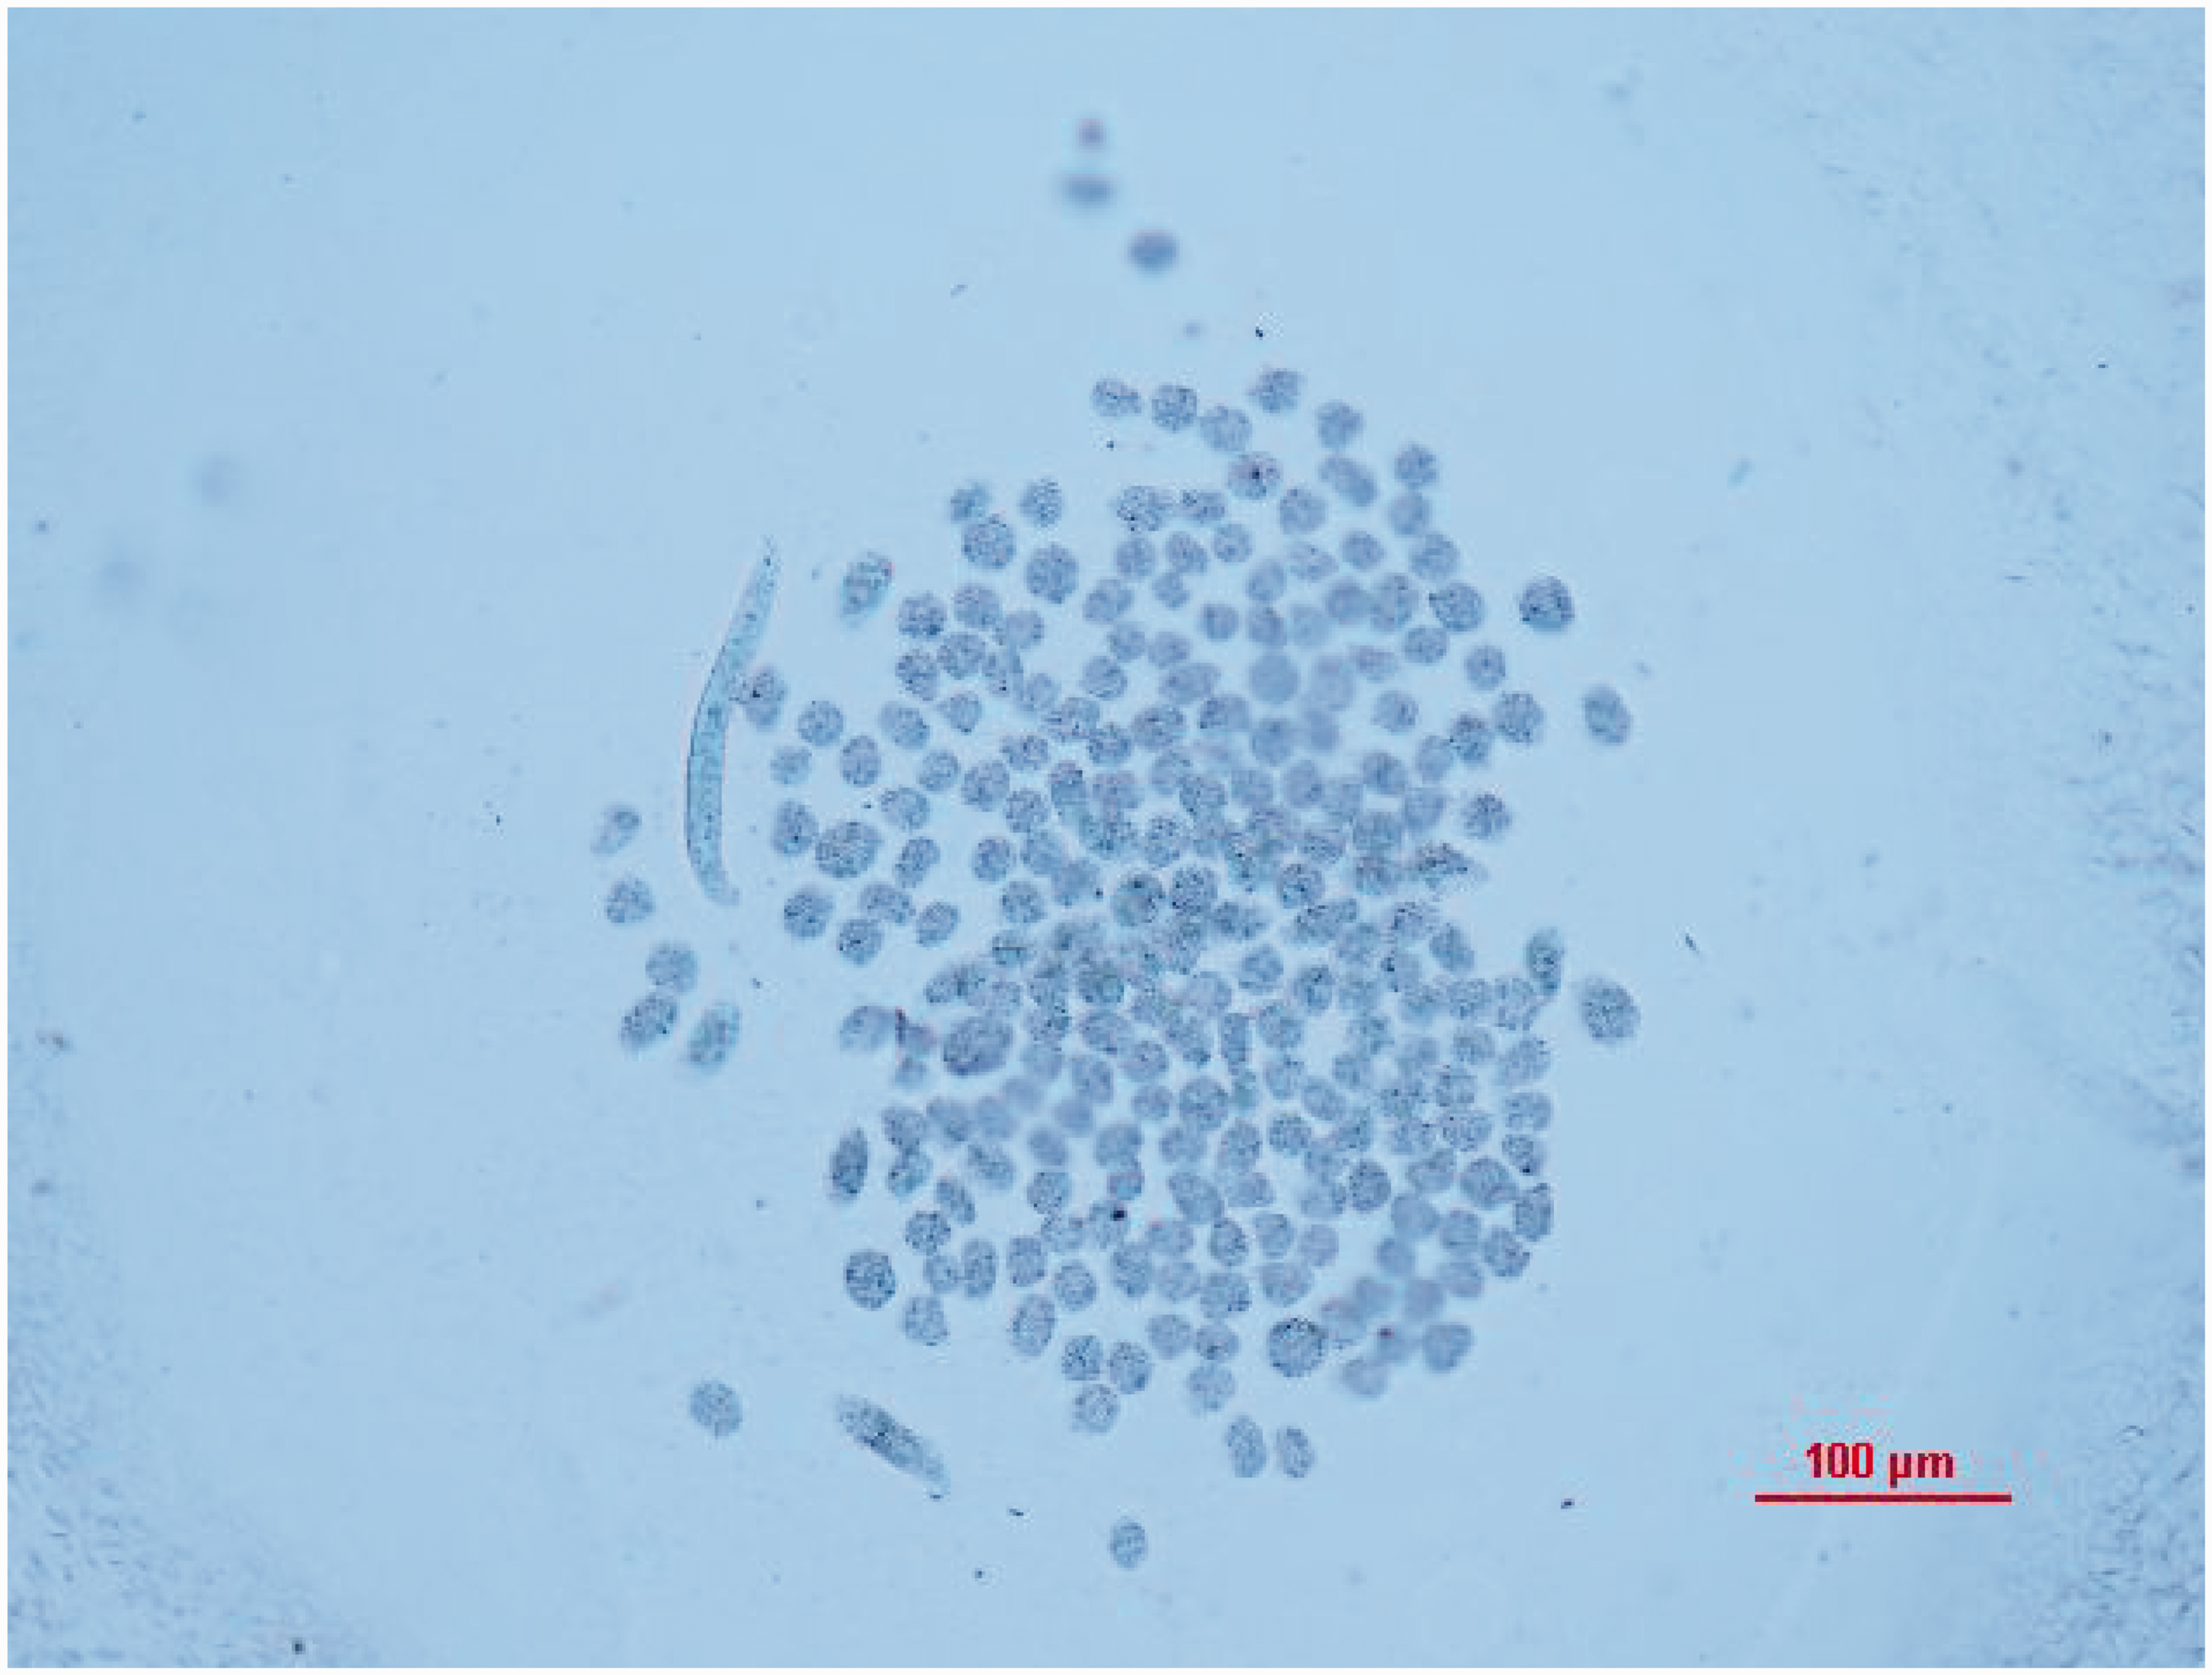
A real cross-section of a two-ply polypropylene (PP) yarn with a fineness of 2 × 29.5 tex and a twist of 600 1/m (2 × 29.5/600).
The procedure of yarn preparation is very delicate; inappropriate handling can negatively influence the final results. The yarn must be straightened in the tub. The massive knife in the microtome has to be sharp, and has to have the same temperature as the wax block with yarn, to get a perfectly perpendicular yarn cross-section.
Cross-section processing
The samples for cross-section preparation are randomly picked out from a 100 m yarn hank. Typically, 40–50 cross-sections of two-ply yarn are prepared and analyzed according to previous prescriptions. On each cross-section, all centers of gravity of all fibers are interactively marked by the user in image analysis NIS Elements, see Figure 4.
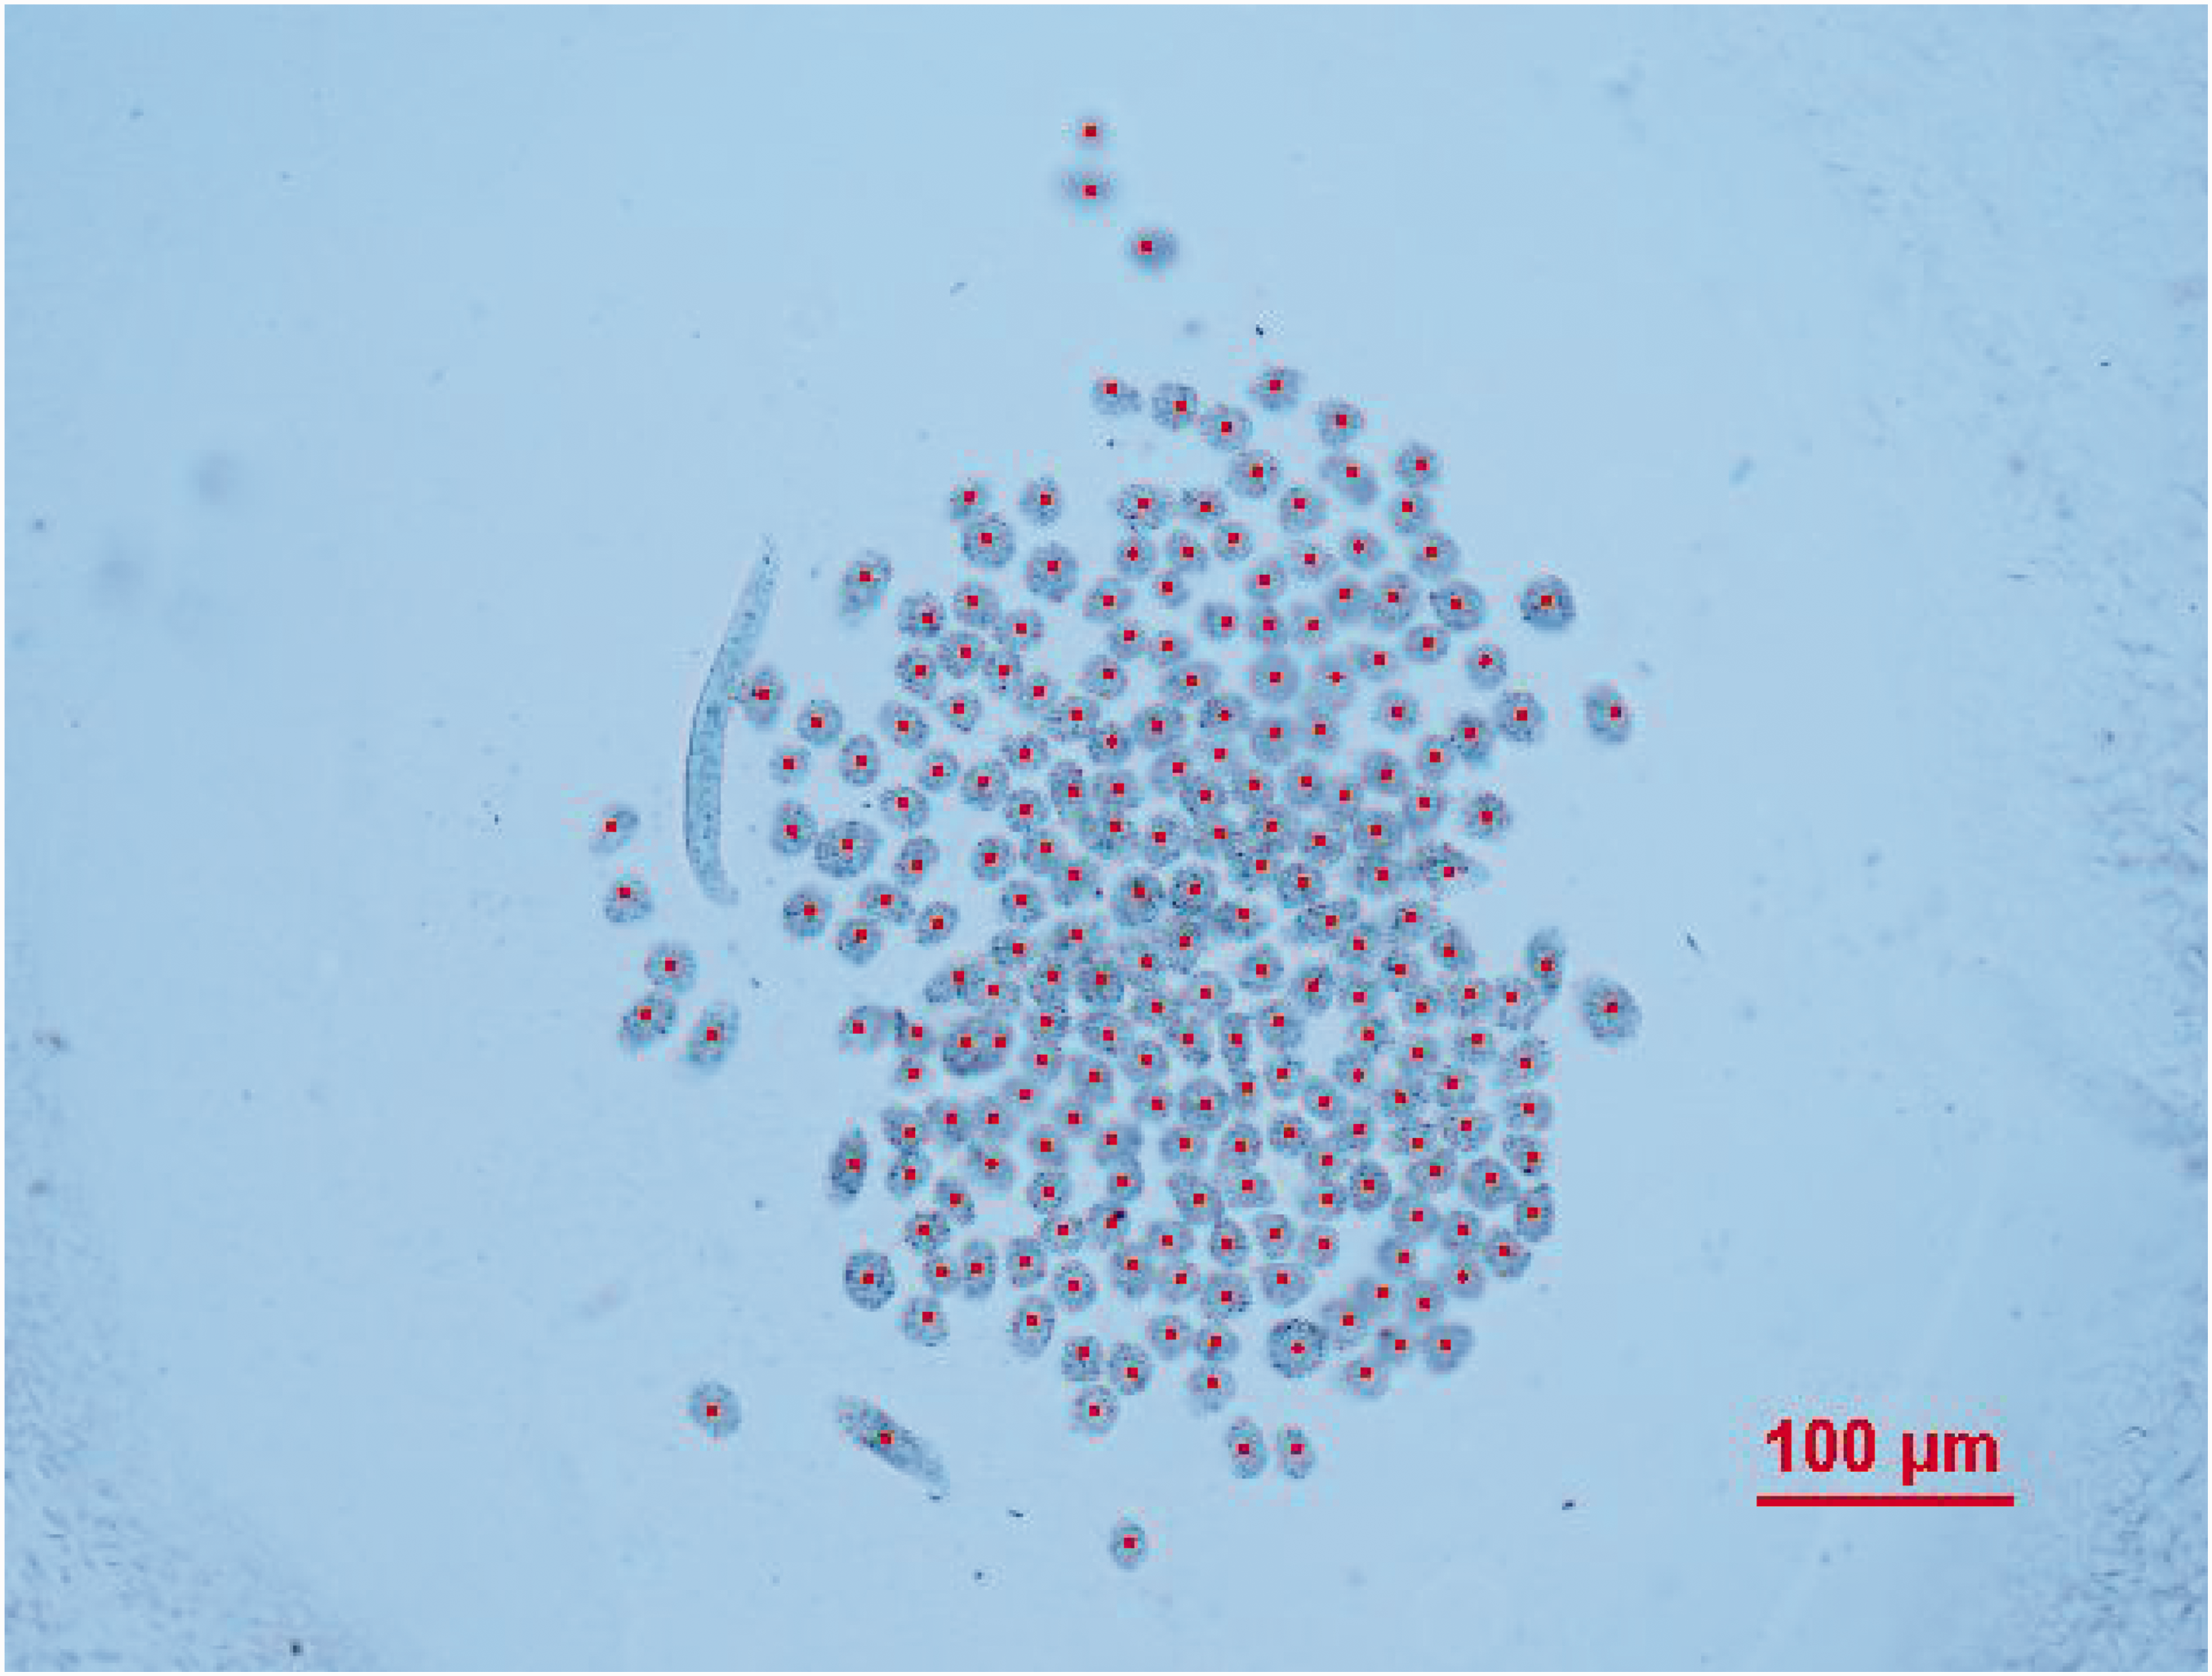
A real cross-section of two-ply yarn (2 × 29.5/600) with subjectively marked fiber centers.
The coordinates (centre X, centre Y) of the gravity centers of fibers are saved in the text files.
Data evaluation
Data of fibers’ cross-section in each text file are evaluated in the following process:
The cross-section is rotated along the fibers’ gravity centers and translated, so that the longer half-axis aligns with the x-axis of the coordinate system; the gravity center of the yarn cross-section is always at the beginning of the coordinate system [0; 0], see Figure 5.
Example of the cross-section transformation.
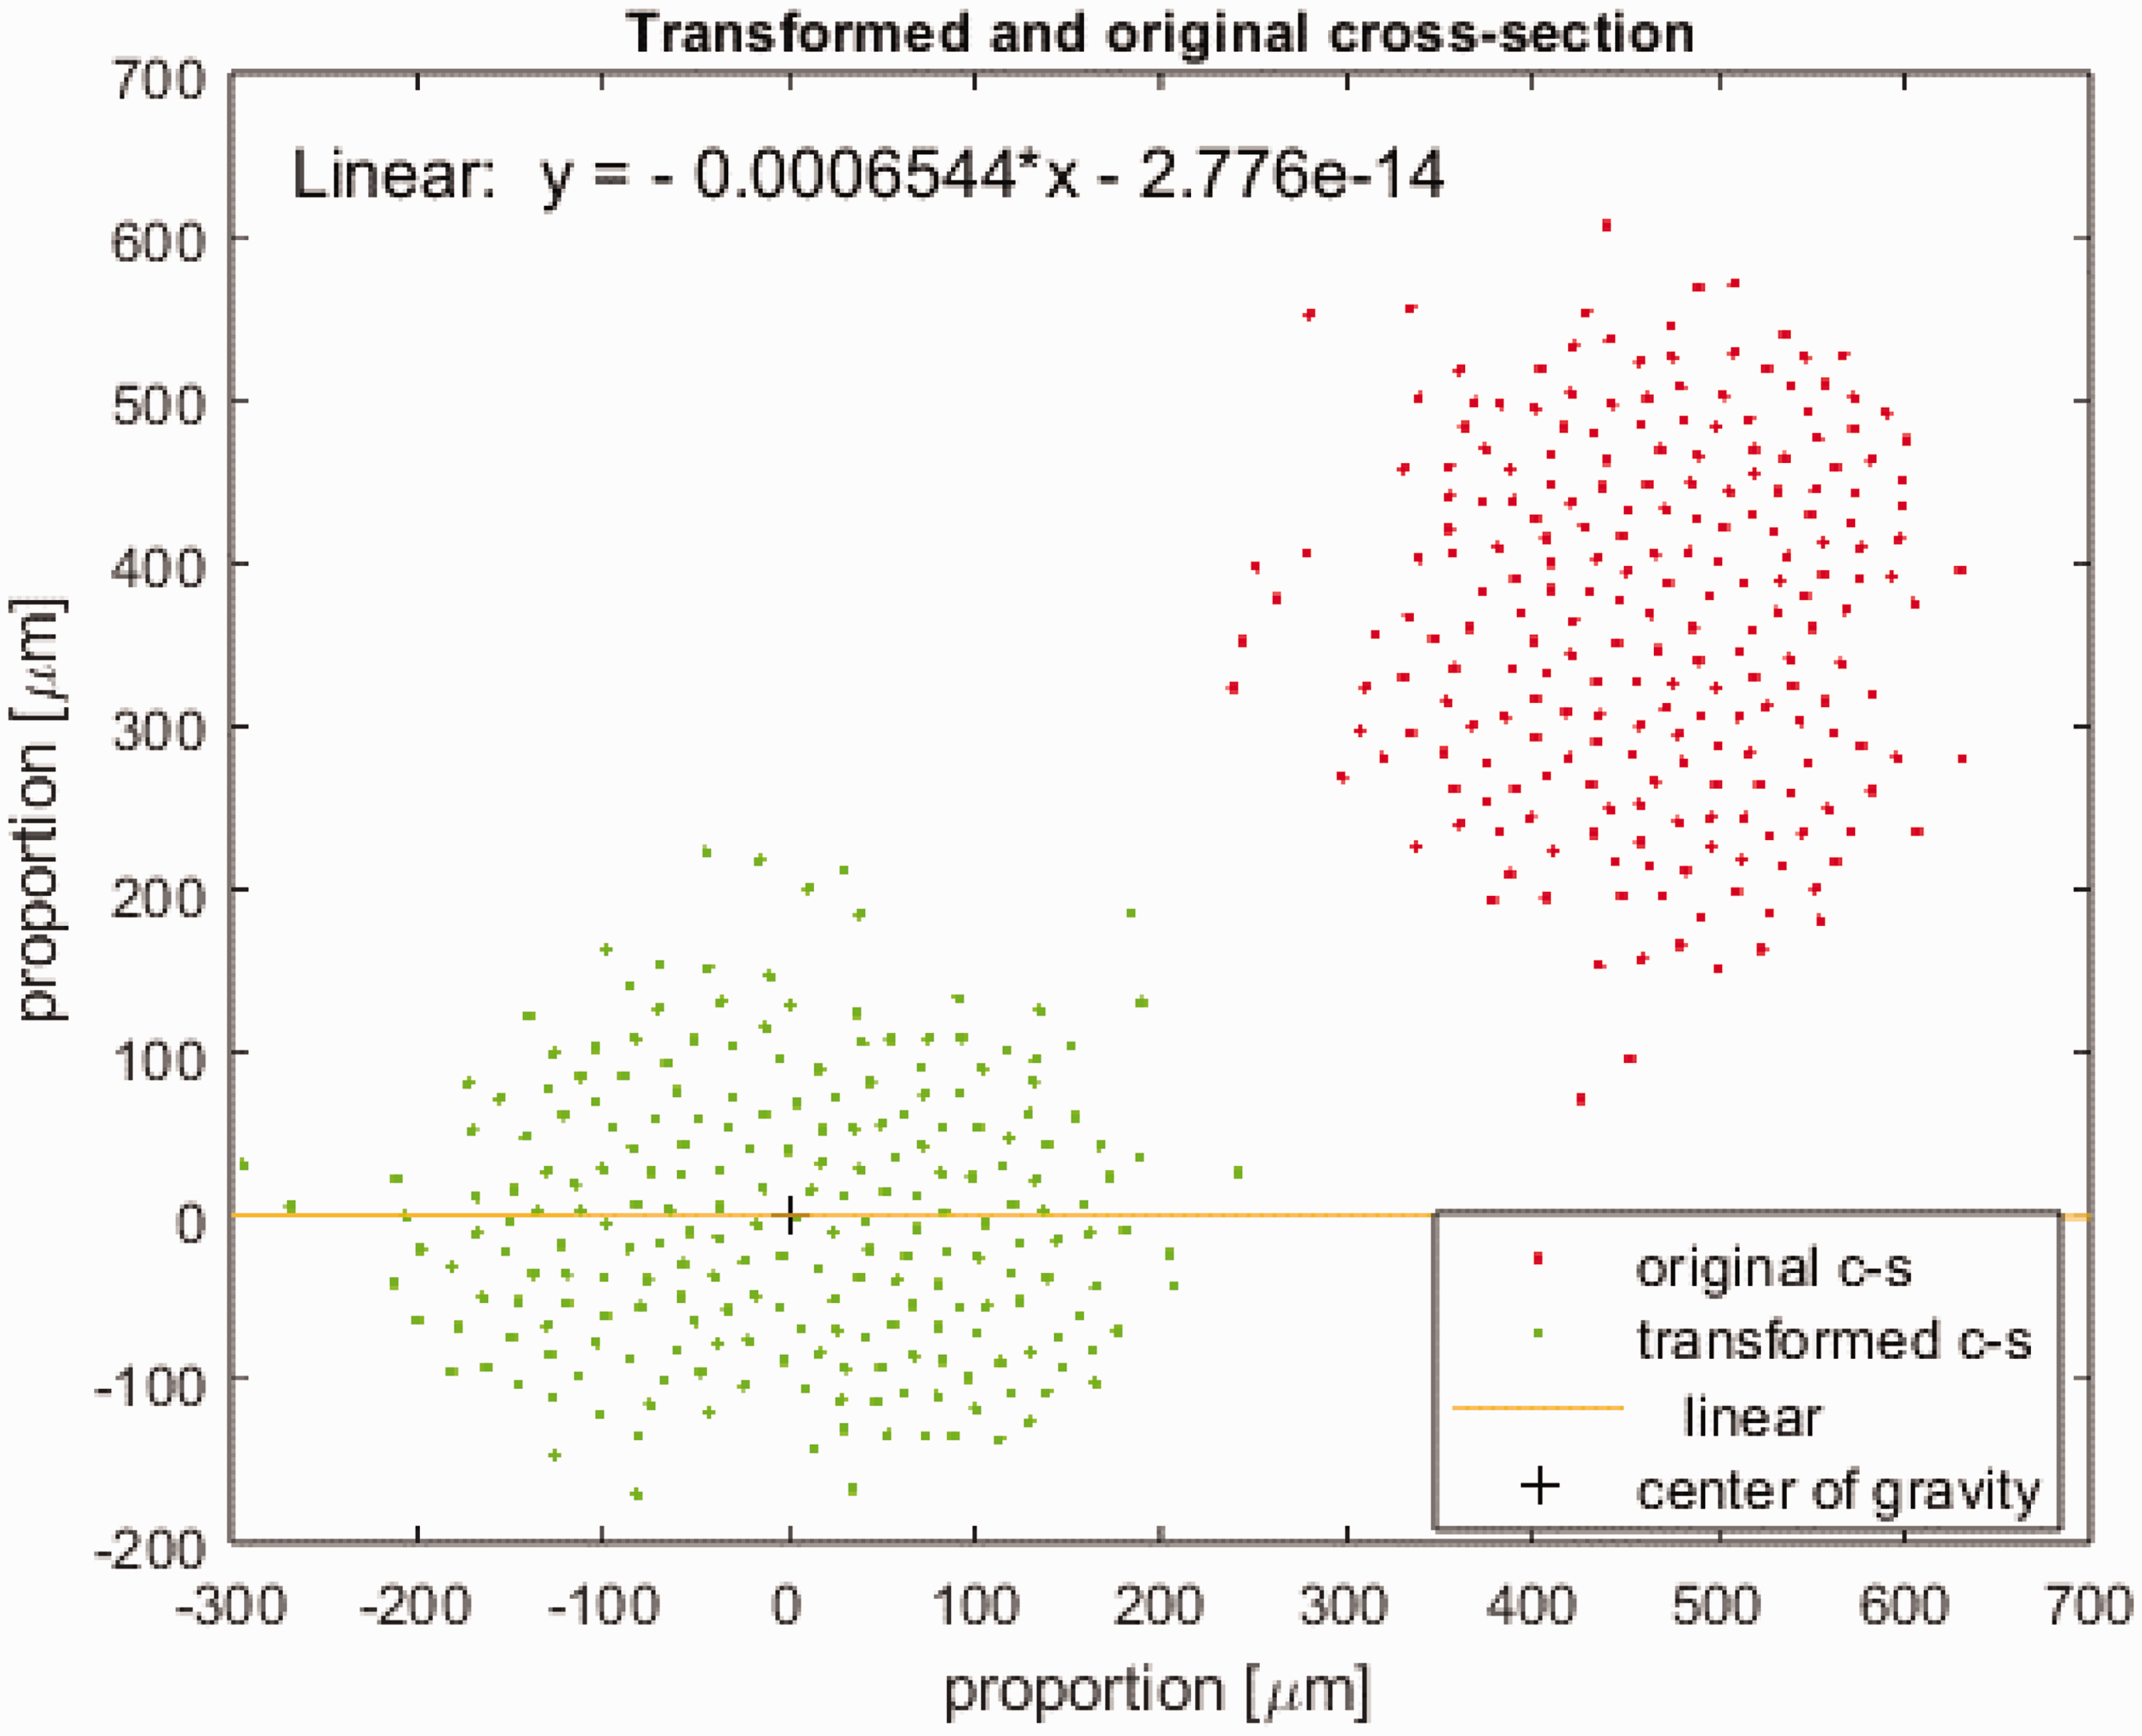
It is possible to check the correctness of the rotation by an arctan directive regression line fit to the data, see Figure 5 above.
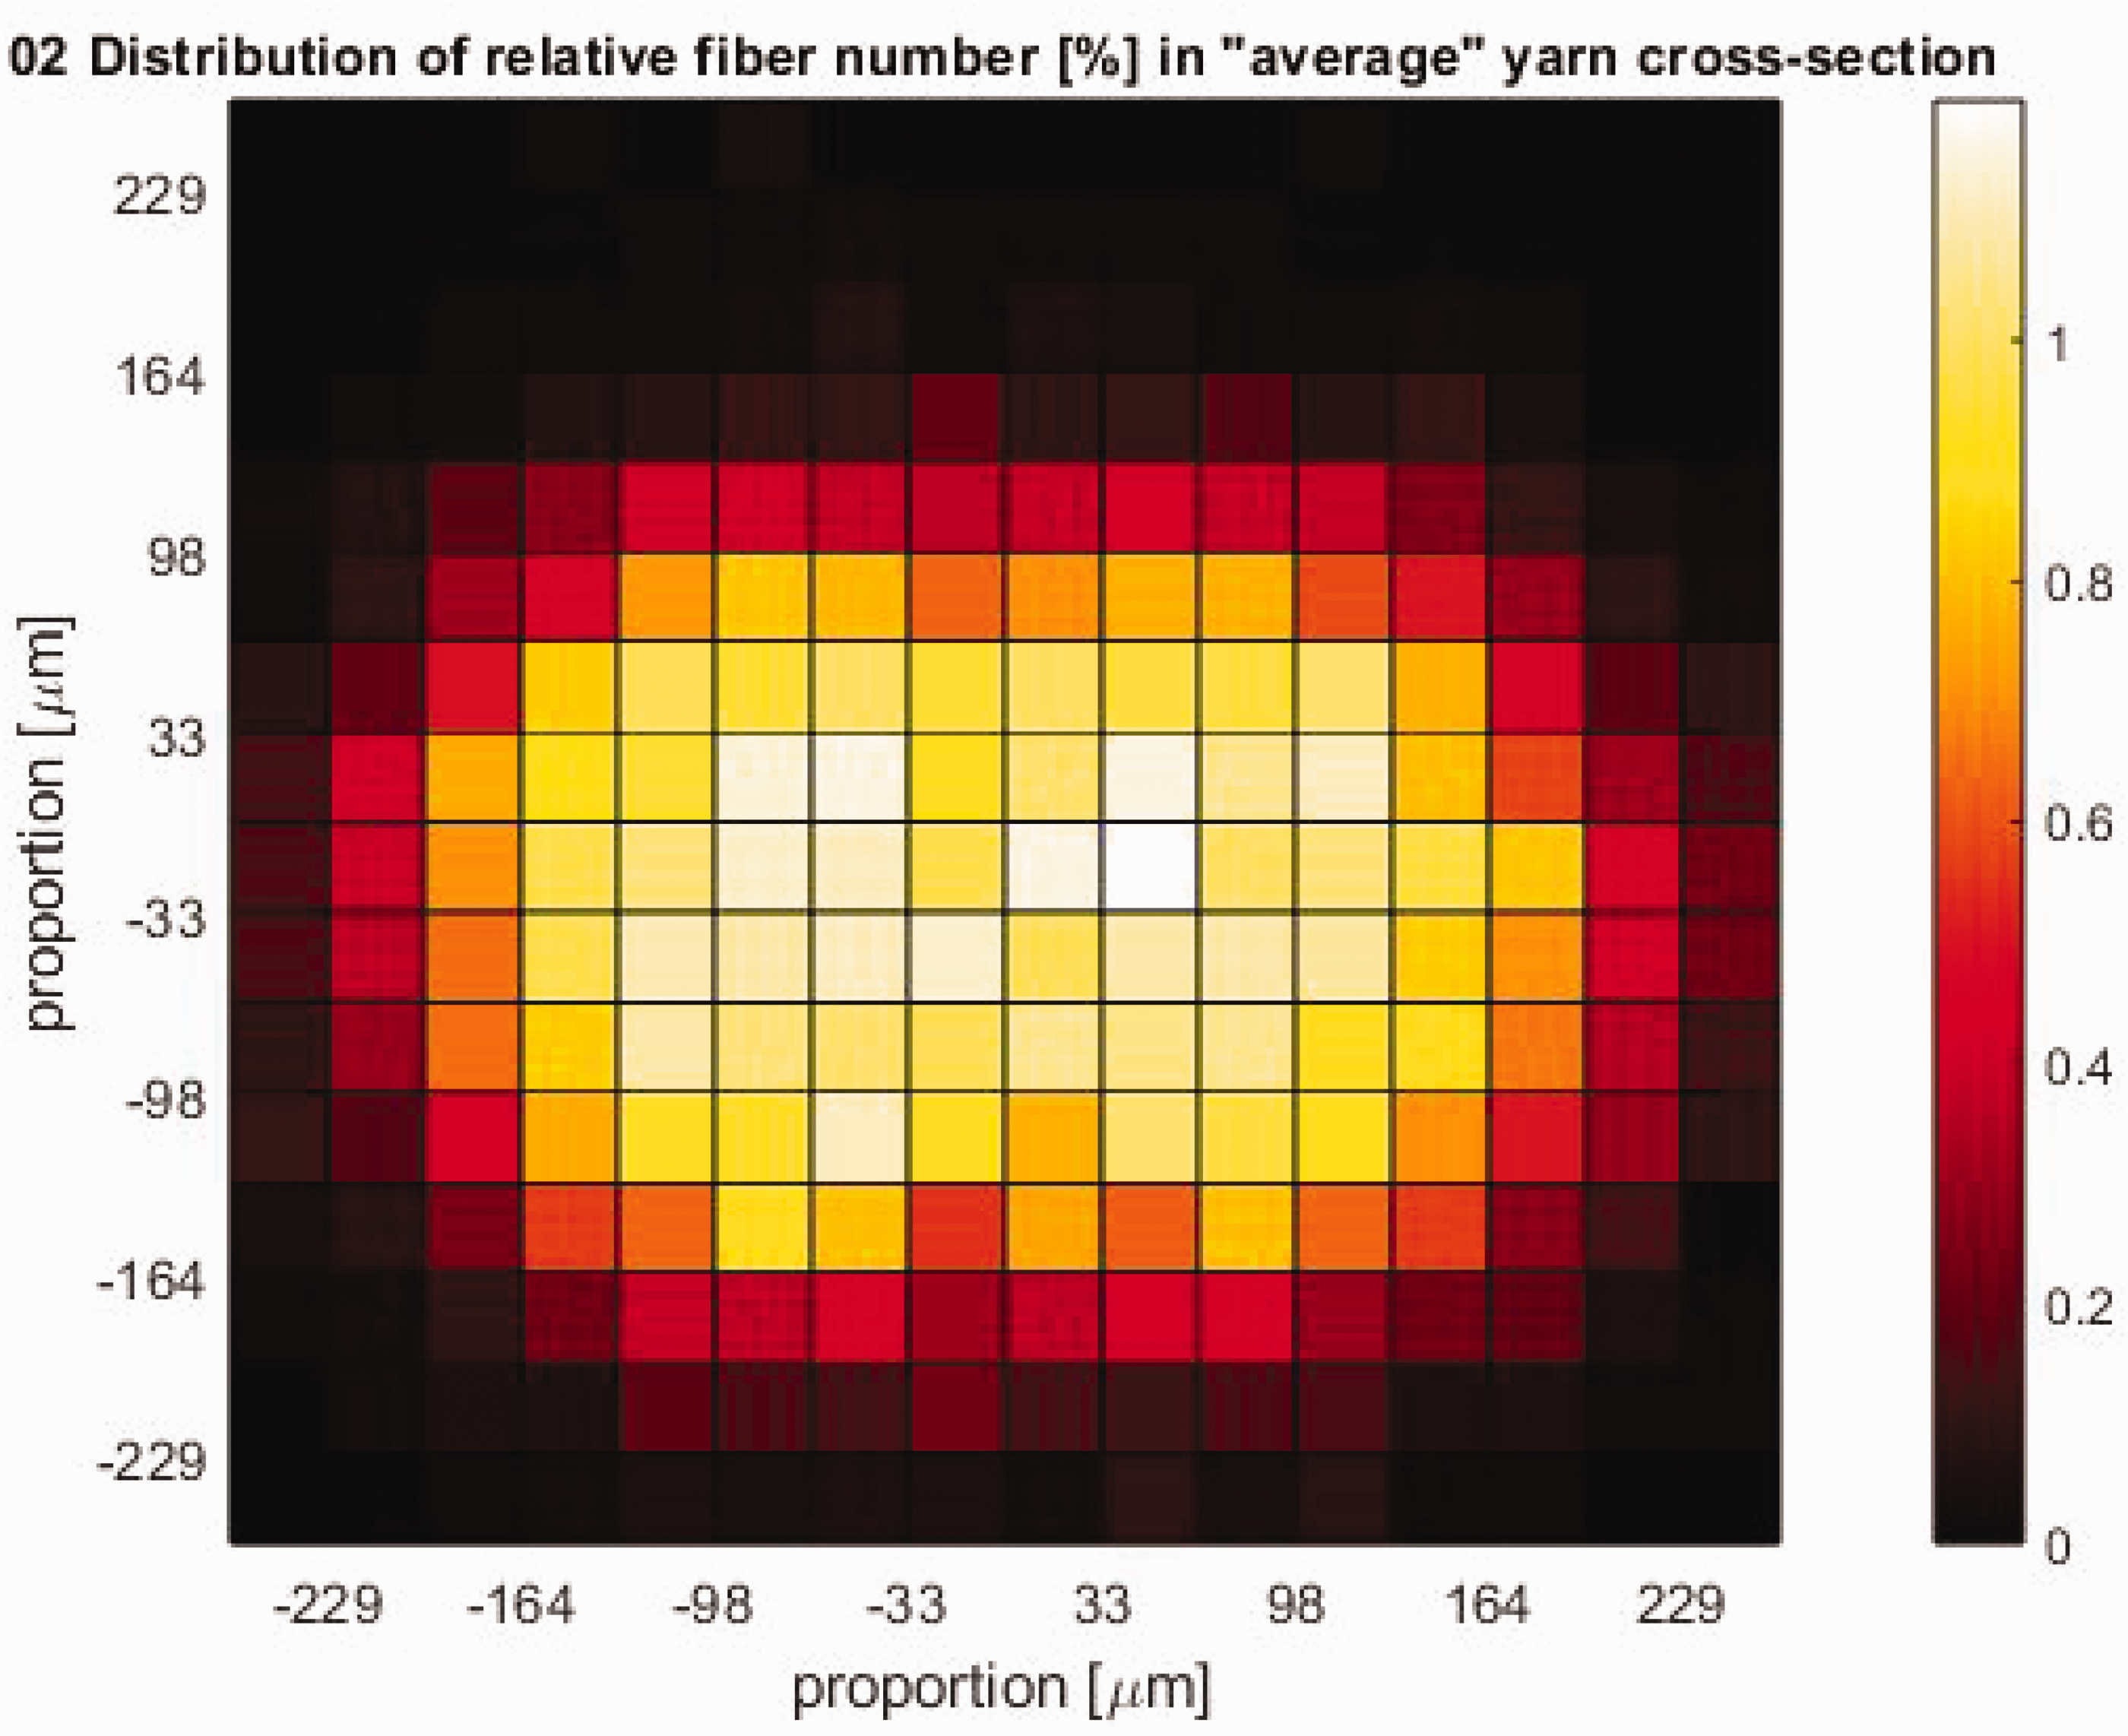
The coordinates of the gravity center of the whole yarn cross-section [xT; yT] are defined as mean values from fibers’ gravity centers. The furthest point of the cross-section xmax is established. The difference delta = xT–xmax is calculated. All coordinates are divided by delta, then the distance of the yarn gravity center from the furthest point is exactly 1, that is, all the others are smaller than 1. The grid of optional ‘resolution’ – by default 16 × 16 – is placed on each yarn cross-section. The yarn cross-section center of gravity is in the middle of the eighth grid column, and the lowest gravity center is on the bottom edge of the grid. In each field of the grid, the number of fibers (fiber gravity centers) is calculated. For each field, the mean number of fibers concerning the number of fibers in the yarn cross-section and of all processed cross-sections is calculated, see Figure 6.
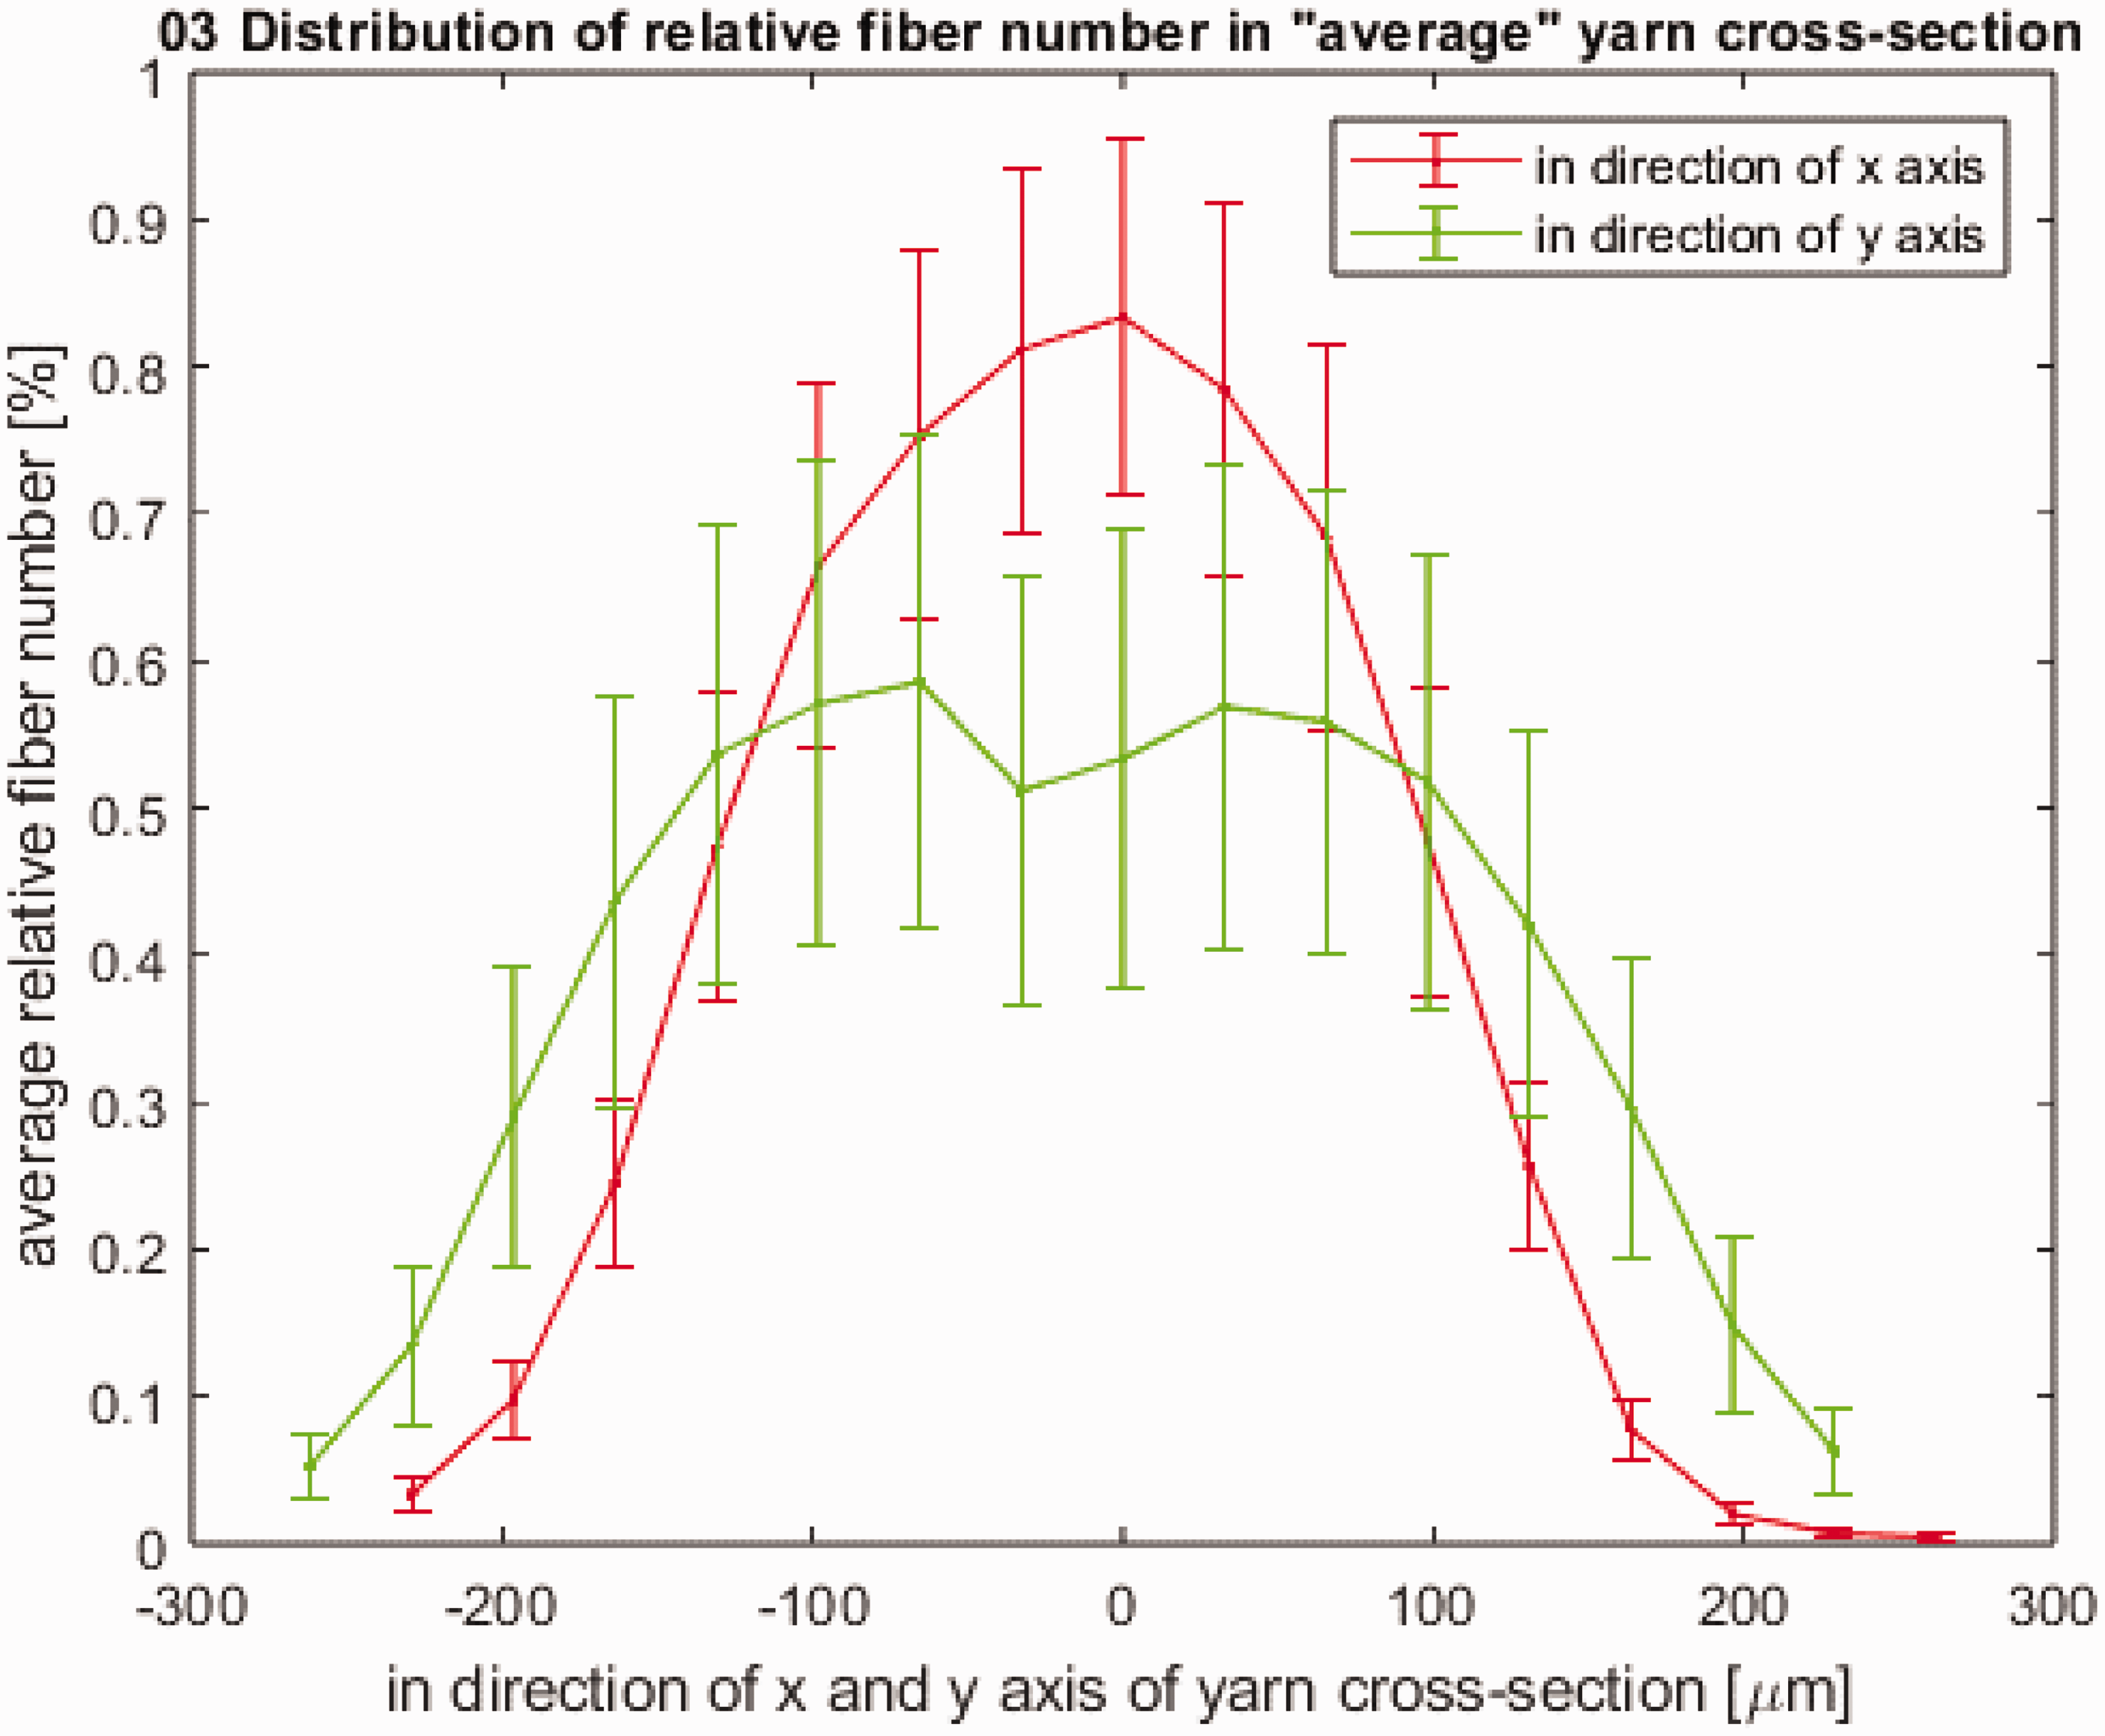
Illustration of the distribution of the relative number of fibers in the individual cells of the lattice in the average cross-section of the two-ply yarn. Finally, the longitudinal proportions of the square grid are converted to the original geometric proportions by multiplication of the average delta (it is the average of all deltas of all yarn cross-sections). To calculate the distribution of the average relative number of fibers in the x and y-axis direction in terms of oriented cross-sections (Figure 5), see Figure 7.
Example of the distribution of the average relative number of fibers in the x and y-axis direction.
This procedure can process any cross-sections of any discontinuous formation.
Experiment
The suggested method is tested on a set of five polypropylene two-ply yarns, as given by Table 1. Only the results (graphs) for 2 × 29.5 tex are presented for illustration.
The summary of tested two-ply polypropylene yarns and their real parameters
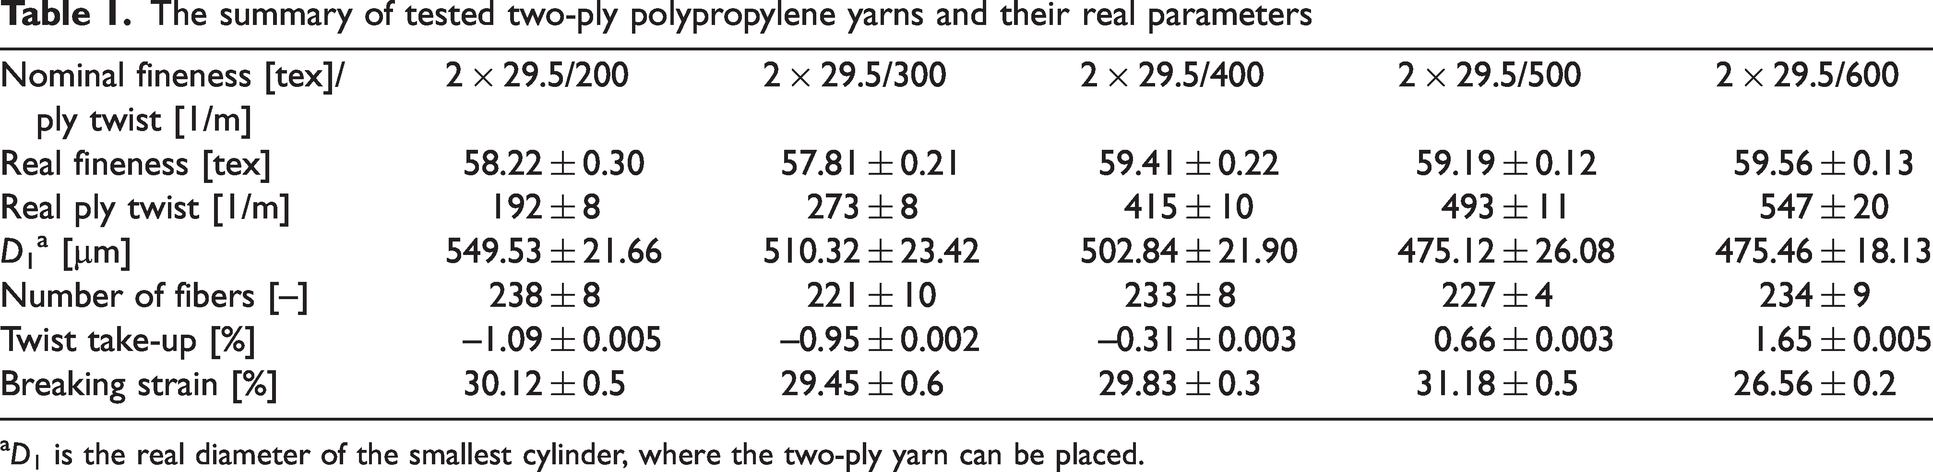
D1 is the real diameter of the smallest cylinder, where the two-ply yarn can be placed.
Each following figure (Figure 8(a) to (e)) contains graphs of average yarn cross-sections representing all processed yarn cross-sections of 2 × 29.5 tex two-ply yarn, see the Data evaluation section. These plots use a contour graph for a better planar imagination of fiber distribution in the two-ply yarn average cross-section.
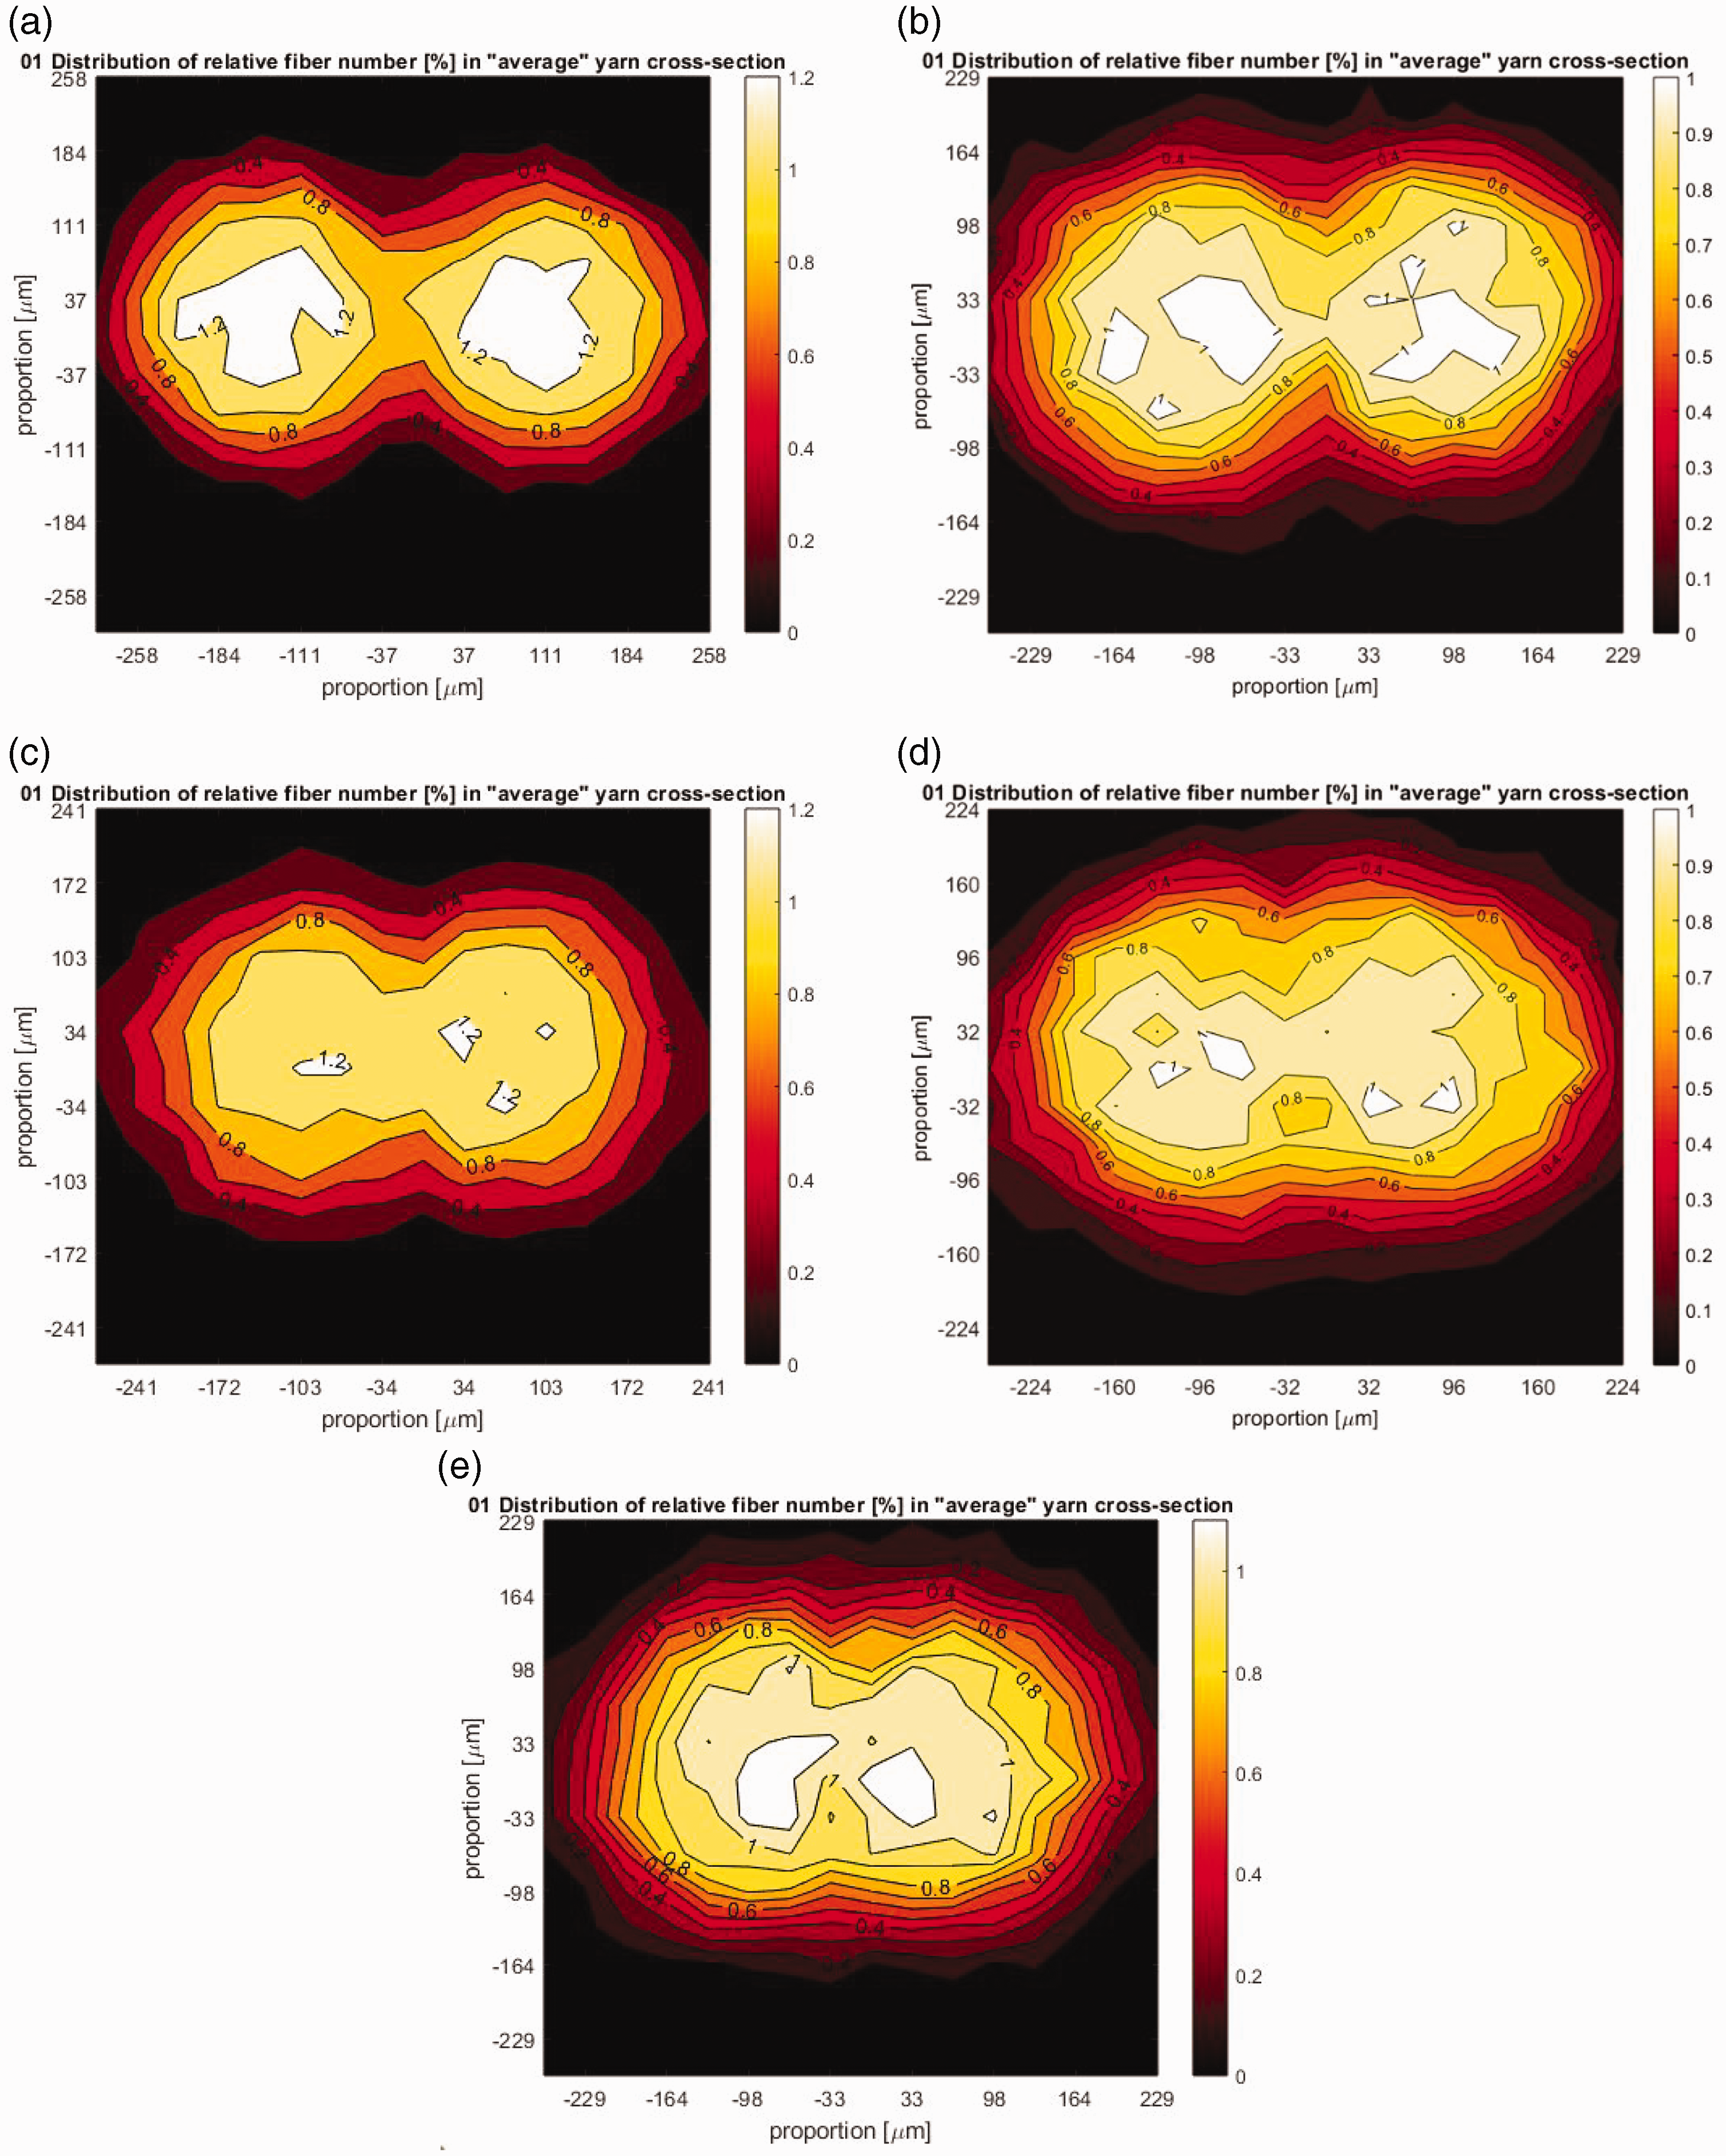
Fiber distribution in the two-ply yarn cross-section by contour chart, 2 × 29.5 tex: (a) 200 1/m; (b) 300 1/m; (c) 400 1/m; (d) 500 1/m and (e) 600 1/m.
Figure 8(a) represents the average cross-section of two-ply yarn with a twist of 200 1/m. Already very low ply twist causes the origin of two-ply yarn, but with clearly defined two single yarns by their ‘kernels’. These ‘kernels’ are characterized by the highest concentrations of fibers in the cross-section. Meanwhile, only fibers in the surface layers of single yarns are in the same concentration.
The accumulation of fibers in ‘kernels’ of single yarns gently dribbles out; the counter-plying begins to work. The same fiber concentration comes in on deeper layers; this is illustrated in Figure 8(b) – 300 1/m.
The ply twist of 400 1/m causes a fineness of 2 × 29.5 tex removing the boundaries between the two single yarns in two-ply yarn, two single yarns’ ‘kernels’ are not visible, see Figure 8(c). Two-ply yarn is now a compact formation but with a considerably loose structure.
A higher concentration of fibers of two-ply yarn moves now to its center, Figure 8(d) – 500 1/m. The structure of two-ply yarn is more compact along the higher density of iso-lines.
Figure 8(d) brings into the discussion a clear accumulation of fibers in the center of two-ply yarn. The new ‘kernel’ of two-ply yarn is rising steadily.
The shape of the two-ply yarn cross-section changes from double circular (double elliptical) to elliptical.
The question is whether the higher twists will lead to a structure with a circular cross-section. Most probably they will not, but they will definitely progress to the structure with one central ‘kernel’.
Now, let us try to connect the found reality of fiber number assembly with possible radial pressure distribution.
Van Wyk 21 compressed the fibrous material in the box, and experimentally found the relationship between the applied pressure and the packing density of the structure. The author further refined this relationship, and later Neckar and Das. 22 However, it is still true that the pressure increases with the third power of packing density.
We do not have information about the radial packing density (distribution of the packing density through the whole cross-section) of two-ply yarns, but we can use the number fiber distribution as a proxy for the packing density distribution. Then, the previous plots (Figures 8 –12) can also approximate the radial pressure distribution in a two-ply yarn.
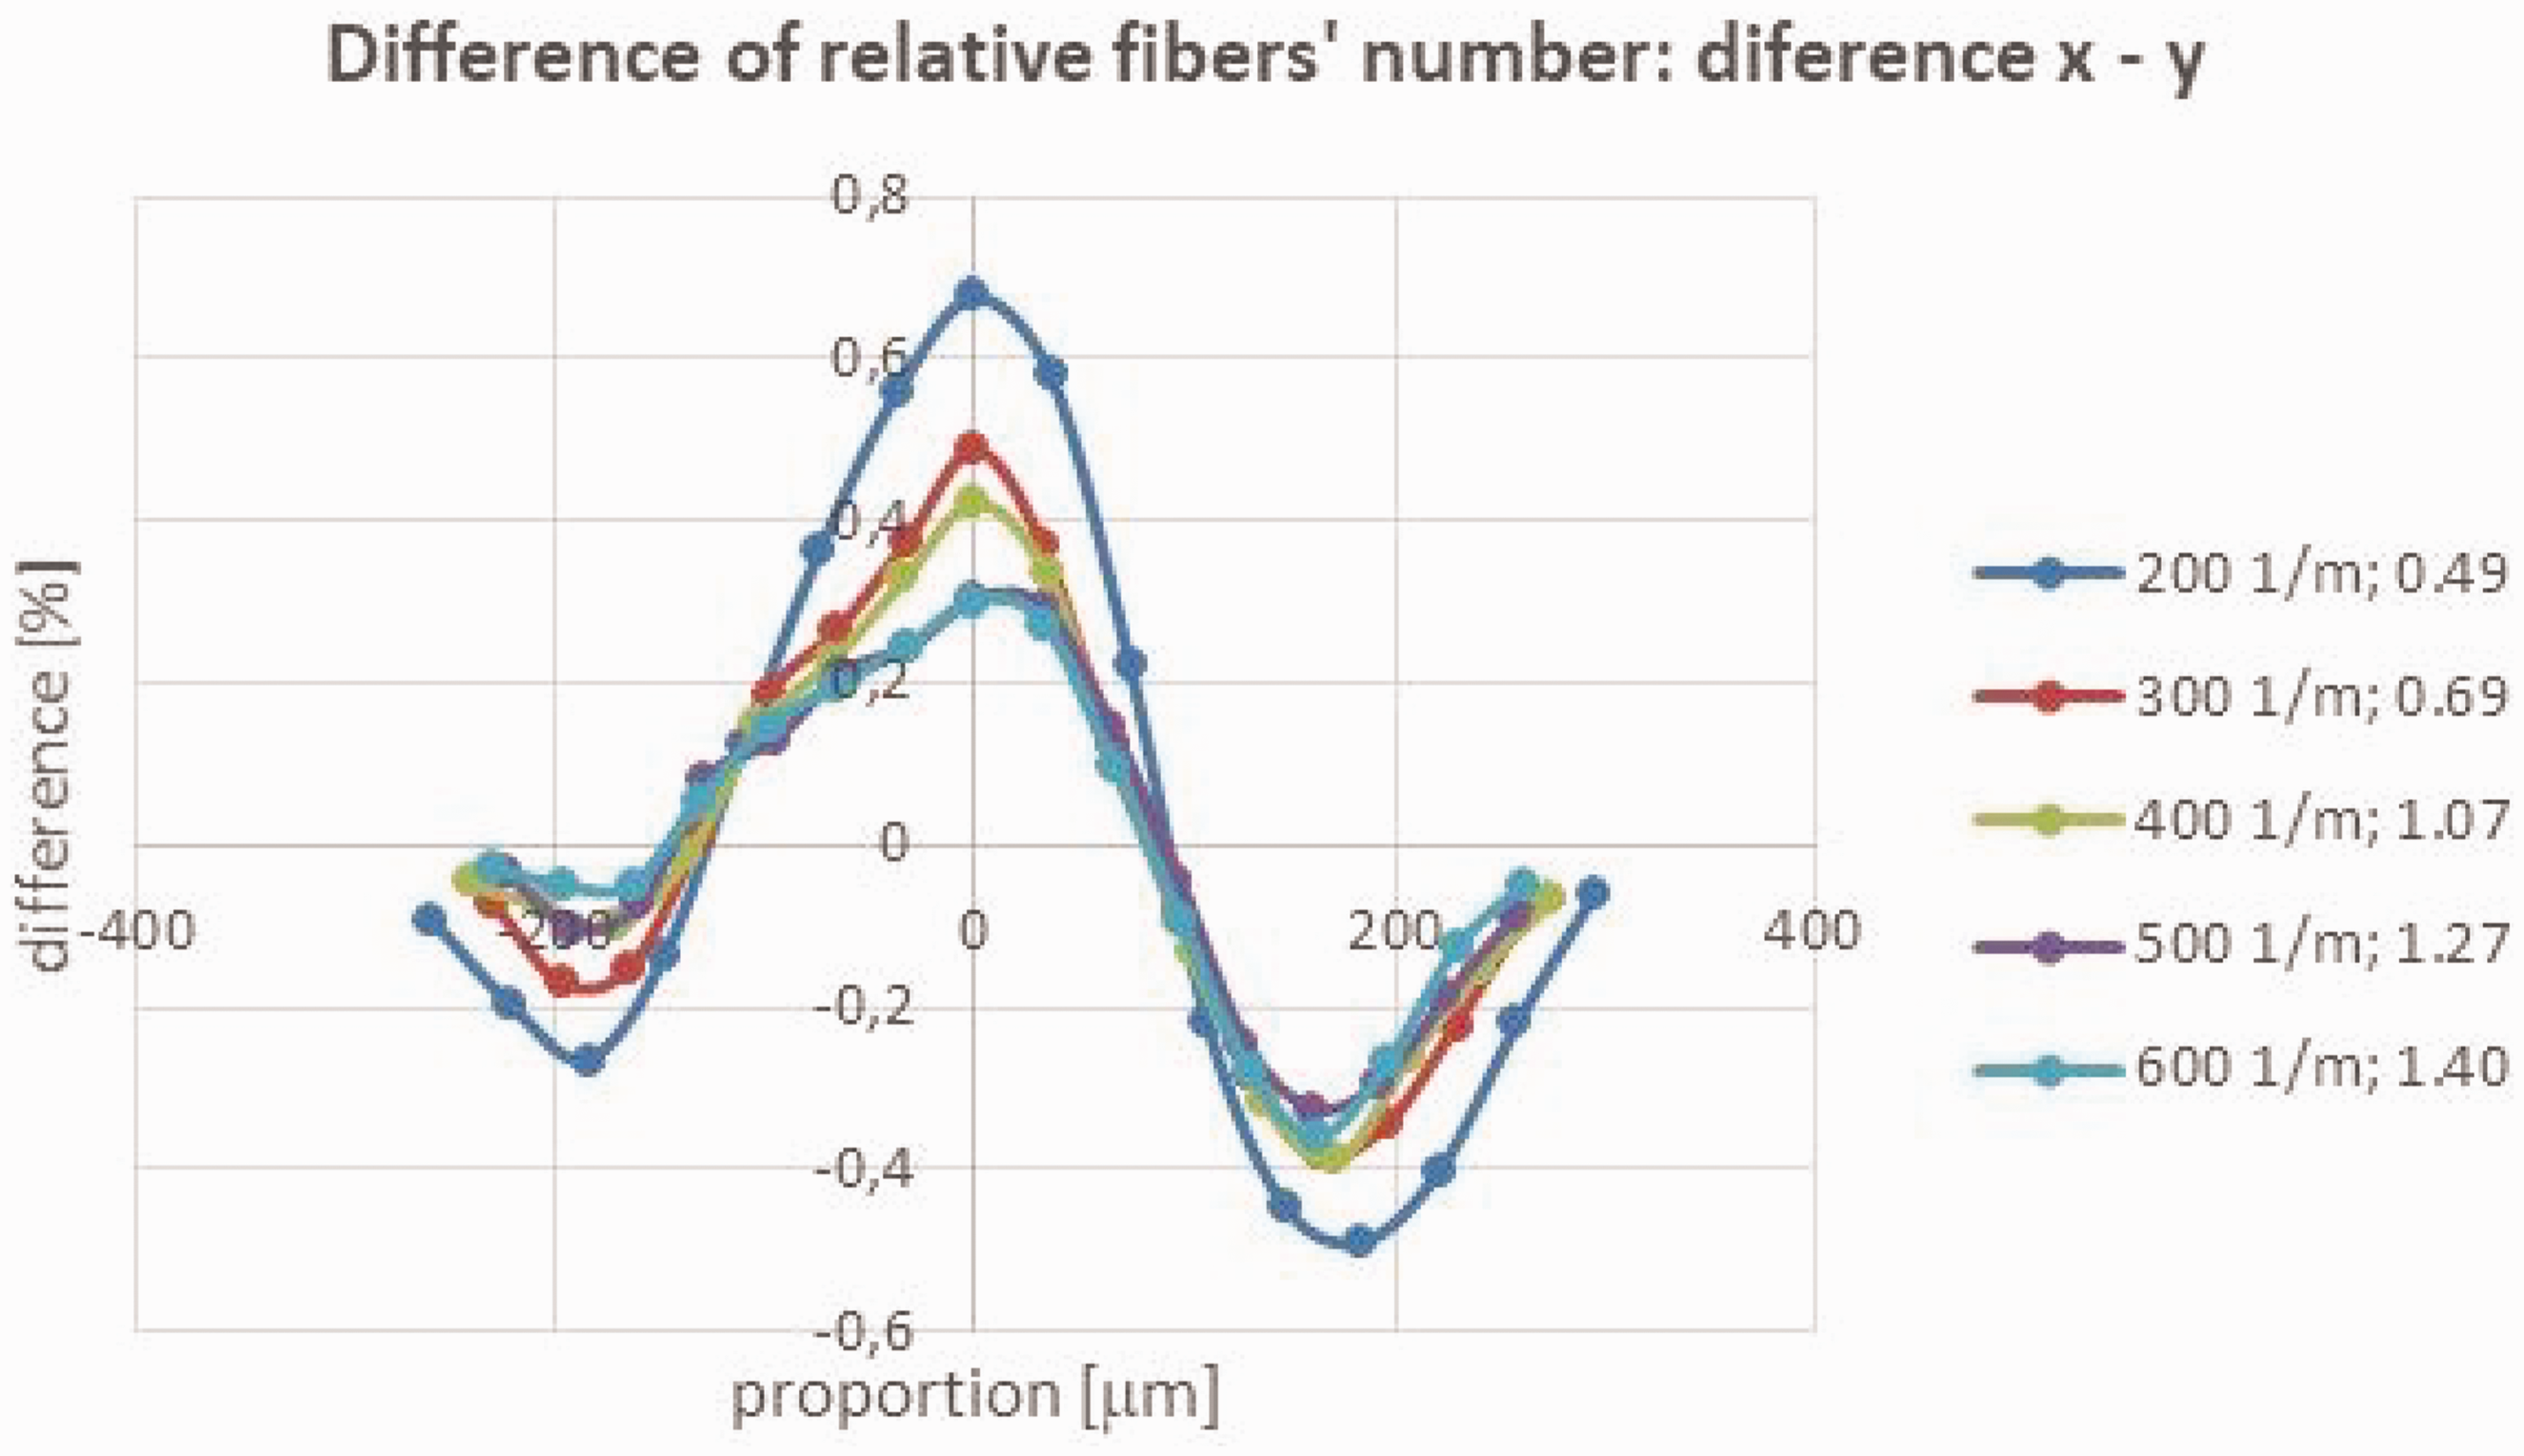
Progress of the x–y difference for the set of yarns under study.
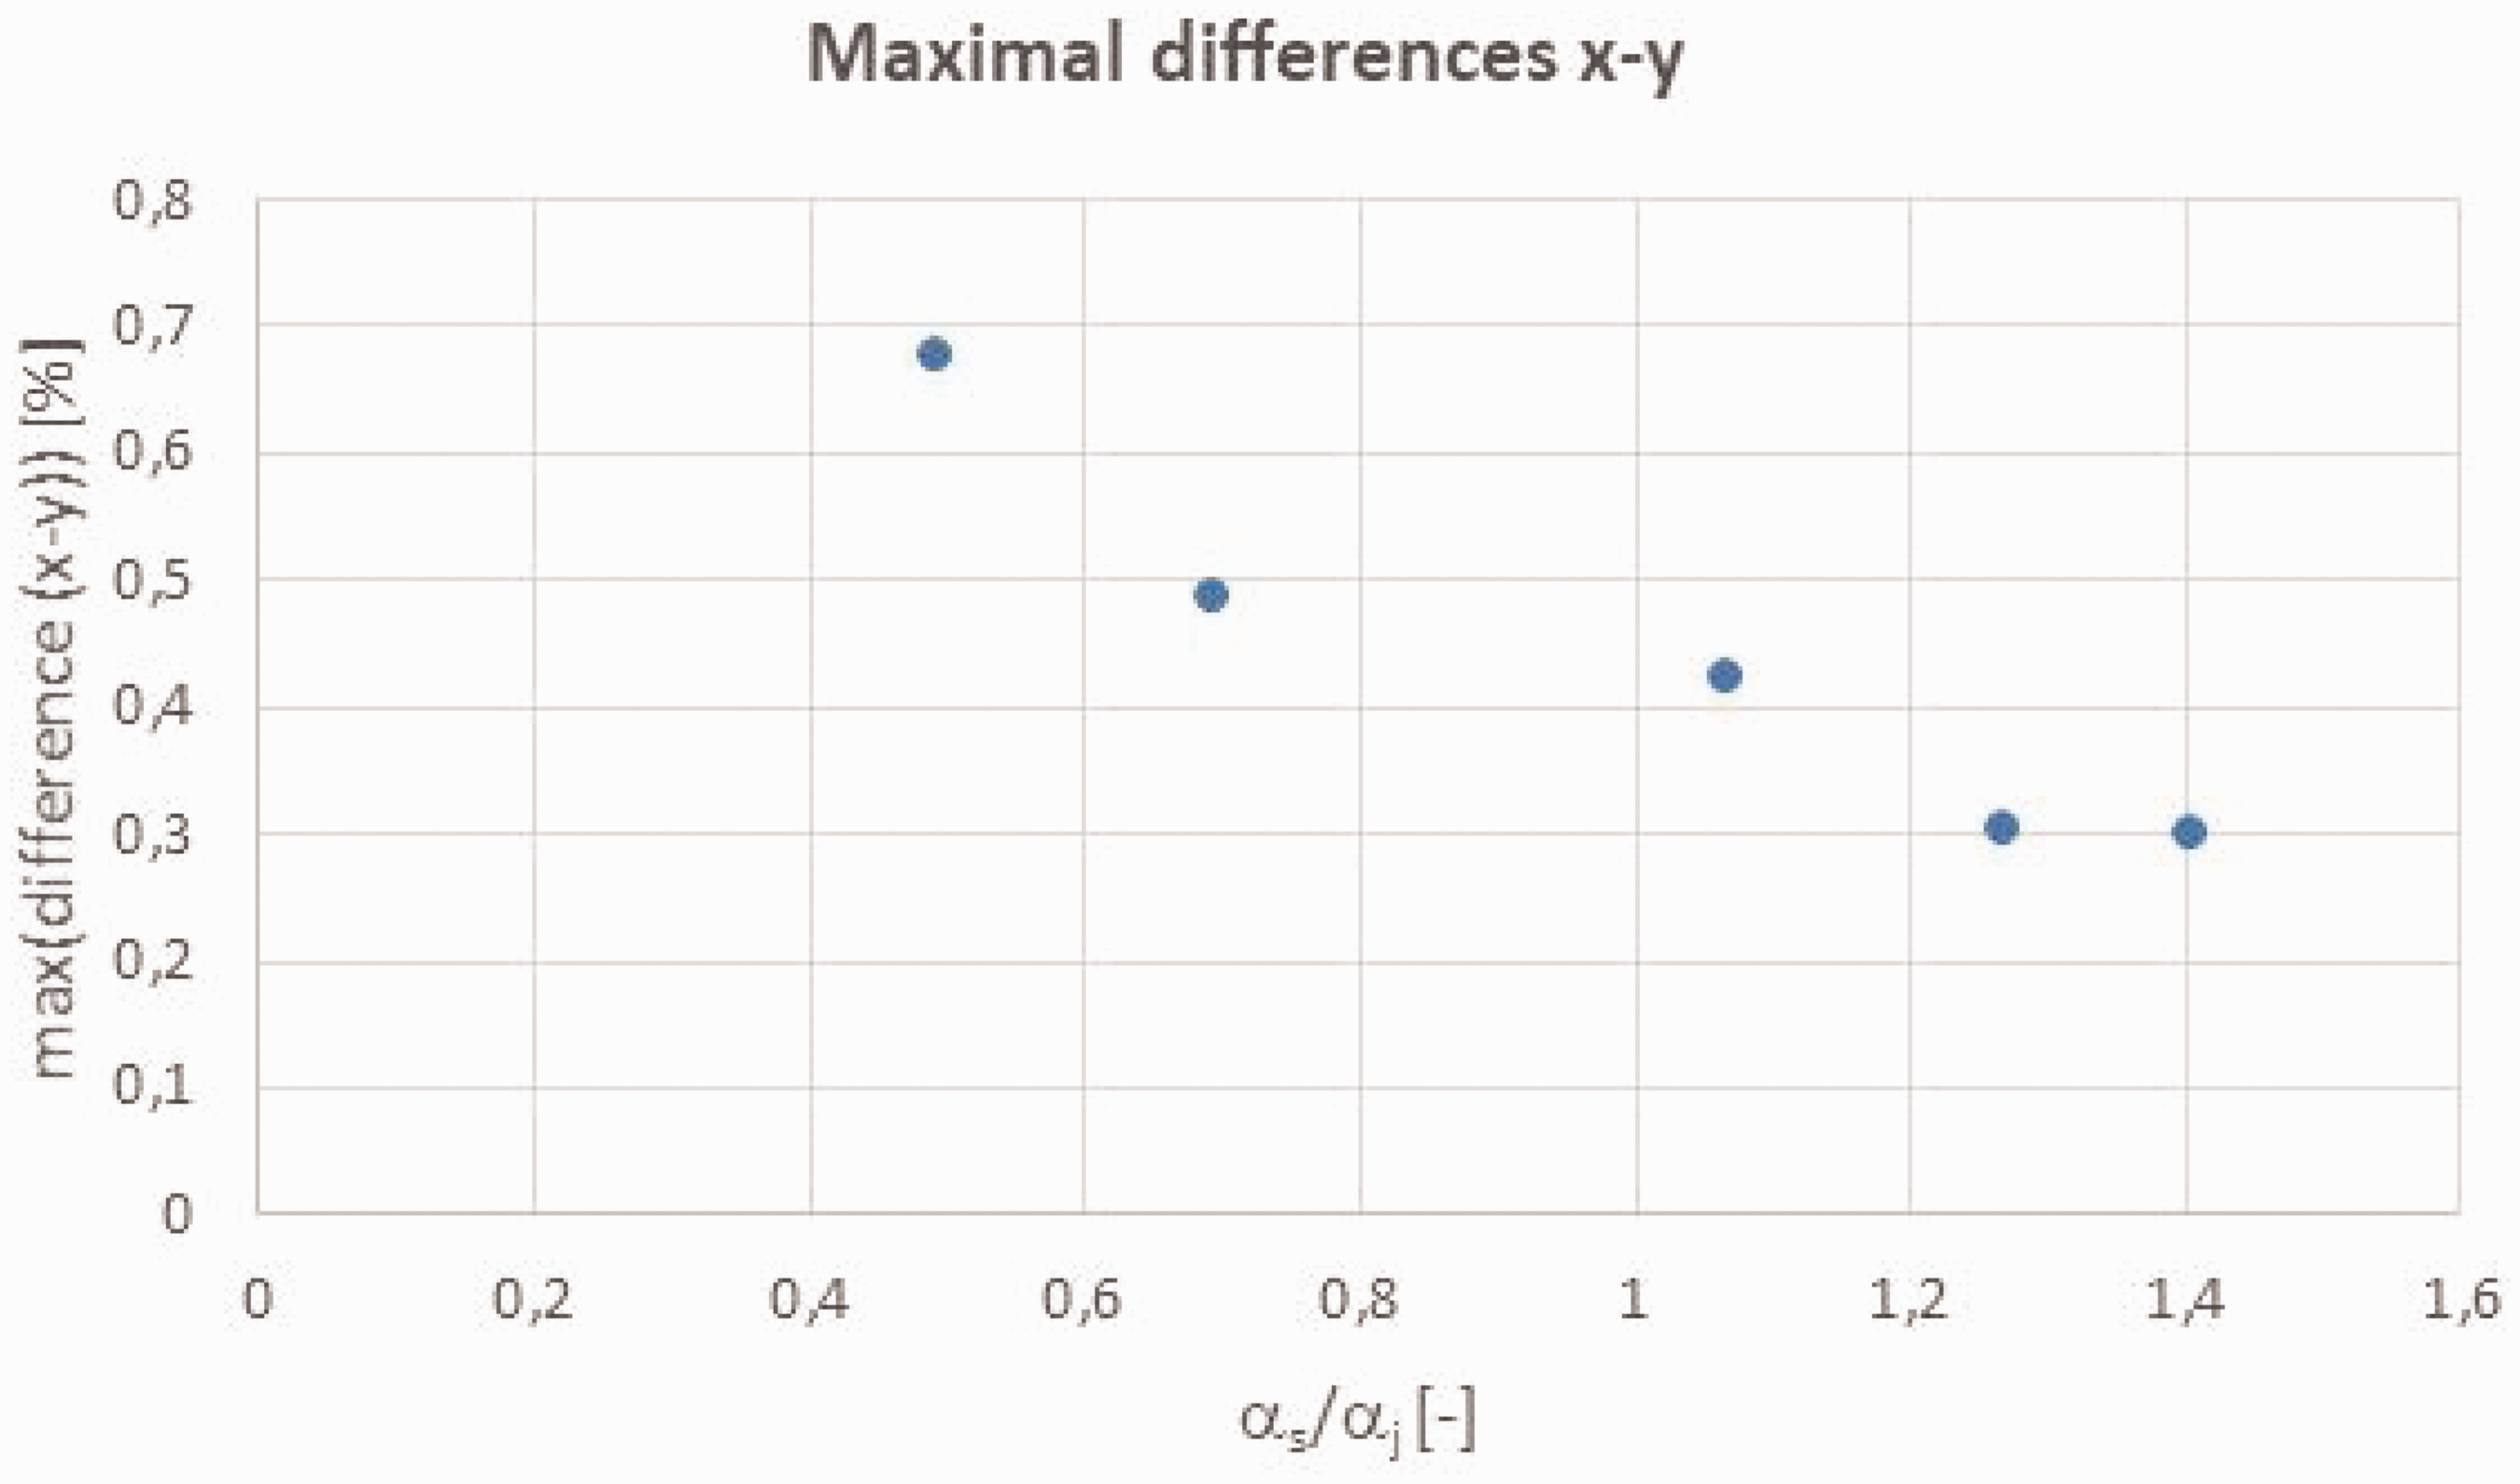
Representation of the positive extremes of the x–y difference as a function of the ratio of the twist coefficient of the two-ply and the single yarn.
External and internal changes of two-ply yarn in different ply twists.
Breaking strain behavior of two-ply yarn in counter-plying.
Using iso-quantities, or the distribution of the relative number of fibers in a discontinuous cross-section, it is also possible to observe the average values of the relative number of fibers in the x-axis and y-axis direction, see Figure 9. The legend shows the corresponding ply twist and, next to it, the calculated ratio αs/αj, the meaning of which is explained in Figure 10.
It is interesting to look at the difference in the average relative numbers of fibers in the x and y direction, here denoted as the x–y difference. The progression of the x–y difference as a constant function manifests a perfectly uniform arrangement of fibers. The ideal case is a zero constant function. An example is a circular cross-section with perfectly uniformly arranged fibers.
There will always be some difference in the x versus y direction in two-ply yarns, which is based on the very nature of the two-ply yarn, that is, the asymmetry of the cross-section. The roughly elliptical shape of the cross-section of the two-ply yarn will cause the greatest x–y difference in the central area of the two-ply yarn and then, with the opposite sign, a slightly smaller one in the peripheral region of the cross-section of the two-ply yarn. Somewhere halfway between these extremes, a zero difference value occurs (the number of fibers is the same in that area). Mathematically, this is a polynomial function of degree 4. As the ply twist increases, the positive extreme of this function decreases in the central region of the two-ply yarn (see Figure 10), indicating a balancing of the relative number of fibers in the two mutually perpendicular cross-section directions. At the same time, the change in this value demonstrates a change in the internal arrangement of the fibers in the two-ply yarn due to the counter-plying.
The twist of the single yarn, its fineness, the fineness of the two-ply yarn, and also its twist will undoubtedly play a significant role here. It is known that fineness and twist can be expressed through a single parameter, the twist coefficient. The Koechlin’s twist coefficient α is defined as the product of the yarn twist and the square root of the fineness.
It was therefore suggested that the interplay between the two-ply and single yarns in a two-ply yarn could be expressed through the ratio of the twist coefficients of these two yarns (αs – two-ply yarn twist coefficient αj – single yarn twist coefficient). This ratio has already been used in Figure 10.
From Figure 10, it can be seen that the rate of change of the positive extreme of the polynomial function of the fourth degree of the x–y difference decreases with increasing ply twist. It can be seen to plateau after 500 1/m twists, which for a particular set of yarns corresponds to the ratio of αs/αj of 1.2 or greadter, see Figure 10. Gu and Miao 23 search for the optimal structure of two-ply yarn for its effective use in composites through the Krenchel fiber orientation factor, the ratio of two-ply and the single yarn twist, respectively. The optimum value of this ratio is set at 0.28 for the use of two-ply yarn in composites and 0.4 for the ratio of the corresponding twist coefficients. It further states that in textile practice, the twist coefficient ratio is in the range of <0.7; 1.4>.
Discussion
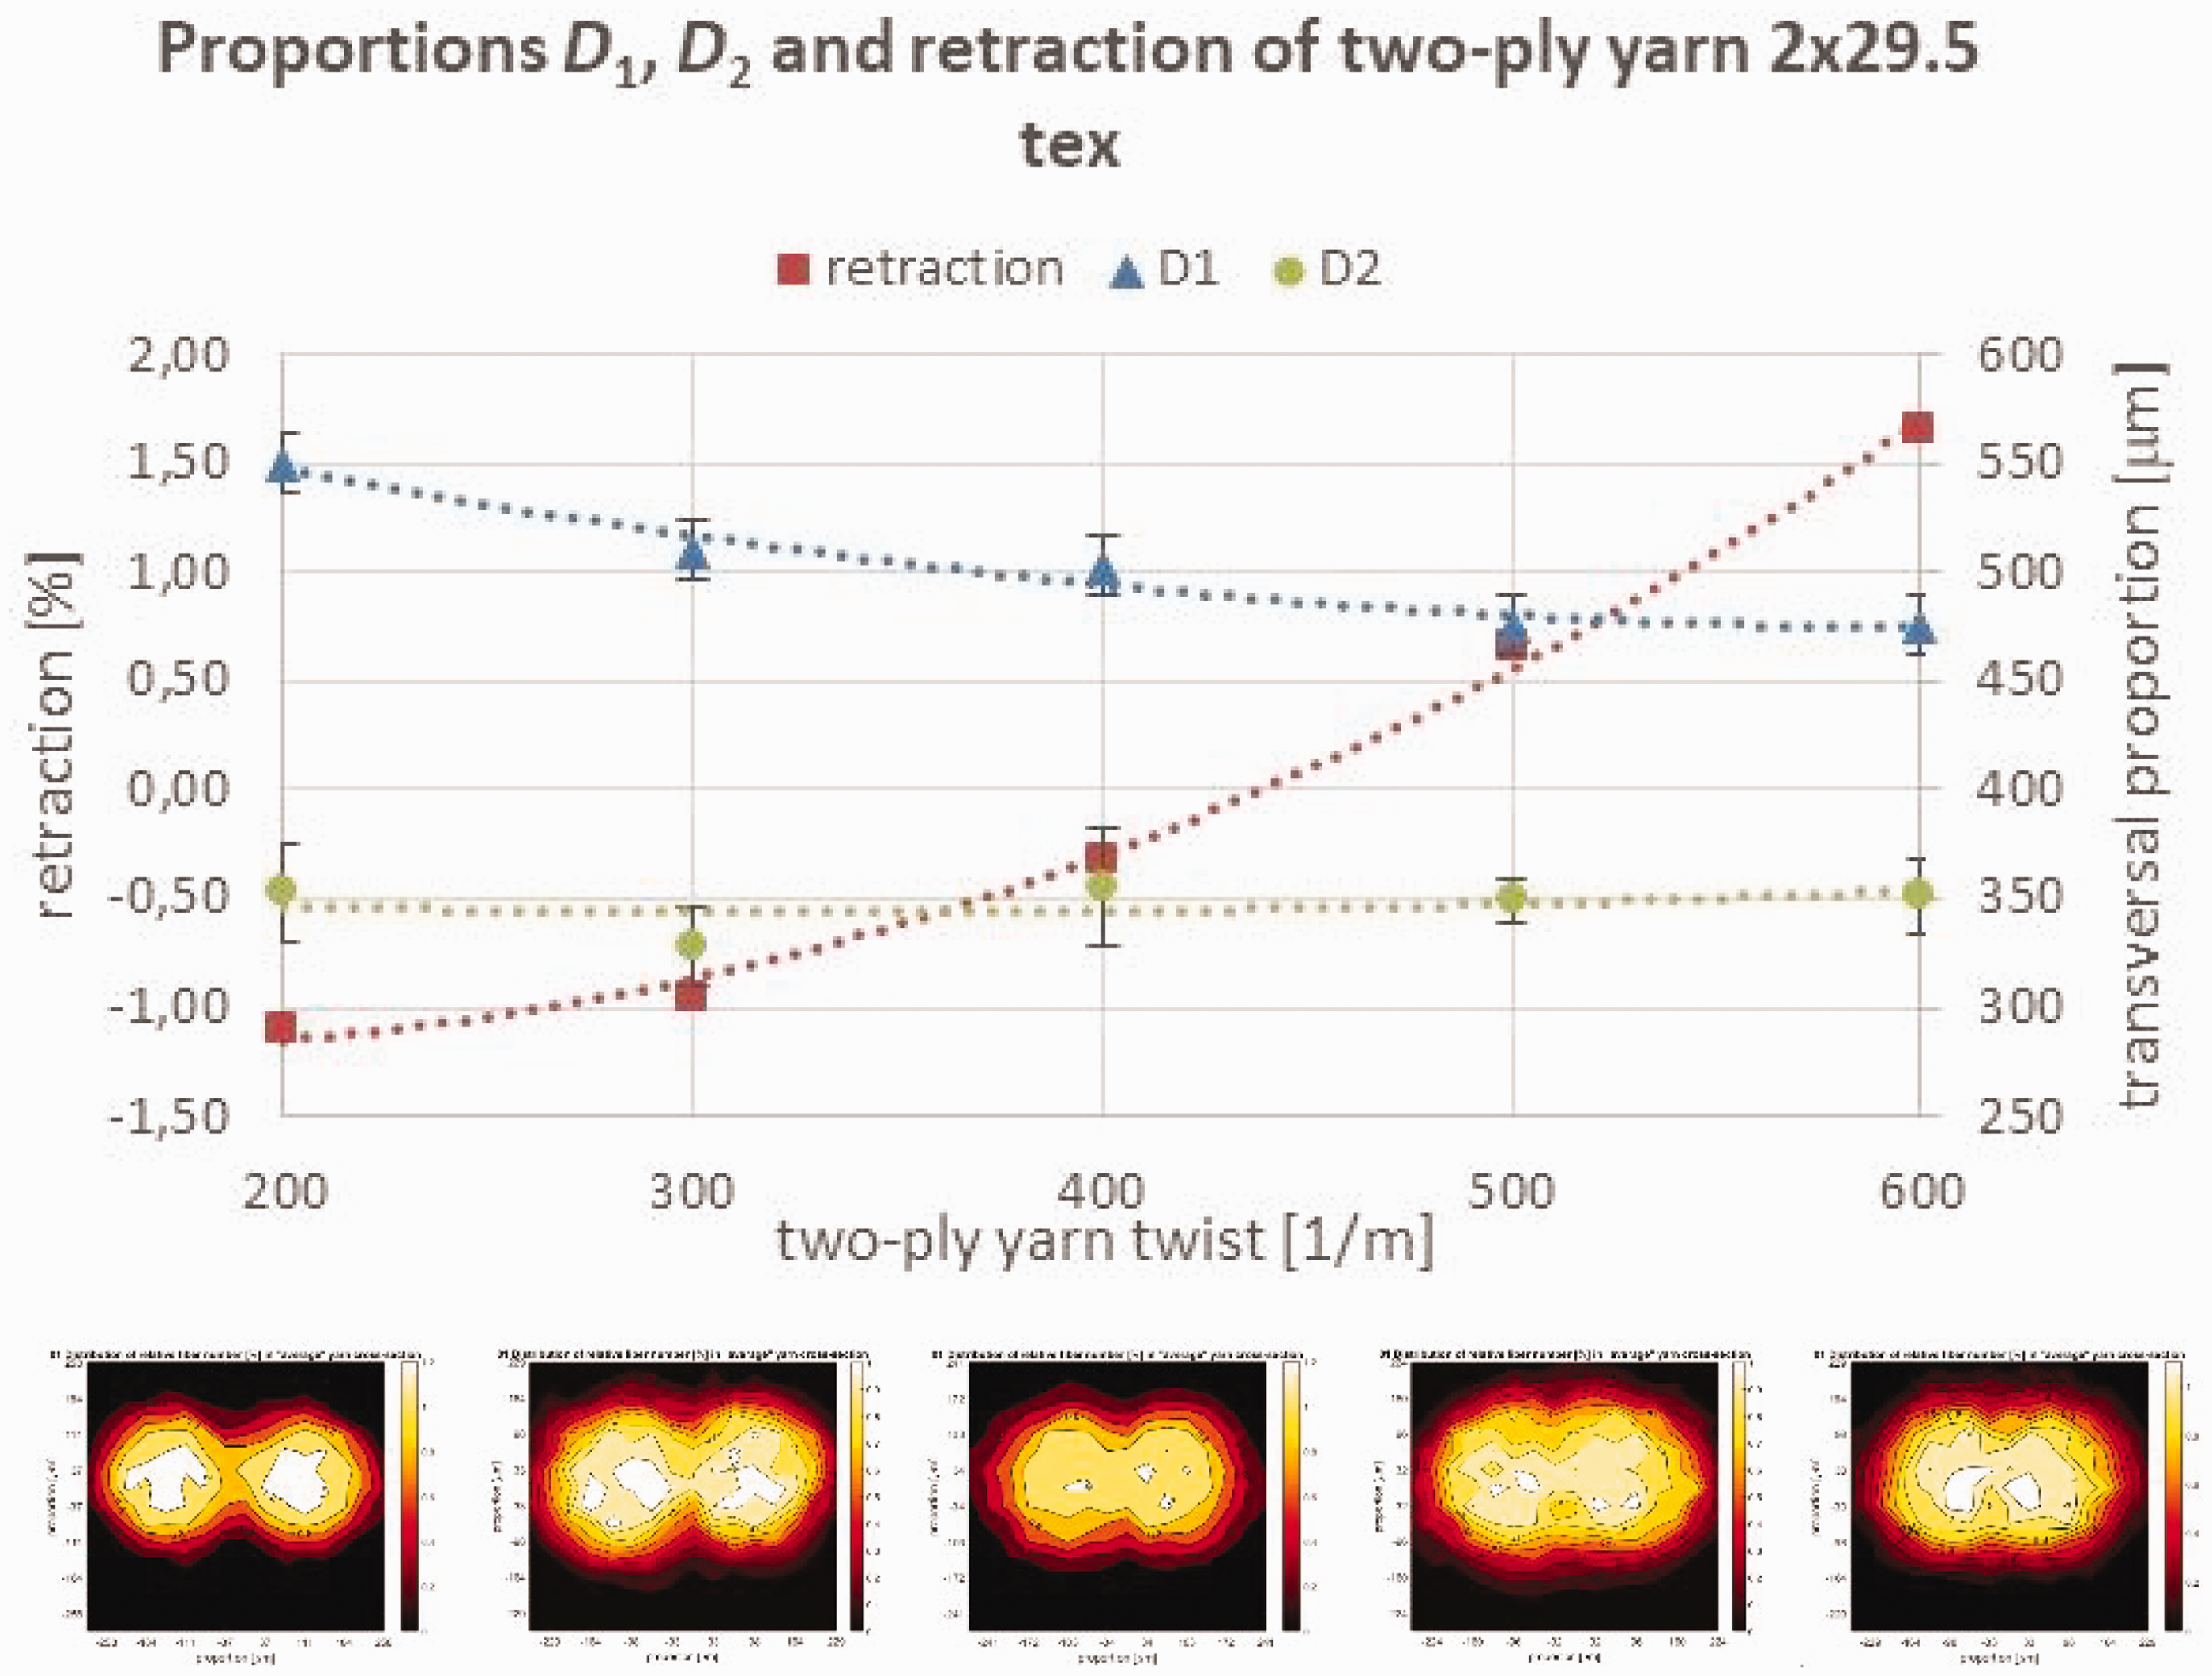
The method of iso-quantities was used to describe the internal structure of discrete formation with preferably a noncircular cross-section. The previous section goes deeper, and while applying this approach, it also analyses the behavior of two-ply yarn internal structure in different ply twists. The next plausible step is to compare contour graphs (Figure 8(a) to (e)) with the progress of two transversal proportions of two-ply yarn D1, D2, and the retraction (twist take-up) in dependence on ply twists, see Figure 11. The dimension D1 is defined as the real diameter of the smallest cylinder, in which the two-ply yarn can be placed and parameter D2 is the shortest perpendicular distance between the edges of the two-ply yarn cross-section. For more information, see Vysanska. 19
The theoretical section of this article interprets quite in detail (in Figure 1) the influence of counter-plying on ply yarn retraction, and comments on possible changes in the internal structure. Figure 11 links all the phenomena caused by the counter-plying. The progress of D1 is usually more convex than a concave shape, speaking about the opening and consequently closing structure of two-ply yarn with an increasing ply twist. The influence of counter-plying on the second proportion, D2, is minimal. However, these changes in the diameters of the two-ply yarn with increasing twist can also be expected in direct plying (two-ply yarn has the same twist direction as single yarns). Thus, the changes in the internal structure of the counter-plying tested two-ply yarn will most probably not affect the external geometry.
Counter-plying will definitely result in a more stable final product compared with direct plying.
The internal arrangement and changes in radial pressure in the two-ply yarn should theoretically also affect the mechanical properties. We will focus on the breaking strain, which should increase with increasing twist due to the accumulation of material (similarity with the spring). Examples are highly twisted two-ply yarns used as the only elastic element in bandages. 24 It is not only the problem of the breaking strain of counter-plied cotton yarns that is experimentally addressed in Ömeroglu. 25 Based on the experiments, the author concluded that the breaking strain also increases as the twists of single and two-ply yarns increase. The finer two-ply yarns in the fineness range of 2 × 16.4 tex to 2 × 29.5 tex were tested.
However, what happens at lower ply twists, (αs/αj ≤1.2), respectively, when the two-ply yarn structure opens up due to counter twisting, reducing the radial pressure, as shown in the previous graphs (see Figure 8(a) to (e)).
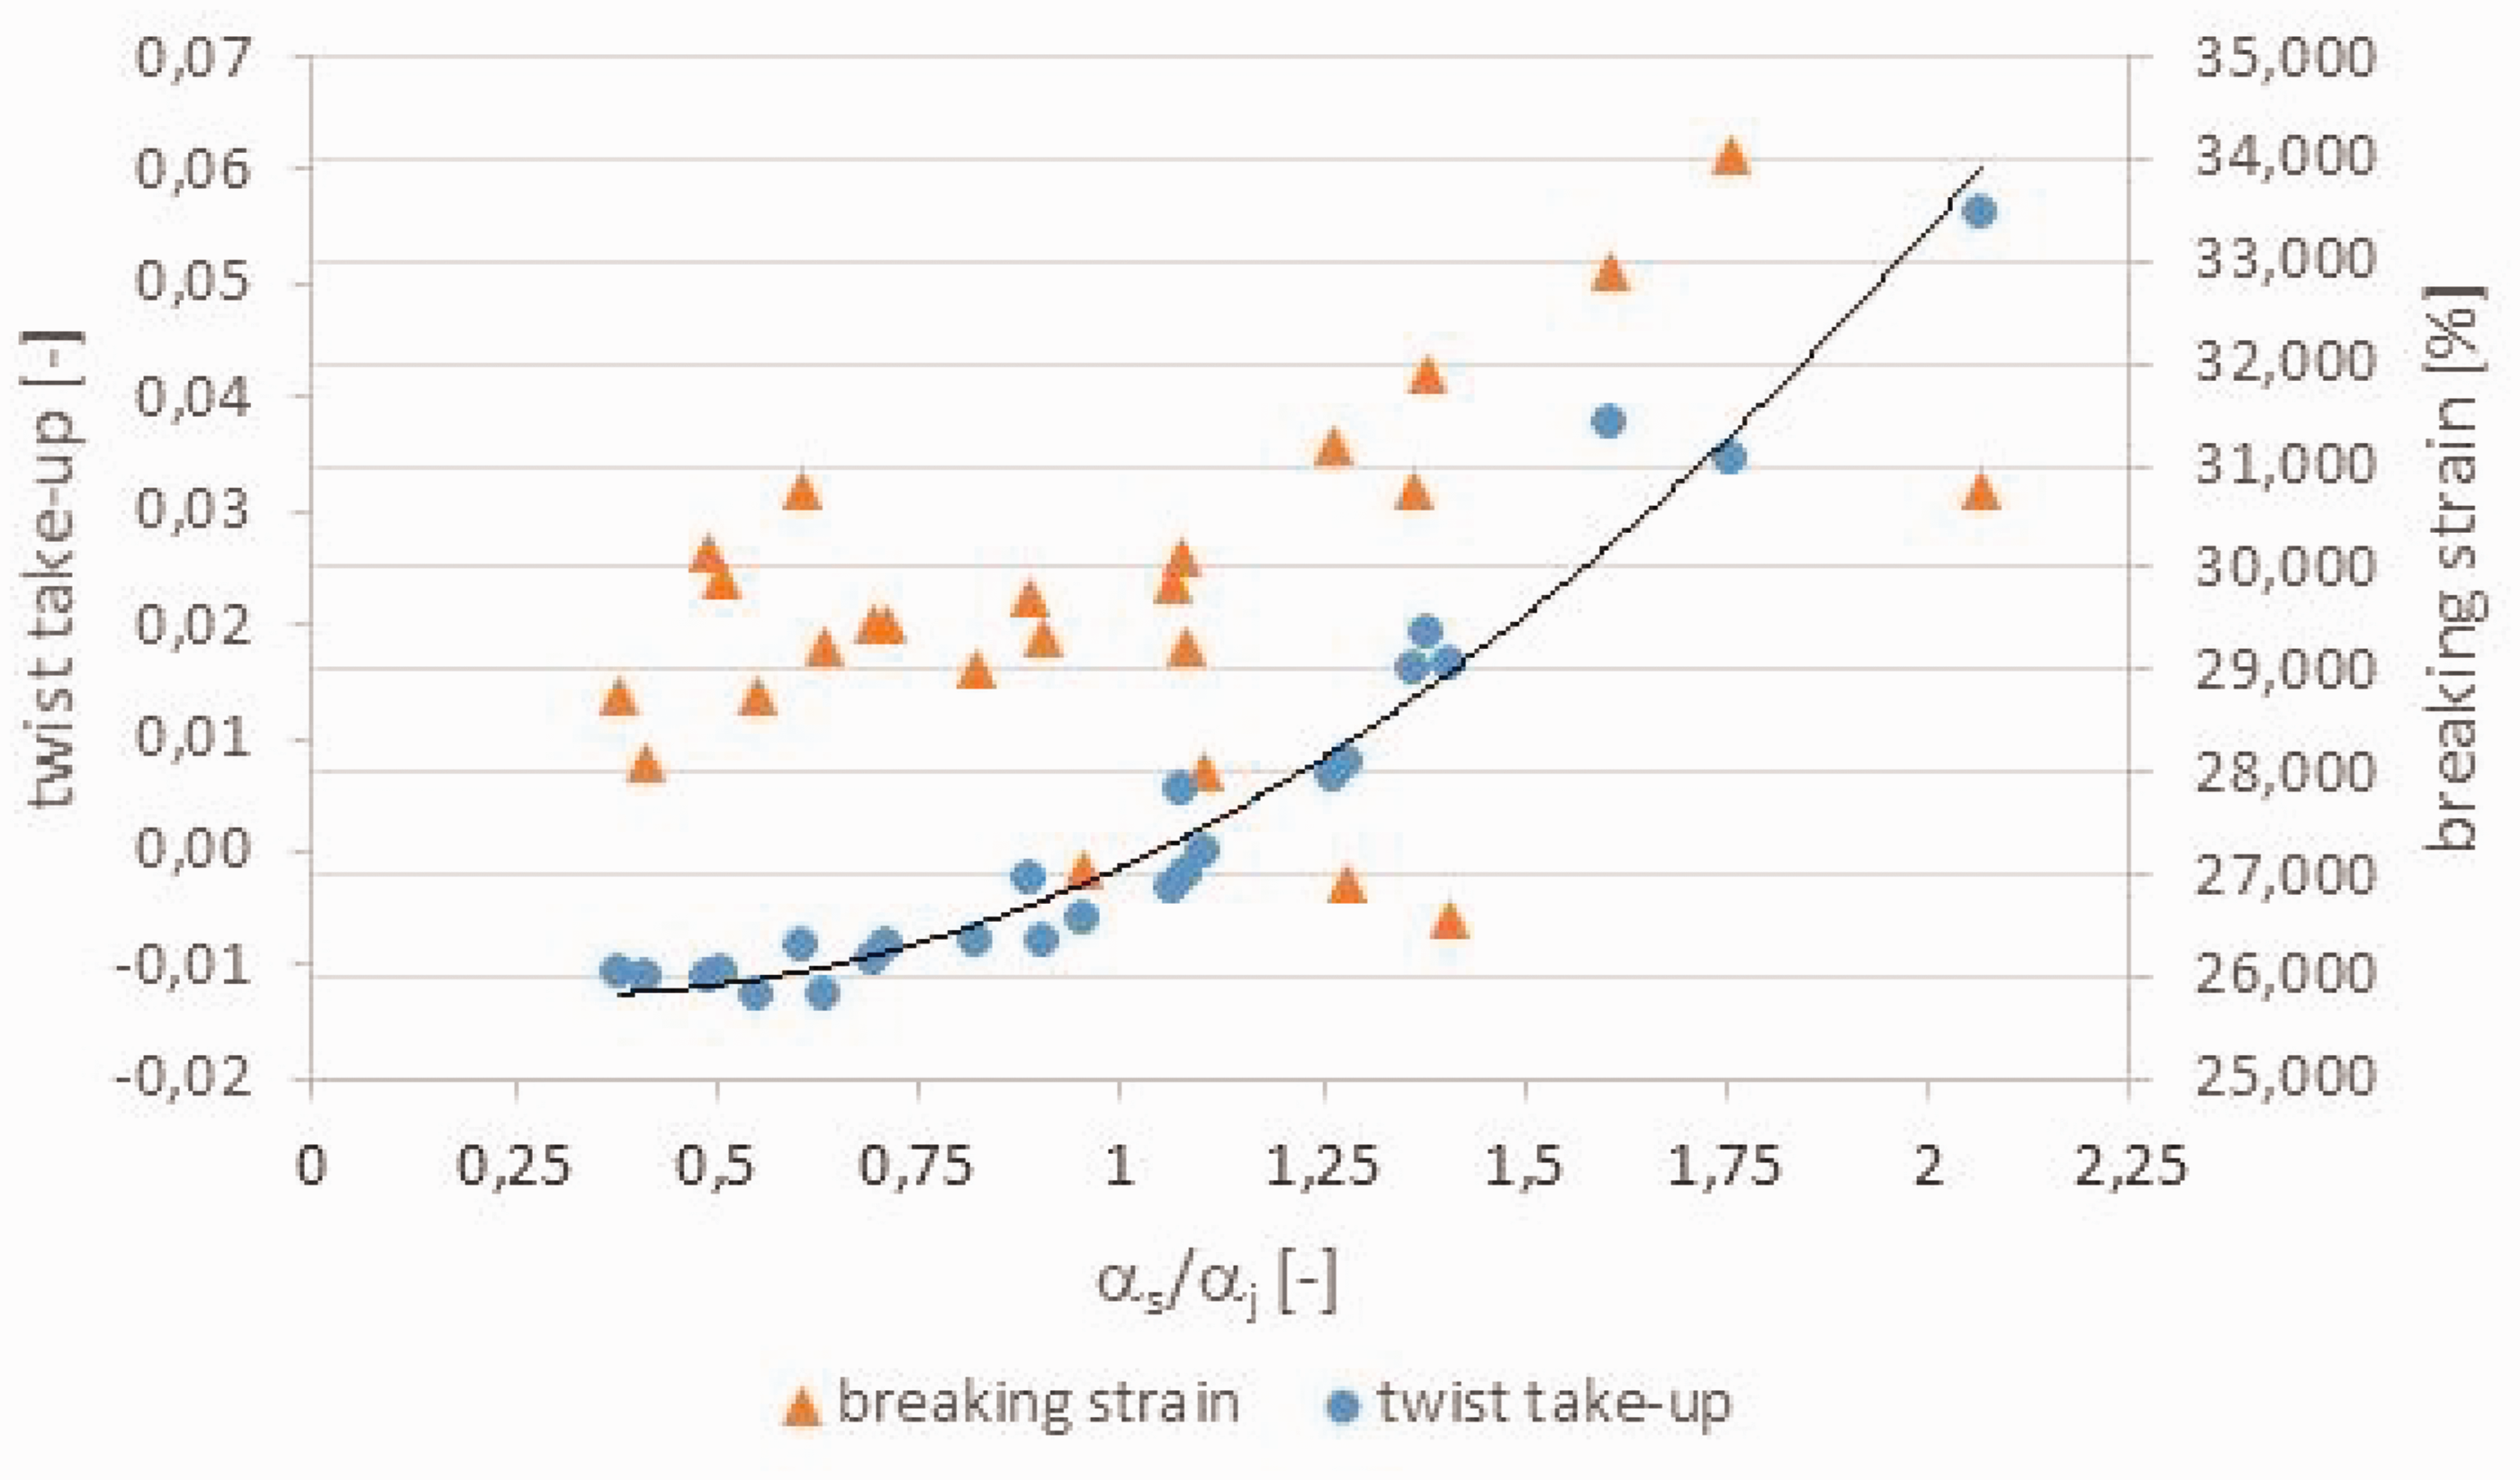
The breaking strain behavior of the two-ply yarn when twisted in the opposite direction is shown in Figure 12. For a better idea of the dependence of the breaking strain and retraction on the ratio αs/αj, the existing five 2 × 29.5 tex yarns have been supplemented with sets of 2 × 20 tex, 2 × 25 tex, 2 × 35.5 tex, 2 × 45 tex polypropylene yarns. Their breaking strain and retraction parameters are presented in Table 2.
The breaking strain and retraction of the added two-ply polypropylene yarns
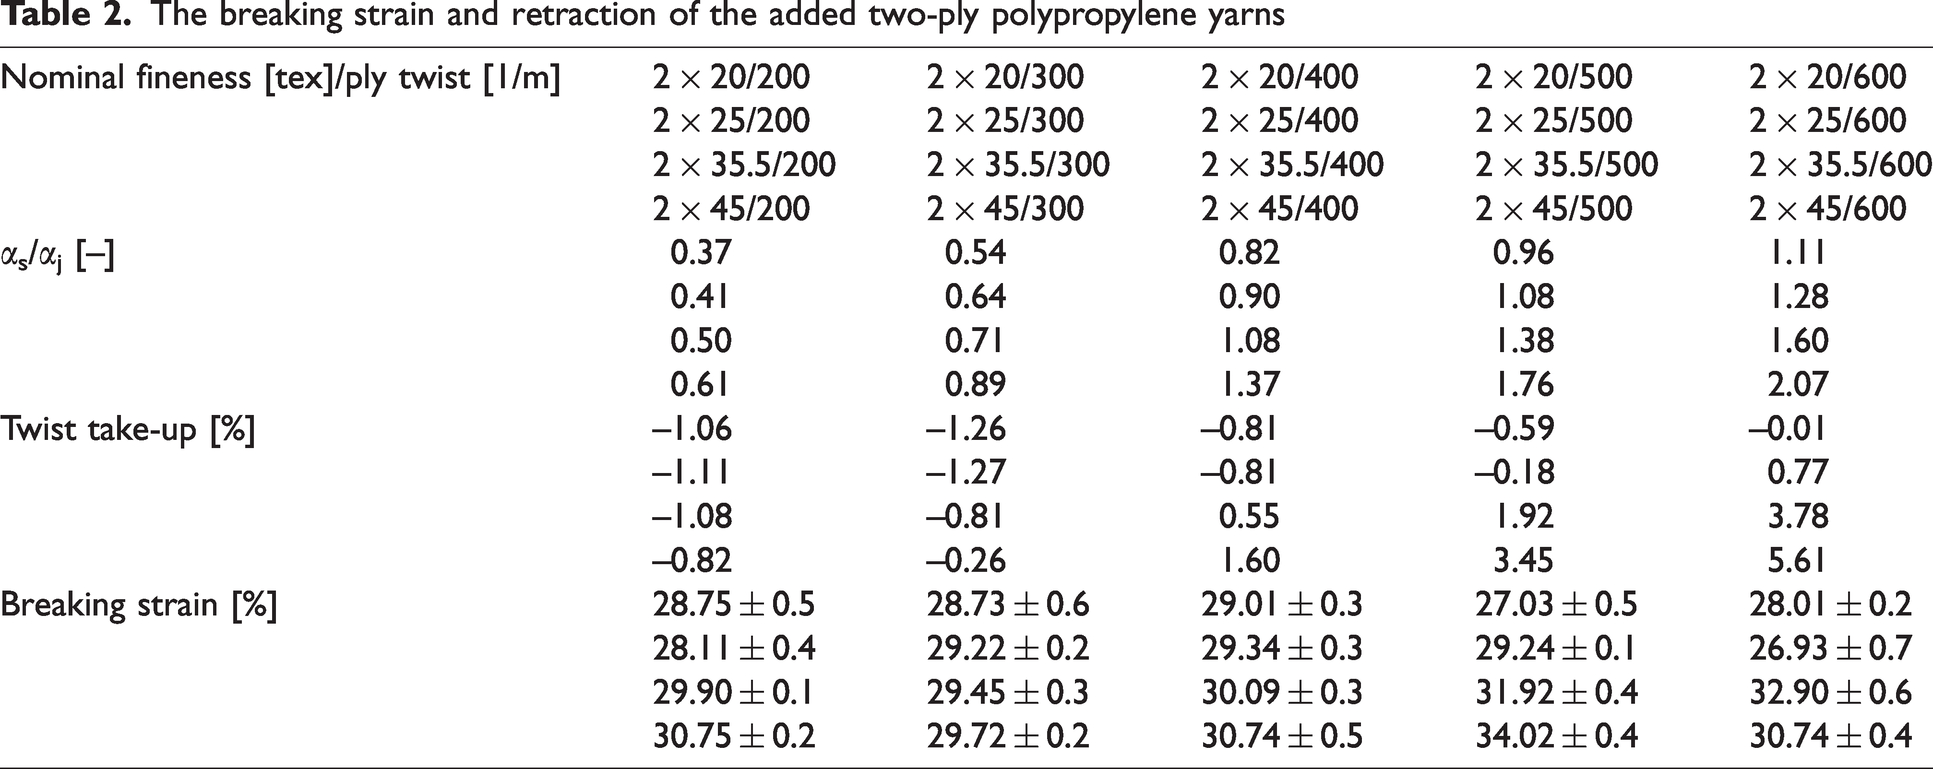
The breaking strain as a function of the twist coefficients ratio behaves as a nondecreasing function, that is, constant in the region of the relaxed structure (negative values of twist take-up, αs/αj ≤1.2, respectively), and increasing in the region of the tightening structure and formation material build-up, and increasing in radial pressure (positive twist take-up values).
Conclusions
There are several approaches to investigating fiber distribution in the free single yarn. Usually, the packing density is the most frequently used parameter for its description.
Two-ply yarn is characteristic for its noncircular shape and deformed cross-section of single yarns composing two-ply yarn. This is why the paper seeks a suitable tool for the two-ply yarn inner structure demonstration. The tool is defined as the so-called iso-quantities method, which allows for a description of not only the assembly of a number of fibers in the regular grid, but also of its differences in various ply twists.
The changes in two-ply yarn transversal proportions were introduced in the previous paper. 19 The presented paper goes deeper and extends the observation to the inner structure of the textile formation with the noncircular cross-section, and its external manifestations. At the same time, it links findings from the previous paper to actual facts, and creates a more complex imagination about the two-ply yarn made by counter-plying.
Thus, it can be said that thanks to iso-quantities, it has been found (proved) that the counter-plying causes a change in the distribution of fibers in the cross-section. This results in the occurrence of negative values of retraction, insignificant changes in the external geometry of the two-ply yarn, and a constant breaking strain behavior (see Figures 11 and 12). These manifestations appear only up to the values of the ratio αs/αj of 1.2 or less. After this limit, the extreme value of the x–y difference of the fiber distribution in the two perpendicular directions of the cross-section settles down (Figures 9 and 10), the breaking strain starts to take positive values (Figure 12), and the breaking strain of the two-ply yarn starts to increase with increasing ply twist (Figure 12). In the future, it will be interesting to look at the behavior of the internal structure of two-ply yarns through iso-quantities at lower finenesses, different types of materials, and an expanded range of ply twists. It is assumed that the phenomena described in this paper will not occur in directional plying, although it would be interesting to investigate this fact by iso-quantities.
Footnotes
Data availability
The data that support the findings of this study are available from the corresponding author on reasonable request.
Declaration of conflicting interests
The author(s) declared no potential conflicts of interest with respect to the research, authorship, and publication of this article.
Funding
The author(s) received no financial support for the research, authorship, and/or publication of this article.