
Abstract
Understanding how water droplets penetrate a textile fabric under forced conditions is of considerable interest for sportswear comfort and protective clothing, but also for processes such as inkjet printing. Investigations on the role of geometrical morphology in liquid transport face difficulties in identifying the relevant geometrical parameters at play. Here, X-ray tomography was used to investigate how the liquid distributes inside knitted fabrics when a droplet is squeezed onto its surface using a specifically developed device. It makes it possible to visualize the dynamics of the droplet's penetration and to analyze the final liquid distribution after releasing the compression. The three-dimensional liquid zone can be reconstructed with a specific method and qualitatively analyzed. Variation in hydrophobicity and porosity, characterized by the cover factor, is the main contributor to changes in liquid distribution among samples, by influencing in-plane spread, that is, on the surface, and/or transplanar spread, that is, penetration into the thickness of the fabric.
Fundamental knowledge of the interaction between a liquid and a fibrous material is important for many key processes in the textile industry and textile end uses. However, the complex mechanisms involved are still incompletely understood and are the subject of an active research field. Numerous partly standardized testing methods enable the evaluation of wetting or wicking properties of textile materials thanks to specific parameters. The in-plane liquid transport properties of fabrics may be easily tested by vertical or horizontal wicking tests using visual or gravimetric measurements. Two experimental techniques are commonly performed: the strip test and the spot test.1 –4 These tests are the basis for several standards (DIN 53924, AATCC 195, AATCC 197, AATCC 198, ISO 22608, ISO 9073-6). The transplanar transport properties of fabrics are less precisely evaluated by measuring, for example, the time required for liquid to infiltrate through the fabric (such as EN 20811, AATCC 198, ISO 9073-8, ISO 7198) or the quantity of liquid contained in the wetted area (gravimetric measurements,2,5,6 visual measurements,7,8 electrical resistance measurements,9 –11).
Predicting imbibition in a porous media is usually done by referring to Darcy’s law or the Lucas–Washburn equation.12,13 The parameters characterizing the topographic porous network are permeability for the first law and an equivalent porous radius for the second. Even though these equations generally reflect the time-dependent behaviors observed, the determination of the topographic parameters (pore tortuosity, interconnections, homogeneity, dimensional dispersion, regularity, …) from direct observation of the pore geometry is arduous.14,15
The complexity of the investigations on the role of geometrical morphology in predicting liquid transport are exemplified for textile materials as classical porous media.1,5,16,17 Indeed, most fabrics involve several length scales from sub-micrometers to millimeters that are all relevant to wetting and wicking mechanisms. Common parameters considered can be listed: material (composition), shape of the fiber, twist of the yarn, yarn structure, yarn count, hairiness, fabric weight, thickness, porosity, stitch length, cover factor,3,4 kind of knit, chemical or physical treatments. Some of these parameters are dependent on the others, which increases the complexity of investigating their influence on wetting properties. An additional challenge for porous substrates formed by an assembly of particles (fibers, sand) is the change in pore geometry during penetration due to swelling or particle movement induced by capillary forces. 18
Many textile processes, such as sizing, coating, finishing and printing, consist of forcing the liquid into the textile fabric. Many other applications involve this process. For example, as superhydrophobic textile surfaces are of considerable interest for many applications, the robustness of this property under mechanical constraints needs to be guaranteed. It can be tested by squeezing a droplet under the superhydrophobic surface. 19 More common examples concern wear comfort, especially for evacuation of sweat by compression sportswear or protective clothing. 20 Textile printing implies projecting droplets onto textile surfaces.15,21 In this case, the understanding of the phenomena involved has to be improved for ecological and economic considerations (for silver-based inks, for example).
For both spontaneous and forced transport mechanisms, a common problem limiting understanding is the lack of information about the microscopic pore geometry. The mechanisms operating at both the macro- and microscales cannot be understood based on traditional measurement techniques. To visualize liquid distribution in an opaque fabric, Bencsik et al. 22 employed nuclear magnetic resonance. The distribution of liquid through the textile thickness was analyzed, but the in-plane distribution within the textile was not considered. High-resolution X-ray imaging enables the visualization of the pore space, 23 the interfaces24,25 and the water position during spontaneous wetting in a textile structure.26,27 Commercial X-ray computed tomography (µCT) scanners provide broader information in three dimensions on subsurface liquid transport phenomena.28 –31
Based on X-ray imaging and tomography, this paper presents a new method to investigate forced wetting inside knit fabrics. The relevance of this method is illustrated with hydrophobic textile structures by analyzing the role of hydrophobicity and of different geometrical knit parameters on liquid distribution. Forced wetting is performed by squeezing a water droplet on the textile surface using a newly developed specific loading cell. Two specific scenarios have been defined: two-dimensional (2D) imaging (projection) for a vertical view during the compression–decompression cycle of the textile and three-dimensional (3D) scanning (tomography) of the liquid distribution inside the fabric after decompression.
Materials and methods
Fabric samples
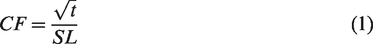
Various knitted fabrics were specifically produced to analyze the influence of levels of hydrophobicity and porosity, that is, in the present case the inverse of the cover factor. The cover factor (CF) is defined as the ratio of the yarn diameter and the stitch length (SL) in centimeters per stitch. The yarn diameter is proportional to the square root of the yarn count (t) in tex, and therefore the cover factor can be simplified as follows
32
:
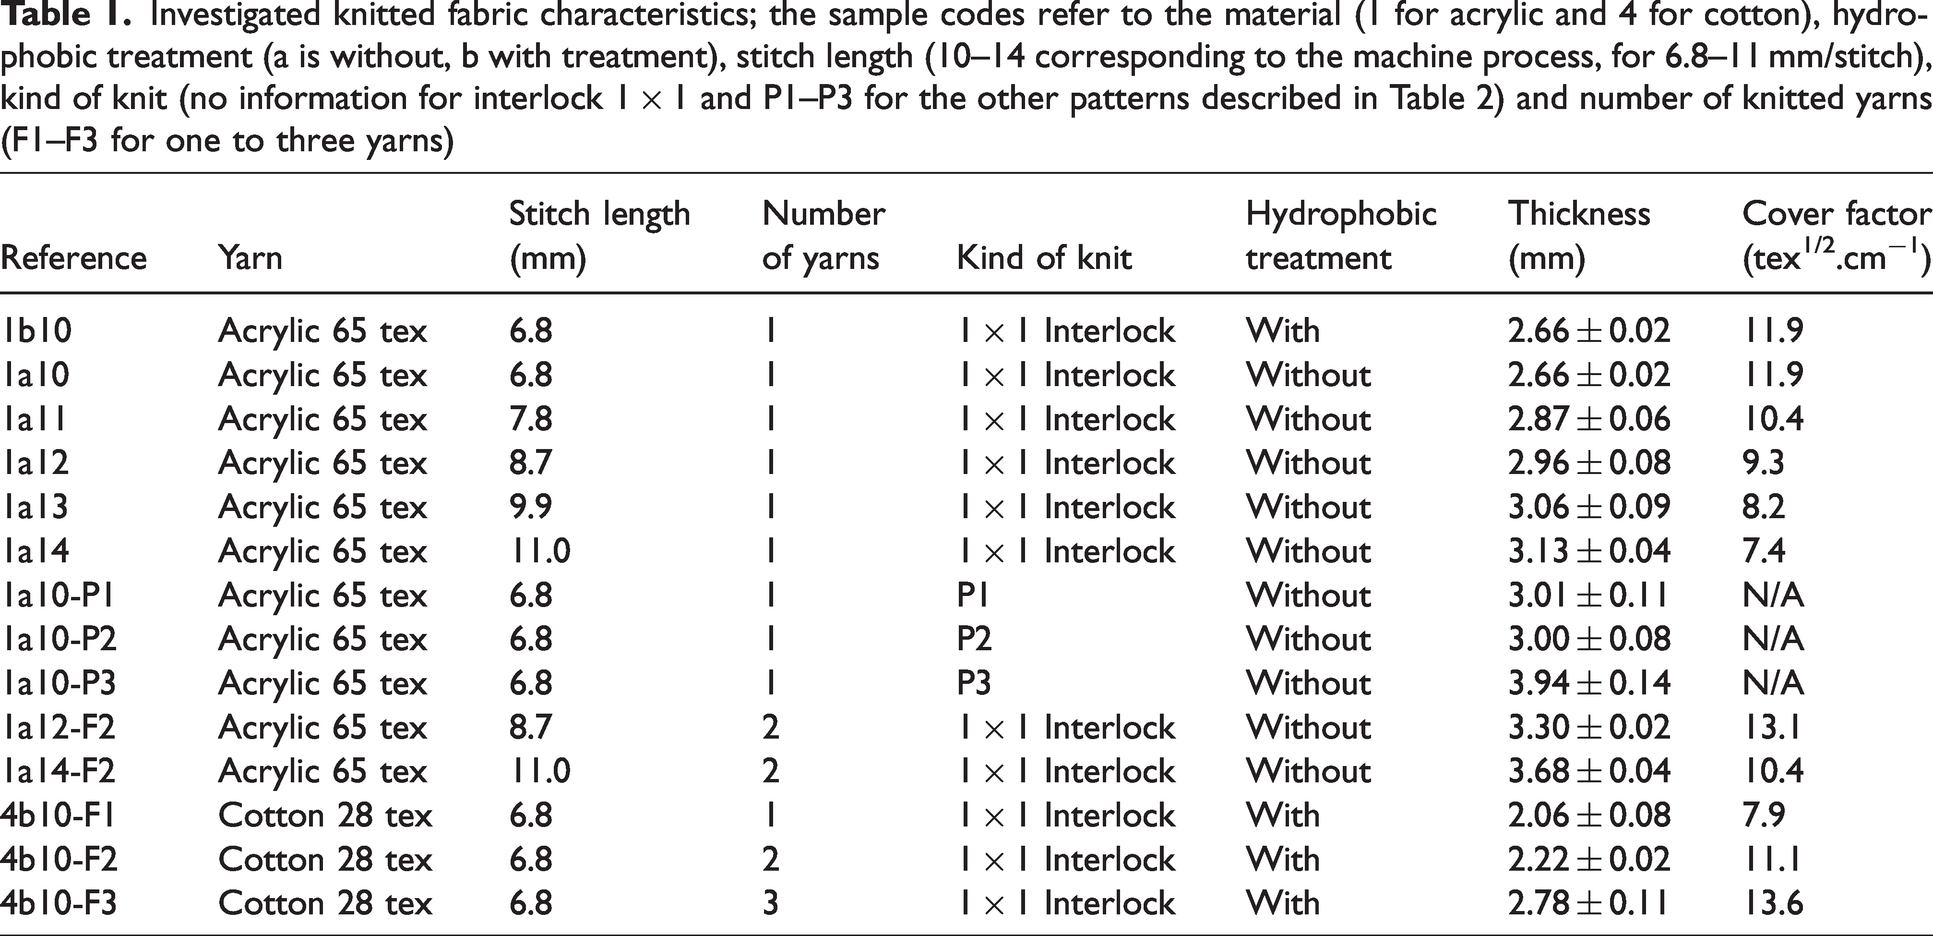
A Jacquard flat knitting machine (Stoll ADF BW 32, Reutlingen, Germany) was used, varying one parameter at a time to enable systematic comparison (Table 1):
Investigated knitted fabric characteristics; the sample codes refer to the material (1 for acrylic and 4 for cotton), hydrophobic treatment (a is without, b with treatment), stitch length (10–14 corresponding to the machine process, for 6.8–11 mm/stitch), kind of knit (no information for interlock 1 × 1 and P1–P3 for the other patterns described in Table 2) and number of knitted yarns (F1–F3 for one to three yarns)
the stitch length, that is, the yarn length necessary to form a stitch, modifies the cover factor value for a given kind of yarn and kind of knit (Equation (1));
the number of yarns (one, two or three) allows the cover factor to be varied by changing the total yarn count (Equation (1)), since the yarns are knitted together as a thread at constant stitch length;
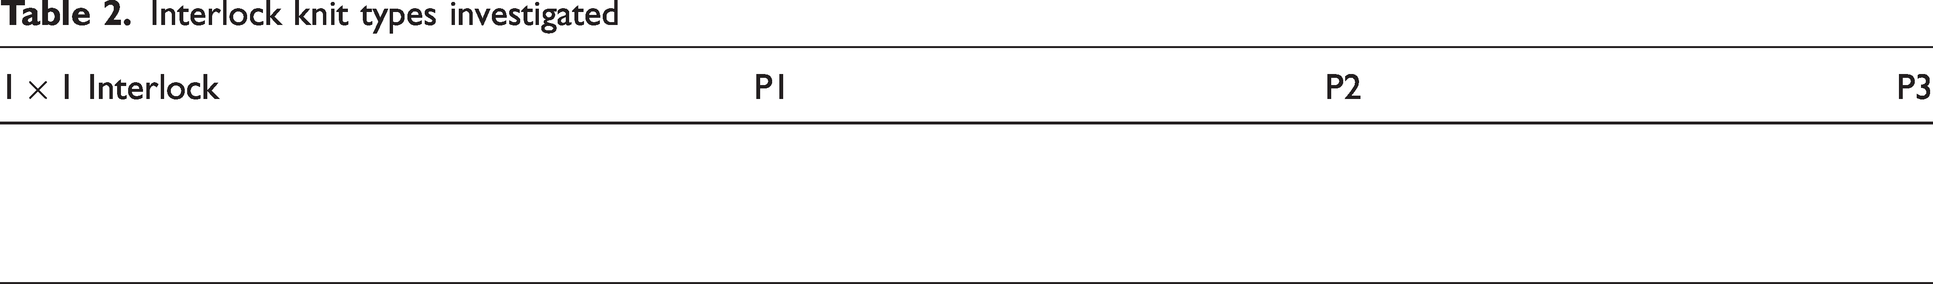
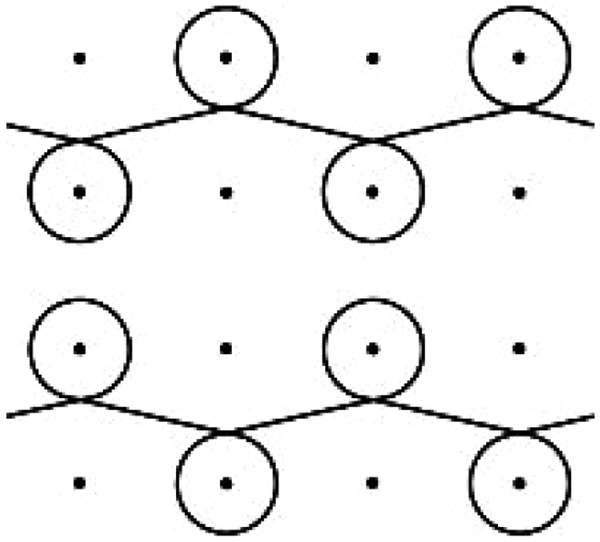
Interlock knit types investigated
some samples were given a hydrophobic treatment, as indicated in Table 1.
A preliminary study using fabrics made from multi-filament polyethylene terephthalate (PET) yarns failed to retain liquid and the droplet was not visible on the µCT images after compression. Therefore, all the fabrics used were made from staple fiber yarns and presented superficial hairiness. Most of the knitted fabrics investigated were made from an acrylic ply yarn with a count of 65 tex (Table 1). The other fabrics were made from a 28 tex cotton yarn.
The chosen knitted fabrics had sufficient thickness, that is, at least 2 mm, and density to be able to characterize the 3D water distribution by X-ray. The kinds of knits were based on interlock, and most of the fabrics investigated were interlock 1 × 1 because this pattern is very common and gives a very dense structure. The other patterns (P1–P3) were derivatives of interlock 1 × 1, but with different structures.
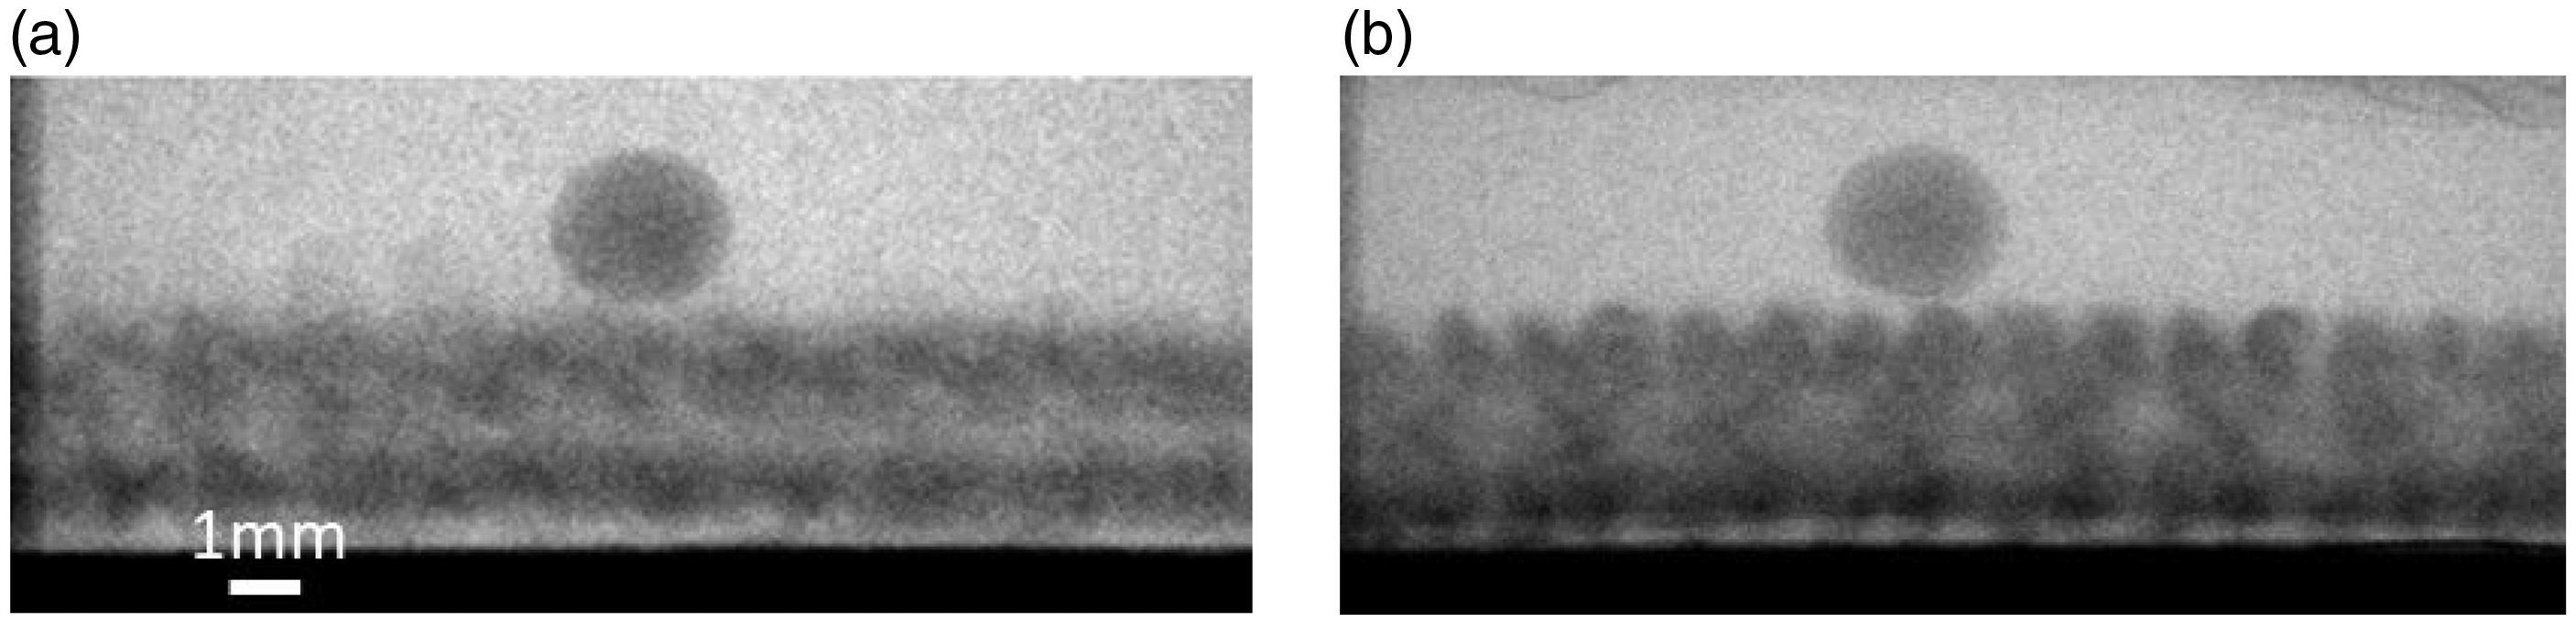
Some fabrics are functionalized by a chemical hydrophobic treatment (Table 1), obtained by a commercial C6-based treatment (4% wt Nuva® N1811, Archroma). The process used is bath and padding. This treatment modifies (i) acrylic fabrics, which are initially slightly hydrophobic, to become strongly hydrophobic, and (ii) cotton fabrics, which are initially hydrophilic and hygroscopic, to become hydrophobic. In terms of the water contact angle on the knitted fabrics, no difference can be observed before or after this treatment for spontaneous wetting due to yarn hairiness (Figures 1(a) and (b)). However, in terms of capillary rise in treated and non-treated yarns, a significant different quantity of liquid uptake can be observed for a liquid composed of 50% water and 50% ethanol (Figure 1(c)).
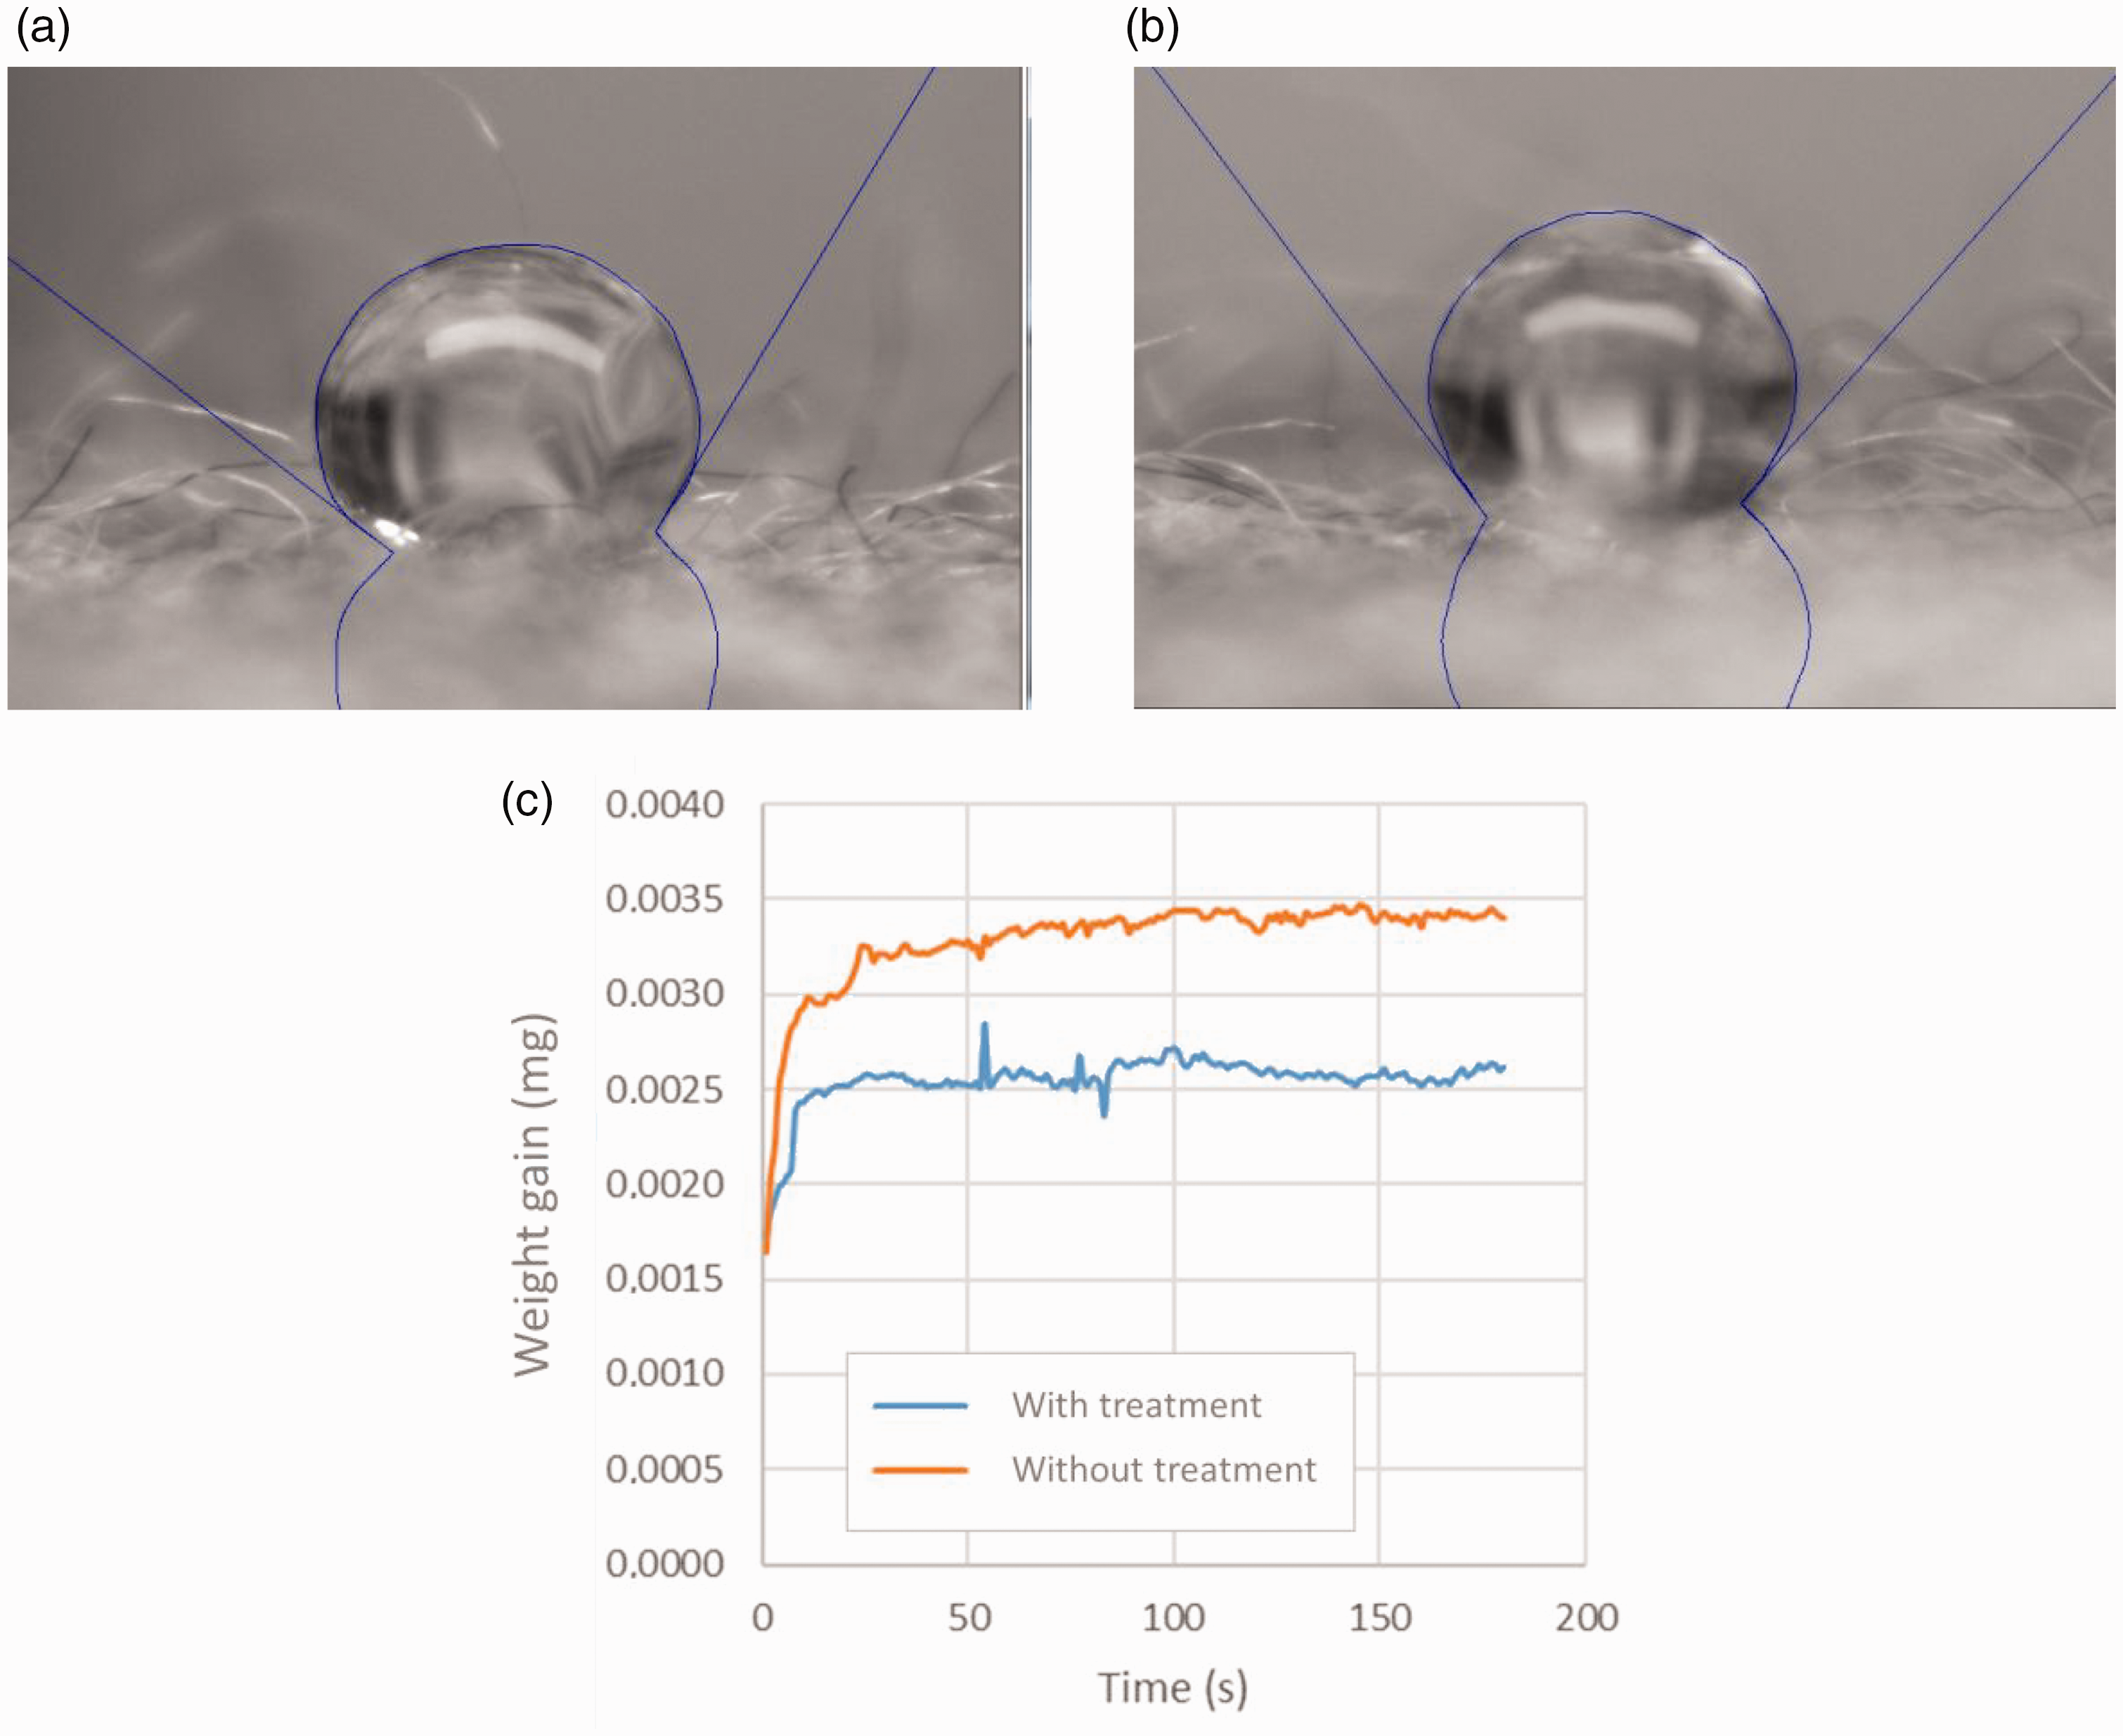
Droplet (a) without and (b) with hydrophobic treatment for acrylic knitted samples, respectively 1a10 and 1b10 (Table 1), and (c) capillary rise for the corresponding yarns.
X-ray microcomputed imaging and tomography
Computerized tomography is a layer-selective radiographic process, by which a 3D image can be reconstructed with the aid of a number of sectional radiographs. Each projection corresponds to the integration of the attenuation coefficient along the X-ray beam and, by combining the data from different angles, it is possible to reconstruct a 3D image of a sample. The µCT scanner used for our investigations was an industry tabletop model (µCT 80) from Scanco Medical AG (Brüttisellen, Switzerland). The experimental settings are given in Table 3.
Experimental settings for X-ray tomography and imaging
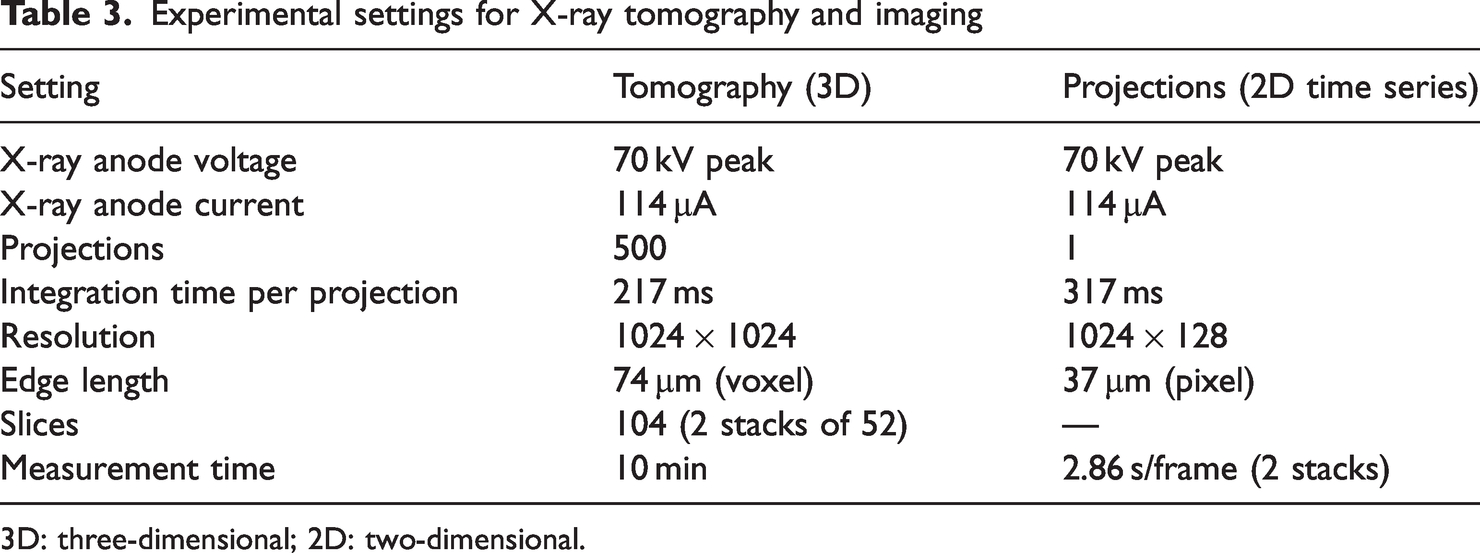
3D: three-dimensional; 2D: two-dimensional.
The laboratory is air-conditioned at a temperature of 20°C ± 2°C and a relative humidity of 65% ± 5%. Due to heat generation by the X-ray tube, the climate within the instrument is 23.5°C ± 1.5°C and 57% ± 5%, respectively.
Since computed tomography is time-consuming, it is only suitable for observing slow dynamic processes. Therefore, the experiment was divided into two phases. In the first phase, which consisted of compression and release, a time series of individual projections was used to obtain an image every 3 s. In the second phase, tomography was used to get a 3D visualization of the liquid distribution inside the fabric after decompression.
Specific compression device
To support the samples and generate the compression inside the µCT scanner, a motorized holder was designed and manufactured (Figure 2). It is based on a device previously designed to study forced wetting. 19 The new design had to provide the specific conditions needed for the tomography, in particular, material transparent to X-rays and the dimensions of the scanner chamber, that is, 140 mm in height and 75 mm in diameter, which limited the size of the device and therefore the choice of the sensors and actuators.
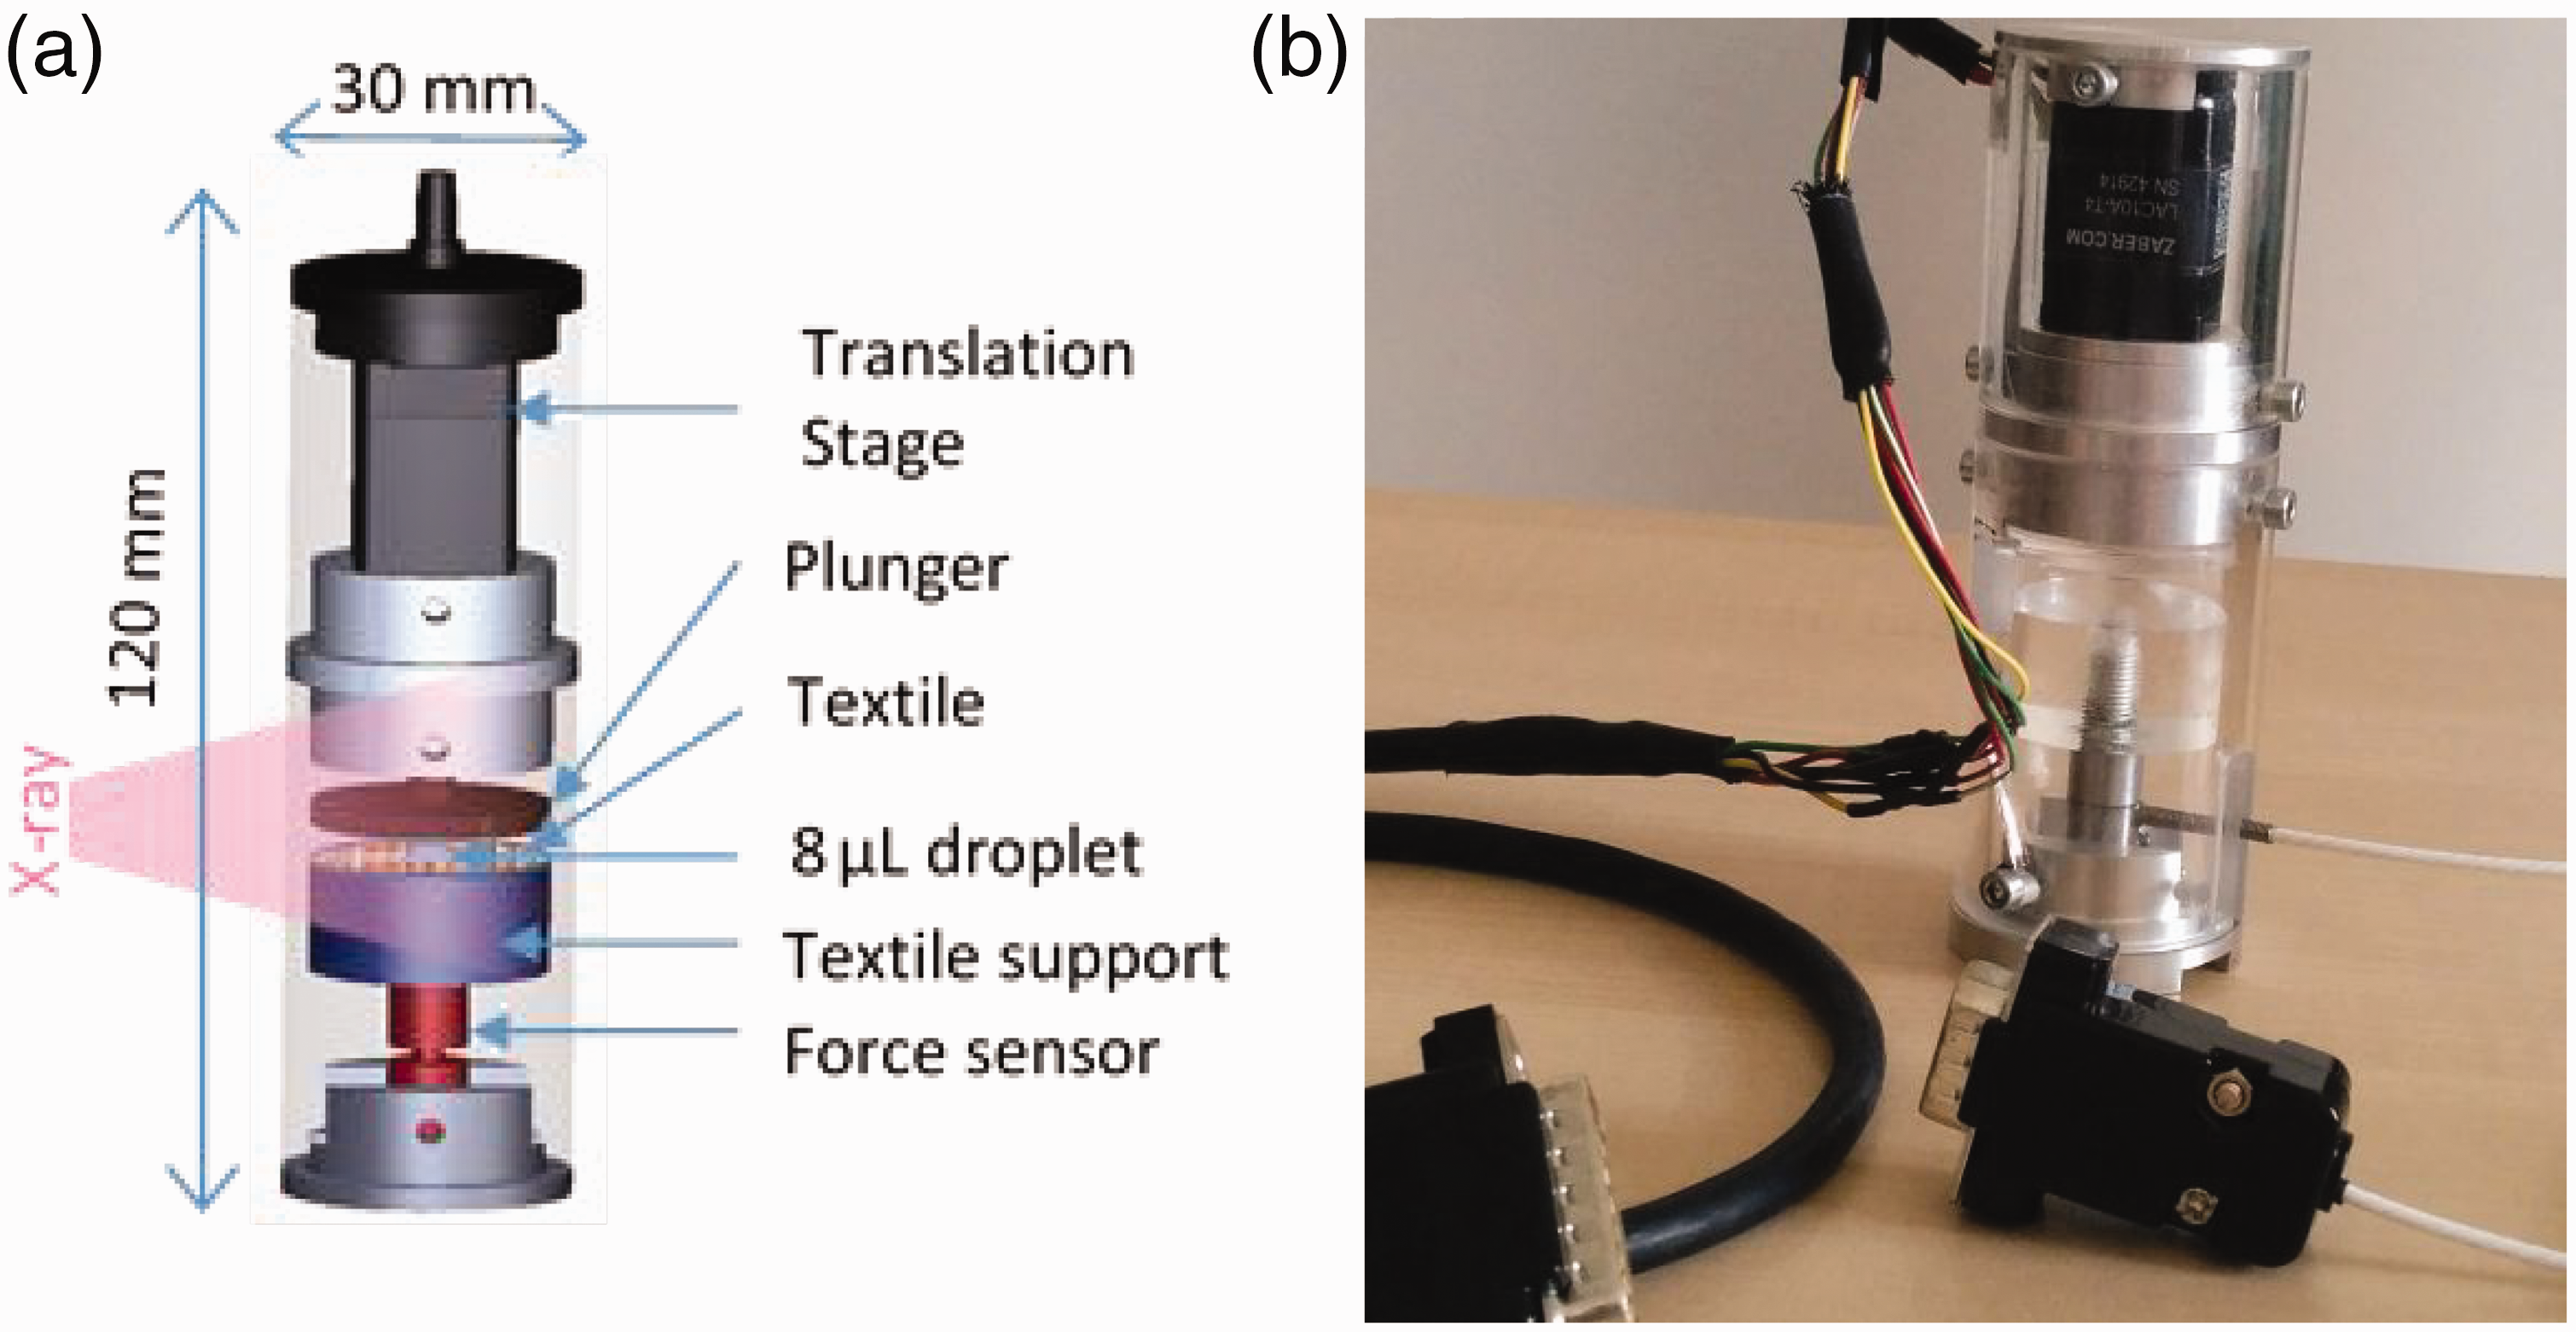
Developed compression device: (a) computer-aided design view and (b) picture of the system.
Basically, in the form of a cylinder–piston combination, the holder was equipped with a linear actuator with a 20 mm maximum stroke and a speed of 0.05 mm.s−1 (LAC10A-T4-MC04, Zaber, Canada) and with a miniature load cell with a maximum force of 5 N (XFTC310-5N, TE Connectivity, Switzerland). A circular plunger with a surface area of 2 cm2 was fixed on the translation stage. To reduce adhesion with the droplet, the plunger was covered with a low surface tension polytetrafluoroethylene (PTFE) film.
The installation setup allowed the movement and the maximum compression force exerted on the droplet/sample to be controlled. The actuator had a resolution of 0.024 µm and a unidirectional accuracy of 10 µm. The acquisition system was an XMCB-1 controller (Zaber, Canada), used both to move the actuator according to the instructions and to acquire the signal from the load cell. Linked to a CDM11 signal conditioner for full bridge sensors, the load cell had a full scale output of 105.7 mV, but the final resolution of the force acquisition was of 0.025 N in the range of 0–10 V. The normal force and plunger displacement with time were recorded.
All the measurements were processed with a maximum force applied of 2 N corresponding to a pressure of 10 kPa under the whole surface of the plunger.
To provide X-ray access to the droplet/textile interface, the cylinder and the plunger were made of poly(methyl methacrylate) (PMMA), which has low X-ray attenuation properties for the reduction of the number of artifacts.
Inserting the compression device inside the µCT scanner in order to perform a time series of projections during compression–decompression required careful placement of the wires (connected to the actuator control unit and the acquisition unit) to avoid visualization problems or mechanical blockage. The compression device had to be installed in the µCT scanner so that the window was facing the scanner door in order to be able to deposit the water droplet.
Measurement protocol
In order to have clean borders, the textiles were cut by using a laser for cotton samples or ultrasound for acrylic samples. The samples of 25 mm in diameter was affixed with a thin double-sided adhesive tape onto the support (Figure 2(a)). Then, the compression device was carefully introduced into the scanner chamber.
A droplet of deionized water was deposited onto the textile surface through the window using a dosing pipette. The volume, set at 8 µL, was a compromise among a relevant amount of water, a negligible gravity effect and to cover at least an elementary pattern of the structure. In fact, the droplet diameter is 2.5 mm, which is in the same range of order than the course or wale lengths for a stitch length of 11.0 mm (with approximately 2 mm/course and 2.2 mm/wale) and larger for a stitch length of 6.8 mm (with approximately 1 mm/course and 1.7 mm/wale).
Due to the quite large fabric thickness (Table 1), this amount of water does not reach the bottom plate (textile support in Figure 2(a)) during compression.
Firstly, a time series of projections was recorded in a vertical median plane during compression of the droplet: this is the 2D projection view. The orientation of the fabric relative to the projection view can be parallel to the course or wale directions. Immediately after the compression test, a 3D tomographic acquisition was processed all around the cylinder. For each fabric investigated, at least three samples were tested.
The complete setup mainly provided 2D visualization of the droplet compression/decompression and a tomographic view of the water location after compression (Figure 3). The force/displacement curves obtained are not interpreted in this study.
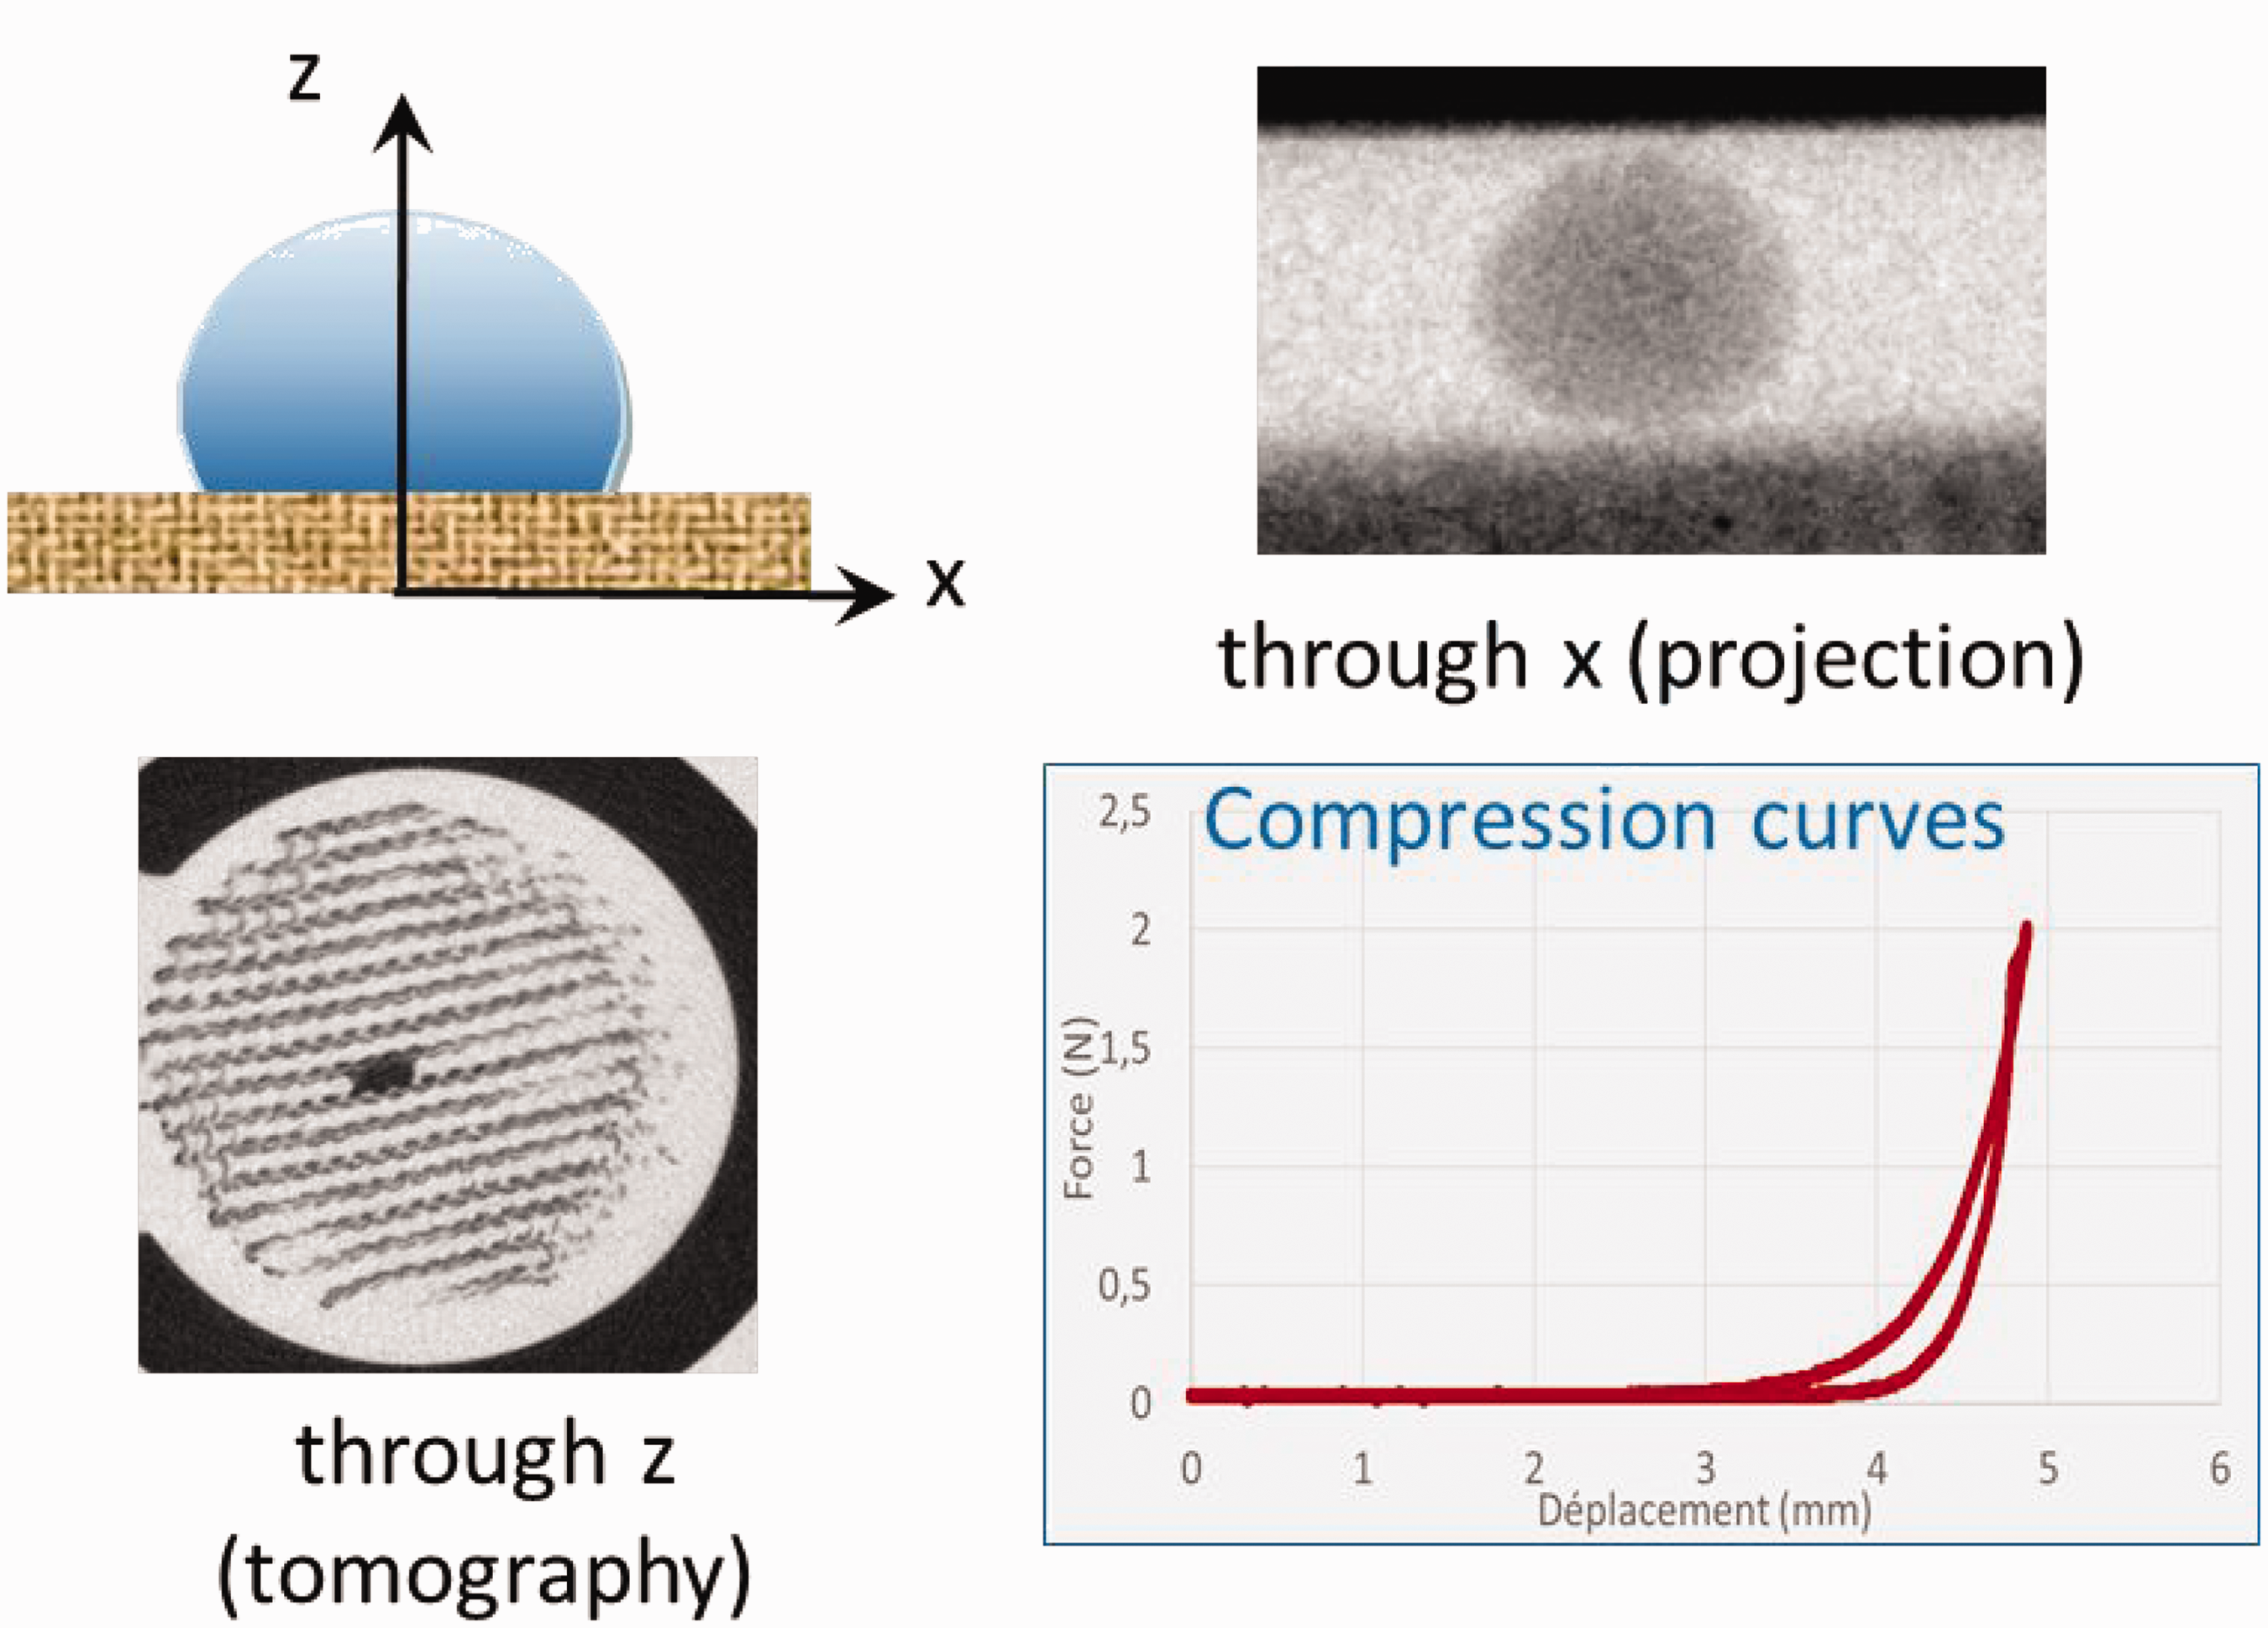
Schema of data obtained from the compression device developed.
Results
The first part of the results exposes the method developed to analyze the different measurements obtained from the X-ray imaging consisting of a film (2D projections) and 104 slices (images from tomography) per sample. The second part presents the results from the tests conducted on the 14 distinct knits to consider the influence of several textile parameters (Table 1).
Droplet visualization and method of analysis
Two-dimensional visualization of the squeezing dynamic
A dynamic 2D projection offers a visualization of the water migration during a compression–decompression cycle. The location of the liquid in Figure 4 can be tracked by the contrast difference during the test. The depth of the droplet penetration during the test and the profile of the liquid distribution through the textile thickness after the test can be studied.
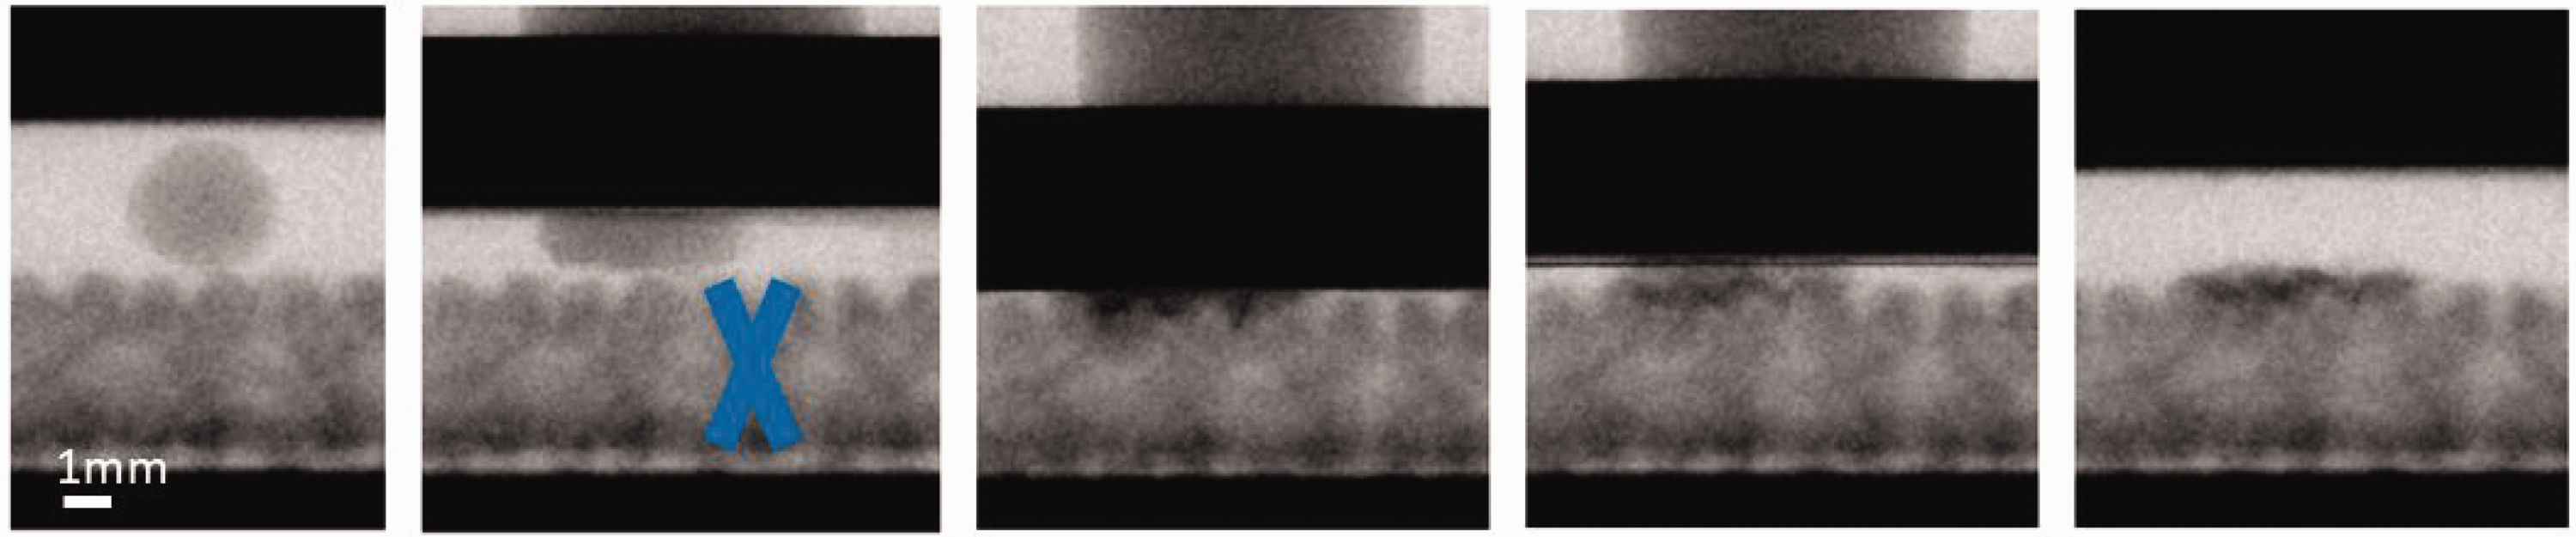
Sequences of compression–decompression of a water droplet on a textile surface (example of sample 1a14-F2 Table 1; color online only).
The X shape formed by the loops of an interlock knit, when observed in the wale direction, can be discerned clearly in Figure 4 (drawn in blue in the left-hand picture). 33
Three-dimensional visualization of the liquid distribution after compression
The tomographic measurements give an image of the slices of the wetted samples every 74 µm. The wetted zone can be located in each slice by contrast in the grey scale (inside the blue circle in Figure 5).
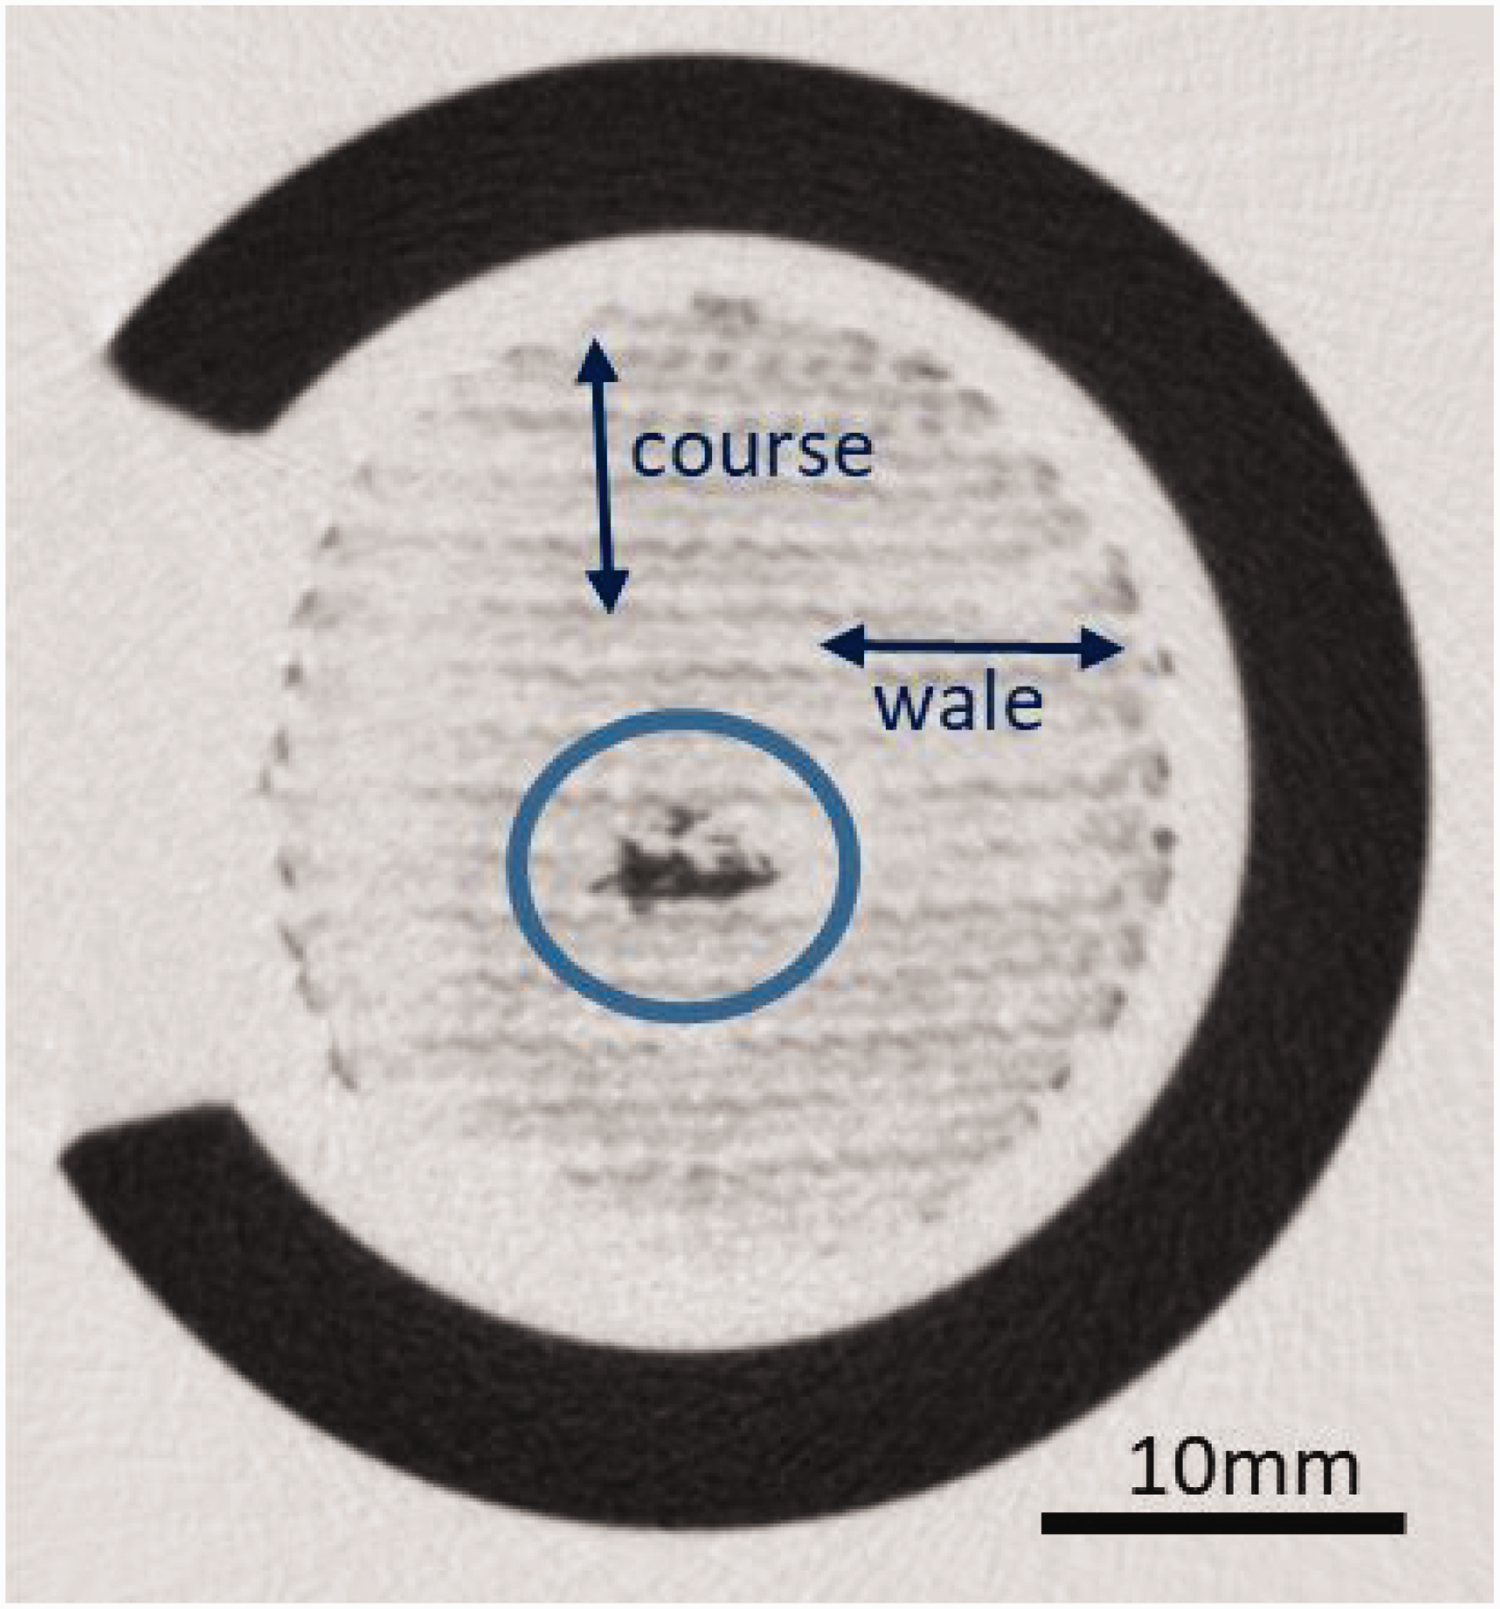
Example of a sectional picture from the tomographic view of the textile after the compression–decompression cycle. The wetted zone is in dark grey inside the blue circle (color online only).
The successive sectional images obtained by the µCT scanner are assembled using the open source software ImageJ plugin 3D viewer. By choosing a Huang filter and adapting the intensity threshold, the textile and the droplet shape can be selected. A whole 3D reconstruction can be obtained (Figure 6(a)) or a droplet extraction (Figure 6(b)). The in-plane and transplanar water content can then be evaluated.
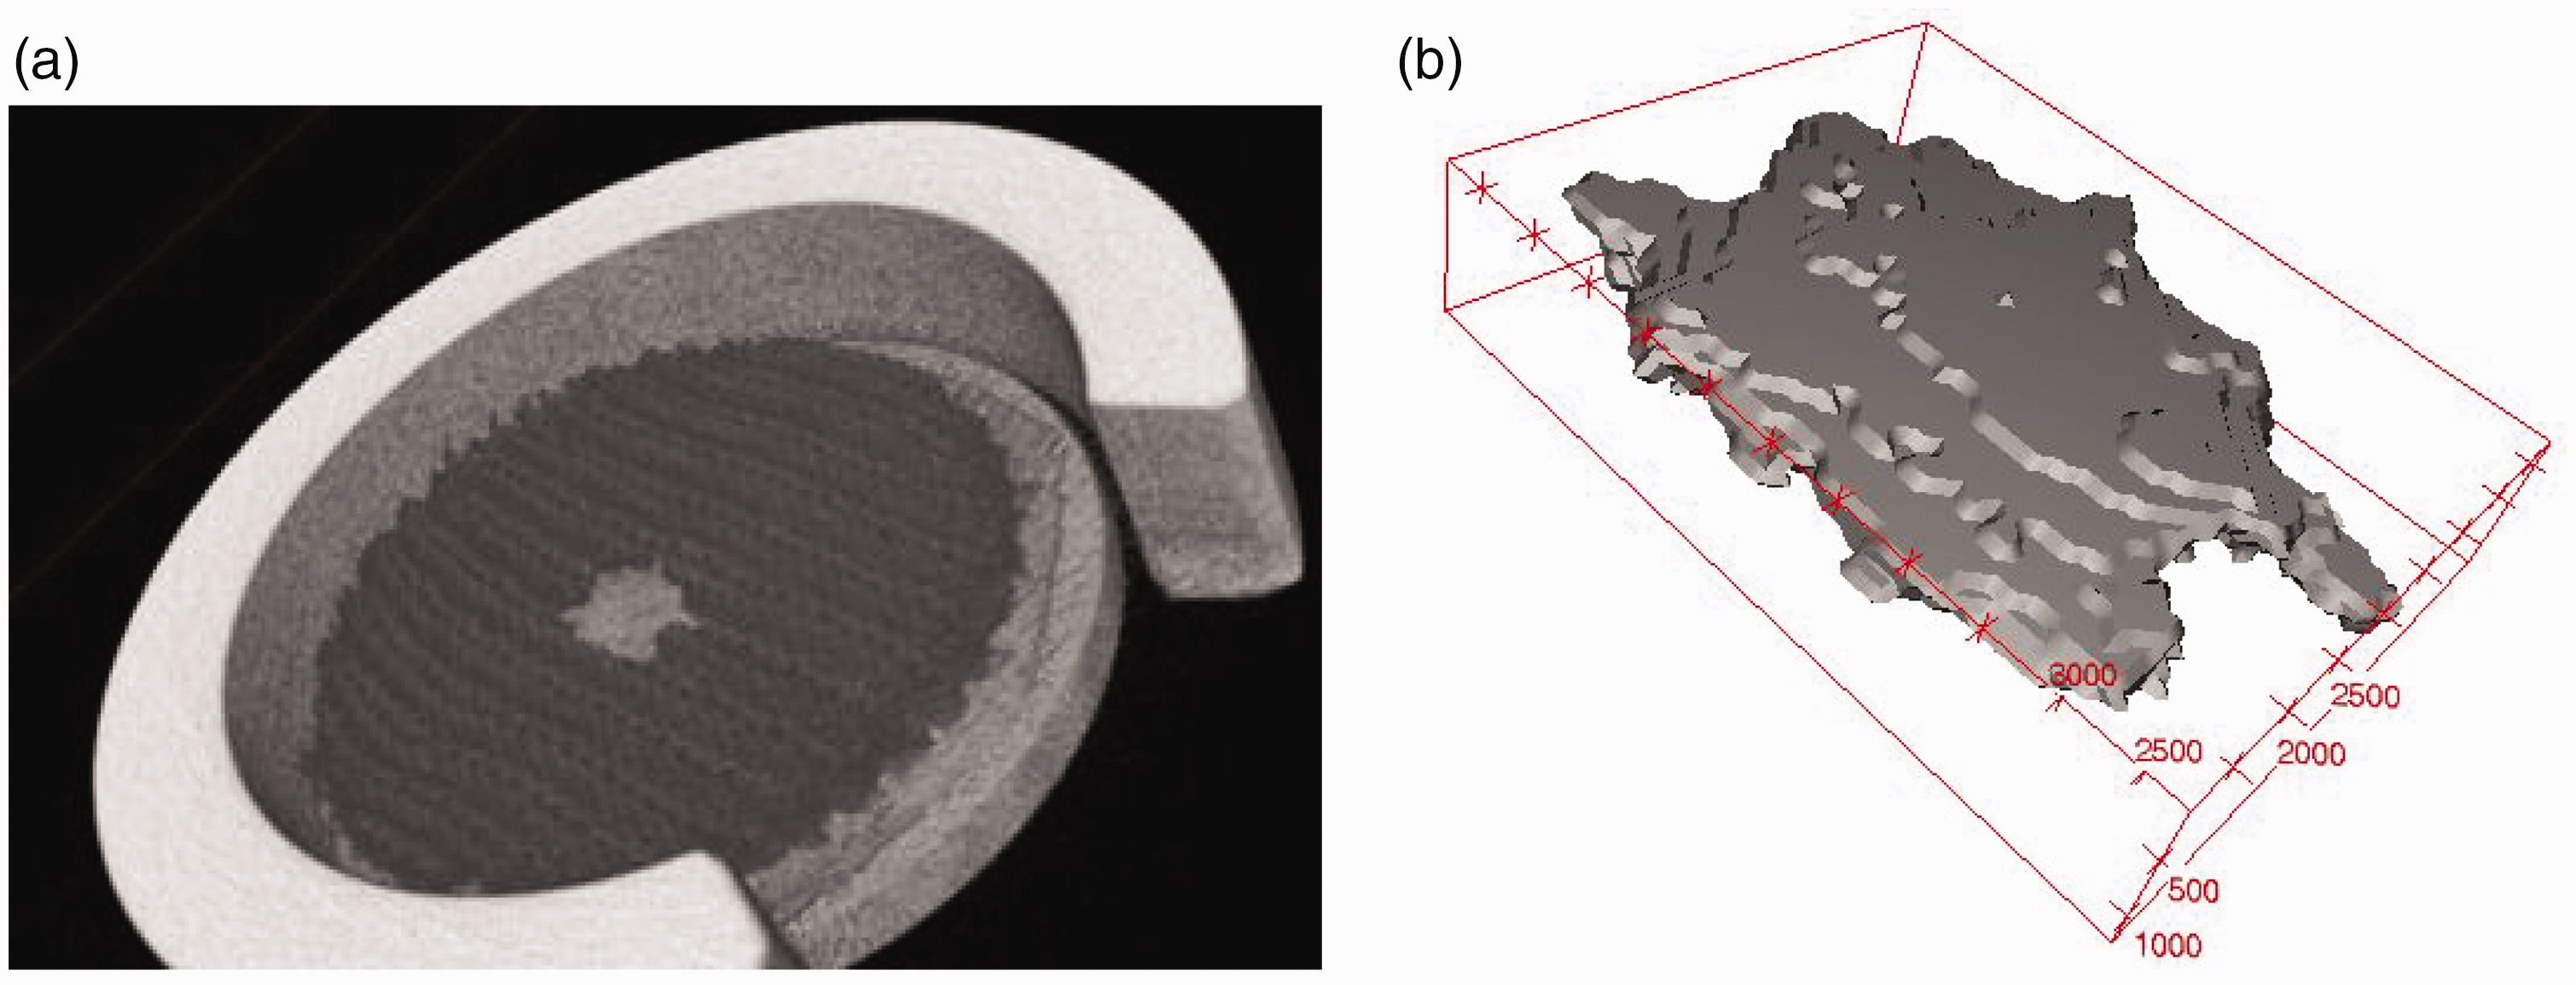
(a) Three-dimensional (3D) reconstruction from the sectional images taken after the compression–decompression cycle, where the liquid zone is in light grey and (b) extraction of the droplet shape alone from the 3D reconstruction.
Method of analysis of the 3D reconstructed droplet
The fabric parameters, regarding in-plane and transplanar liquid intrusion, are essentially the spreading of the liquid zone, respectively in the fabric surface and in the thickness directions. Therefore, the interesting characteristics of the droplet aspect ratio are its maximum in-plane and transplanar dimensions.
In the method developed in this study, the size of the droplet extracted from the 3D reconstruction is defined from the dimensions of a box strictly containing the drop shape (Figure 7(a)). This box is oriented in the privileged directions according to textile structure, which are the course, wale and thickness directions for knitted textiles. These dimensions are normalized to take into account the variations in droplet volume due to evaporation or sticking to the plunger surface. In fact, each dimension is divided by the cubic root of the final droplet volume, directly calculated from the 3D extraction droplet by ImageJ.
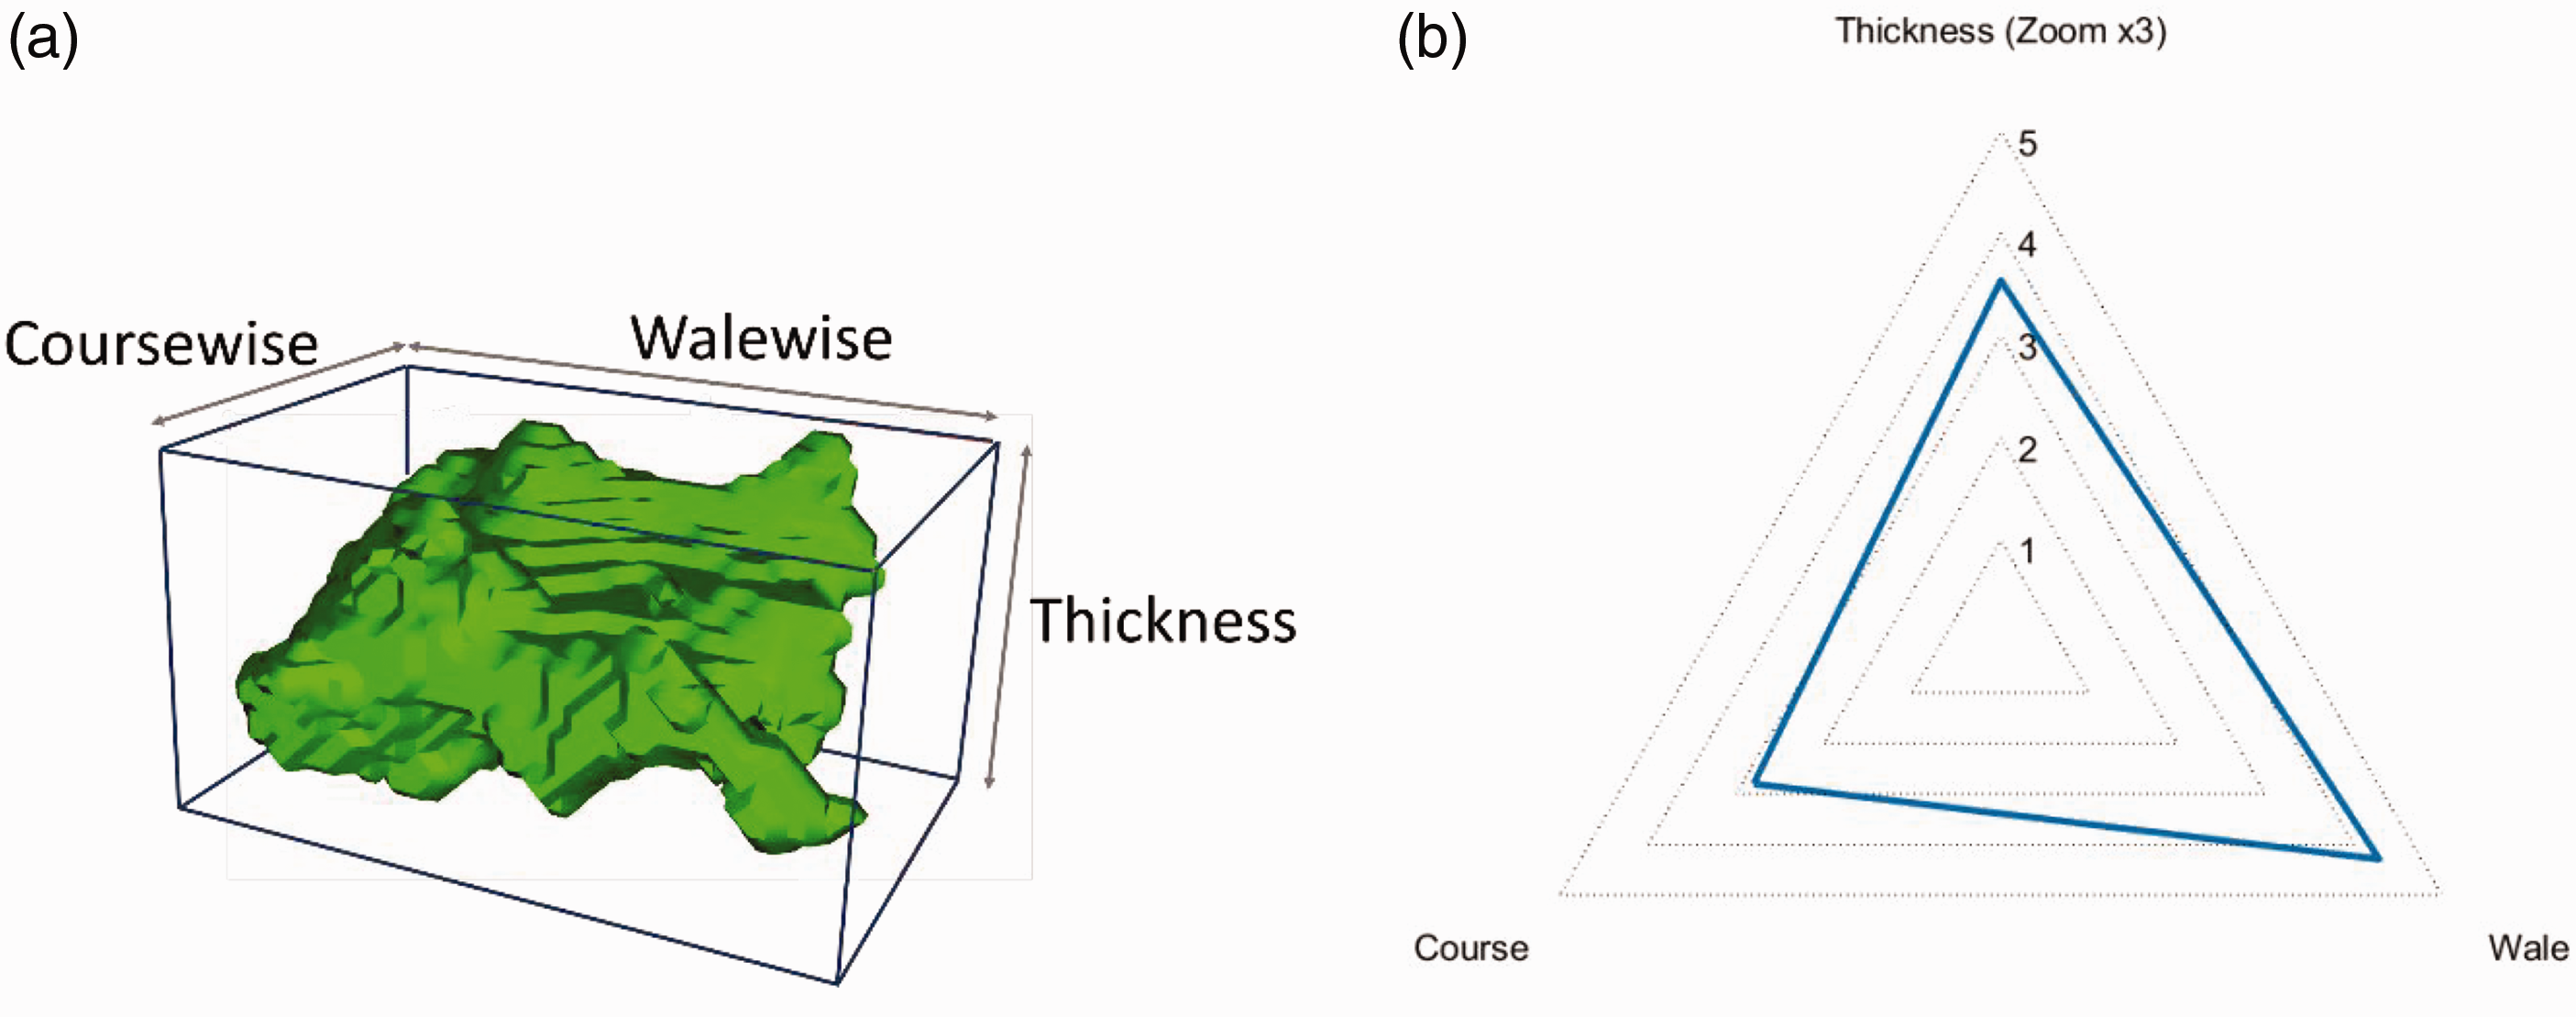
Characteristics of the three-dimensional reconstructed droplet: (a) the box containing the droplet oriented relative to the fabric structure (course, wale and thickness) and (b) chosen representation of these dimensions normalized by the final droplet volume.
The dimensions of the liquid shape, obtained from the 3D reconstruction, are illustrated in three-way charts representing the length (walewise), width (coursewise) and height (in the thickness direction) of the box, enabling the visualization of the droplet extensions (Figure 7(b)). The thickness scale is multiplied by a factor 3 to obtain an optimized visualization of the thickness variation in these charts.
This method of analysis allows the privileged directions of water dispersion to be highlighted. The triangle area is correlated to the box volume and is indicative of the compactness of the droplet shape.
Results analysis and influence of the fabric parameters
The influence of the hydrophobic property and the cover factor were analyzed by testing three to eight samples of each of the 14 different knitted fabrics. The CV% is approximately 10% for the thickness dimension and 20% for the course and wale dimensions, which is an expected result for knitted fabrics.
Influence of the hydrophobic chemical treatment
To study the influence of the wetting property, the same textile with and without the hydrophobic chemical treatment described in the Fabric samples section, were tested (respectively fabrics 1b10 and 1a10 in Table 1).
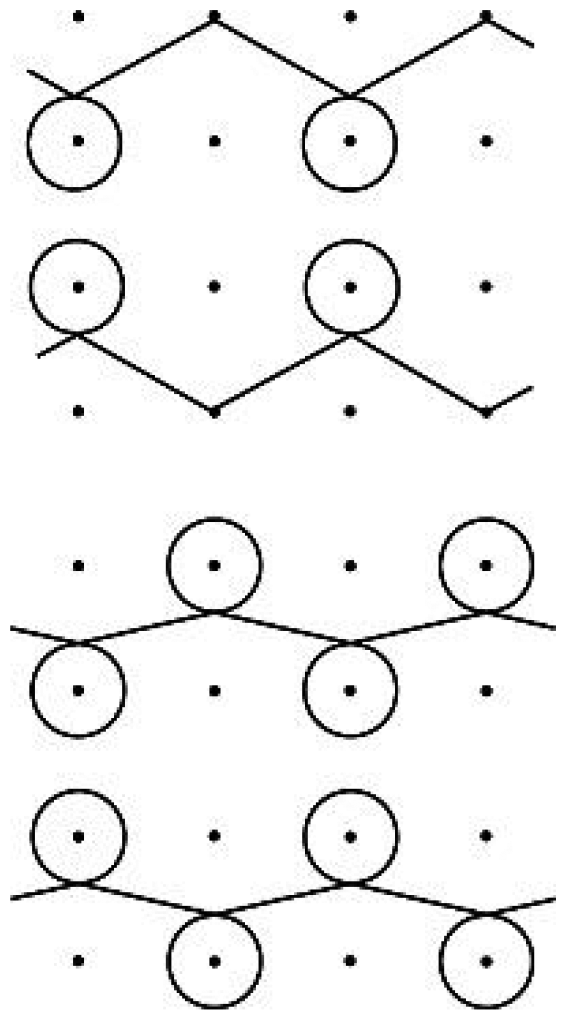
In the case of the slightly hydrophobic samples, droplet fingering was liable to occur (Figure 8(a)), but it did not occur with highly hydrophobic treated fabrics (Figure 8(b)). The tested fabrics had small inter-yarn pores, that is, a high cover factor (Table 1), which does not retain water when the surface is superhydrophobic; the liquid mainly spreads at the surface. In the case of slightly hydrophobic fabric, the fingering shows that water penetrates finer pores and remains trapped. 2D visualization before and after compression–decompression shows a more extensive spreading of the droplet in the surface hairiness for superhydrophobic fabrics (Figure 9).
Three-dimensional reconstruction of the droplet shape after the compression–decompression test for samples: (a) slightly hydrophobic (untreated) and (b) strongly hydrophobic (treated).
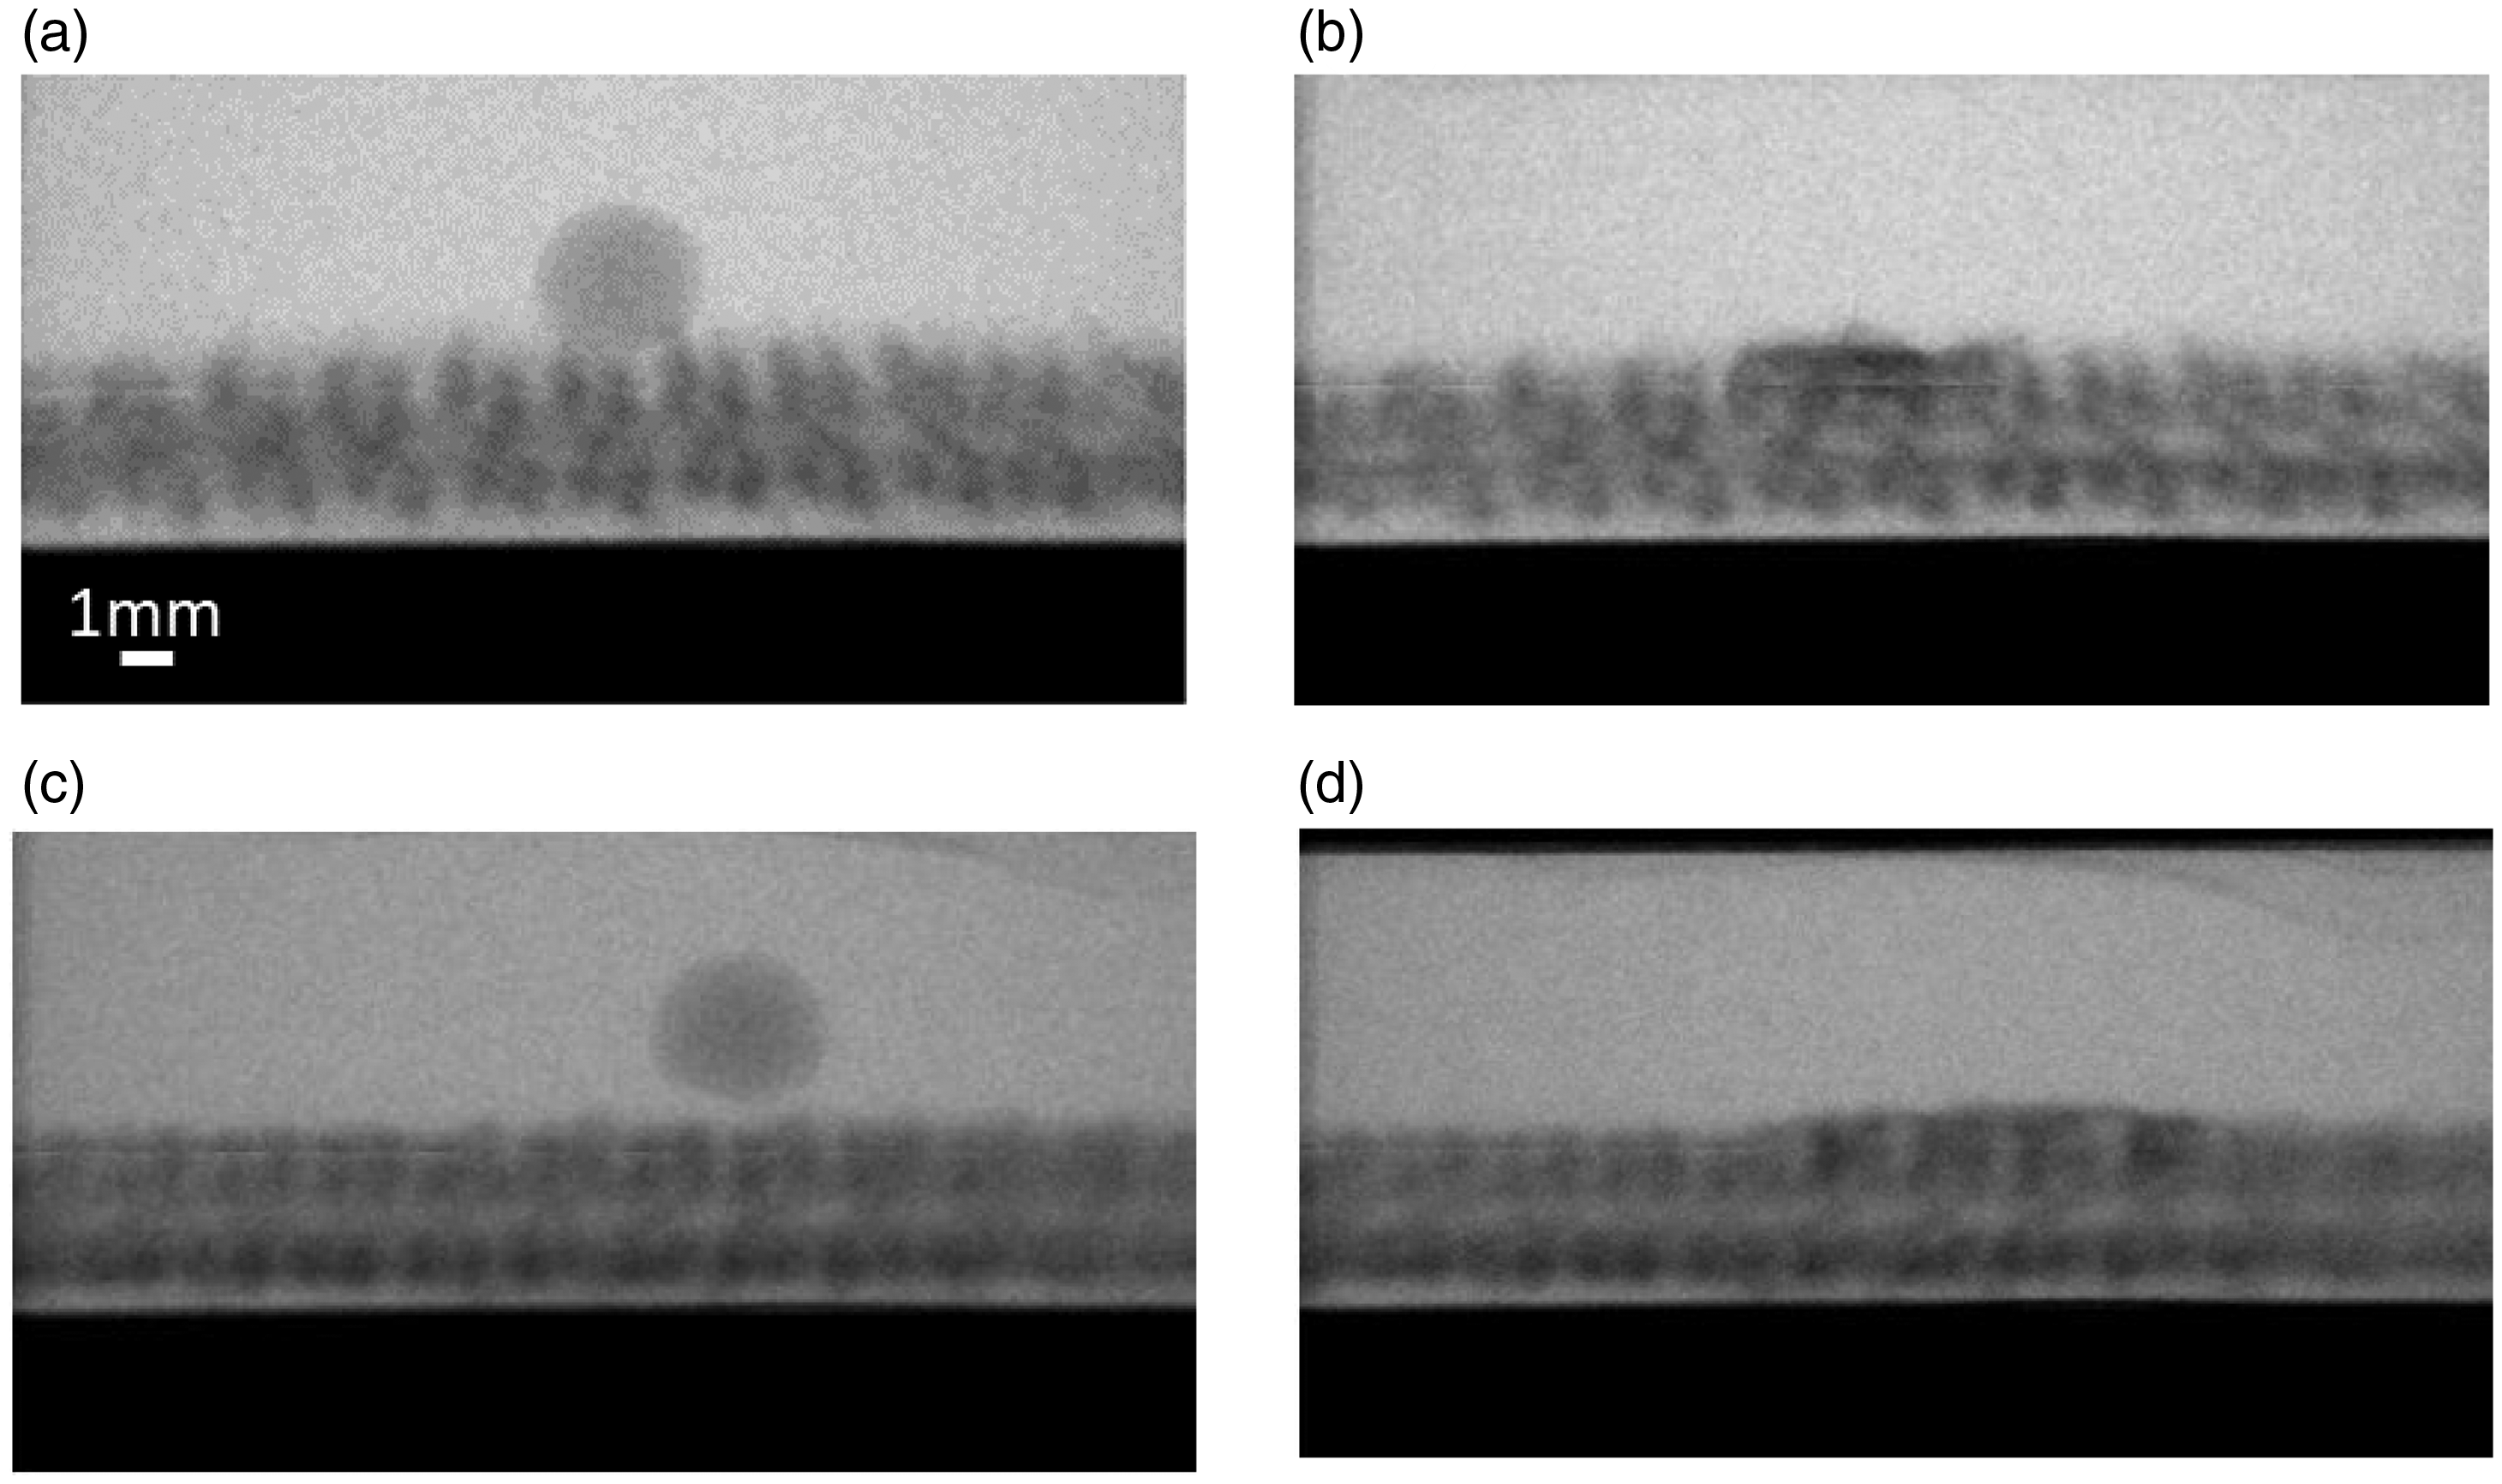
Two-dimensional visualization of the droplet for samples: (a), (b) slightly hydrophobic (untreated) and (c), (d) strongly hydrophobic (treated) before (a), (c) and after (b), (d) the compression–decompression test.
This observation confirms that better water wettability led to higher water retention properties, as observed in the study by Hsieh. 34
Figure 10 shows a quantification of these mechanisms. The droplet spreads preferentially along the wales for the slightly hydrophobic untreated fabric while, on the strongly hydrophobic treated fabric, the expansion of the droplet is balanced in both directions. The penetration thickness after compression appears much larger for the slightly hydrophobic fabric.
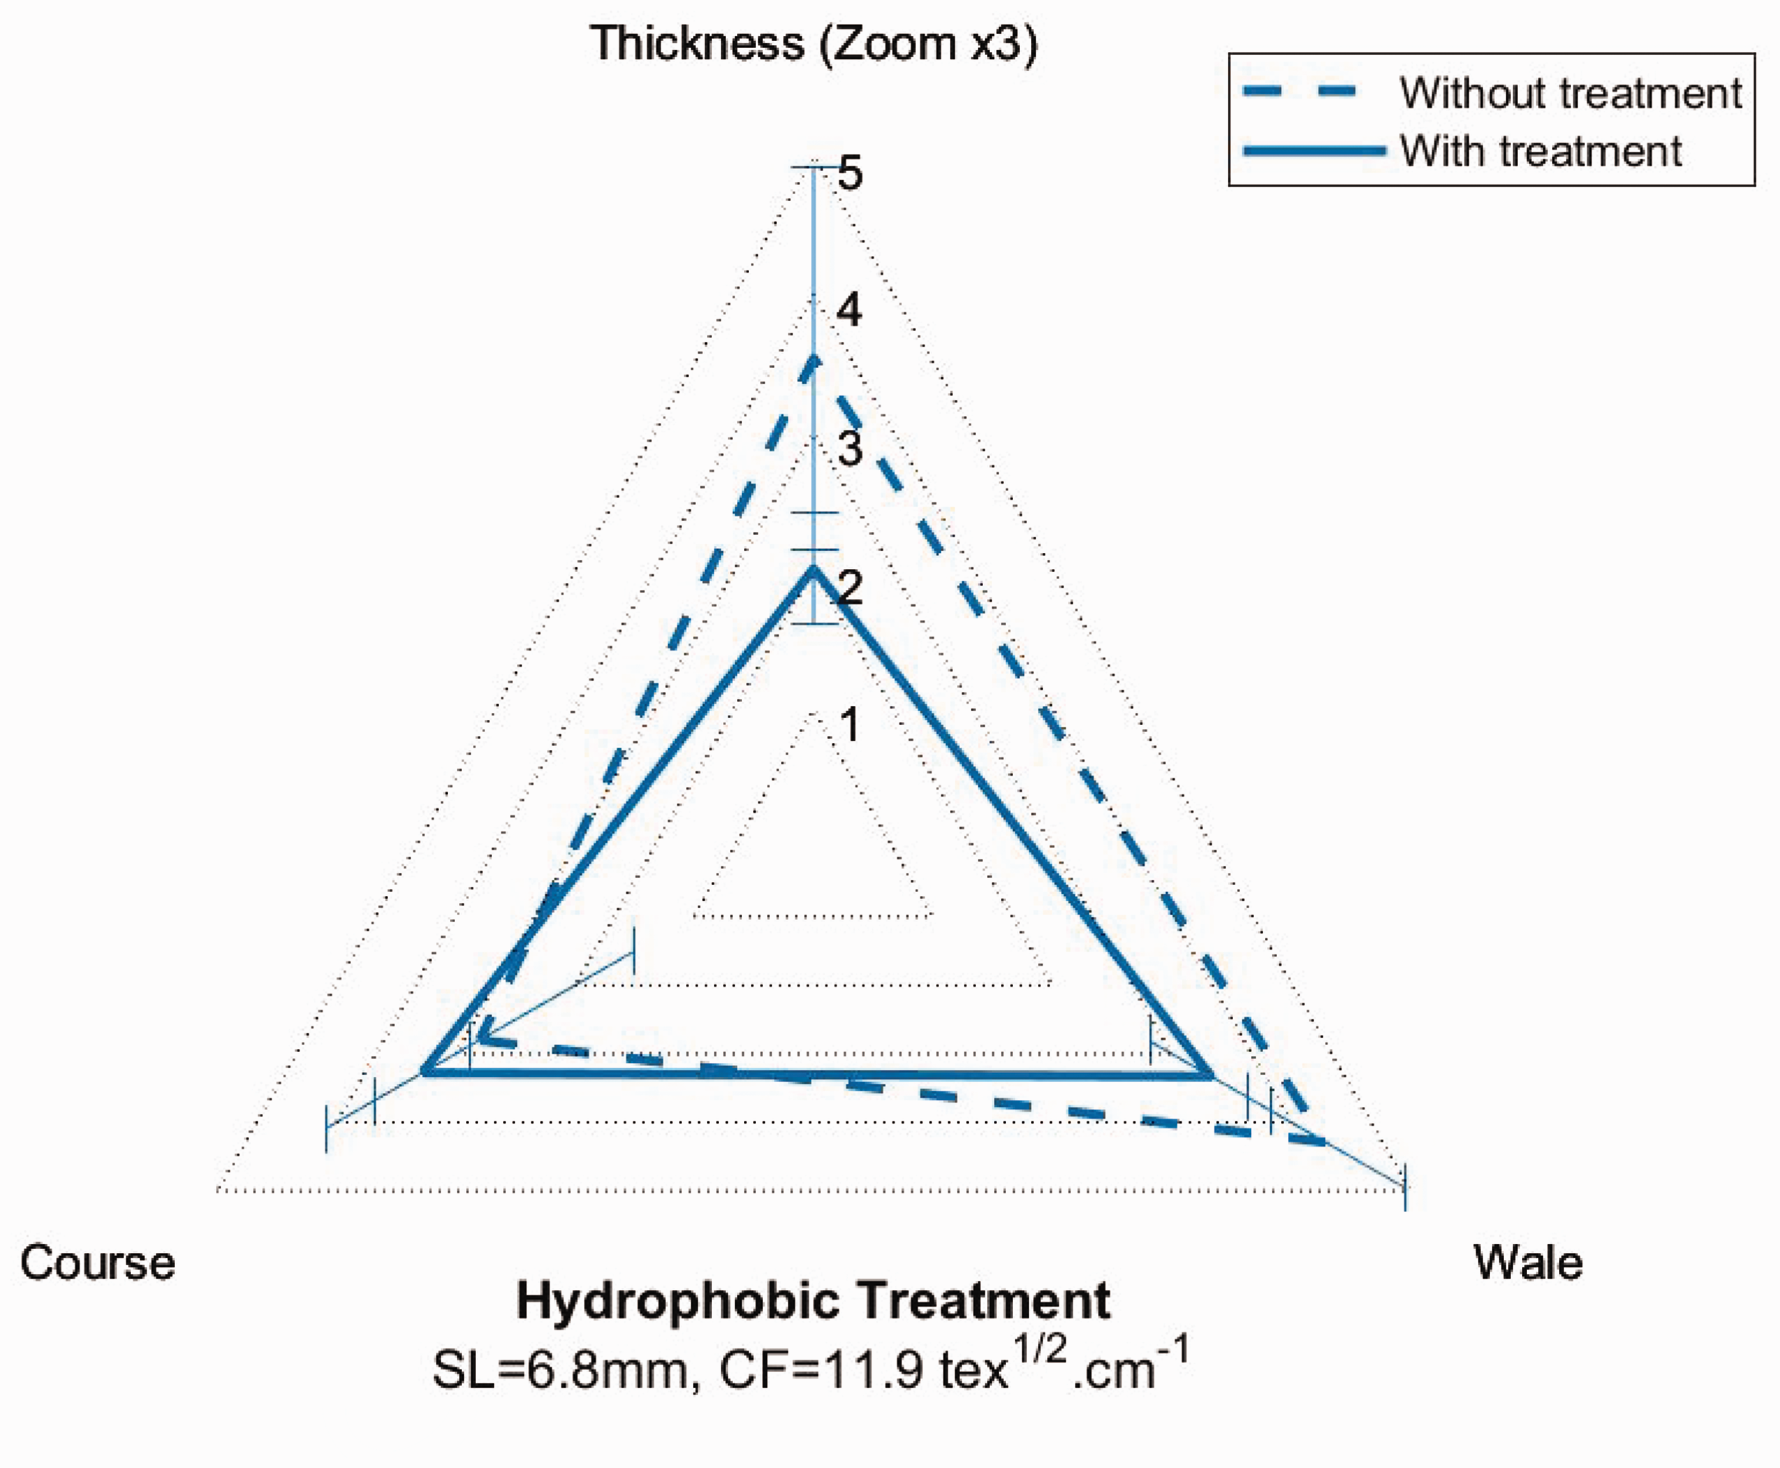
Normalized dimensions of the droplet shape after the compression–decompression test for samples 1a10 and 1b10 made respectively of slightly hydrophobic (without treatment) fabrics and strongly hydrophobic (with treatment) fabrics.
Influence of the cover factor/stitch length
Five samples made of the same acrylic yarn were knitted changing only the stitch length (samples 1a10 of SL = 11.9 to 1a14 of SL = 7.4 presented in Table 1). The global geometry of the yarns was conserved and a homothetic modification of the pore geometry was made. 35 According to Equation (1), when the stitch length increases the cover factor decreases, leading to higher fabric porosity. In this case, the cover factor ranges between 7.3 and 11.9, that is, a ratio of 1.6 (Table 1).
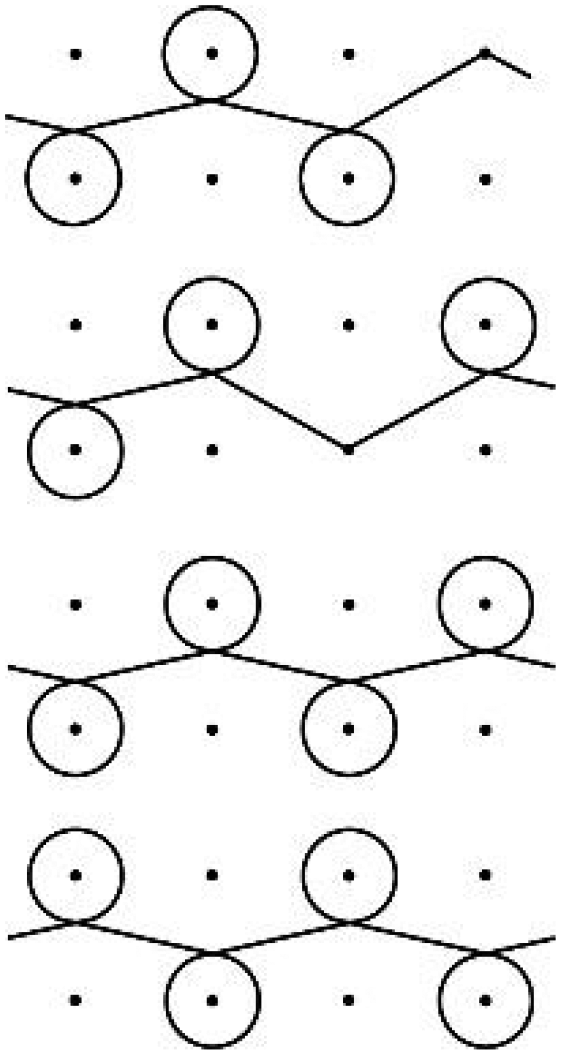
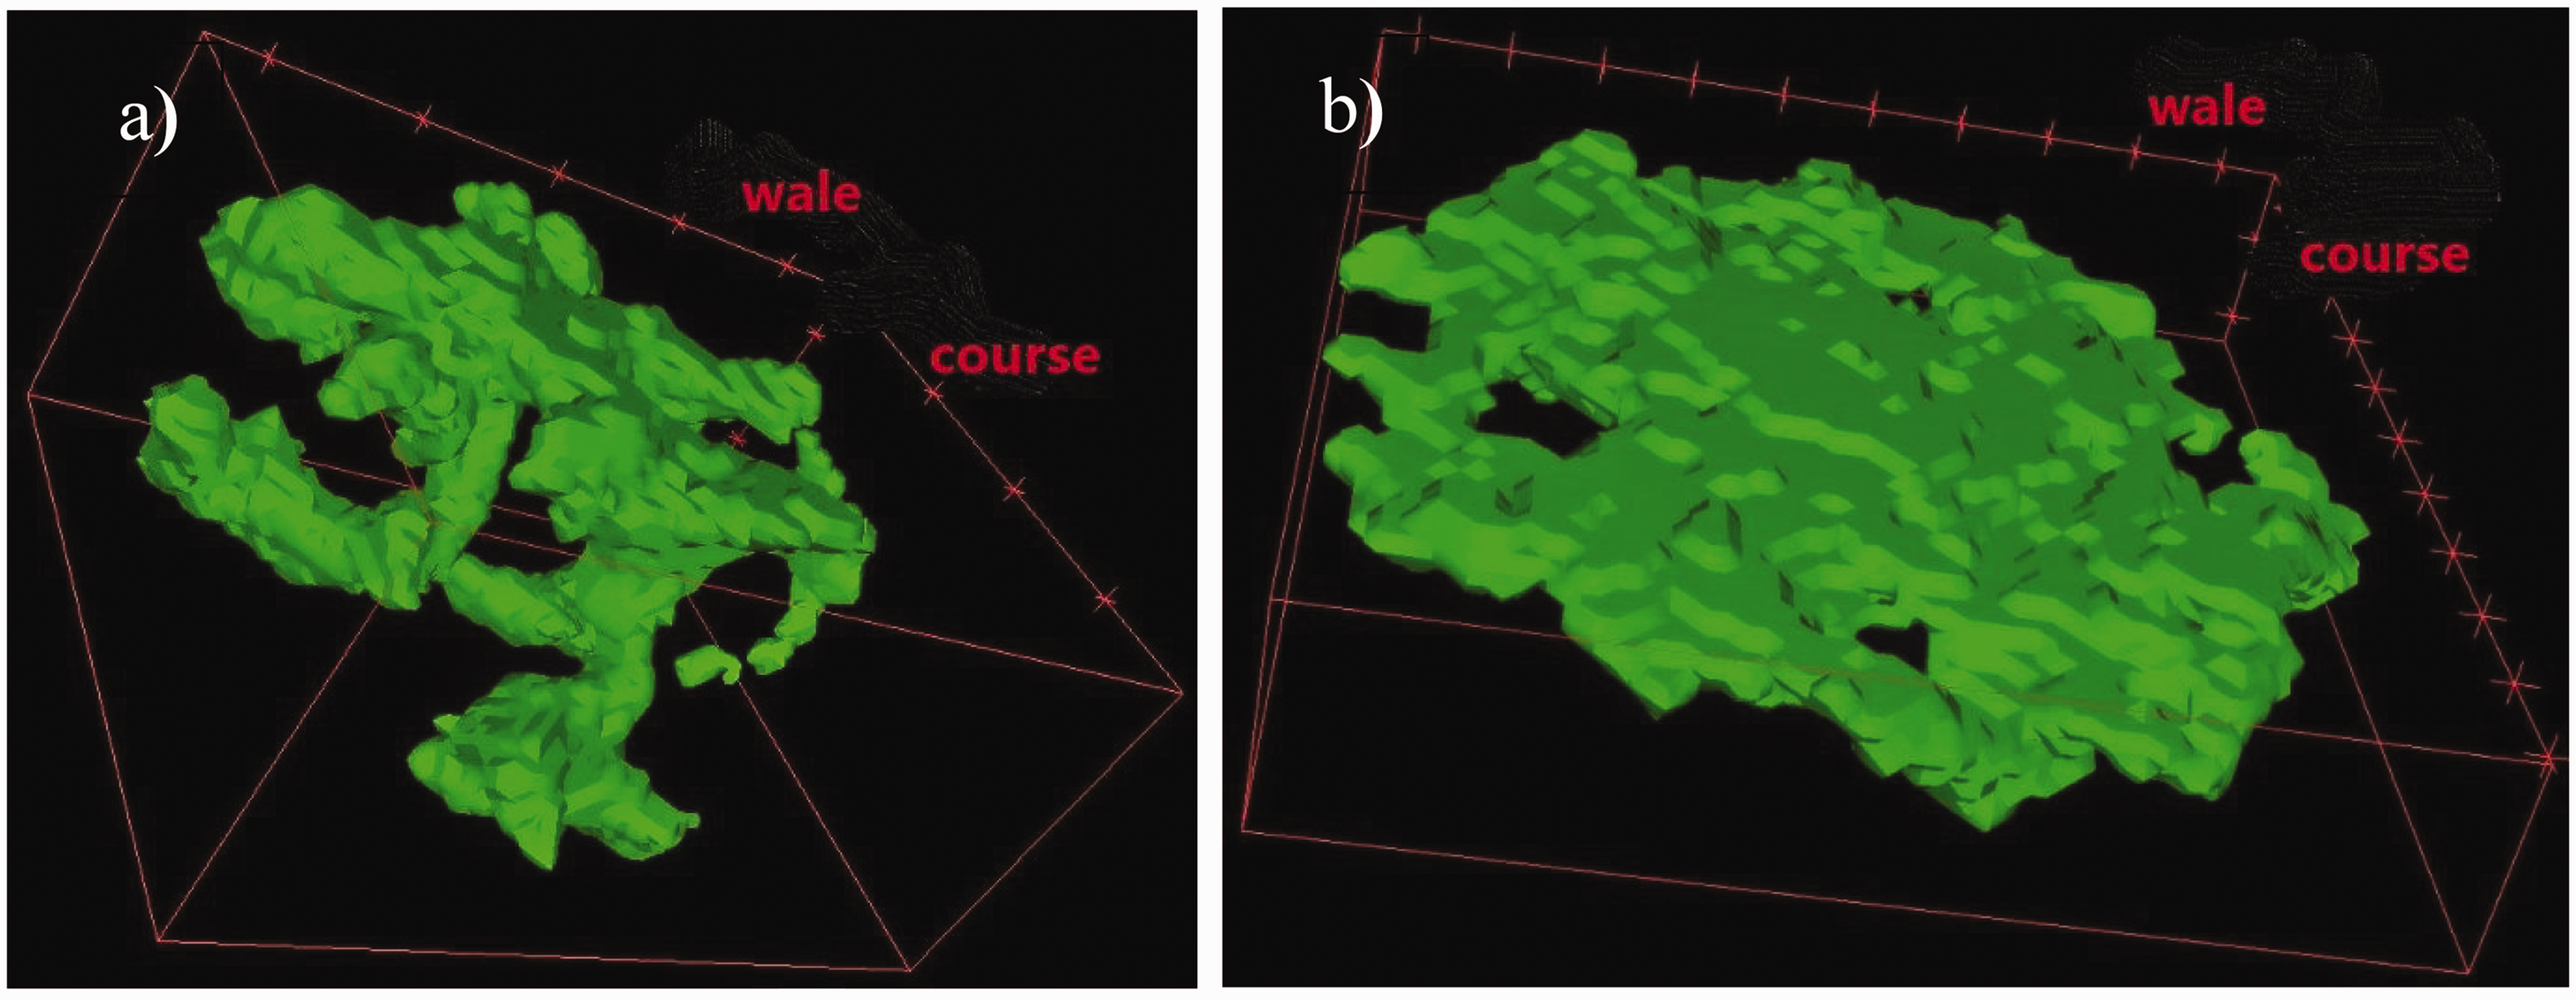
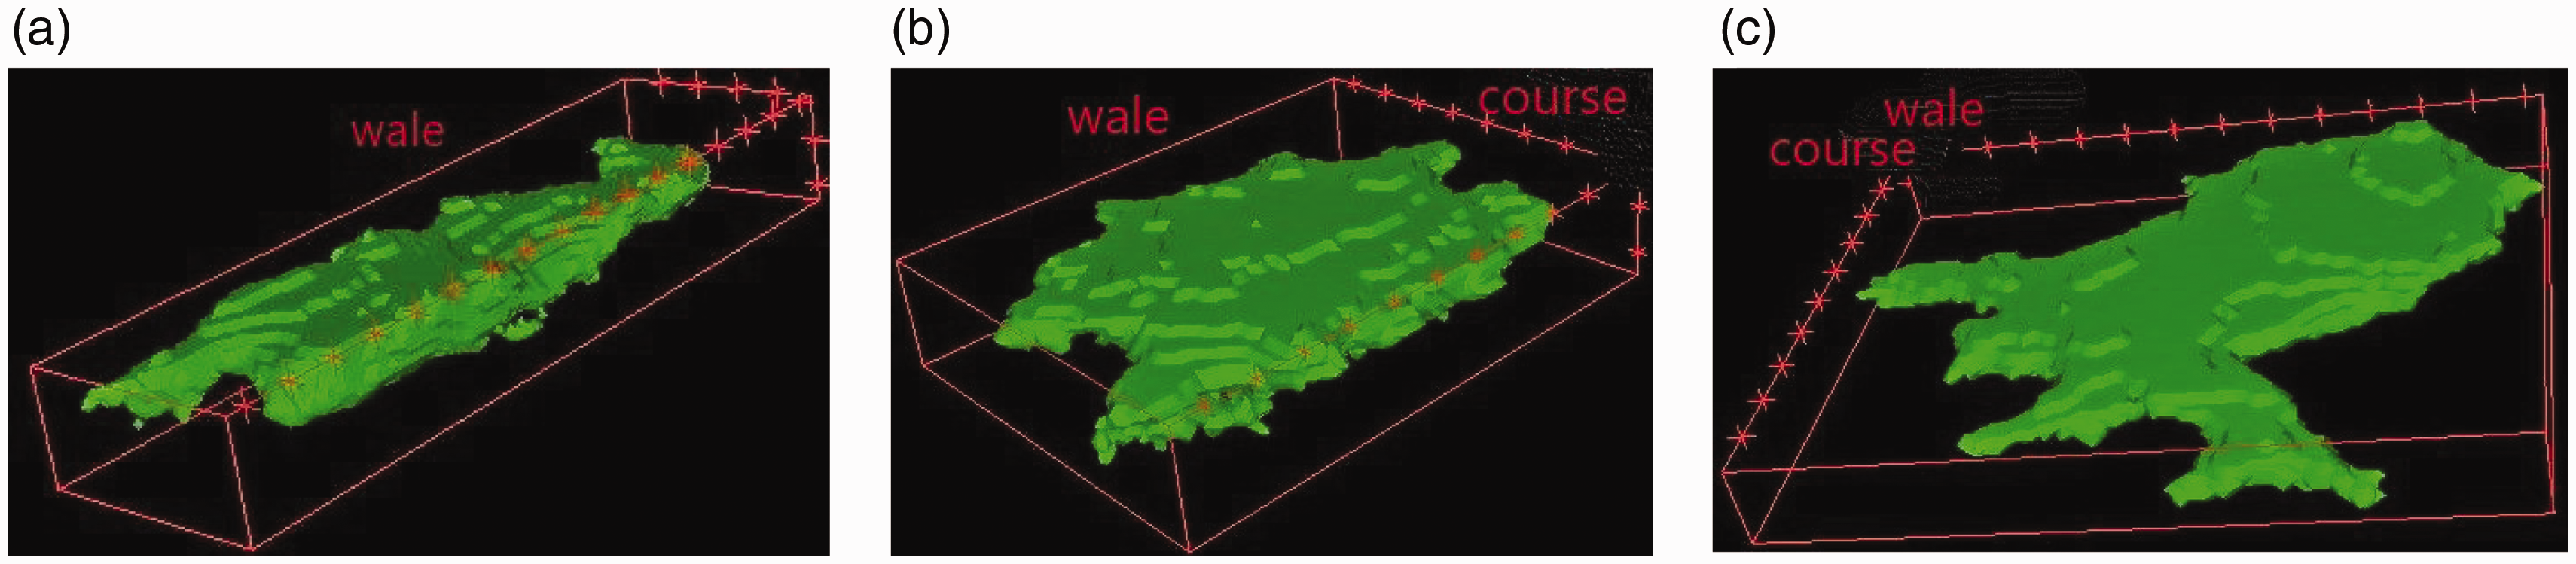
The 3D reconstruction emphasizes the evolution of the droplet shape with the stitch length (Figure 11). The emergence of fingering decreases with increasing stitch length and then increasing porosity, and the droplet shape becomes more compact. The tomographic views show that the fingering is driven by the yarns and not the pores due to the stitch shape (Figure 12). These fingers seem to be due to water trapped within fine pores in the intra-yarn capillaries, that is, between the fibers.
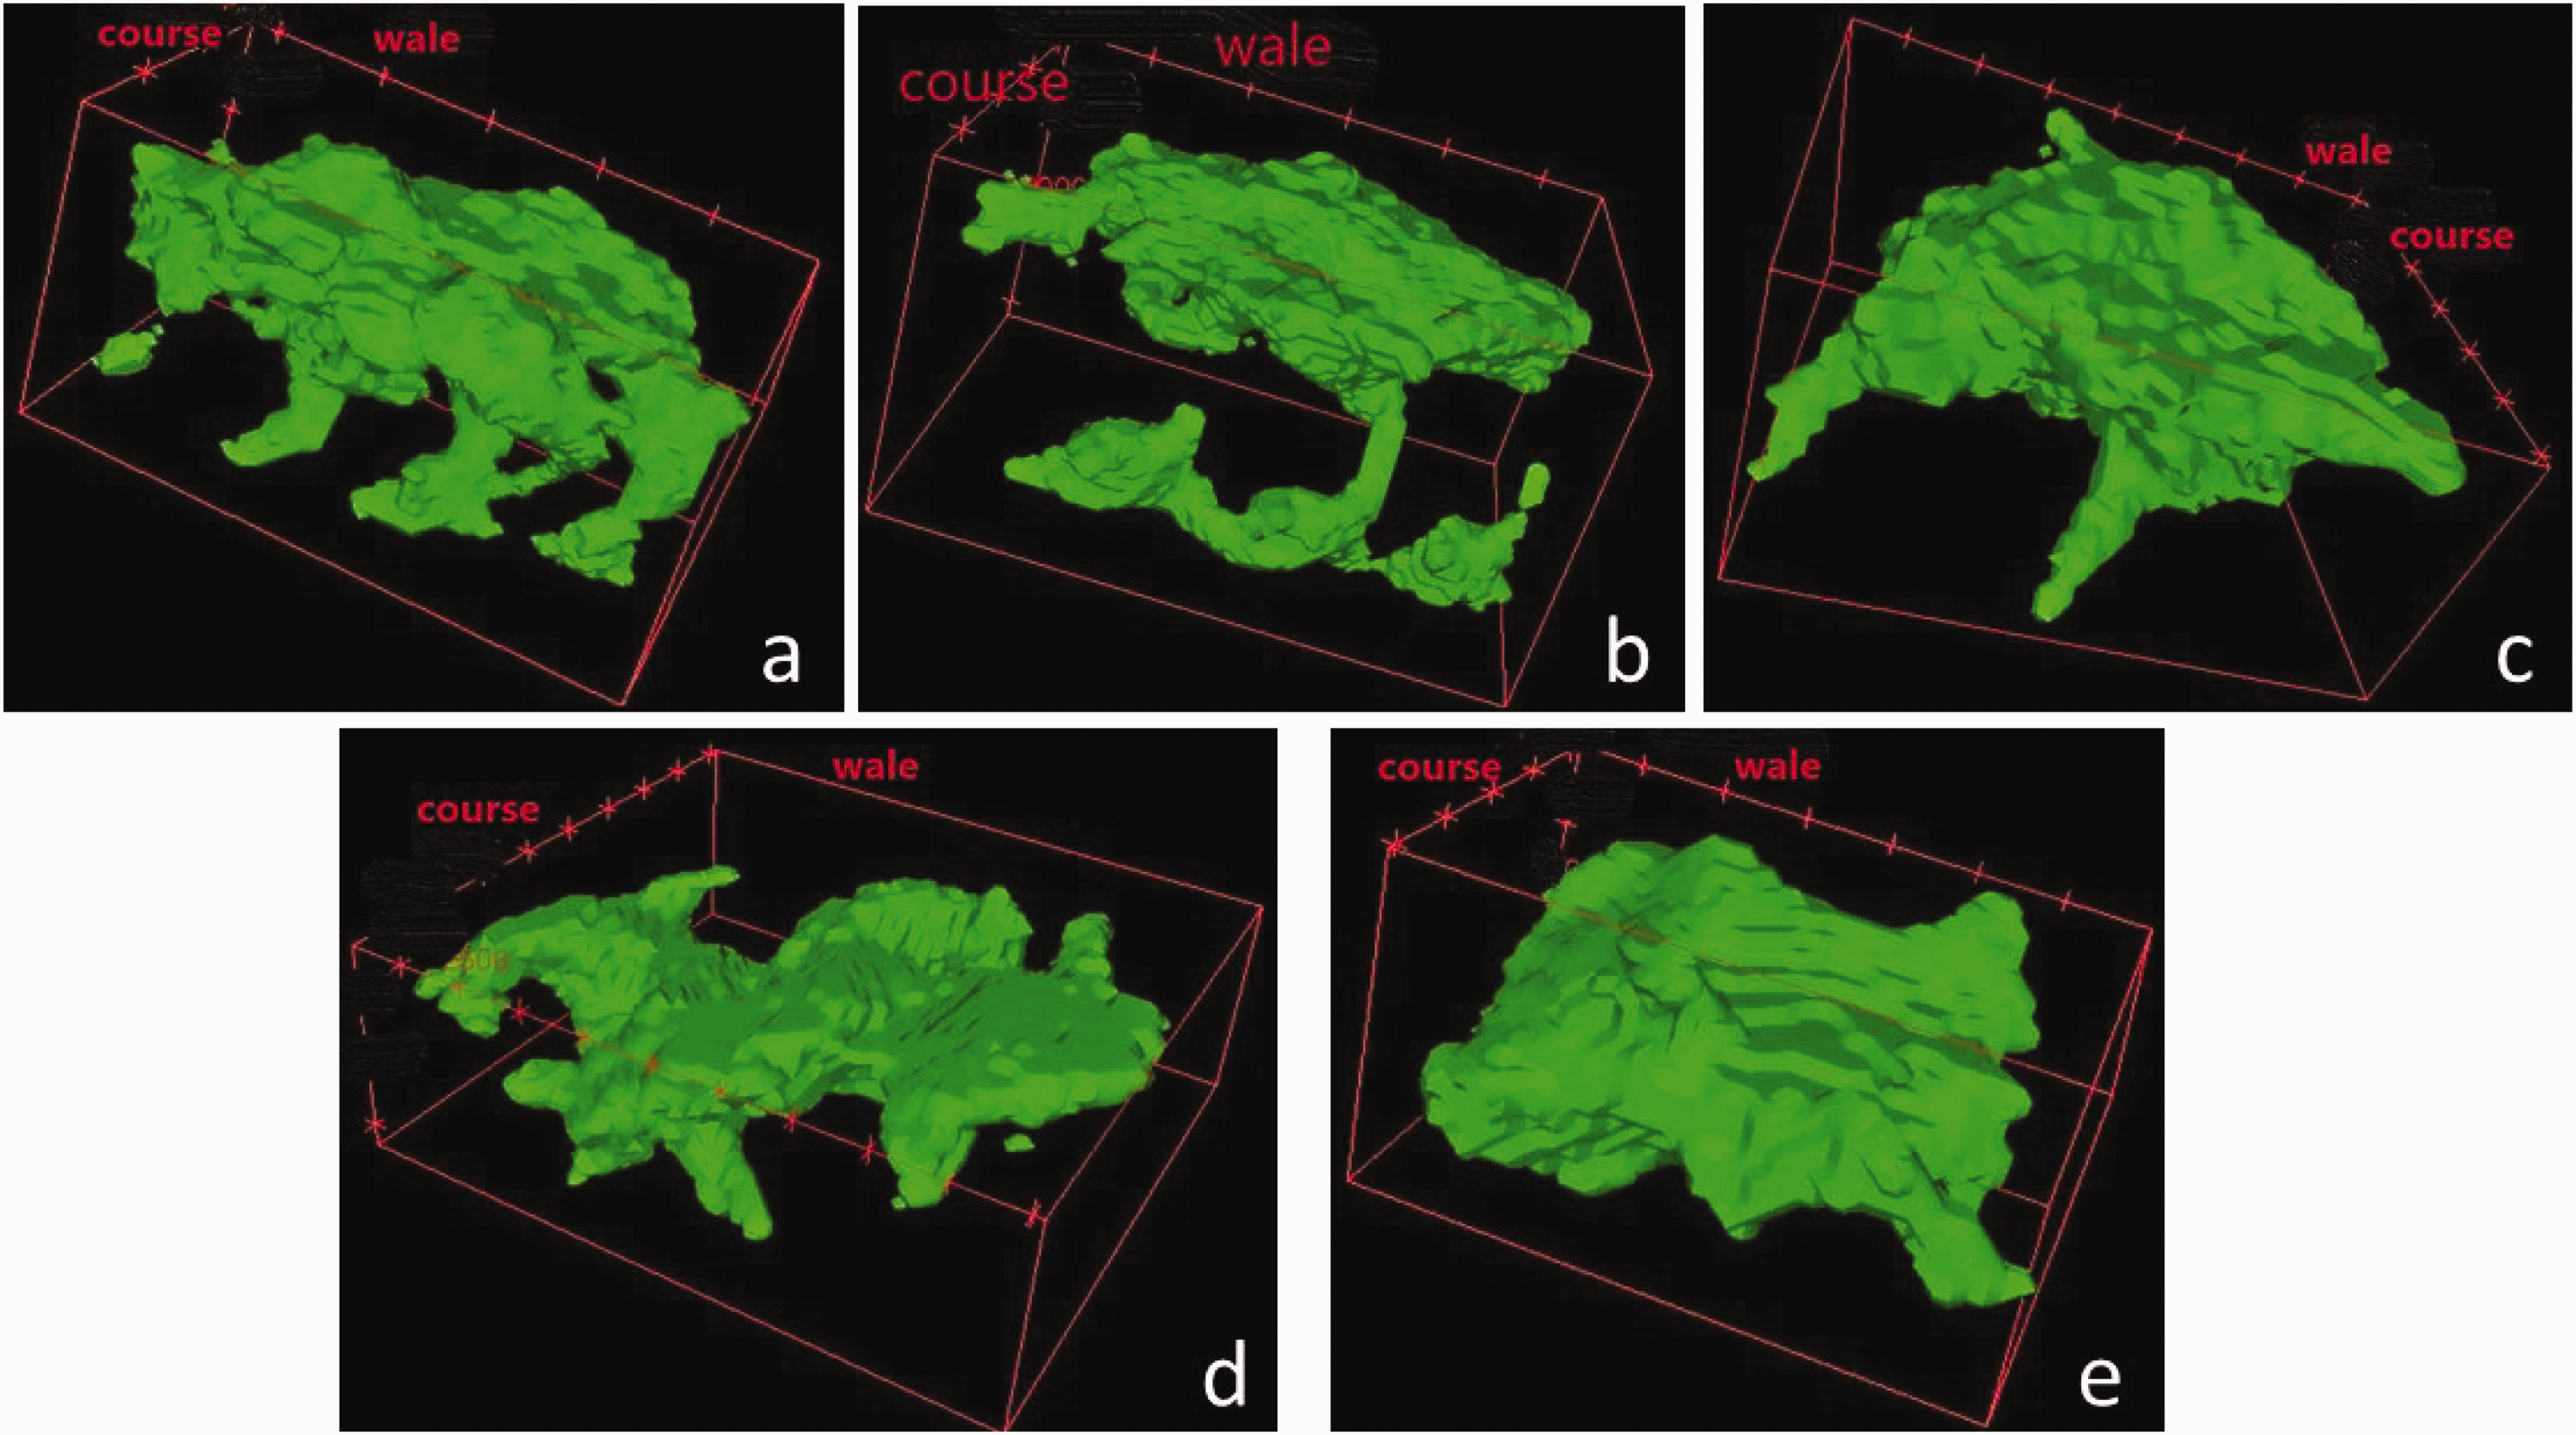
Three-dimensional reconstruction of the droplet shape for different stitch lengths and cover factors: (a) SL = 6.8 mm and CF = 11.9; (b) SL = 7.8 mm and CF = 10.4; (c) SL = 8.7 mm and CF = 9.3; (d) SL = 9.9 mm and CF = 8.2 and (e) SL = 11 mm and CF = 7.3 (Table 1).
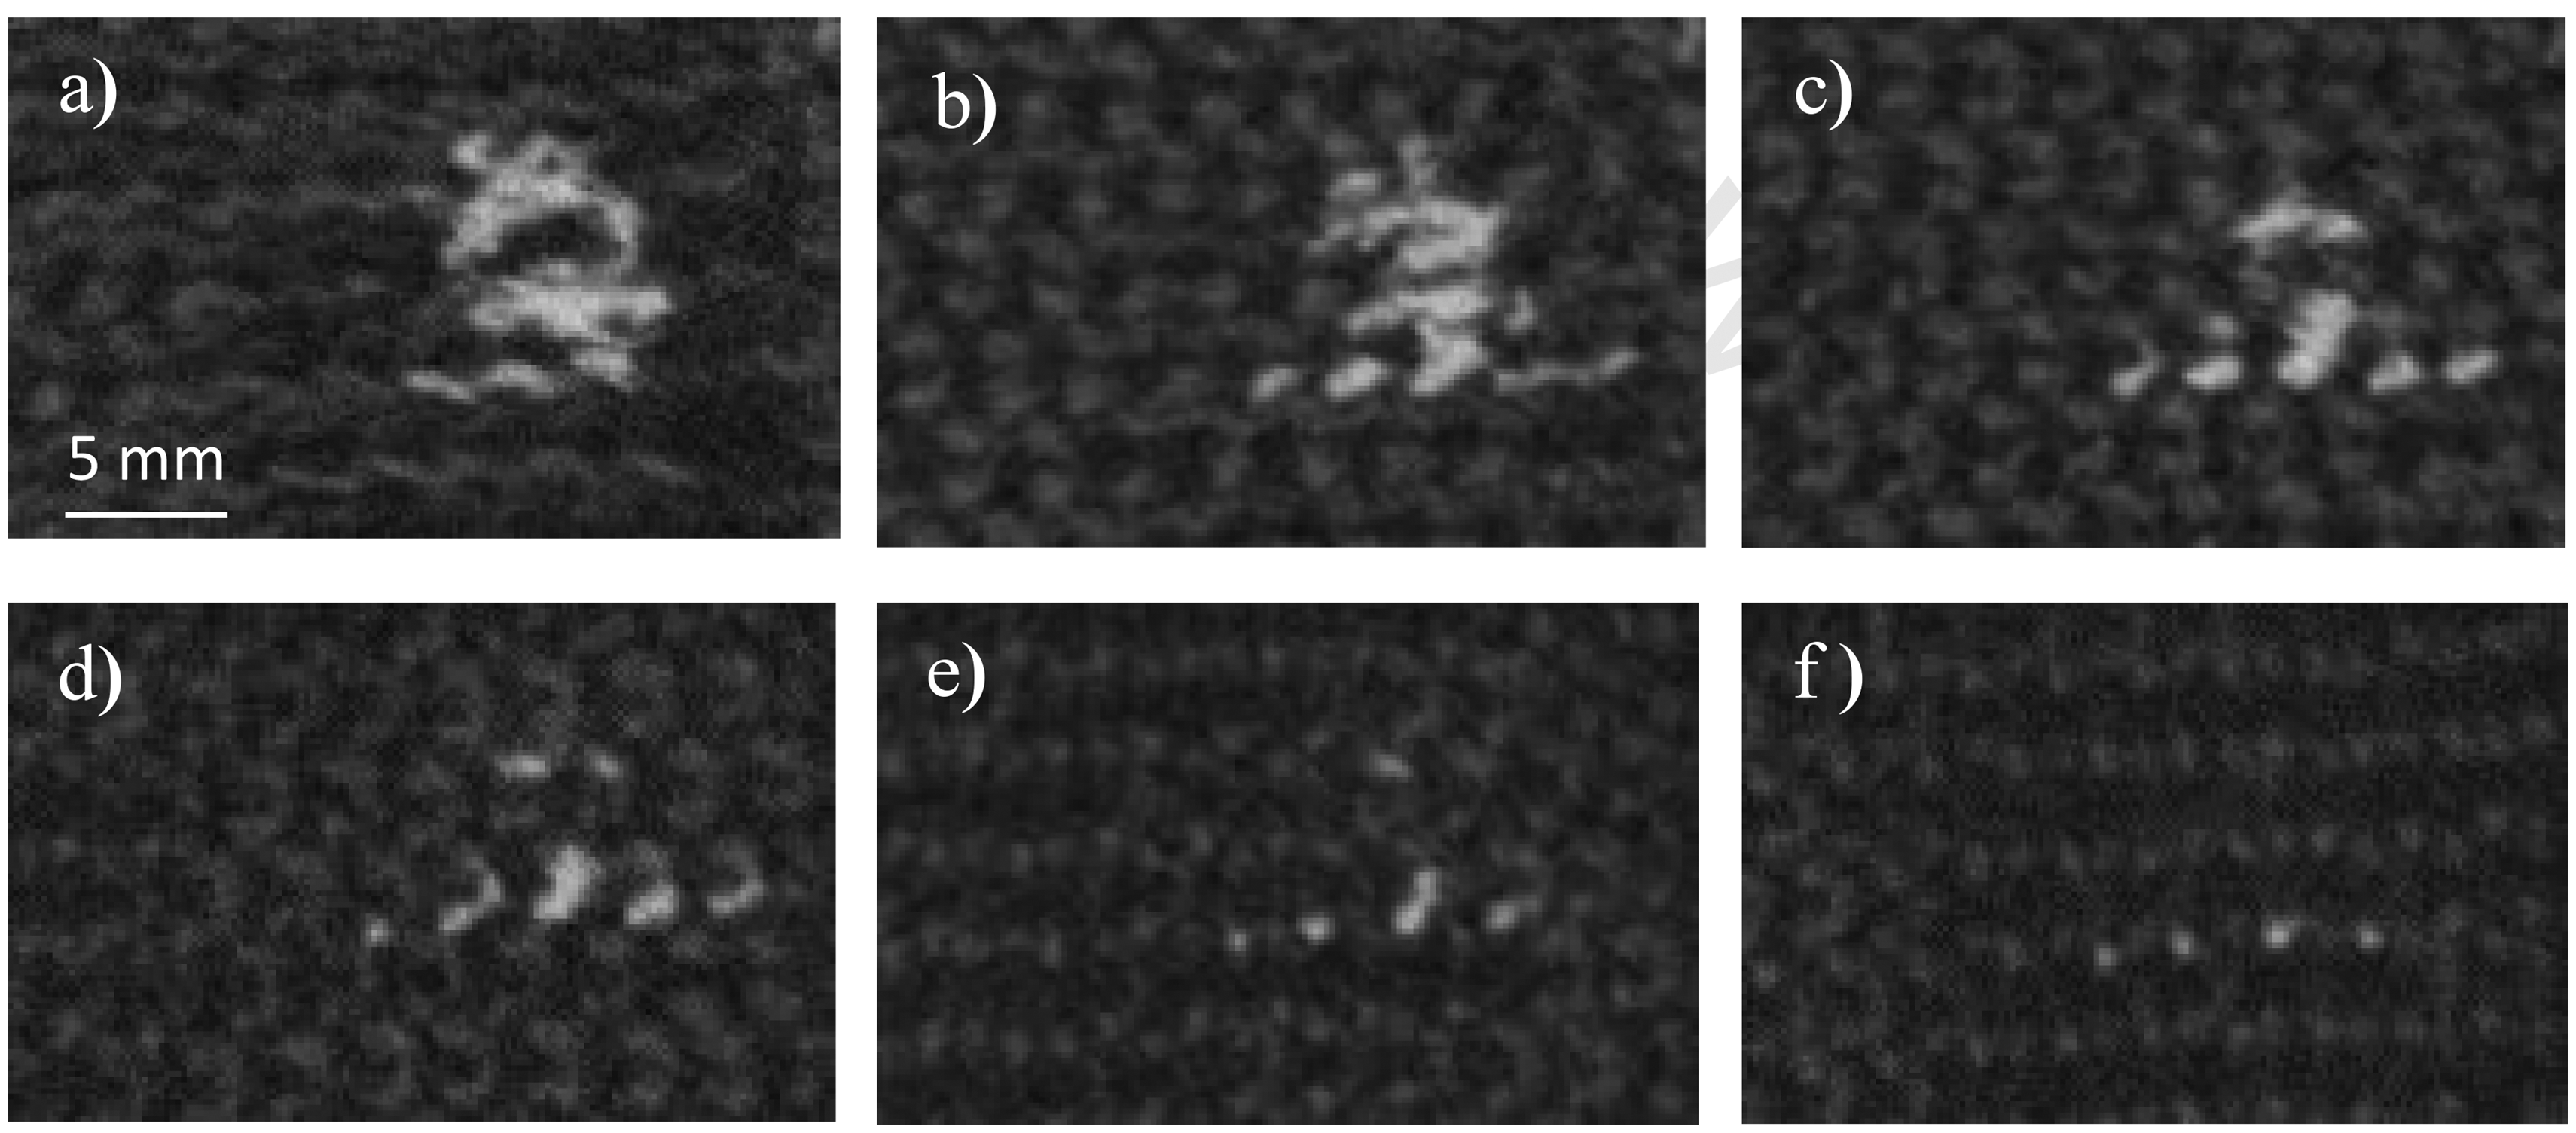
Successive tomographic images of the distribution of water (in light grey) inside sample 1a11 (SL = 7.8 mm and CF = 10.4). Each image in this sequence is separated by 222 µm in depth. The width of the pictures corresponds to the wale direction.
Some yarn-to-yarn liquid transfers were also detected, for example as shown in Figure 11(b). In this figure, the fingering shape highlights the liquid path from one yarn to an interlaced yarn through some contact points. Yarn-to-yarn transition for liquid transport inside textile media has already been observed during the wicking process in knitted fabrics.36,37
Subsequent projections reveal that the liquid bulk lodges preferentially between two wales, but spreads to neighboring wale valleys when the stitch length becomes too small (Figures 13 and 14).
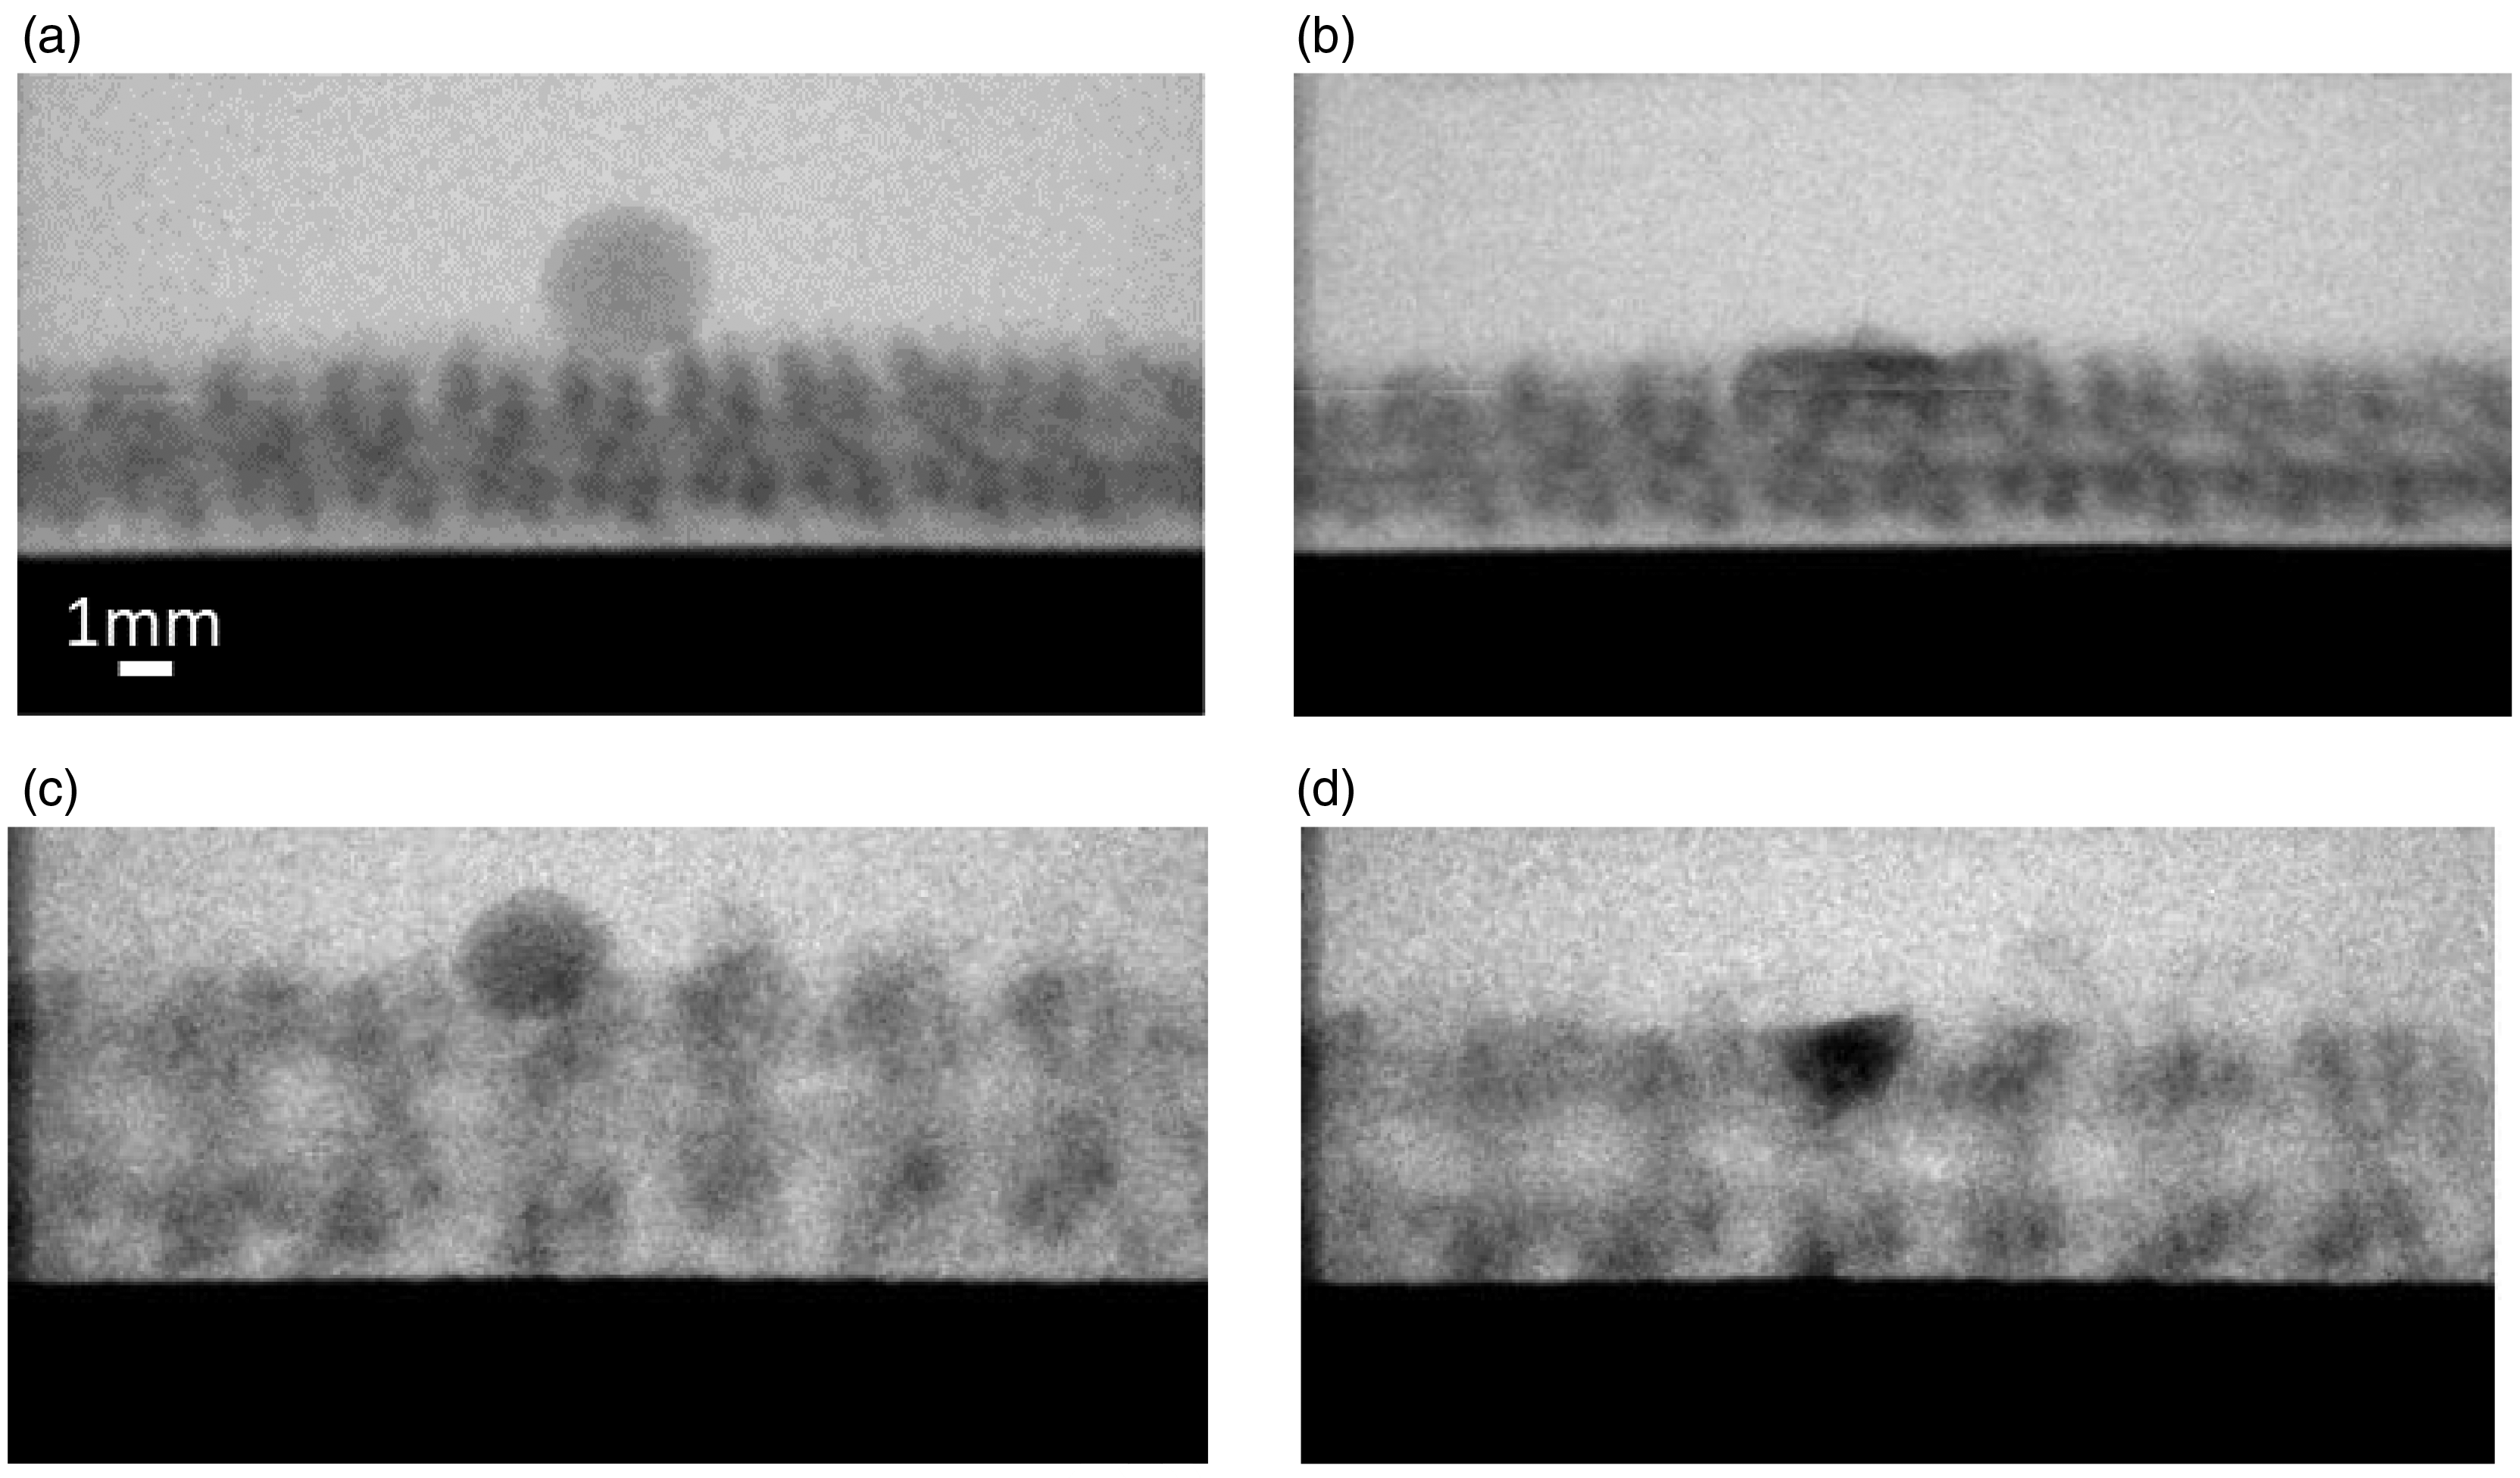
Two-dimensional visualization of the droplet for samples (a), (b) with a small stitch length and a high cover factor (SL = 6.8 mm and CF = 11.9) and (c), (d) with a large stitch length and a low cover factor (SL = 11 mm and CF = 7.3) before (a), (c) and after the (b), (d) compression–decompression test.
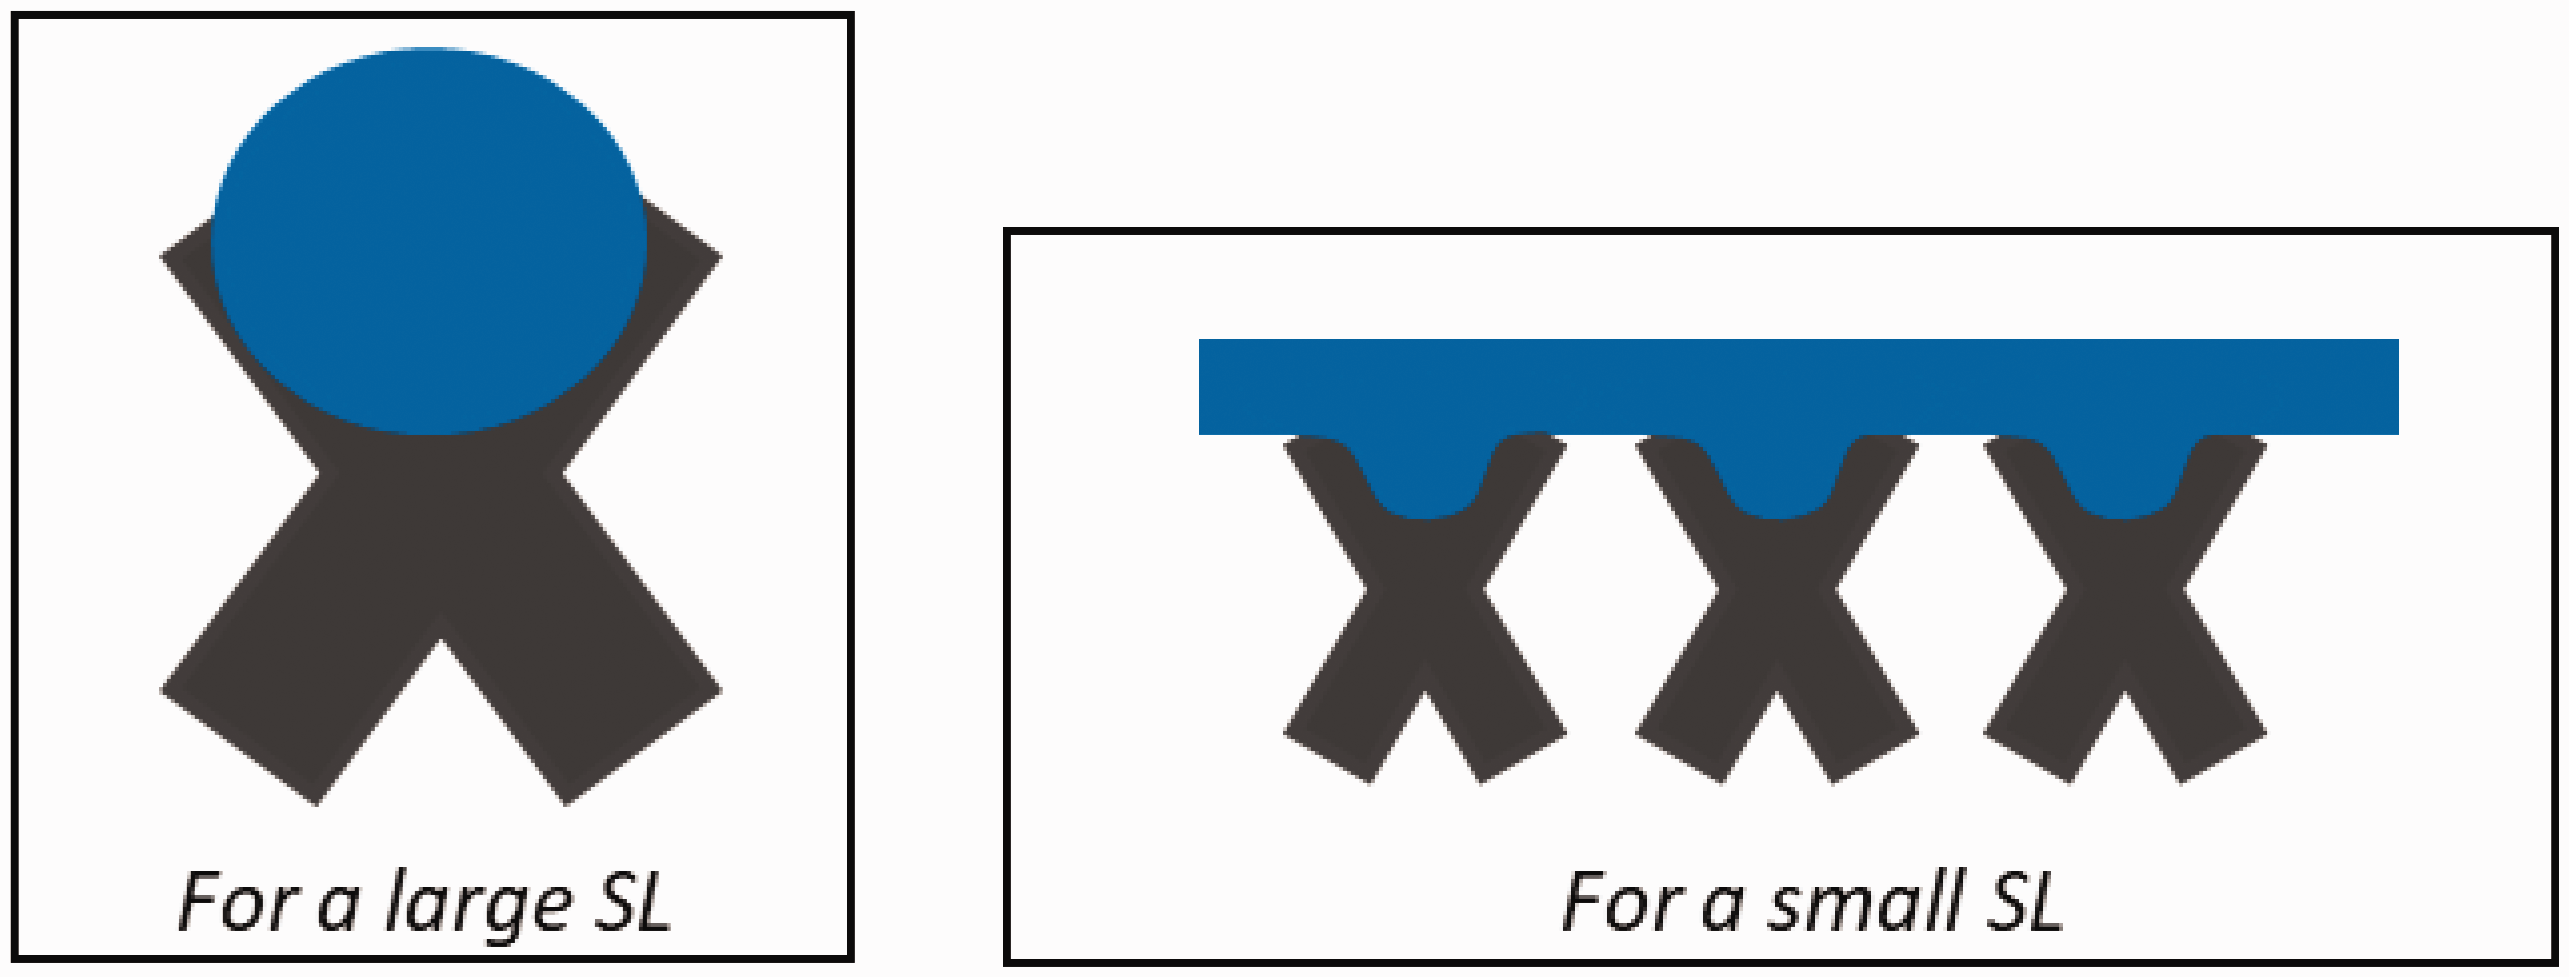
Illustration of water location relative to wales appearing as X shapes for interlock 1 × 1 (Figure 4).
The aggregation of these data shows different penetration mechanisms. For a large stitch length, the liquid drop fills large channels between yarns, which is typical for such a supply-limited water penetration. 38 As the stitch length decreases, the space between yarns also decreases and the liquid fills the intra-yarn capillaries.
Figure 15 also illustrates the loss of water droplet compactness when the stitch length decreases. Each triangle of the textile with a smaller stitch length tends to enclose the precedent one, and a correlation appears between stitch length and compactness (volume of the box containing the droplet shape) with an R2 of 0.89.
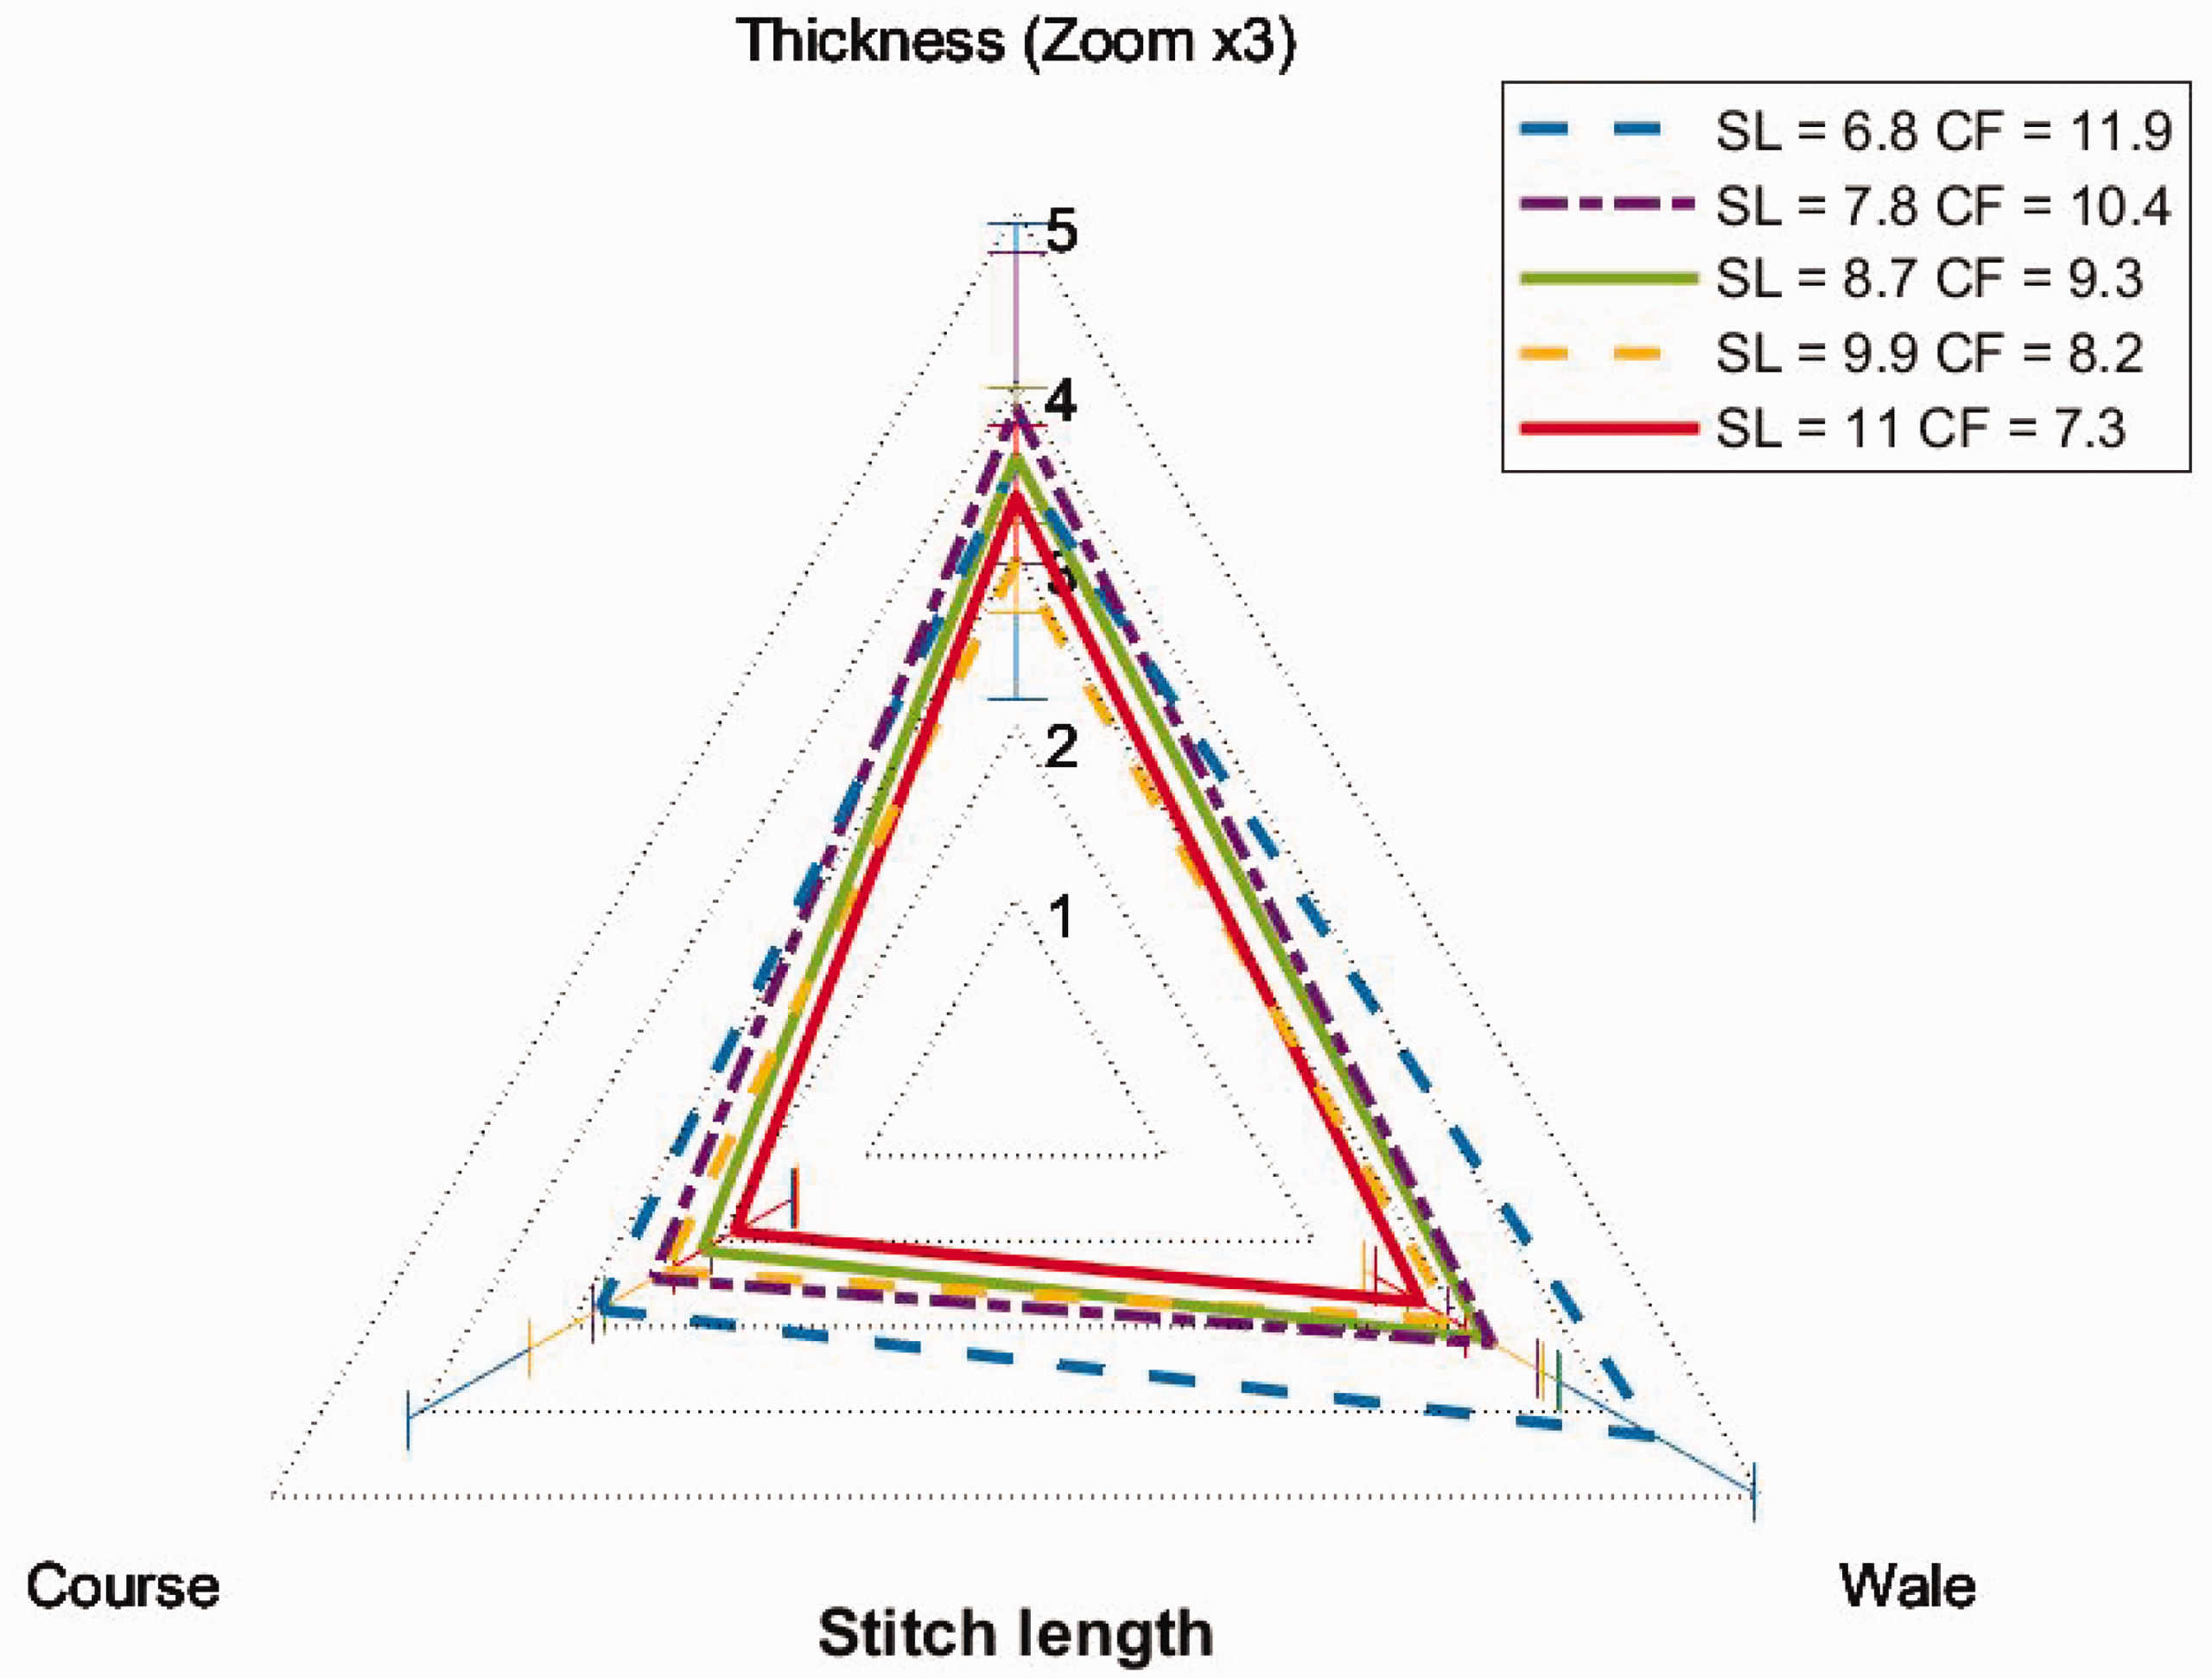
Normalized dimensions of the droplet shape after the compression–decompression test for samples made from the acrylic yarn for different stitch lengths and then cover factors.
Influence of the cover factor/yarn count
The principle used was to increase the yarn count for a fixed stitch length. The cover factor then increases due to an increase in the total yarn count (Equation (1)) and the geometry of the stitch is conserved. Two sets of fabrics were investigated (Table 1): (i) set #1 in acrylic (samples 1a12/1a12-F2 and 1a14/1a14-F2 and (ii) set #2 in cotton (4b10-F1 to F3).
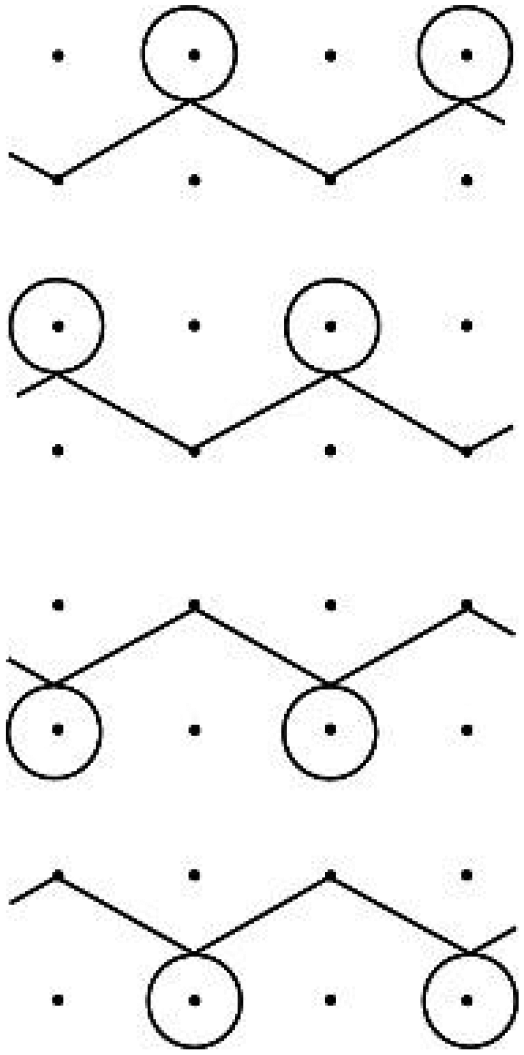
The 3D reconstructions are illustrated in Figure 16 for set #2.
Three-dimensional reconstruction of the droplet shape for samples knitted (a) with one yarn (CF = 7.9), (b) two yarns (CF = 11.1) and (c) three yarns (CF = 13.6) after the compression–decompression test.
The increasing cover factor limits the penetration thickness and promotes spread along the coursewise direction (Figure 17). In this case, the cover factor ratio is approximately 1.4, whatever the fabric couple (Table 1).
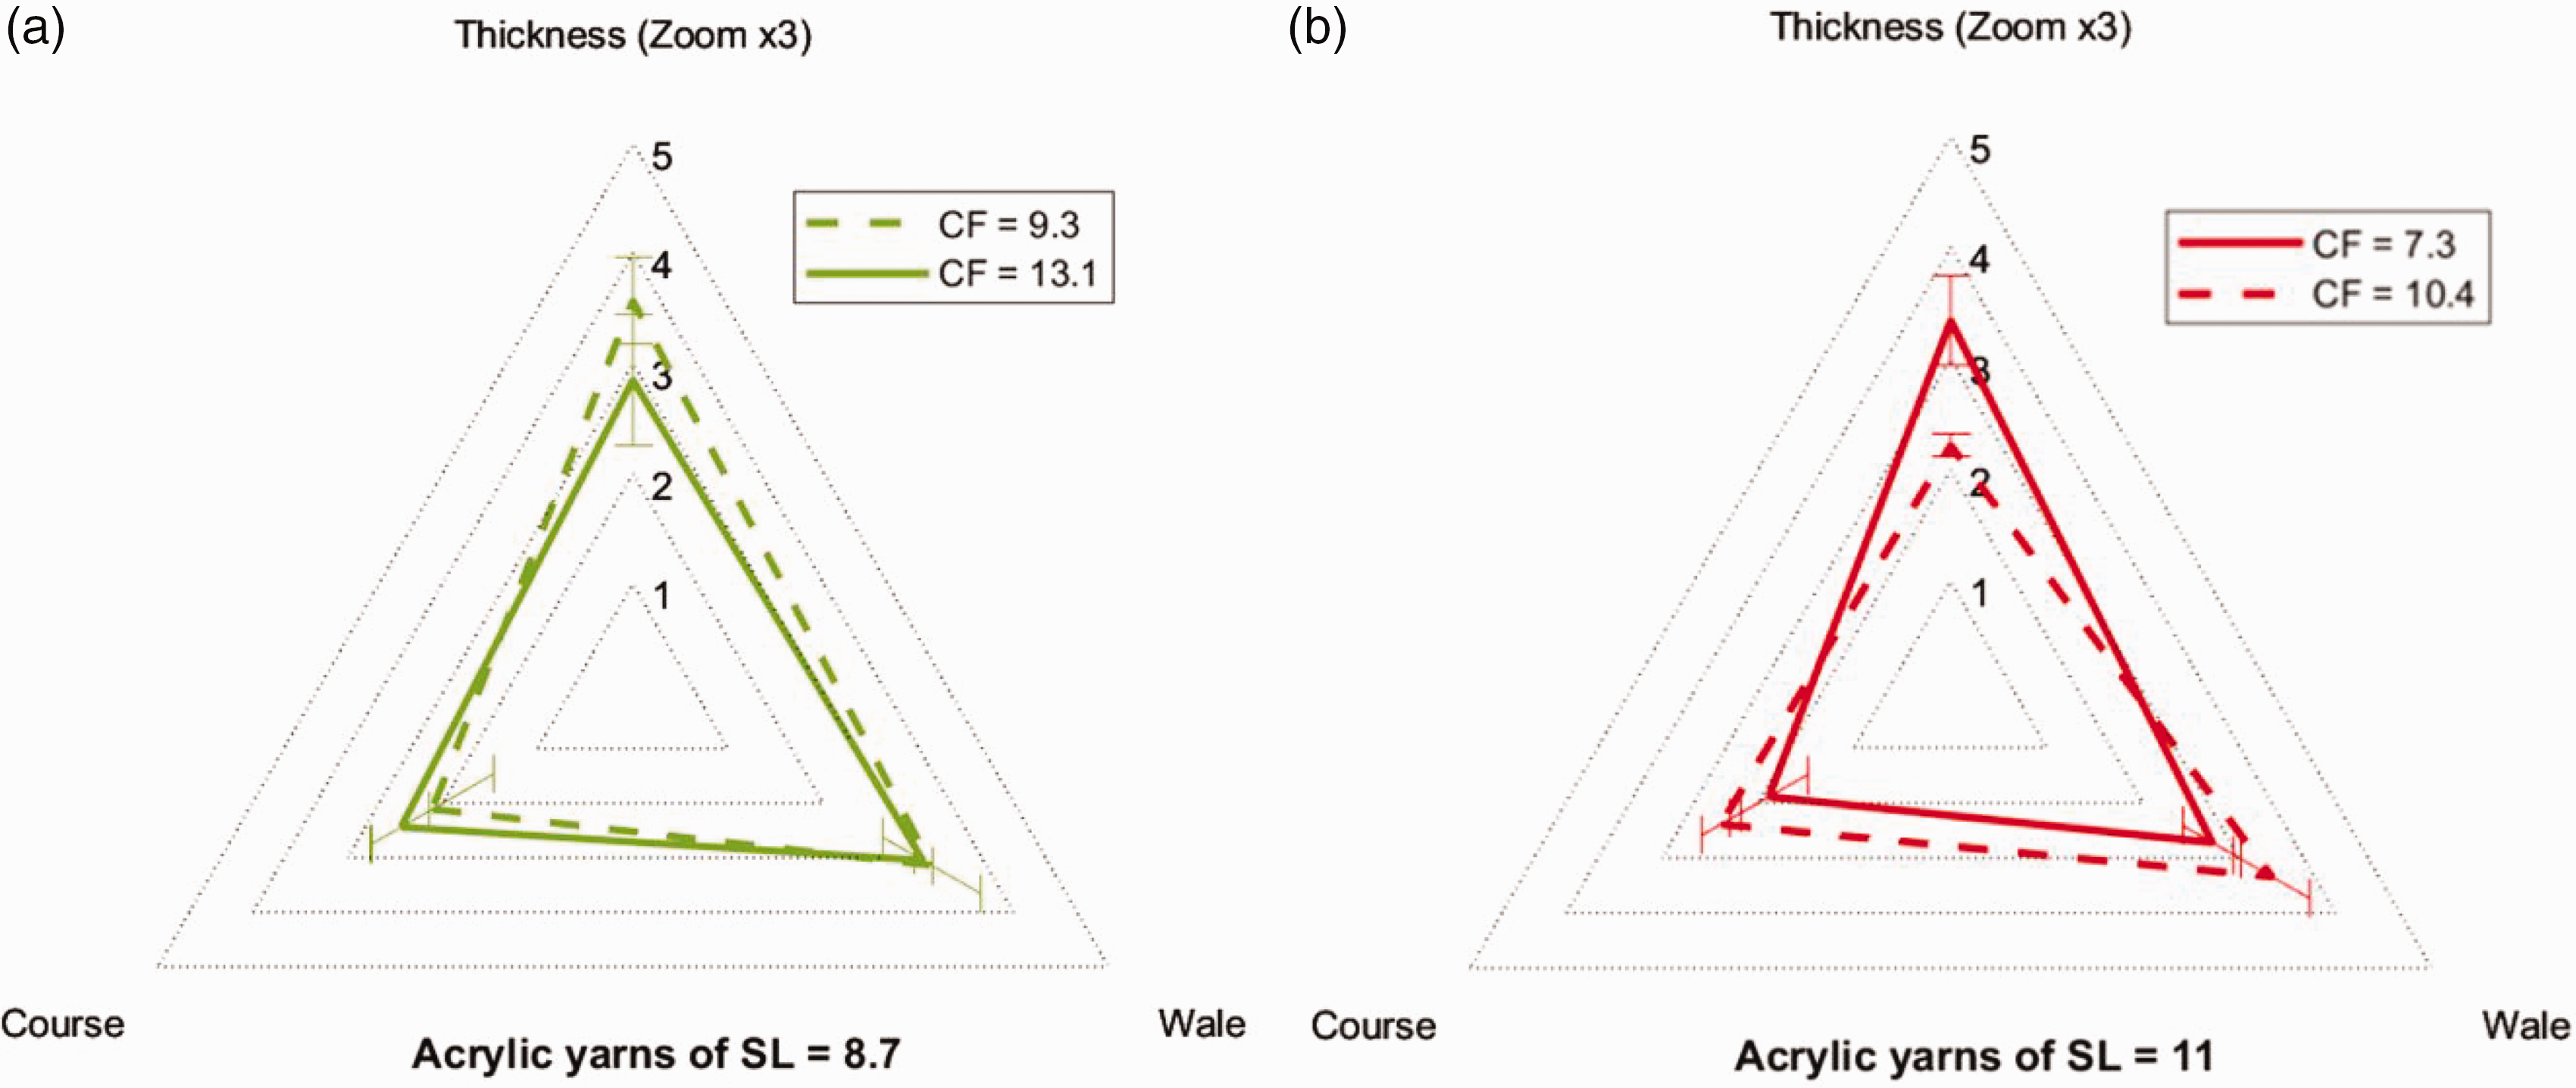
Normalized dimensions of the droplet shape after the compression–decompression test for set #1 samples made from one and two acrylic yarns for two different stitch lengths: (a) SL = 8.7 mm; (b) SL = 11 mm (Table 1).
The same tendency is also visible in Figure 18 for the cotton samples knitted with one, two or three yarns with the same stitch length (respectively samples 4b10-F1, F2 and F3, Table 1). Moreover, for this set of fabrics the liquid spread also takes place in the walewise direction, which was less visible in the results presented in Figure 17. In this case, the cover factor range is from 7.9 to 13.6, that is, a ratio of approximately 1.7 (Table 1).
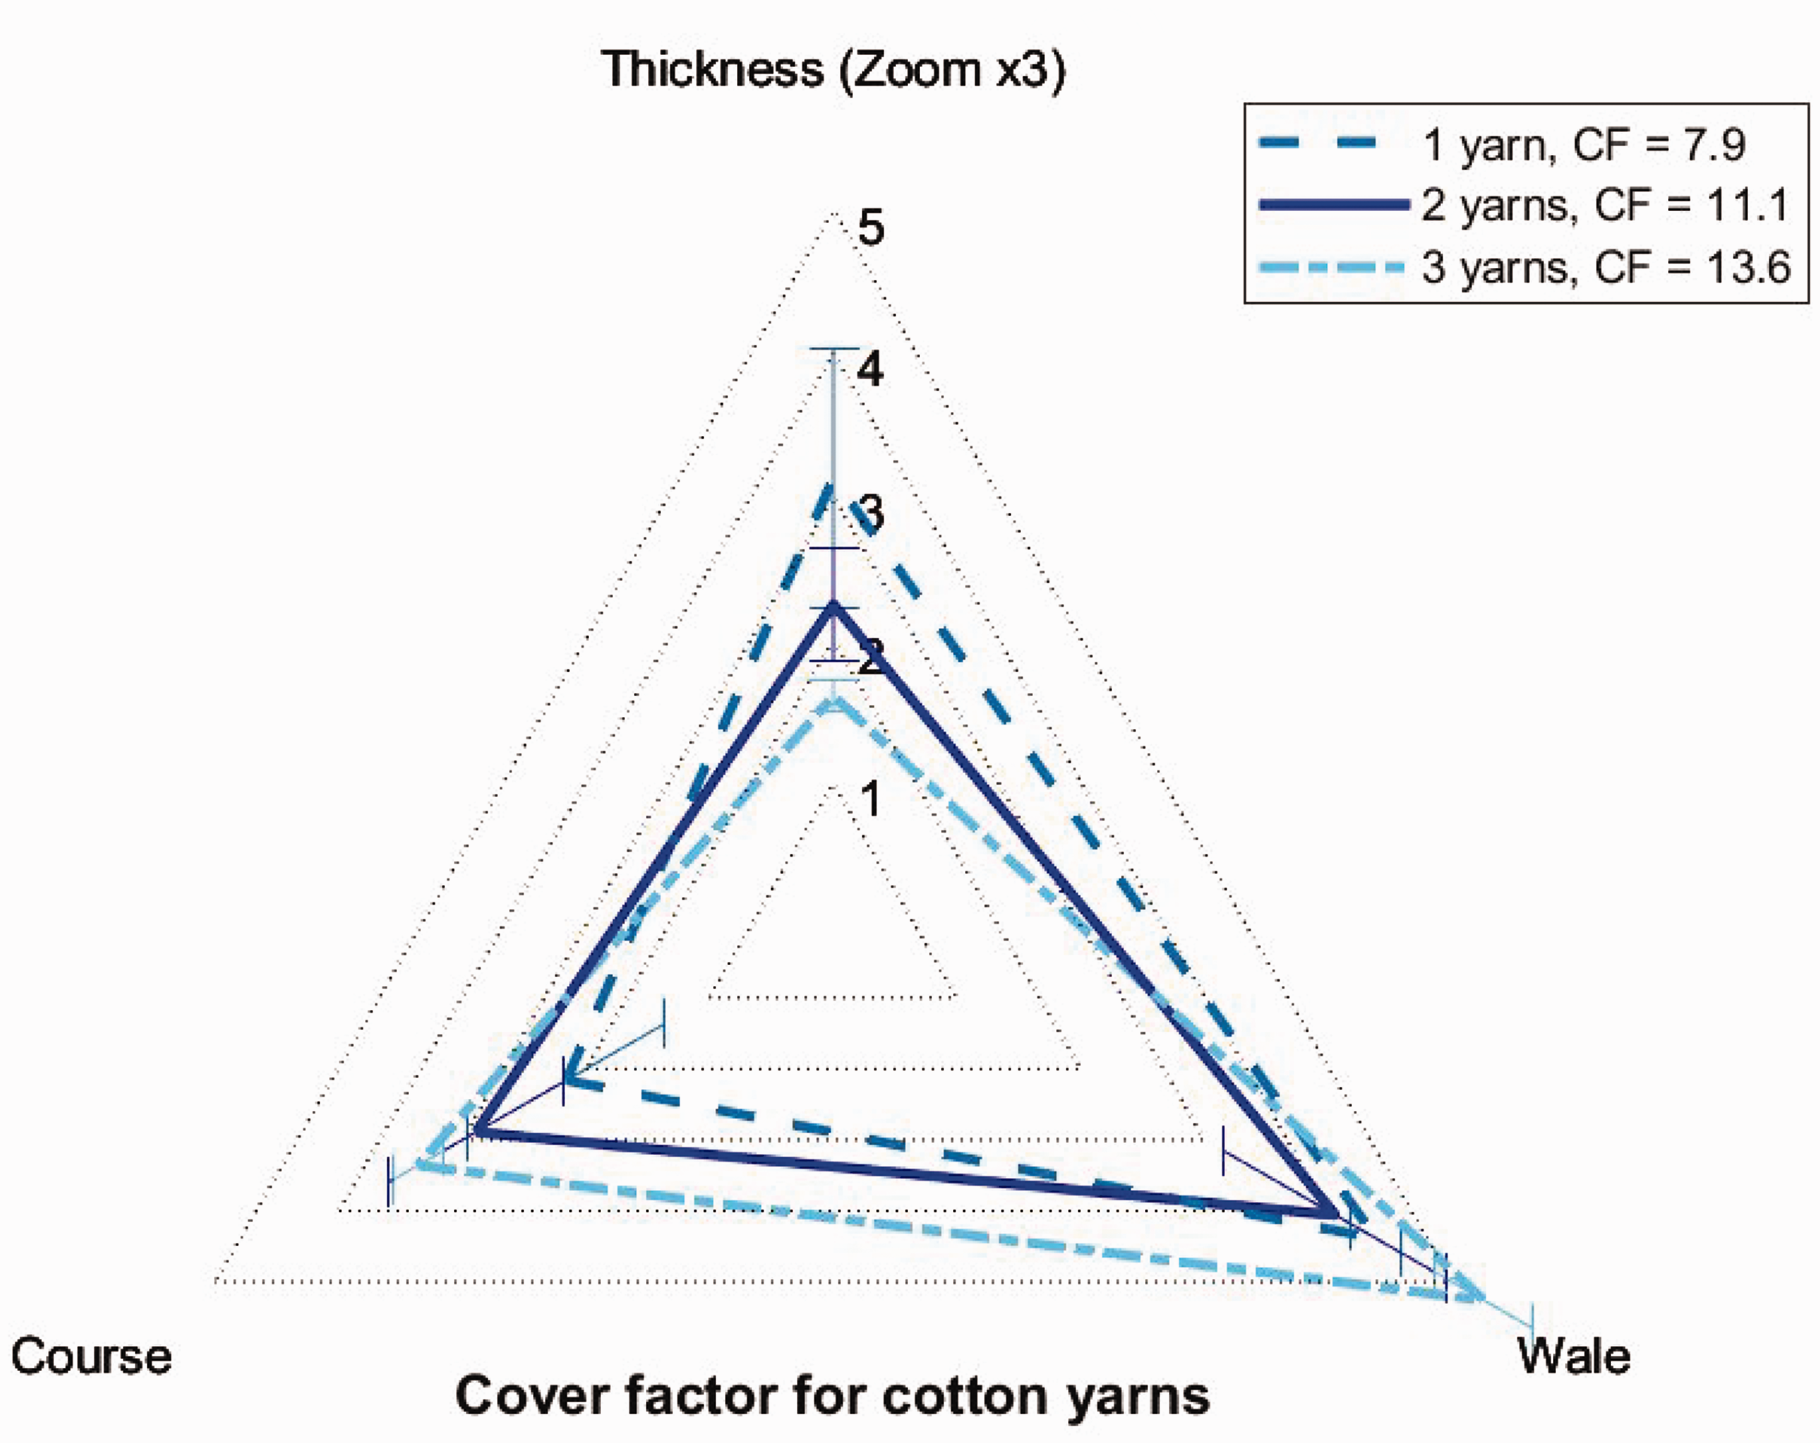
Normalized dimensions of the droplet shape after the compression–decompression test for set #2 hydrophobic treated samples made from one, two or three cotton yarns for a fixed stitch length (Table 1).
Changing the cover factor at constant stitch geometry seems to induce variations in droplet spreading in the three directions.
Fixed cover factor with different stitch lengths and yarn count
The cover factor is an important parameter in penetration behavior. In this section, the goal was to keep the same kind of knit and the same cover factor while changing both the stitch length and yarn count. Fabrics 1a11 and 1a14-F2, which have a cover factor of 10.4 (Table 1) are compared. Figure 19 illustrates the difference in material density in both fabrics.
Two-dimensional visualization of the droplet for samples with the same cover factor (CF = 10.4) (a) with a yarn count of 65 tex and a stitch length of 7.8 mm and (b) with a total yarn count of 130 tex and a stitch length of 11 mm.
The results obtained show a distinct penetration thickness for similar spreading in the coursewise and walewise directions (Figure 20).
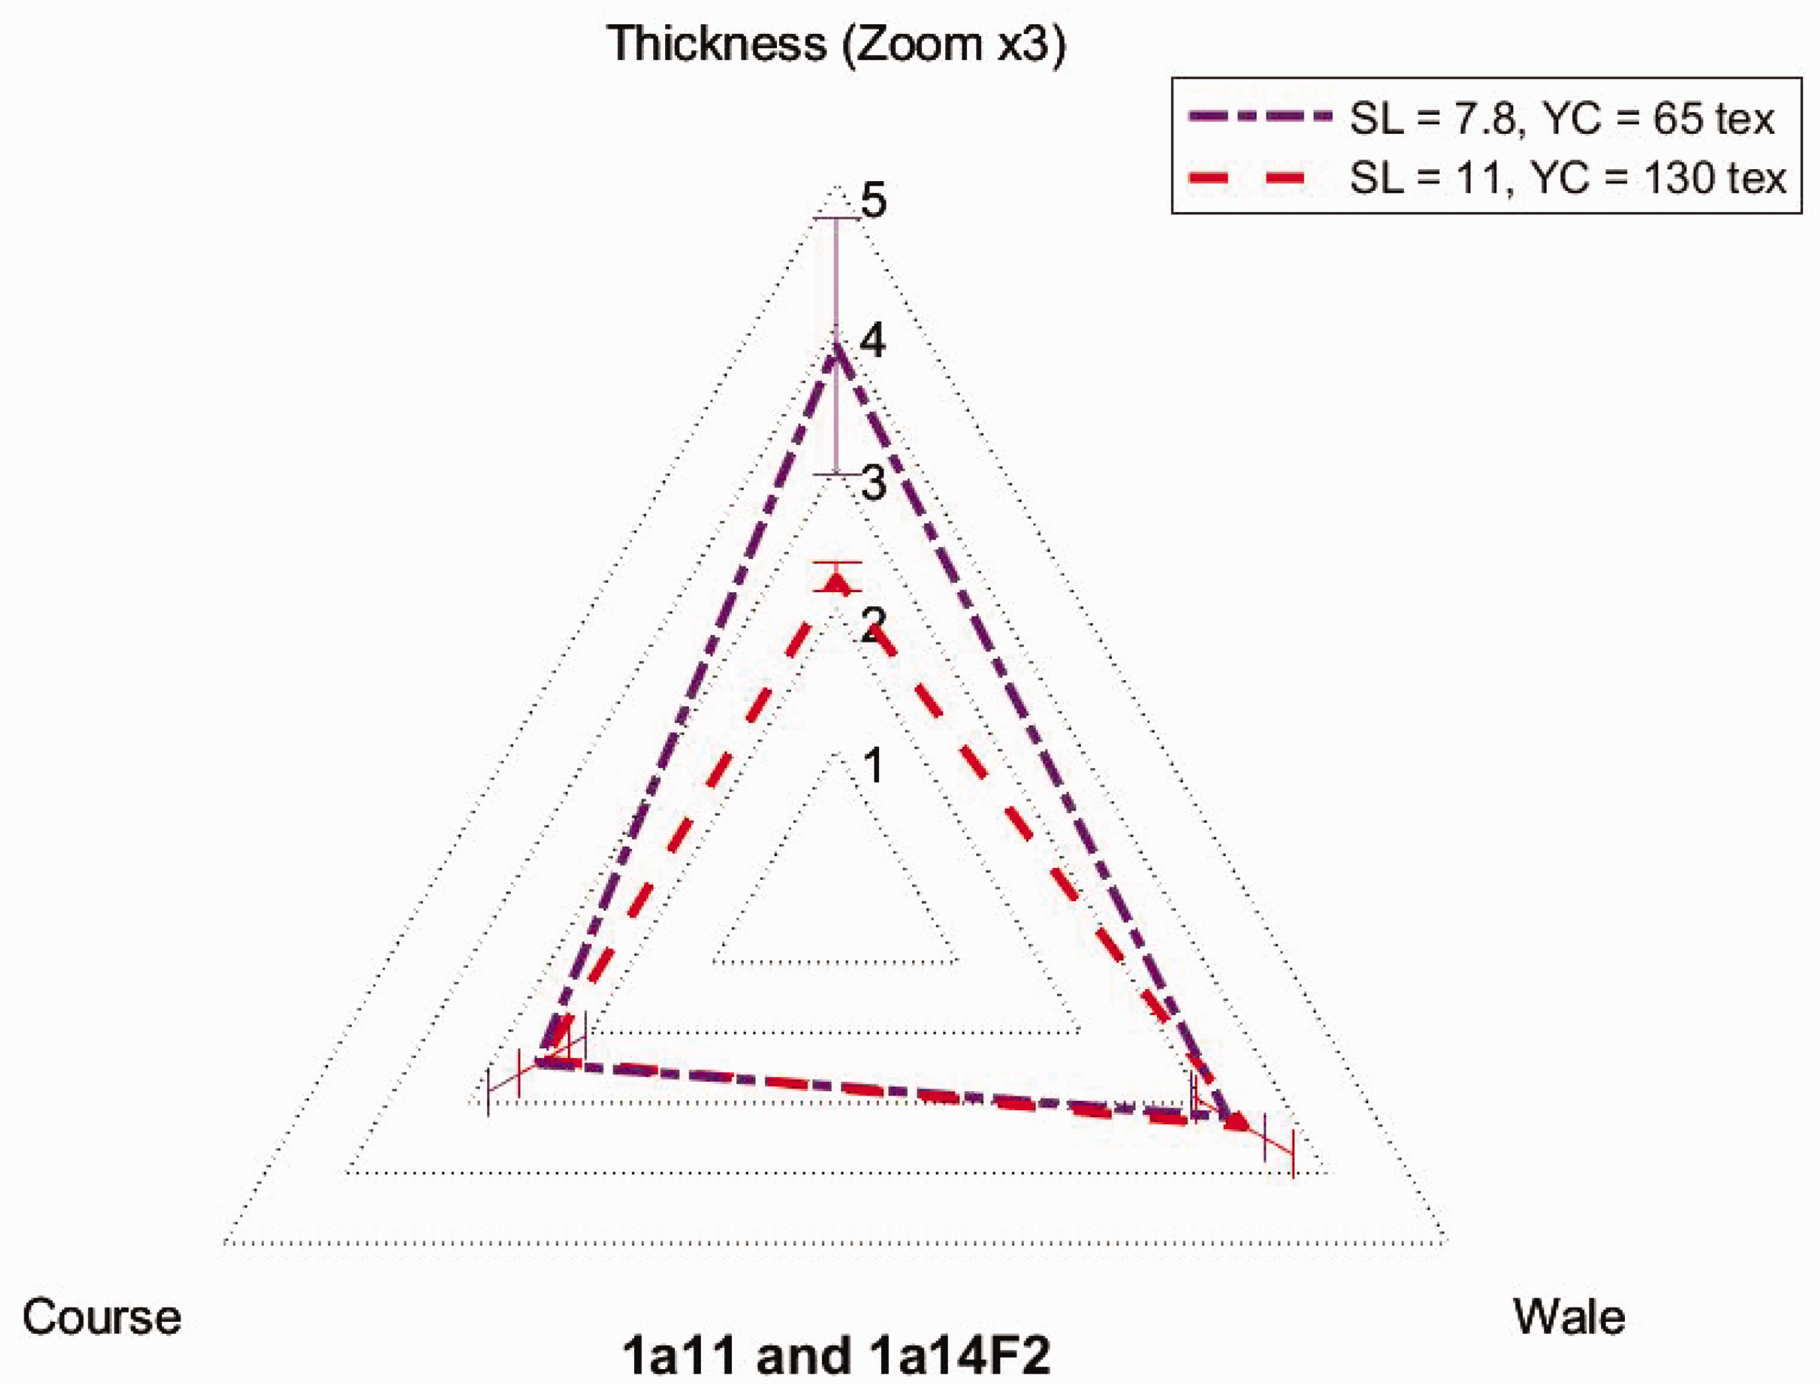
Normalized dimensions of the droplet shape after the compression–decompression test for samples with the same cover factor (CF = 10.4) but with different stitch lengths and yarn counts (Table 1).
Influence of the kind of knit
Complementary trials were carried out changing the kind of knit, then the structure and the surface texture.
Knits P1 and P2 were very similar, as shown in Table 2. It can be confirmed by the structure geometry, as revealed in Figure 21, meanwhile, that the droplet shape after compression–decompression differs drastically, as shown in Figure 22. The factors affected here are mainly impregnation thickness and walewise expansion.
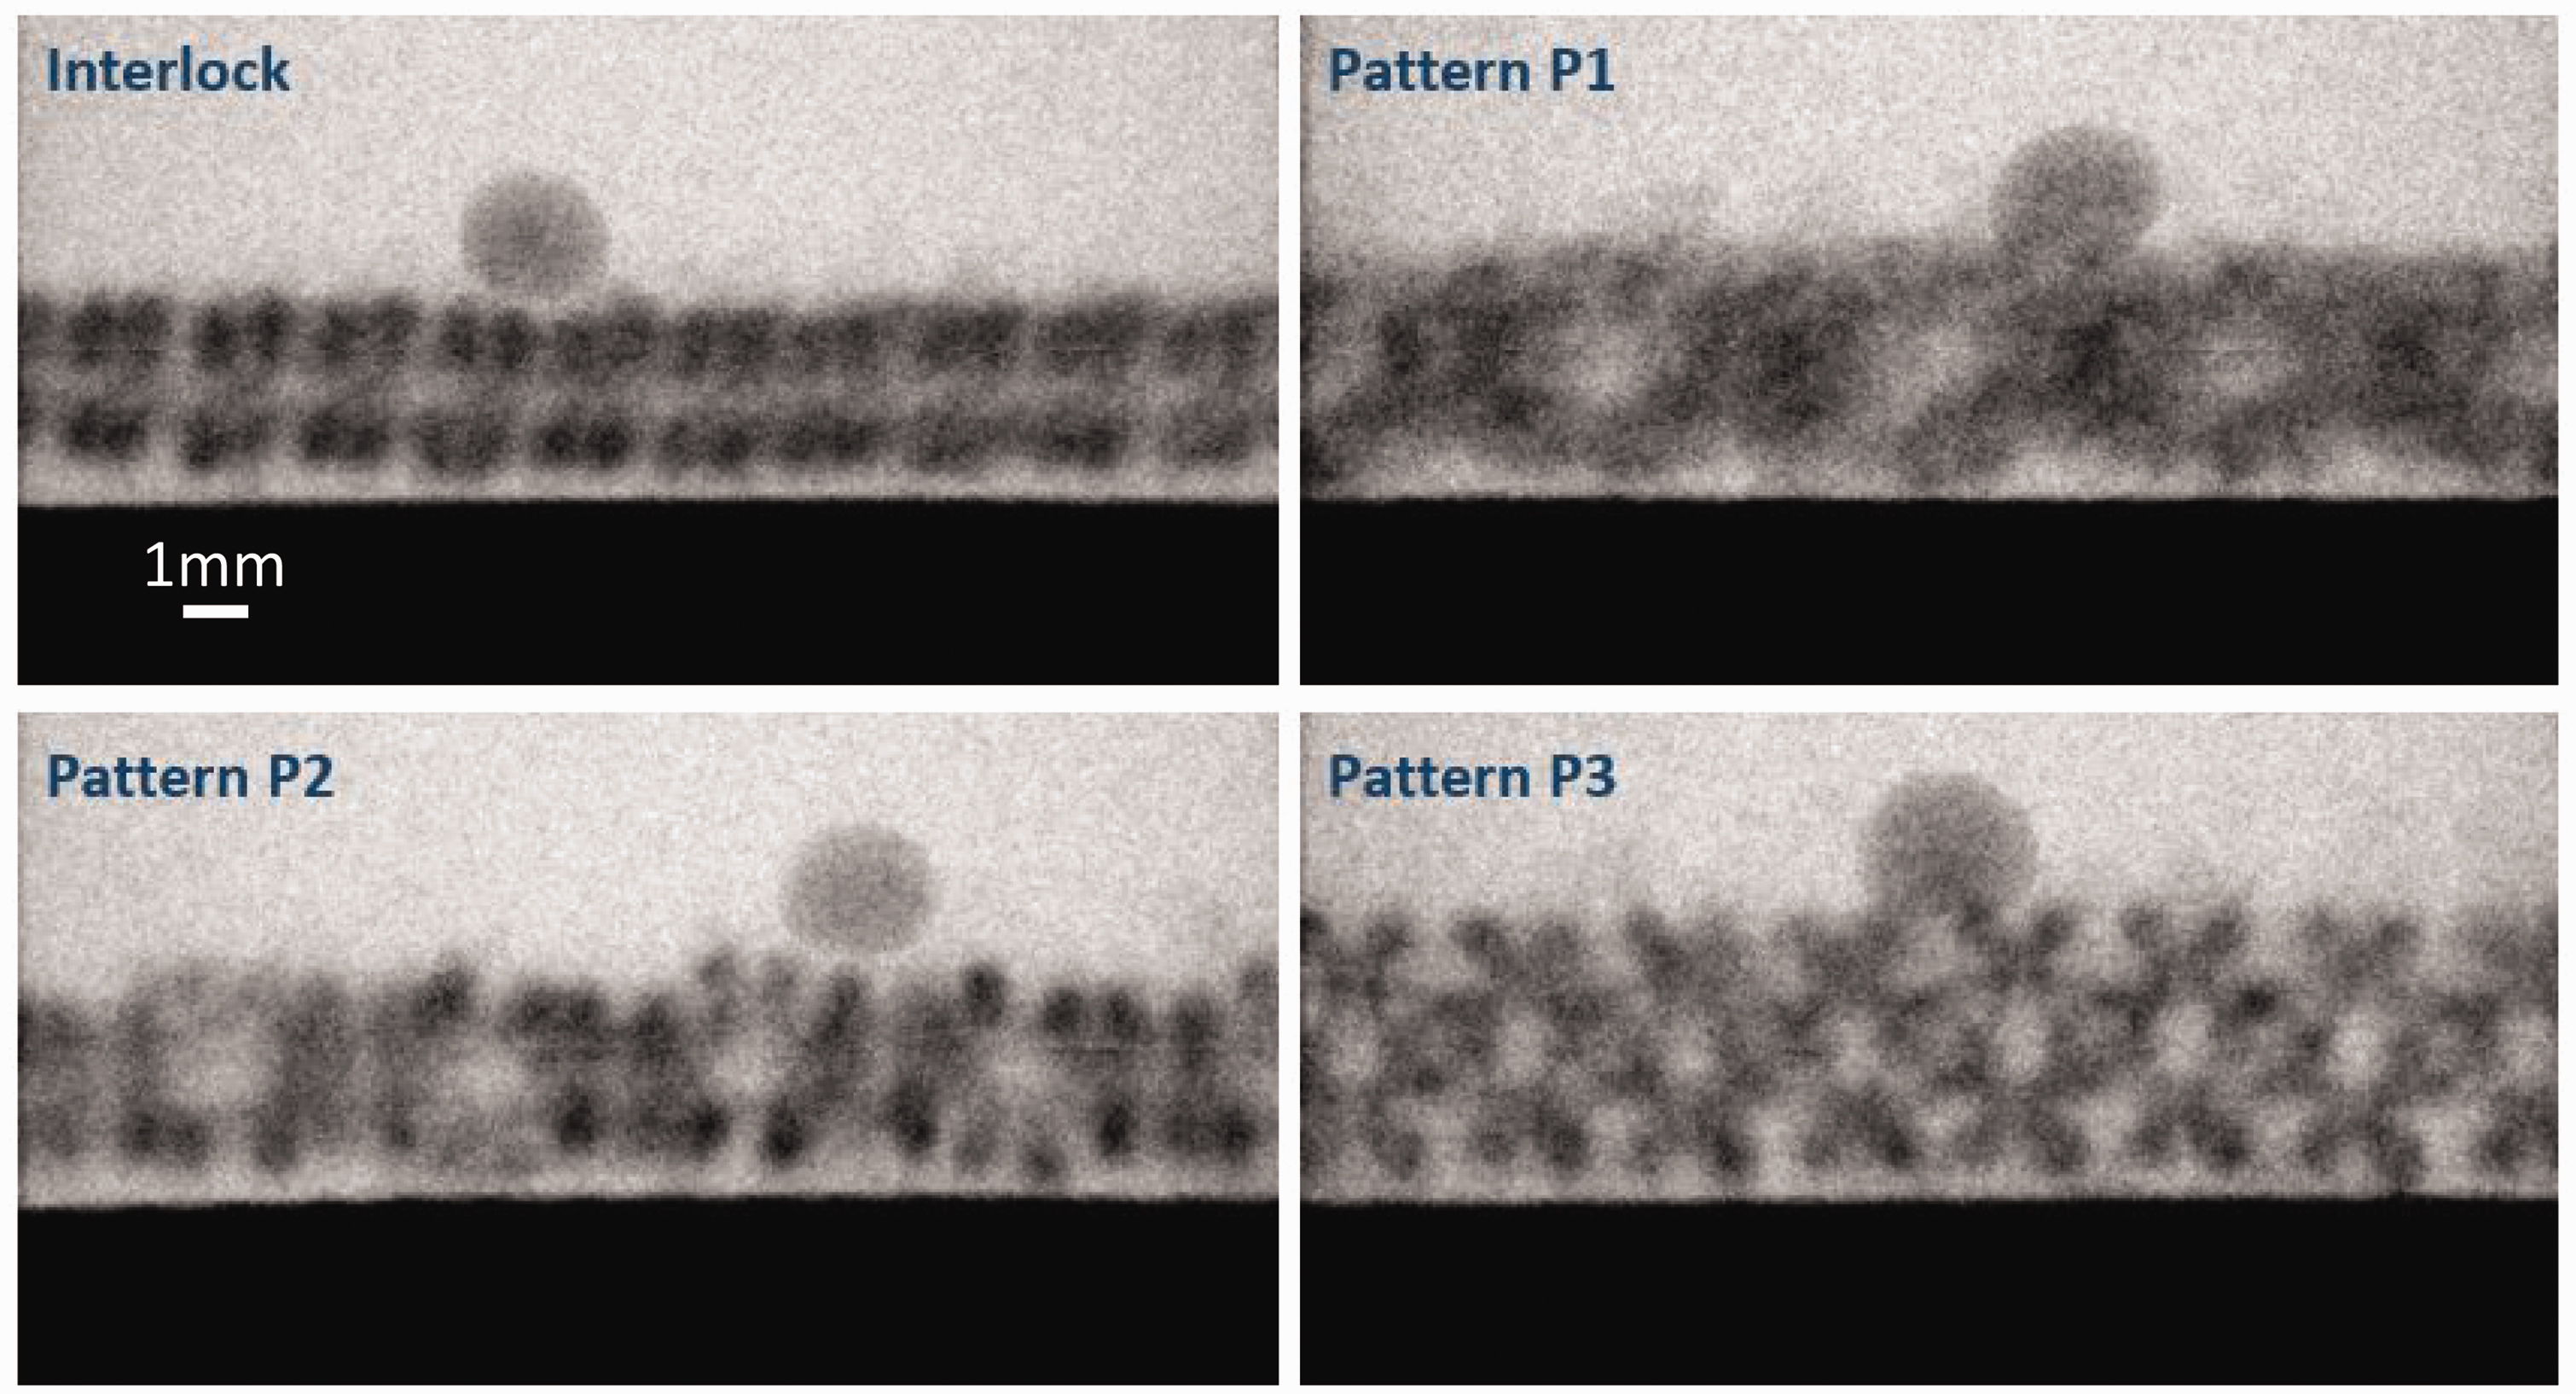
Two-dimensional visualization of a droplet deposited on four samples with the same stitch length and different kinds of knit.
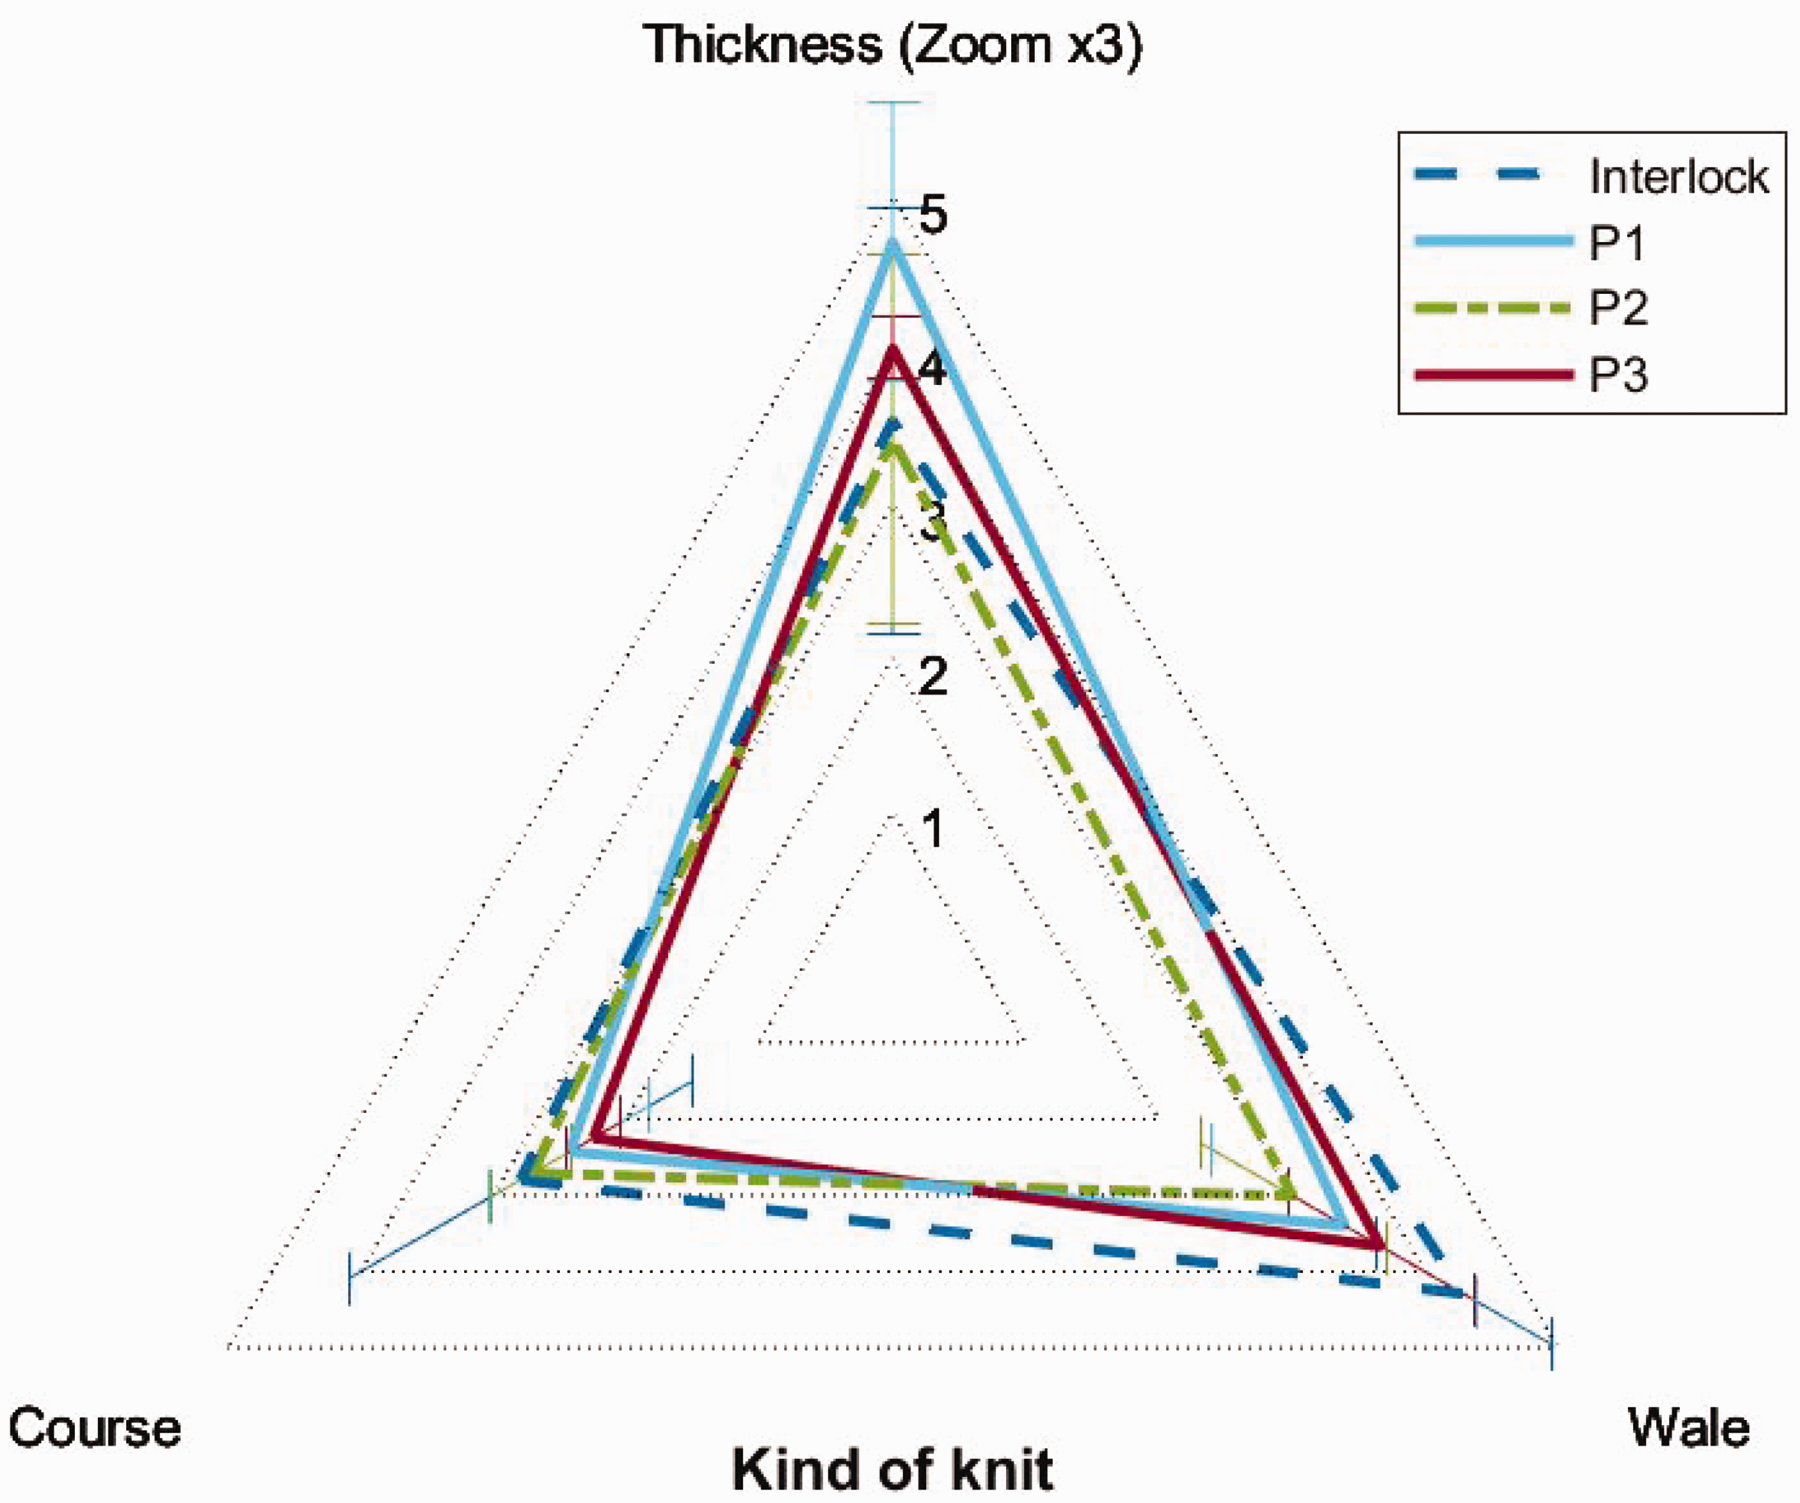
Dimensions of the droplet shape after the compression–decompression test for samples made from different kinds of knit with the same stitch length (Table 1).
Discussion
On the influence of the fabric parameters
The 14 different knitted samples allowed an analysis of the influence of the following parameters: the hydrophobic property, fiber material, stitch length, cover factor and kind of knit. Therefore, these fabrics had different levels of hydrophobicity and multiscale porosity. As was shown in the Results analysis and influence of the fabric parameters section, the two most important parameters for water penetration into a textile structure are its level of hydrophobicity and pore size. This tends to corroborate some results indicating that the factors determining the liquid pressure required to enter a hydrophobic fibrous network are the wettability of the material 9 and the pore size. 11
The chemical treatment modified the initial properties of the two materials used, that is, acrylic and cotton, turning them into hydrophobic materials. The acrylic fabrics were compared before and after this treatment (Influence of the hydrophobic chemical treatment section) and all the cotton fabrics used were treated (Influence of the cover factor/yarn count section). For all the fabrics investigated in this study, before compression, the droplet presented a contact angle much higher than 90° at the textile surface, as can be seen, for instance, in Figures 9 and 19.
The influence of porosity at the yarn scale, 27 that is, between the fibers or intra-yarn, was not investigated in this study because the fabrics compared were made of the same yarn. Porosity at the fabric structure scale, that is, inter-yarn, was modified in two different ways: by varying the stitch length for the same yarn or by varying the number of yarns for the same stitch length. This porosity can be evaluated in a first approach with the cover factor: the higher the cover factor, the lower the porosity (Table 1).
In this study, a droplet is first placed on the textile surface; therefore, the liquid volume is small, and it corresponds to a different case to an infinite reservoir.
The droplet spreading on and inside the structure was quantified after compression–decompression by measuring the dimensions of the droplet in three directions (wale, course and thickness), and the fluid dynamics were observed from qualitative point of view by 2D projection.
On the influence of the cover factor
The influence of the fabric cover factor was noticeable whatever the method used, by changing the stitch length (Influence of the cover factor/stitch length section) or the total yarn count (Influence of the cover factor/yarn count section). According to the results obtained, when the cover factor increases, that is, when the porosity decreases, the transplanar liquid penetration decreases, favoring in-plane spreading (Figures 15, 17 and 18). It seems that changing the cover factor in the same range of 1.6 and 1.7 is not equivalent if the stitch length or yarn count are modified. In fact, stitch length influences in-plane spreading more (Figure 15), whereas a change in yarn count changes both in-plane and transplanar spreading (Figure 18). Changing both of them while maintaining the cover factor (Fixed cover factor with different stitch lengths and yarn count section) influences transplanar spreading, showing a change in the pore geometry (Figure 20).
From a global point of view, for a given knit pattern, the expansion of the droplet of liquid monotonically increases with the cover factor in the planar directions (Figure 23(a) and (b)). For the samples considered in this study, a linear correlation (R2 = 0.88) appears for the normalized course dimension (Figure 23(b)). For the wale direction, the relationship is less clear (R2 = 0.50). No specific trend was observed in the transplanar direction (Figure 23(c)).
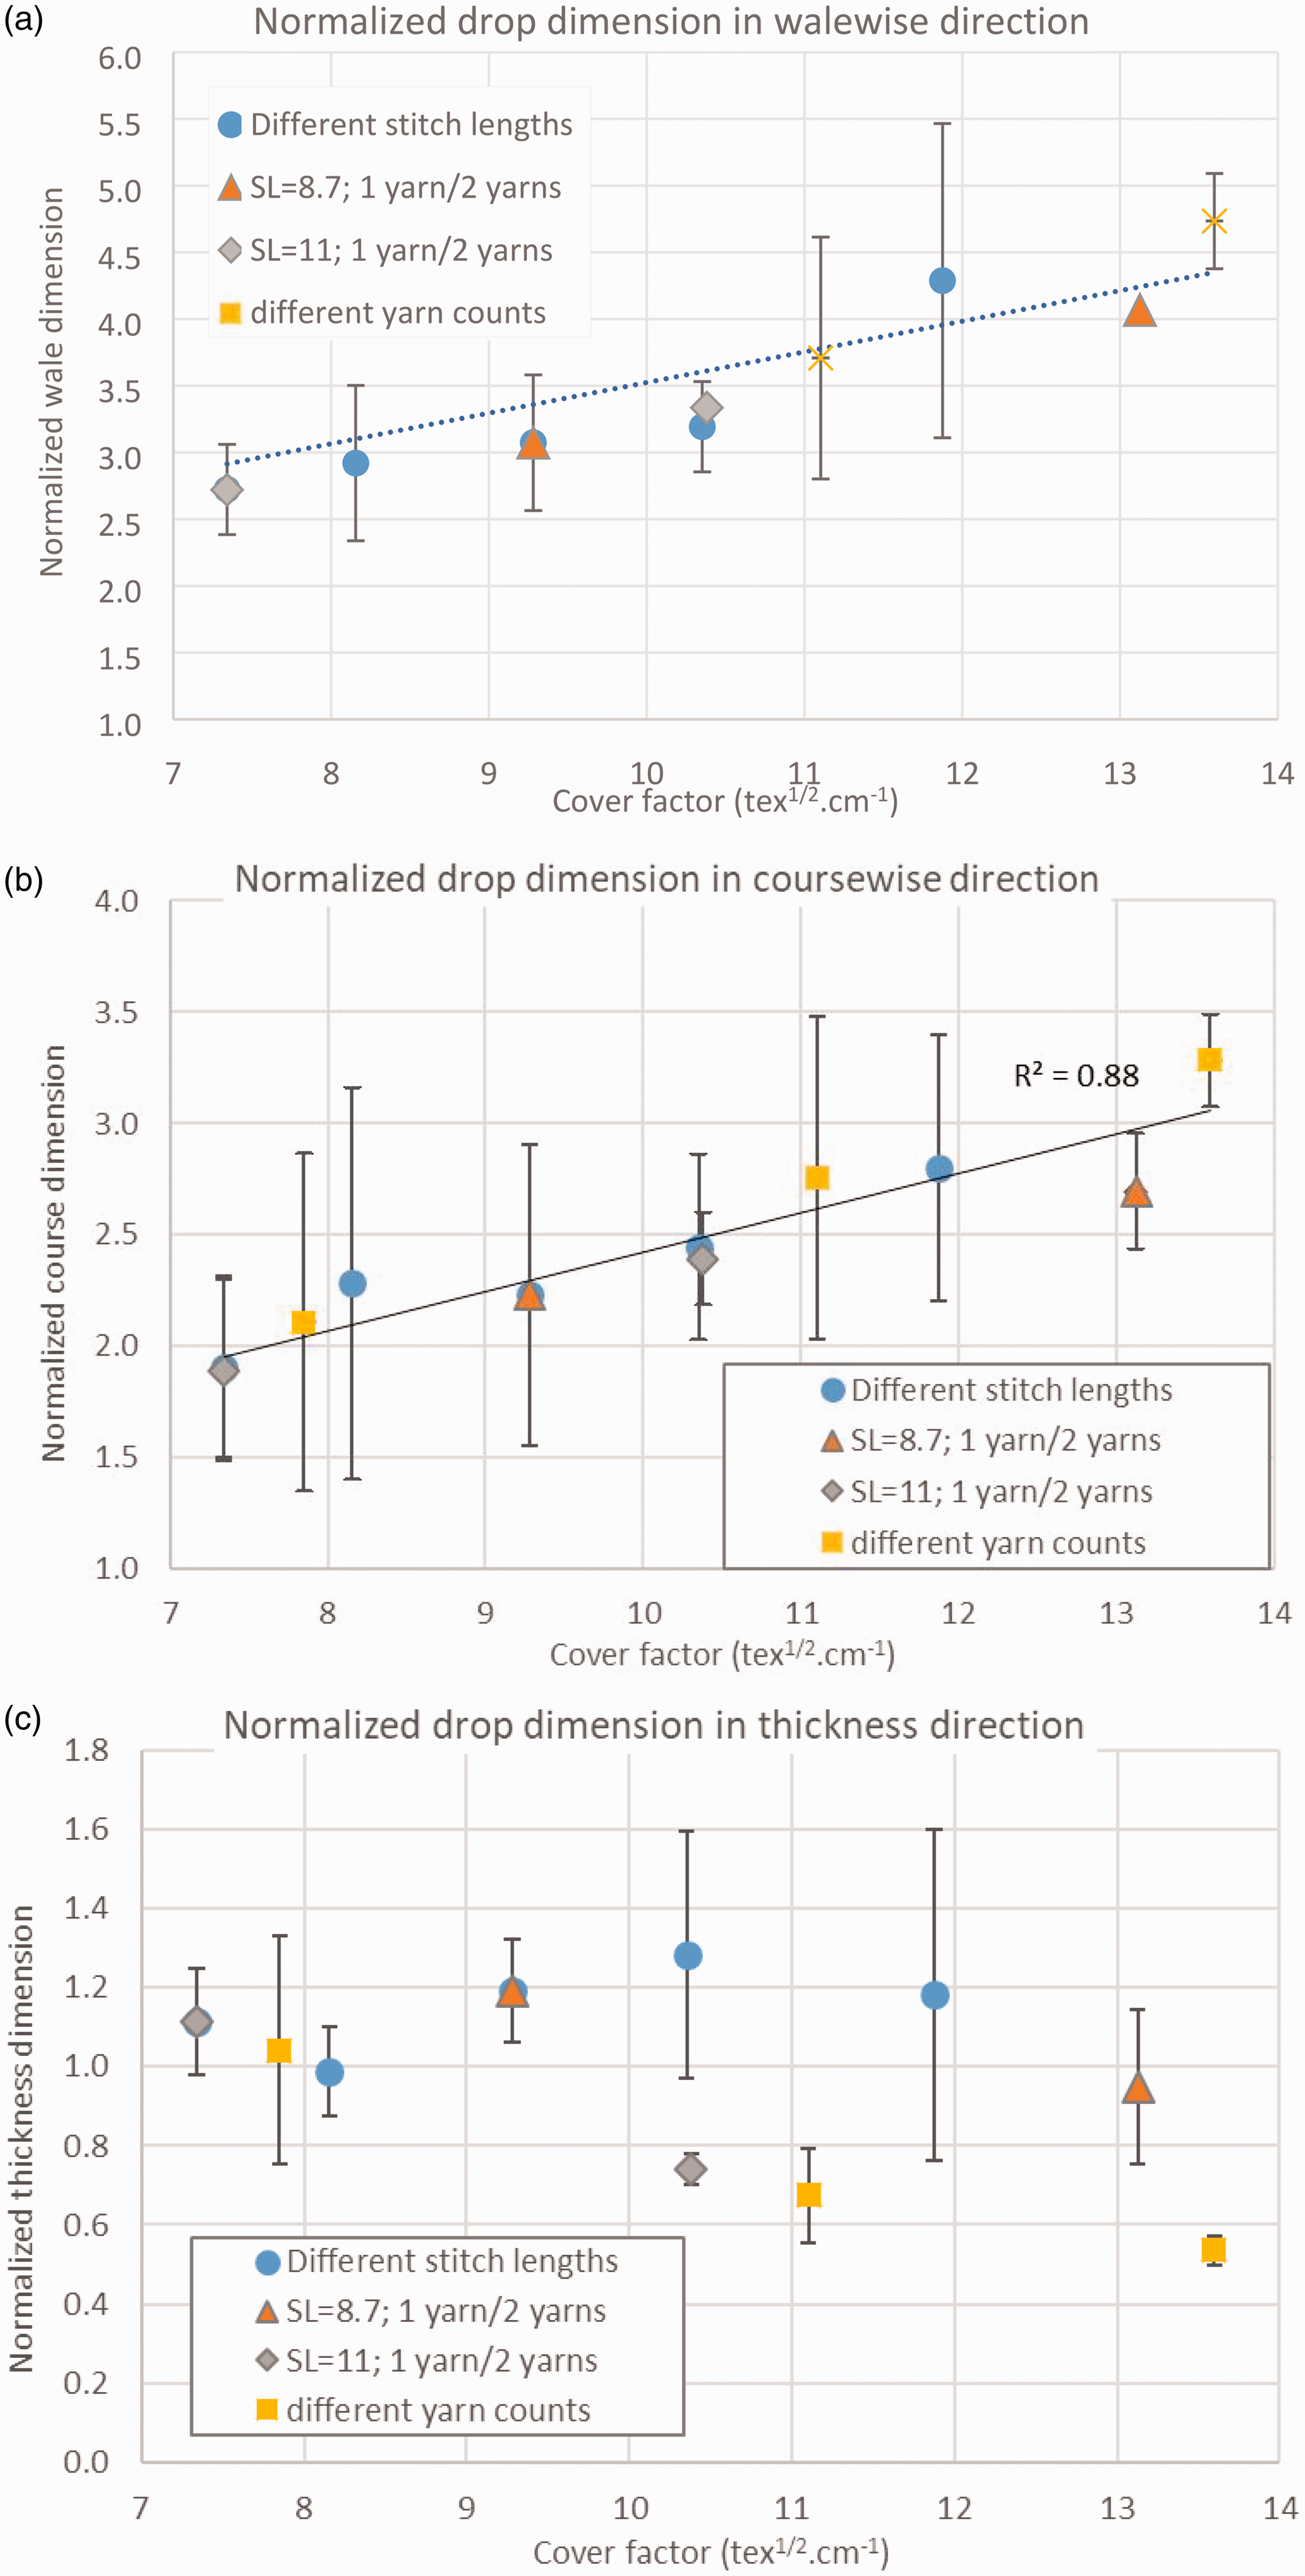
Influence of the cover factor on the non-dimensionalized lengths of the humid shape in the (a) wale, (b) course and (c) thickness directions.
On the combined influence of the cover factor and hydrophobicity
Two identical structures with a high cover factor (CF = 11.9), that is, with low porosity, were compared before and after hydrophobic treatment (Influence of the hydrophobic chemical treatment section). A preferred direction of spreading appeared along the wale for the untreated sample (Figure 10), while the treated sample showed no preferred direction. At constant water volume, the untreated fabric generated a less compact and more deeply trapped liquid shape inside the textile sample than the highly hydrophobic fabric, probably due to some liquid invading the thinner voids (intra-yarn capillaries). 38 However, during compression, it was observed that the water deeply penetrated the treated fabric, mainly filling the structure pores (inter-yarn voids) before re-covering the surface at the end of the compression. For textile structures with a low cover factor, intra-yarn invasion should be less significant because the inter-yarn pores are more important for water spreading. As a practical implication, a single layer of a liquid-repellent textile is thus not sufficient to obtain a liquid-protective fabric under the action of applied pressure. The usual use of multi-layer materials is needed to halt liquid penetration. 22
A decrease in porosity, that is, an increase in the cover factor, modifies the privileged directions of spread by increasing expansion in the walewise and coursewise directions (Figures 15 and 18) and/or by decreasing penetration into the thickness (Figures 17 and 18).
For spontaneous wicking following droplet deposition in non-hydrophobic textiles, the process mainly starts with a liquid penetration, that is, a liquid transport normal to the plane of the textile, which is followed by in-plane spreading. 39 Here, during the forced migration of the deposited droplet, the first stage mainly consisted of spreading on the surface for hydrophobic structures, and then the liquid penetrated through the thickness. After decompression, no wicking was observed; the liquid either remained trapped inside the textile structure or partly moved back to the surface.
Among the geometric textile variables, the cover factor appears to be predominant for in-plane liquid expansion. Increased density in the knitting construction promotes lateral dispersion, as was hypothesized by Rossi et al. 29 The transverse penetration mechanism could not be directly attributed to a specific material parameter and revealed different mechanisms according to the pore structure. Liquid invasion privileged inter-yarn pores for large stitch lengths and took a path through inter-fiber pores for small stitch lengths.
From a global point of view, in-plane expansion can be tuned by the cover factor: the higher it is the better is in-plane spreading, whatever the method used to change it. However, transplanar spreading seems less related to the cover factor: it is decreased by hydrophobic chemical treatment (Figure 10) or by using a coarser yarn, that is, by decreasing the pore size due to the stitch shape (Figures 17, 18 and 20).
On the method of analysis
X-ray imaging enables non-invasive quantitative monitoring of liquid dispersion within opaque fabrics with a complex pore structure. The in-plane spreading can be analyzed, and privileged directions are highlighted. The quantity of liquid as a function of thickness is also accessible. This method is a 3D generalization of the usual methods mentioned in the introduction of evaluating liquid retention and barrier performance against liquid penetration. The usual tests often give 2D information for in-plane liquid spreading (capillary rise method, moisture management tester, etc.) or the transverse property (spontaneous wettability or forced wet-through tests). Here, the 3D information is obtained by taking into account the shape of the liquid zone inside the fabric.
The textile was also imaged so that the intrusion of the liquid droplet could be observed whilst external pressure was applied. This test is complementary to the usual imaging tests dedicated to the study of spontaneous wicking behavior in hydrophilic fabrics.22 –31 The property available for evaluation is fabric wet-through robustness, for example to prevent surgeons or firefighters from liquid contaminants.
The exploitation of the presented results, mainly via the maximum lengths of the liquid dispersion in the three directions (walewise, coursewise and transversal), depends on the fabric's practical uses and the textile process parameters. For conductive inkjet printing, for example, the in-plane ink dimensions must ensure the neighboring coalescence to provide a conductive path. However, these dimensions are expected to guarantee the required print definition. The penetration depth must be large enough to obtain good adhesion of the ink on the fabric while optimizing the quantity of dispensed ink.
The triangle diagramming of these dimensions chosen here highlights the maximum expansion of the liquid inside the textile structure in the privileged direction corresponding to the walewise, coursewise or transverse direction. The number of fingers or quantity of liquid present at the maximum wet-depth is lacking to provide a complete description of the results.
Optimizing the resolution of the tomographic images obtained, as described by Blunt et al., 23 should provide a finer understanding of the phenomena at play.
Conclusion
This study presents a new method using X-ray imaging and tomography to study the complex forced water spreading behavior of hydrophobic textiles with different geometrical characteristics.
This study focused on the liquid penetration driven by an applied compressive load. It should be emphasized that it followed a different dynamic from liquid penetration driven by capillary pressure alone, which is termed “wicking.” Understanding within-a-yarn and yarn-to-yarn wicking within a fabric is a first step towards predicting liquid movement inside textile structures. Meanwhile, considering water distribution in fabrics during and after compression is key to predicting the robustness of a textile barrier versus liquid penetration.
Hydrophobic treatment was shown to minimize water retention properties, but did not inhibit transverse water penetration during compression.
This study showed that future measurements in real-time 2D radiography during compression could be sufficient to identify the in-plane and transplanar water distribution. In particular, the water remaining in the hydrophobic structure after the end of the compression should be analyzed in more detail in future work.
Footnotes
Acknowledgements
The authors are deeply grateful to Brigitte Camillieri, assistant professor at the University of Haute Alsace for manufacturing the knitted fabrics. The author thanks Philippe Kunemann for the measurement of yarn wetting properties.
Declaration of conflicting interests
The authors declared no potential conflicts of interest with respect to the research, authorship, and/or publication of this article.
Funding
The authors disclosed receipt of the following financial support for the research, authorship, and/or publication of this article: This research was partly supported by a PHC French-Swiss grant [no. 46577ZL].