
Abstract
The meso-structure of woven fabrics plays a pivotal role in enabling significant deformations. To precisely characterize the deformation behavior of woven fabrics, a mesoscale model based on their meso-structure is developed. In this model, the fiber yarn is represented as a Timoshenko beam with fluctuations described by the shape function. A novel approach is proposed to establish the relationship between the macroscopic mechanical response and the infinitesimal strain of the beam, employing the principle of virtual work. The shearing behavior of woven fabrics is characterized by considering friction energy dissipation and transverse compression among fiber yarns. The general applicability of the proposed model is validated through its application to glass fiber woven fabrics and jute fiber woven fabrics. The model parameters are determined through uniaxial tensile and bias-extension experiments. The accuracy of the model is verified using bias-extension and picture frame experiments. The results demonstrate that the proposed model can effectively simulate the large deformation of woven fabrics.
Woven fabric-reinforced composites, comprising high-strength continuous fibers, find extensive applications in the automotive and aerospace industries due to their exceptional specific strength, stiffness, and formability characteristics. However, these advantages are accompanied by significant manufacturing challenges. During the forming process of parts with complex geometries, various defects such as wrinkling, fiber slippage, and breakage are commonly observed. Numerical simulation offers a powerful tool for optimizing the process parameters, material selection, and tooling design, thereby mitigating the need for costly and time-consuming trial-and-error approaches in the forming process design. To establish a foundation for numerical simulation, extensive research has been conducted in recent years to investigate the material behaviors of woven fabrics and comprehend their forming mechanisms.
Modeling methods of woven fabrics can be categorized as microscale, mesoscale, or macroscale, as shown in Figure 1.1,2 The microscopic model primarily focuses on the correlation between the geometric properties of individual fibers and their mechanical performance within yarns. The mesoscopic model takes the representative volume element as its research object and mainly considers the fluctuation and interaction of fiber yarns. Meanwhile, the macroscopic model treats woven fabrics as homogeneous entities and investigates their overall mechanical behavior.
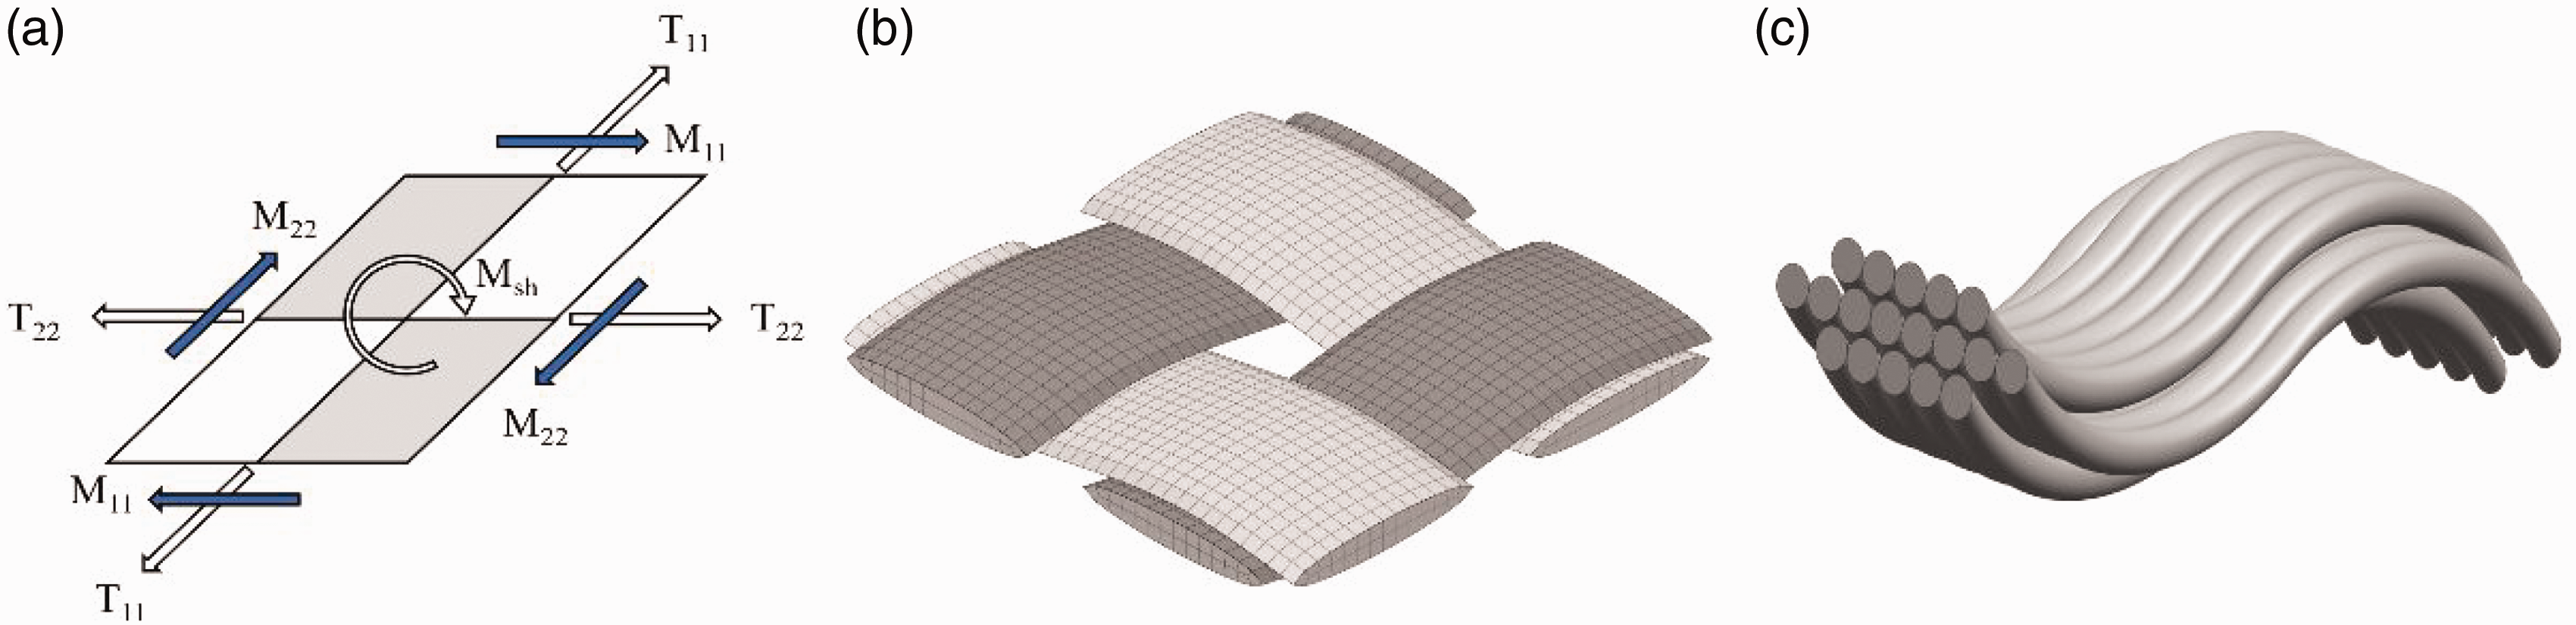
Schematic diagram of (a) macroscopic, (b) mesoscopic, and (c) microscopic models of woven fabrics.
The deformation behavior of woven fabrics is significantly influenced by their meso-structure, including factors such as yarn width and yarn spacing, as well as mechanistic effects such as friction and slippage between fiber yarns, interlayer interaction in multilayer structures, and local reductions in global stiffness due to layering orientation.3,4 The macroscopic model does not account for these factors, yet they play a crucial role in investigating the mechanical properties of woven fabrics.
During the deformation of composites, woven fabric reinforcements undergo high tensile stresses and large strains primarily associated with the in-plane shear mode. 5 In the late stages of forming deformation, wrinkling may appear in the woven fabric reinforcement. As for the research on the tensile model of woven fabrics, Lomov and Verpoest 6 divided yarn strain energy into tension, bending, and compression parts. The principle of minimum strain energy was employed to simulate the deformation behavior of the woven fabric. Chaouachi et al. 7 utilized the minimum energy method to simulate the tensile deformation of fiber yarns, and applied Hertz theory to model the compression deformation of fiber yarns. Yang and Zeng 8 developed a uniaxial tensile model for dry woven fabrics by considering the structure of fiber yarns, which incorporates the effects of tension, bending, and compression deformation of the yarns. Marino and Wriggers 9 utilized Timoshenko beam kinematics to investigate the mechanical behavior of a crimped beam subjected to finite elongation along the beam axis.
The investigation of large deformations in woven fabrics is a prominent research area within the field of mesoscale modeling. Harrison 10 proposed a novel model that employs Timoshenko beam and membrane elements connected by zero-torque hinges to simulate woven fabrics. By utilizing the homogenization method, the macroscopic properties of the fabric are linked to the properties of individual elements within the mesh. Erol et al. 11 enhanced the node connection scheme of the aforementioned model by introducing spring elements to capture the compression deformation and rotation of fiber yarns. However, this approach often disregards the curled structure of yarns. Based on the main mesoscopic deformation mechanism of woven fabrics, Li et al. 12 established a strain model of woven fabrics in a single loading and unloading cycle by energy decomposition. Zhu et al. 13 used the energy-based approach to simulate the shear deformation of woven fabrics until the emergence of large deformations and wrinkles. The in-plane shear energy comprises rotating friction energy at the intersection of yarns, sliding friction energy, and transverse compression energy. King et al. 14 utilized the extensive continuous finite element method to simulate the macroscopic in-plane deformations of woven fabrics, investigating eight distinct mesoscale patterns while assuming constant fabric thickness and non-sliding yarn intersections. The fabric configuration was determined by minimizing the conditional elastic energy function through the macroscopic deformation gradient, with internal forces calculated accordingly. However, the aforementioned studies rarely account for the transverse compression deformation that occurs between fiber yarns.
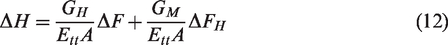
The main challenge of mesoscopic models is accurately describing the discrete internal structure and mechanical response of three-dimensional (3D) woven fabrics. Many mesoscale models focus on studying either the tensile or shear deformation of woven fabrics, and those that investigate shear deformation often do not account for the simultaneous effects of friction and compression deformation between fiber yarns. In contrast to some simplified mesoscopic models, this paper employs energy decomposition to fully capture the structural changes of fiber yarns and the interactions between them during the deformation of woven fabrics. The mesoscale model is established based on the Timoshenko beam theory and the virtual work principle. The model is based on a representative unit cell at the mesoscale and the wave of the beam is represented by a parabolic function. In the tensile deformation of the fiber yarn, the geometric characteristics of the beam wave, the horizontal traction force, and the contact force between fiber yarns are considered. In the aspect of shear deformation of woven fabrics, the effects of friction and transverse compression of fiber yarns are considered according to different stages of shear deformation.
The remaining sections of the paper are organized as follows. The second section introduces the tensile model and shear model. The third section determines the parameters of the model through uniaxial tensile experiments and bias-extension experiments. The fourth section verifies the accuracy of the model through bias-extension experiments, picture frame experiments, and picture frame experiments with fiber misalignments. The fifth section verifies the general applicability of the model through uniaxial tensile tests and bias-extension tests of jute woven fabrics. Finally, the sixth section provides the conclusion of this paper.
Model development
Tensile deformation model of crimped beams
In this study, a periodic weave pattern is used to represent a plain weave fabric. The weave pattern consists of interweaving warp and weft yarns at alternate positions. The material parameters of woven fabrics are yarn width w, yarn spacing b, and fabric thickness h. The geometric parameters represented by w, b, and h are 3.72, 5.14 and 0.39 mm, respectively. 15
The two warp and two weft yarns are modeled as undulated Timoshenko beams. The beam model satisfies the following assumptions. (1) The original section perpendicular to the midplane of the beam remains flat after deformation. (2) The shear rotation between the normal direction of the neutral layer of the beam and the cross-section plane is small. (3) The neutral axis and the centroidal axis are rejoined. (4) Due to the tangential orientation of the resultant force on the fiber bundle resulting from the horizontal and vertical forces, the magnitude of the external horizontal force on the fiber bundle is greatly affected by the vertical force when the tangential angle is small, as shown in Figure 2(b). As a result, friction between the fiber bundles can be safely neglected, where
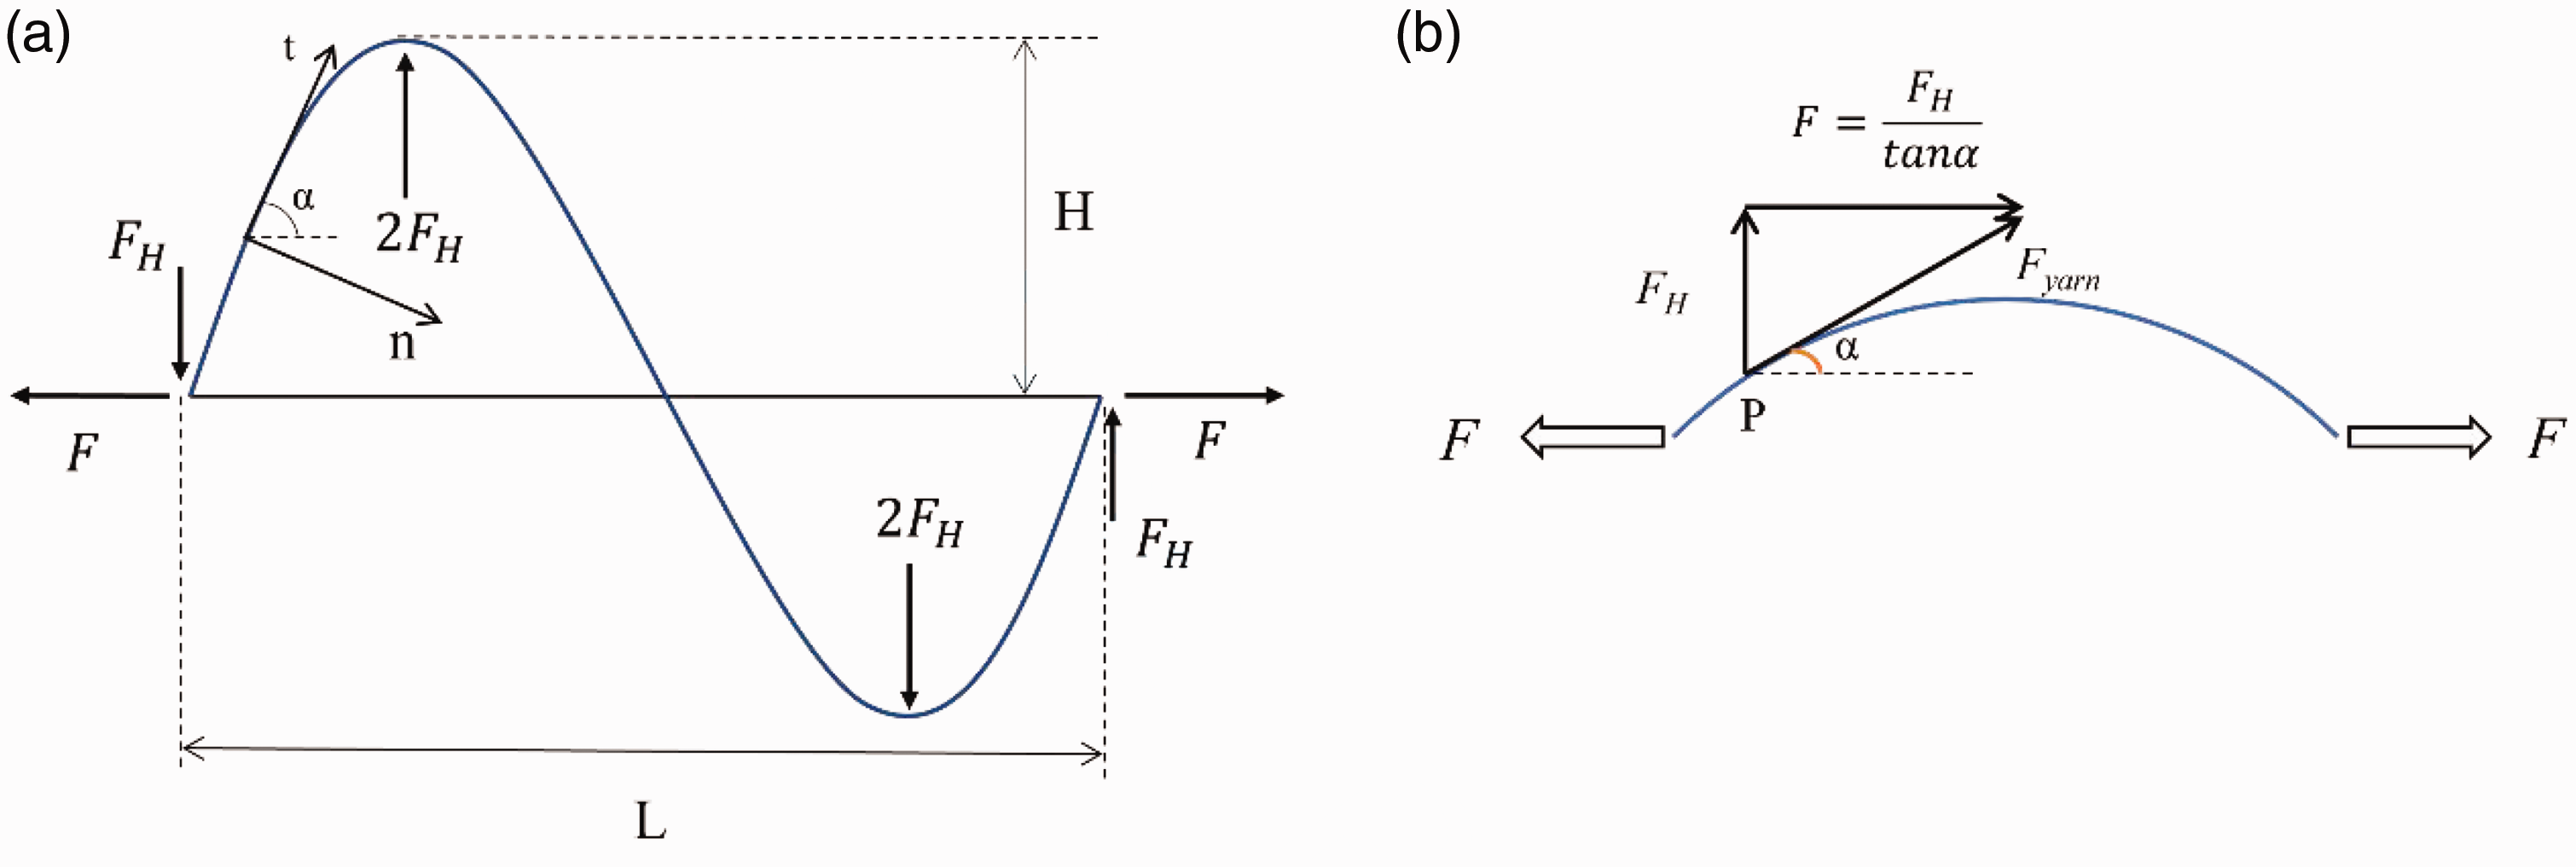
The force analysis diagram of a fiber bundle: (a) fiber bundle with one full cycle length and (b) fiber bundle with half cycle length.
The centerline of the beam can be described by the shape function
During tensile deformation, the infinitesimal strain of the beam is defined as
According to the constitutive relationships in Equation (2), the principle of virtual work can be expressed as follows:

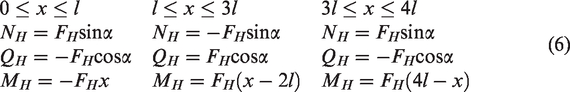
The normal force N, shear force Q, and bending moment M can be divided into the following forms according to the different applied forces:

The subscripts F and H represent the forces caused by F and FH, respectively.
As shown in Figure 3(a), the reaction forces on any cross-section of the beam can be expressed as follows:

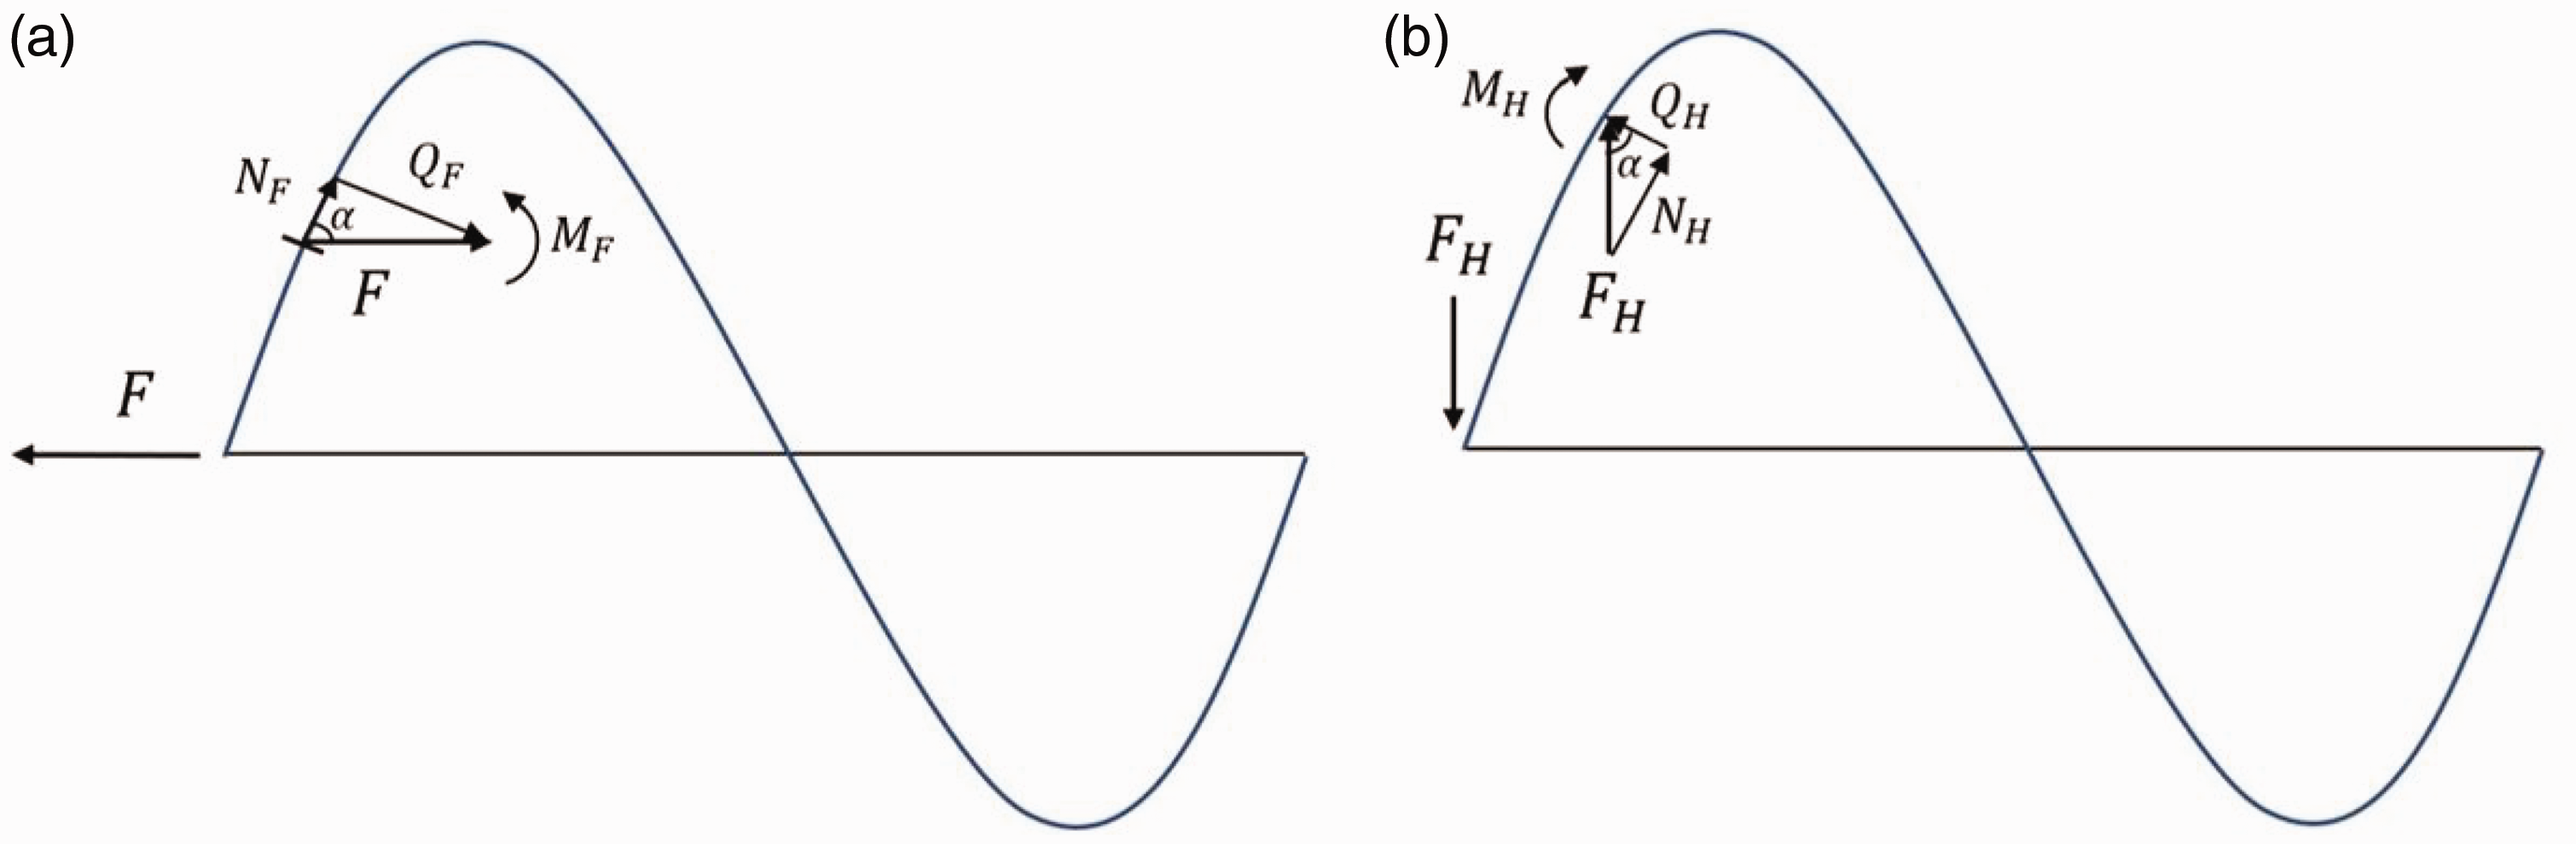
The schematic diagram of the reaction force decomposition of the beam cross-section when (a) F and (b) FH are applied to the beam, respectively.
Here, FH can perform the same decomposition at different intervals of the curve (Figure 3(b)):
Substituting Equations (5) and (6) and
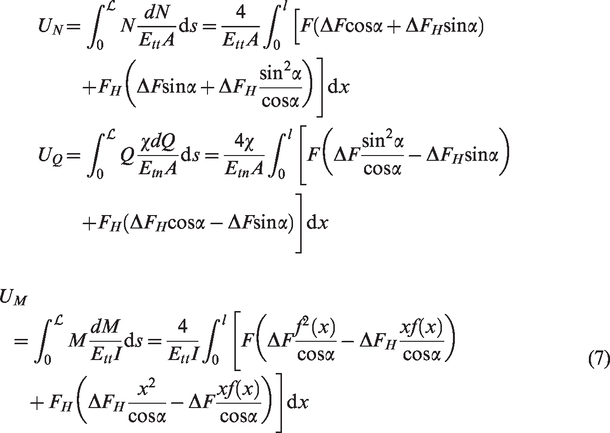
The virtual work of the external force is expressed as follows:

Hence, we have the following:

Thereby, introducing the geometric factors GF, GH, GM:
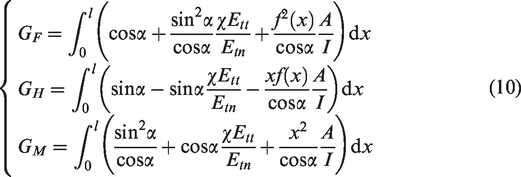
Substituting Equations (7) and (10) into Equation (9) simplifies to the following result:

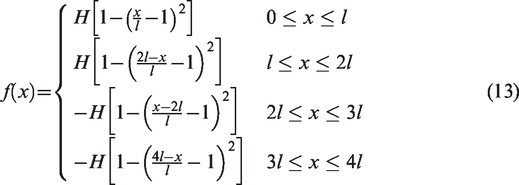
The shape function of the centerline of the fiber yarn can be described as a quadratic function to simplify the integration process:
Shear deformation model of woven fabrics
The deformation of woven fabrics during forming is primarily attributed to in-plane shearing. In order to characterize the in-plane shear behavior of woven fabrics and their prepregs, the picture frame test and the bias-extension test are the two commonly employed methods. 16 Initially, the shear load predominantly arises from the friction between the warp and weft yarns. Subsequently, as the shear angle between the warp and weft yarns increases, lateral contact is established among the yarns. Adjacent weft and warp yarns compact the yarns laterally, and this in-plane compaction becomes increasingly significant with the increment of the shear angle. Ultimately, it leads to the occurrence of out-of-plane wrinkling.
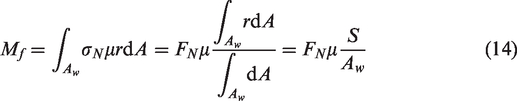
Firstly, the relationship between shear load and infinitesimal shear strain due to friction between the warp and weft will be constructed. In the in-plane shear state of woven fabrics, the calculation of friction torques between fiber yarns in contact assumes a planar contact surface between the yarns. In addition, it is assumed that there is only relative rotation between the warp and weft yarns without any slippage. Considering the structure shown in Figure 4, the friction torque
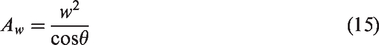
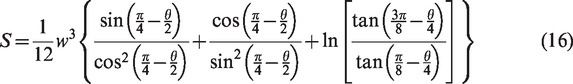
Geometry of the contacting area.
The instantaneous work done by the friction torque

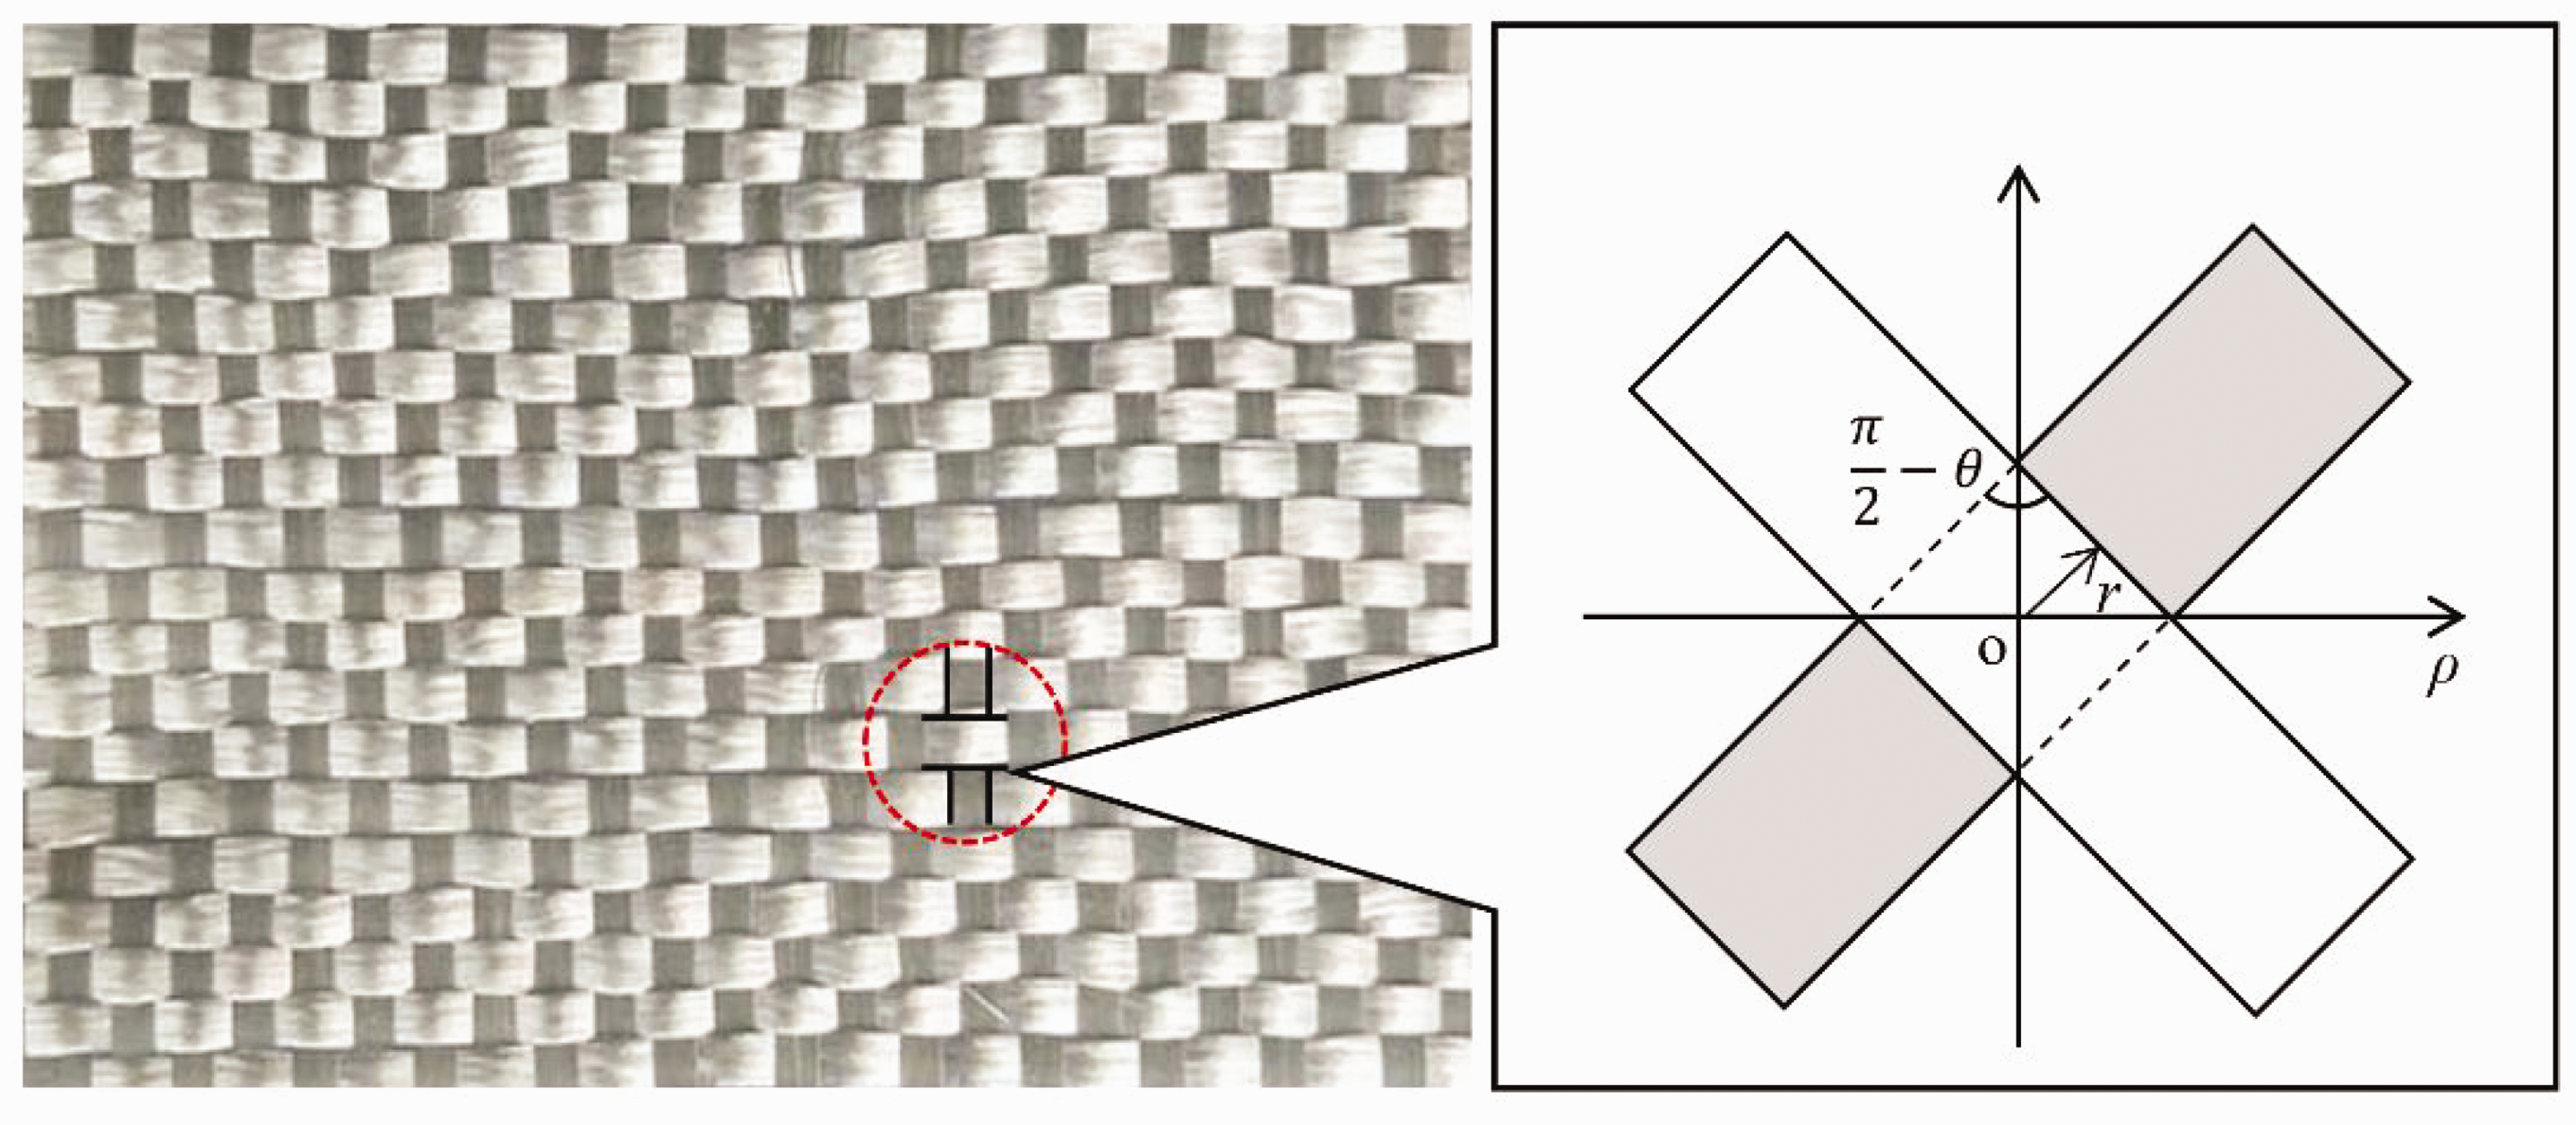
Then, with the two fiber yarns rotating relative, the warp and weft yarns produce lateral compression deformation, as shown in Figure 5. Meanwhile, the shear load is mainly converted into the friction work and compression deformation work between fiber yarns. In the compression stage, since the compression deformation occurs between warp and weft yarns, the lateral compression strain of the compression unit from the critical shear angle
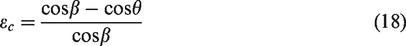
Schematic diagram of inter-yarn compression of warp and weft yarns.
Hence, for the infinitesimal shear strain
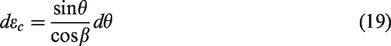
Therefore, the expression of compression stress between fiber yarns can be obtained:
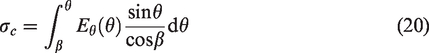
To simplify the model, the cross-section of the fiber yarn is assumed to be elliptic. When subjected to compression, the major axis direction of the fiber yarn is more prone to deformation compared to the minor axis direction. This is because the axial strain is observed to be twice as high on the sides of the yarn compared to the center. The deformation primarily occurs due to the rearrangement of fibers within the yarn.
17
Due to the small modulus

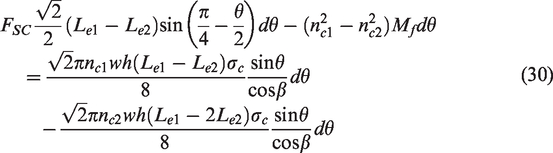
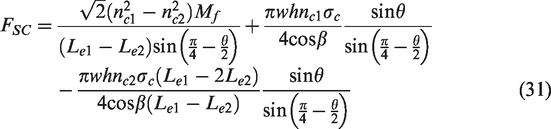
According to Equations (14)–(21), we can use the virtual work principle to deduce the shear load in different stages of square woven fabrics composed of n ×n fiber yarns, as shown in Figure 6.
Schematic diagram of the picture frame test.
For

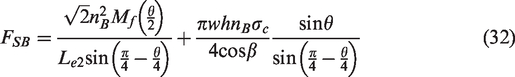
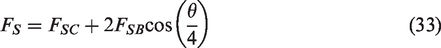
For

Determination of parameters
The developed meso-scale model in the second section will be exemplified on a plain weave glass fabric in this section. Model parameters will be determined by matching uniaxial tensile and bias-extension testing results from the literature.
Parameters of the tensile deformation model
Peng and Cao18,19 carried out uniaxial tensile tests on a plain weave glass fabric and single yarns. The material parameters for the selected material are presented in Table 1. Four fabrics containing eight yarns in the width direction were prepared for the tensile tests. The uniaxial tensile tests on the plain weave fabric were conducted using a Sintech-20/G tensile testing machine at room temperature, with a pulling speed of 0.25 mm/min. When the weft yarns are under tension and the warp yarns are free, the weft yarn becomes straight and the undulation of the warp yarn increases.
Material properties of E-glass/polypropylene composite 15
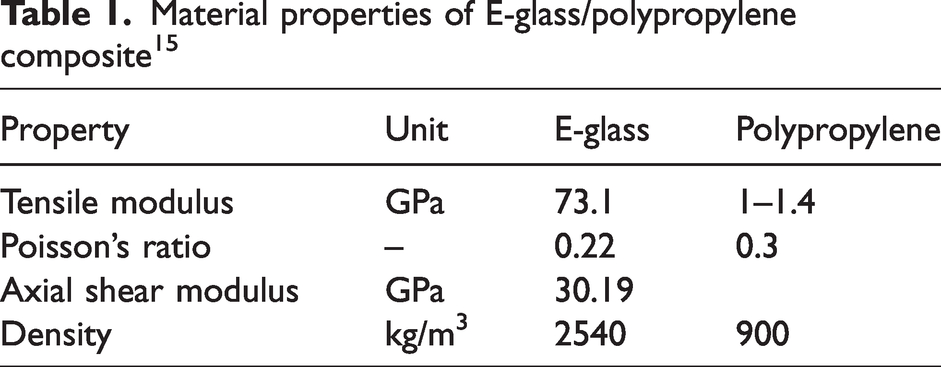
The yarn cross-section is assumed to be oval and the lengths of the major axis w and the minor axis h are 3.72 and 0.39 mm, respectively. The cross-section area of the fiber yarn is 
The Young's modulus of the glass fiber yarn is 32.2 GPa. Considering the relative sliding and straightening process of the fiber yarns in woven fabrics at the beginning of stretching, the modulus of the fiber yarns in woven fabrics is corrected as follows:

The crushing law describing the transverse crushing of the yarns is assumed to have the following form
24
:


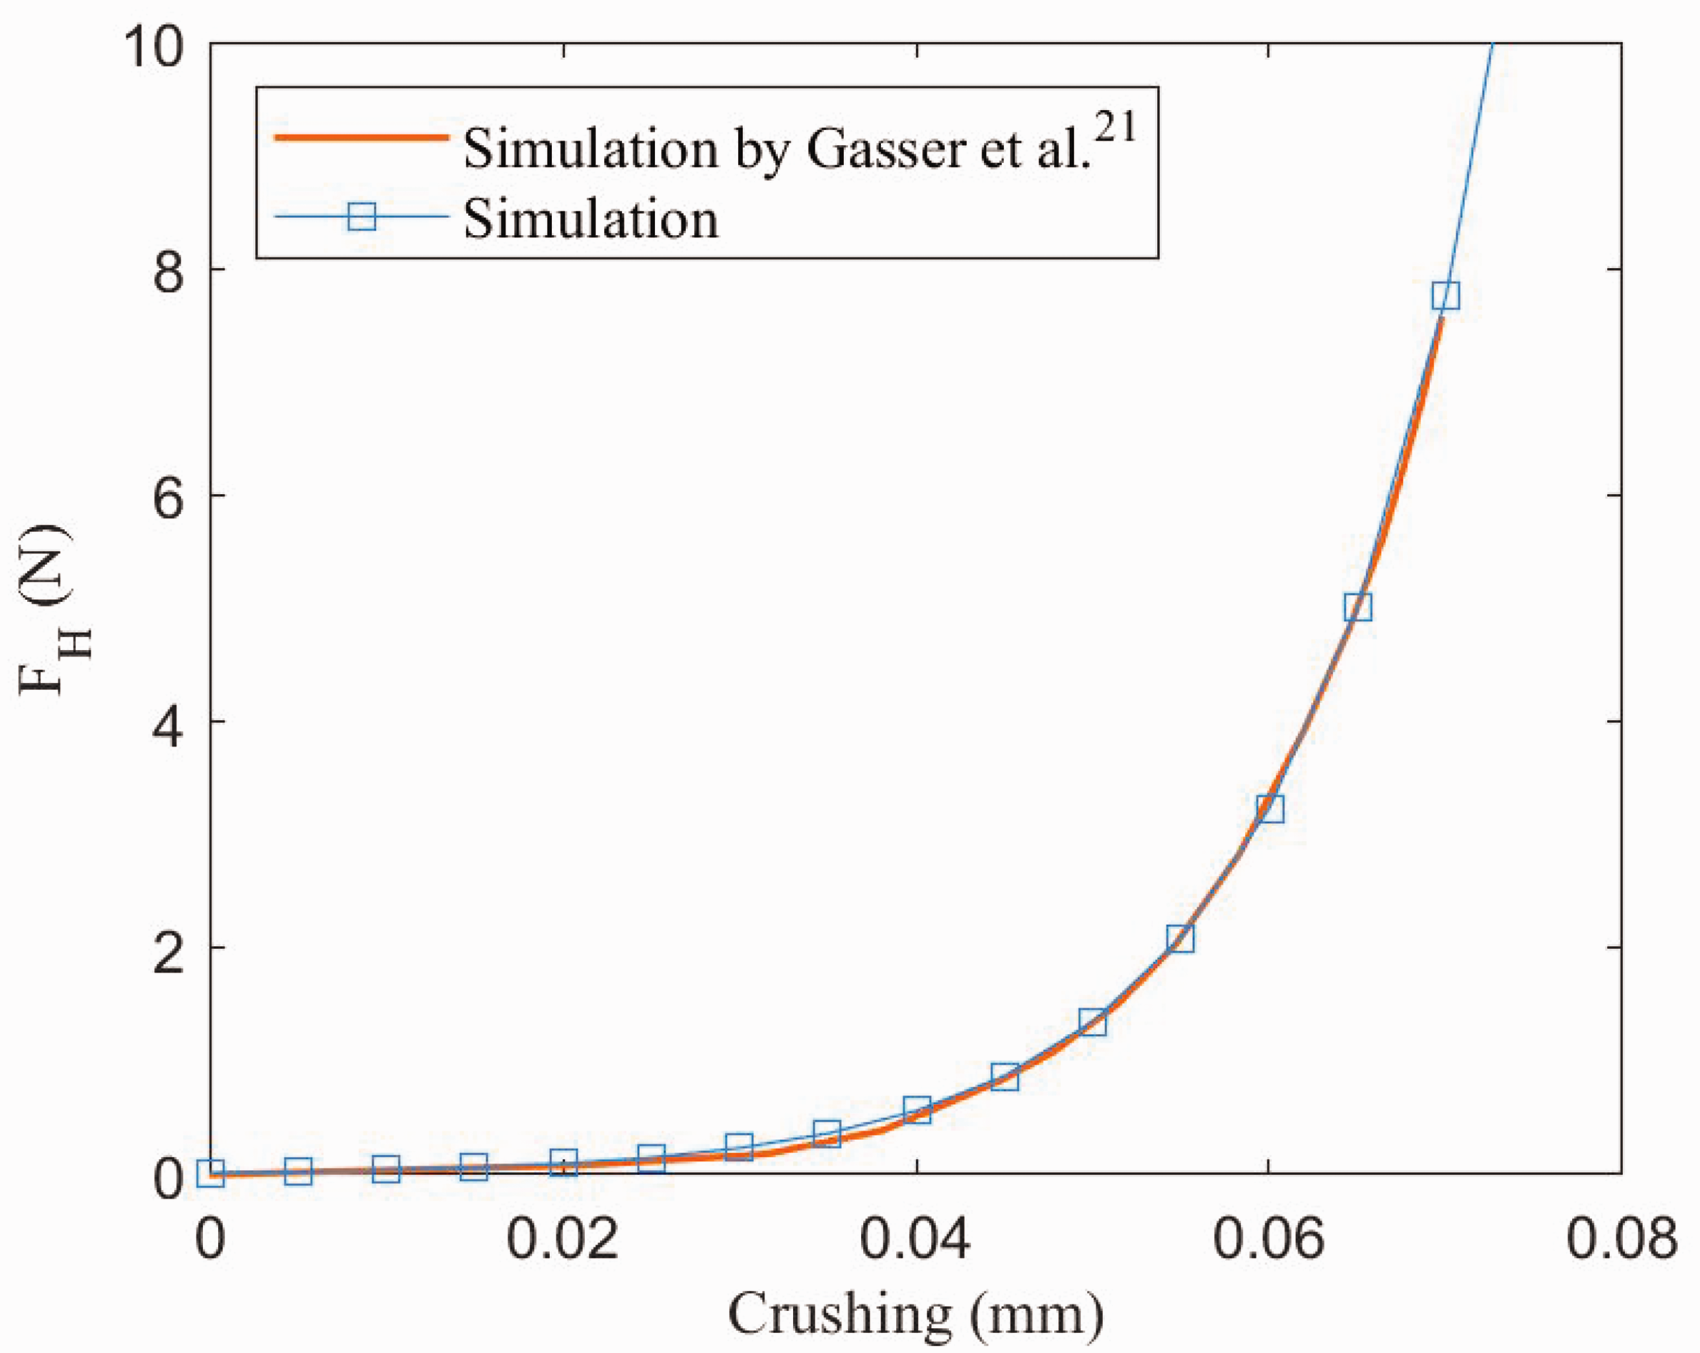
Yarn crushing versus contact force FH.
The unidirectional tensile deformation of woven fabrics is mainly divided into the following four stages: in the first stage, the fiber yarns are straightened gradually from the crimped state. In the second stage, the fiber yarn and fiber are straightened and the fiber begins to undergo elastic deformation. The third stage is the elastic deformation stage of the fiber, and the fourth stage is the fracture of some fiber yarns in the woven fabric. When the yarn reaches the damage initiation, yarn breakage appears, resulting in a rapid drop in force. The residual stress of the yarn after initial failure is estimated to be 60% of its strength by fitting the damage propagation region of the tensile curve.
18
After the strain reaches 0.03, the breakage of the fiber yarn is set accordingly. Taking fabric #3 as an example, the numerical simulation results are shown in Figure 8, where strain
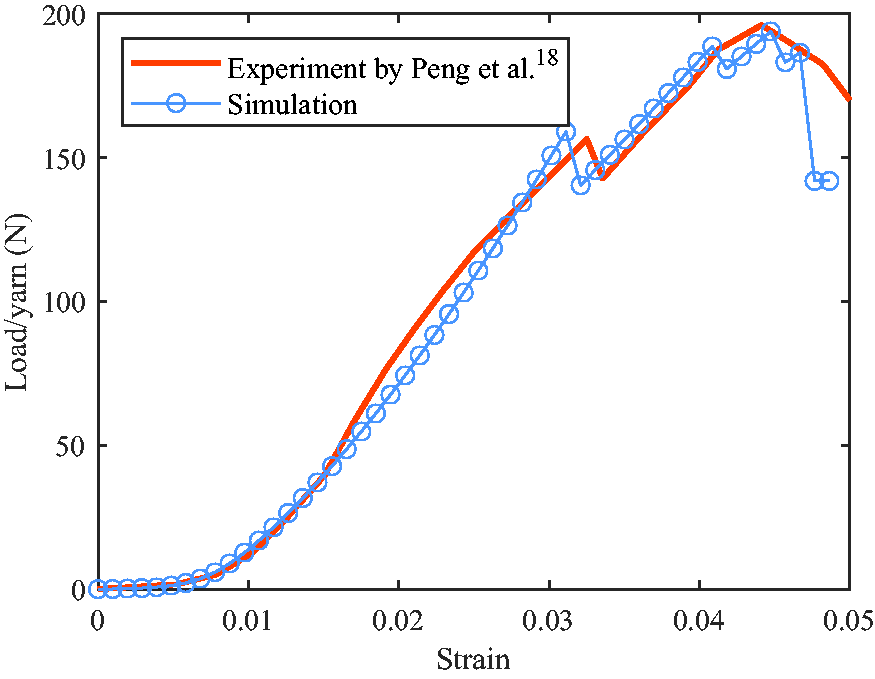
Comparison between experiments and predictions for tensile tests on balanced glass plain weave.
Parameters of the shear deformation model
The bias-extension experiment entails securing a rectangular piece of the woven fabric in a manner that aligns the warp and weft yarns at a 45° angle relative to the applied tension direction. To ensure the feasibility of the experiment, the initial length of the specimen should exceed twice the width of the specimen in the bias experiment. Assumptions are made that there is no tensile deformation of the fiber bundles, no slippage between the fiber bundles, and uniform shear deformation across all regions. Under the above assumptions, region C is a perfect pure shear zone in the center of the sample (shown in Figure 9). The shear angle of region C is assumed to be twice that of region B, while region A remains undeformed as one end of both the warp and weft yarns in this region is secured in the clamp. Conducting the bias-extension experiment provides an advantage as one end of the sample yarn is not fixed, resulting in little to no tension in the yarns due to the friction between them.
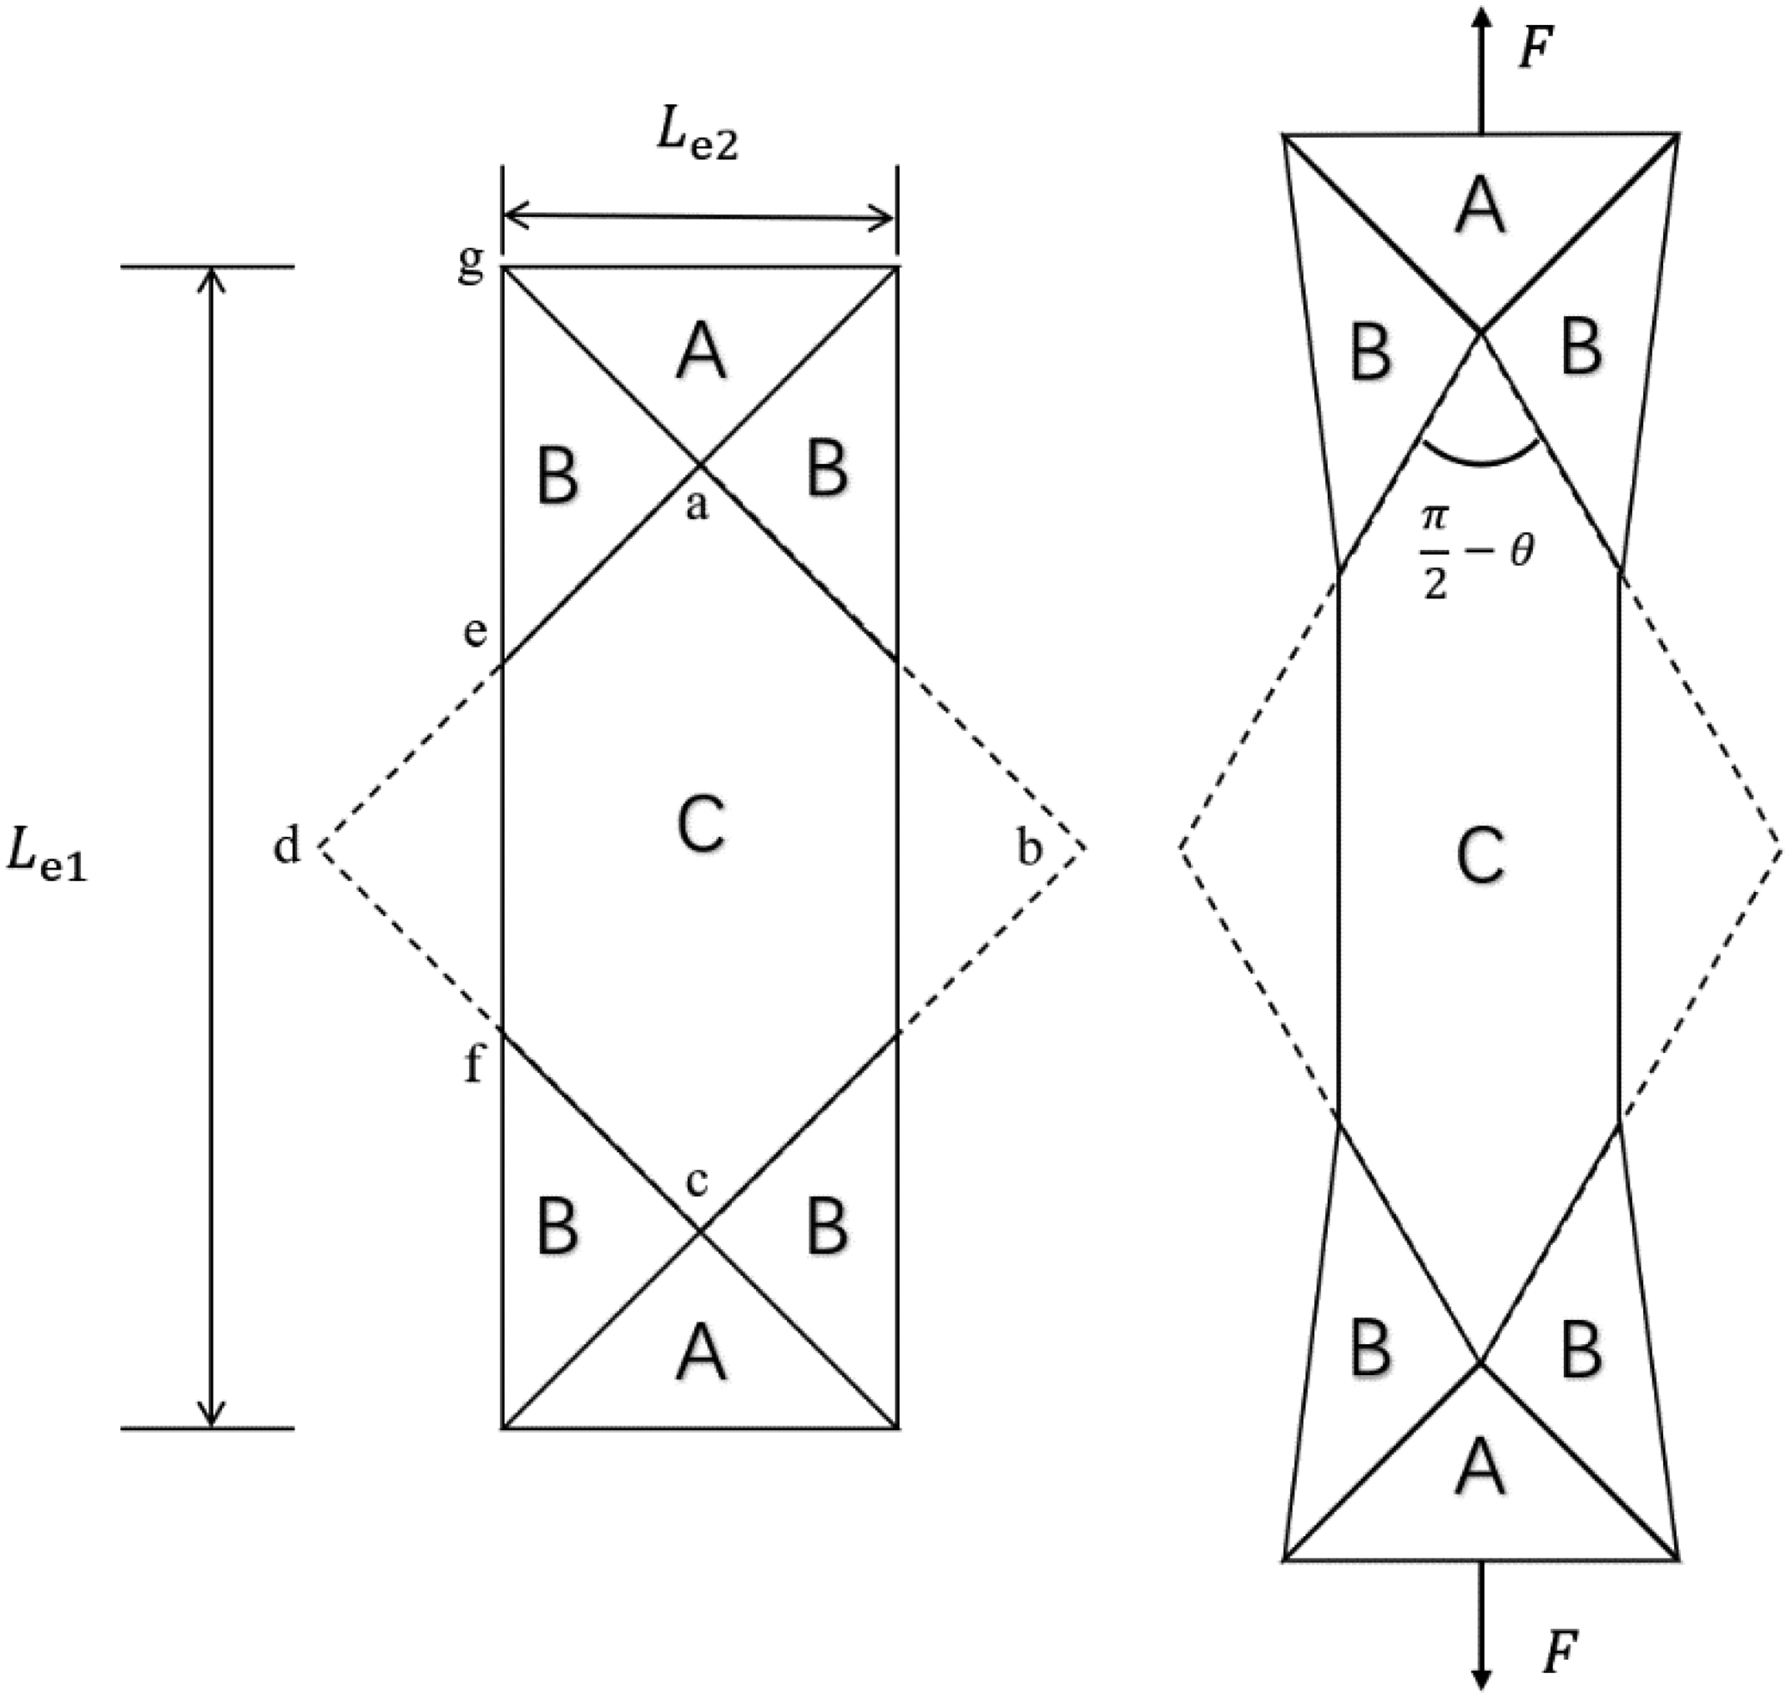
Illustration of a fabric specimen under a bias-extension experiment.
Based on the above assumptions, the relation between the in-plane shear angle and the tensile displacement of the sample is as follows:

For zone C, according to the principle of virtual work, we have the following:
Similarly, for region B, we have the following:
Peng and Cao 18 prepared two kinds of samples for the bias-extension test: 16-yarn and 24-yarn. The 16-yarn samples correspond to a sample size of 111.3 mm × 222.6 mm and the 24-yarn samples correspond to a sample size of 167 mm × 334 mm. The samples have the characteristic of aspect ratio of two. The bias-extension test of the plain weave composite fabrics was conducted using a Sintech-20/G tensile testing machine at room temperature, with a pulling speed of 1 mm/min. In this paper, we will utilize the data of 16-yarn samples from the previously mentioned literature to determine the parameters necessary for the shear model. Subsequently, in the fourth section, we will employ the data of 24-yarn samples to verify the accuracy of the model. The simulation in this research is completed by MATLAB software.
For the friction stage between fiber yarns, the formula of FN (Equation (14)) can be obtained by fitting the shear curve, where 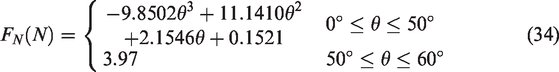
The expression for the compression force between the warp and weft is based on the following reasons.
The contact area between two fiber yarns changes, leading to variations in the friction coefficient. In this experiment, the friction coefficient For the glass fiber woven fabrics selected in the experiment, serious wrinkling will occur when the shear angle between fiber yarns reaches about 60°.
25
The compressive force between the fiber yarns primarily arises from the mutual extrusion of the fiber bundles due to an increase in the contact area between the yarns. However, as the shear angle increases to a certain value, the growth of the contact area between the fiber yarns slows down, ultimately leading to a slower growth rate of the compressive force.26,27
For the transverse compression stage of fiber yarns,
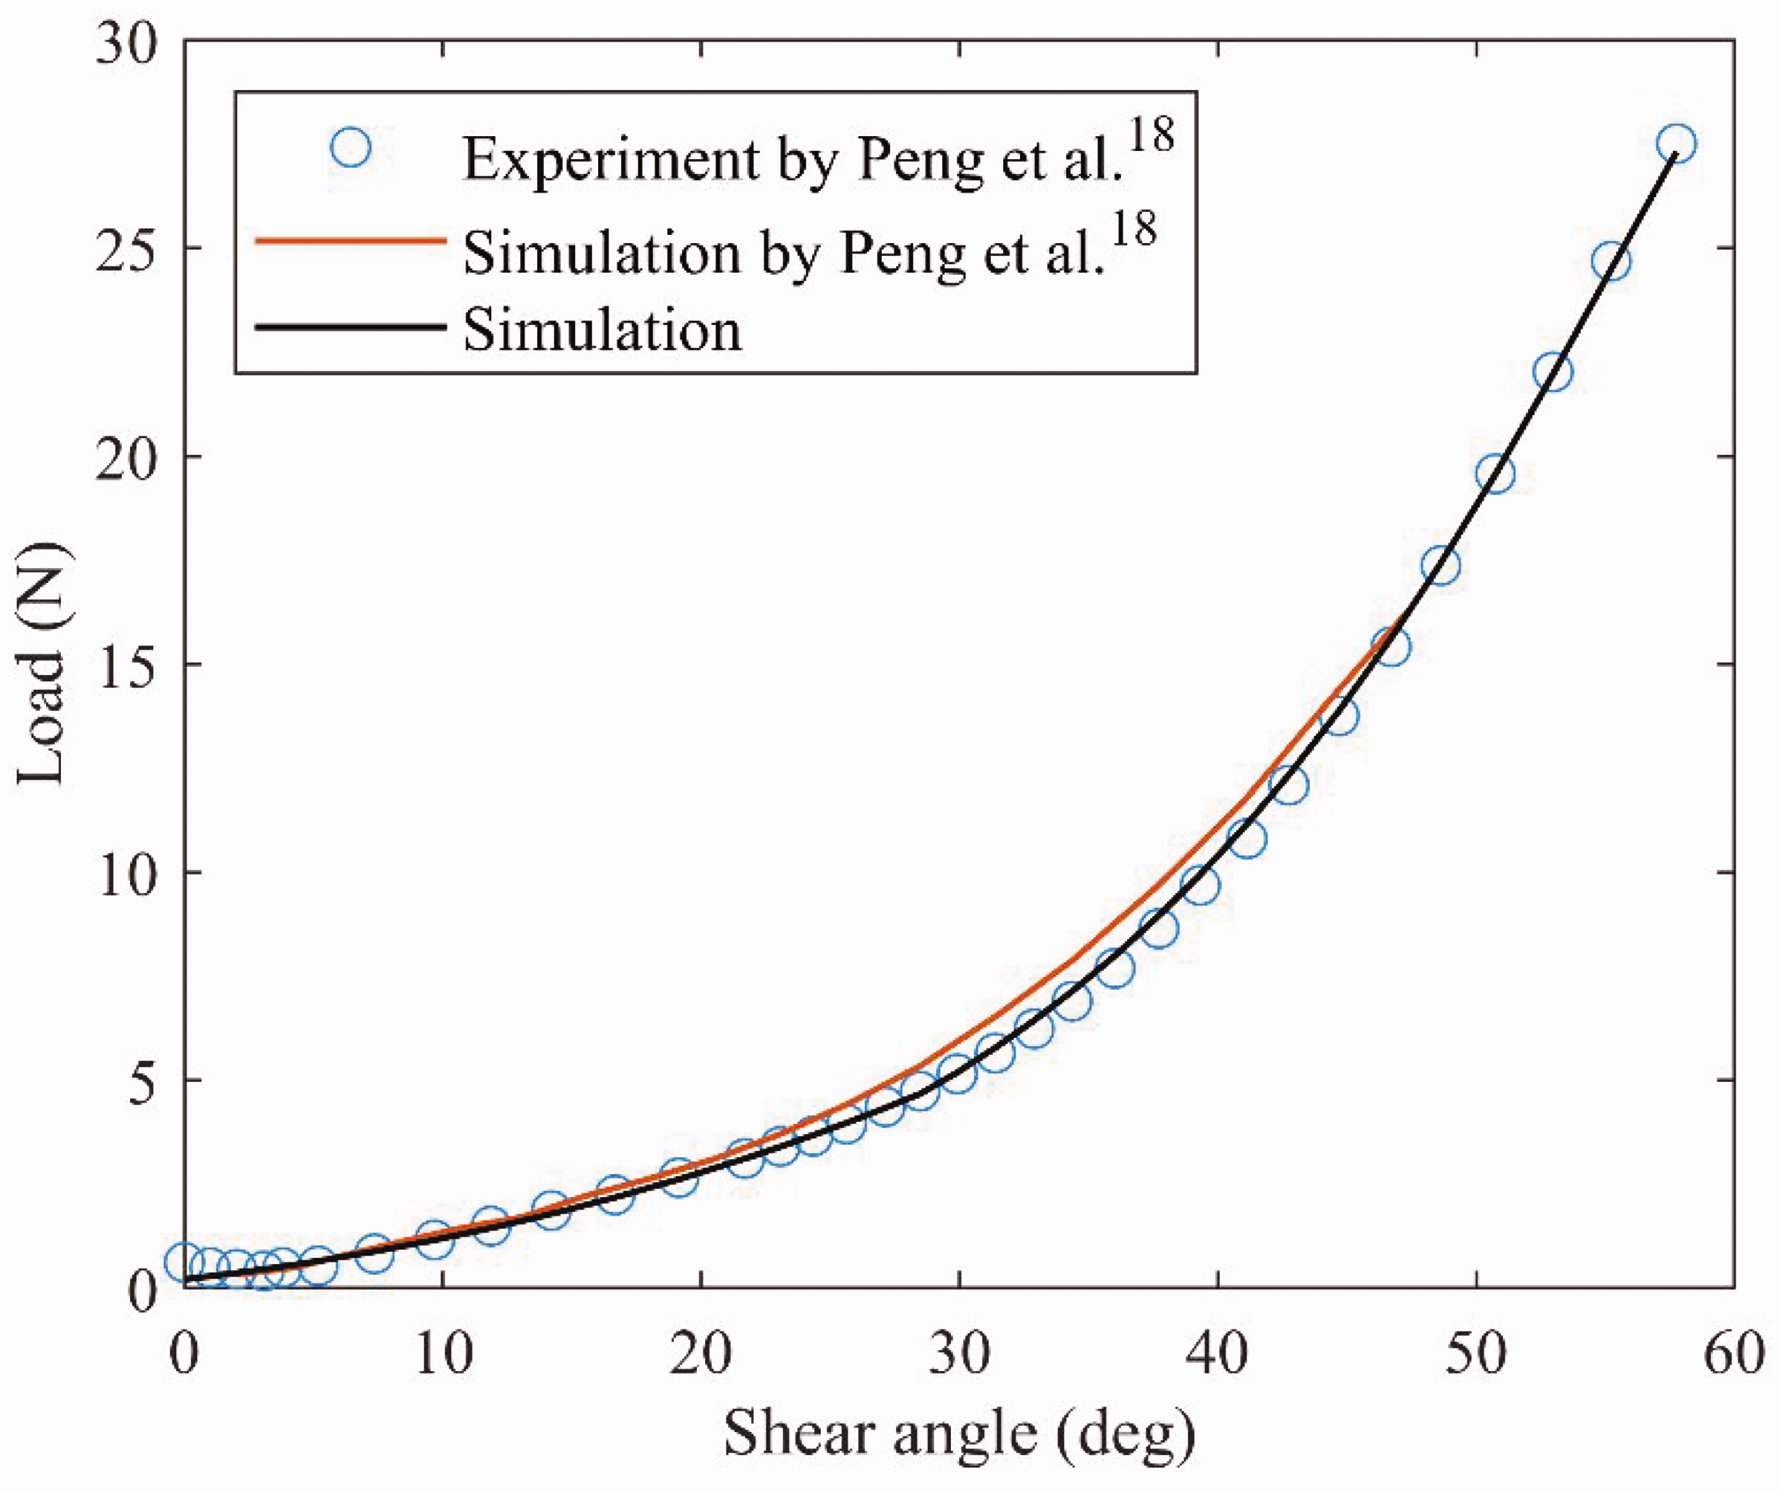
Load–shear angle curves for 16-yarn bias-extension.
Model validation and discussion
Bias-extension experiment
The first validation is performed using the bias-extension test of the 24-yarn samples. The numerical load–shear angle curve is shown in Figure 11 by a solid line. As can be seen from Figure 11, the numerical bias-extension load and experimental results of the 24-yarn fabric show excellent agreement. Figures 10 and 11 depict the simulation results of the model proposed in this paper and the model proposed by Peng and Cao, 18 respectively. Based on the comparison between the two models, it can be concluded that both models are capable of predicting experimental results accurately. However, the mesoscopic model built using energy decomposition demonstrates higher accuracy in scenarios involving significant deformation or even minor wrinkling. The model proposed in the paper takes into account energy dissipation during the shear deformation, making it applicable to a wider range of scenarios. This feature enhances the versatility and effectiveness of the model in capturing complex deformation behaviors.
Load–shear angle curves for 24-yarn bias-extension.
Picture frame experiment
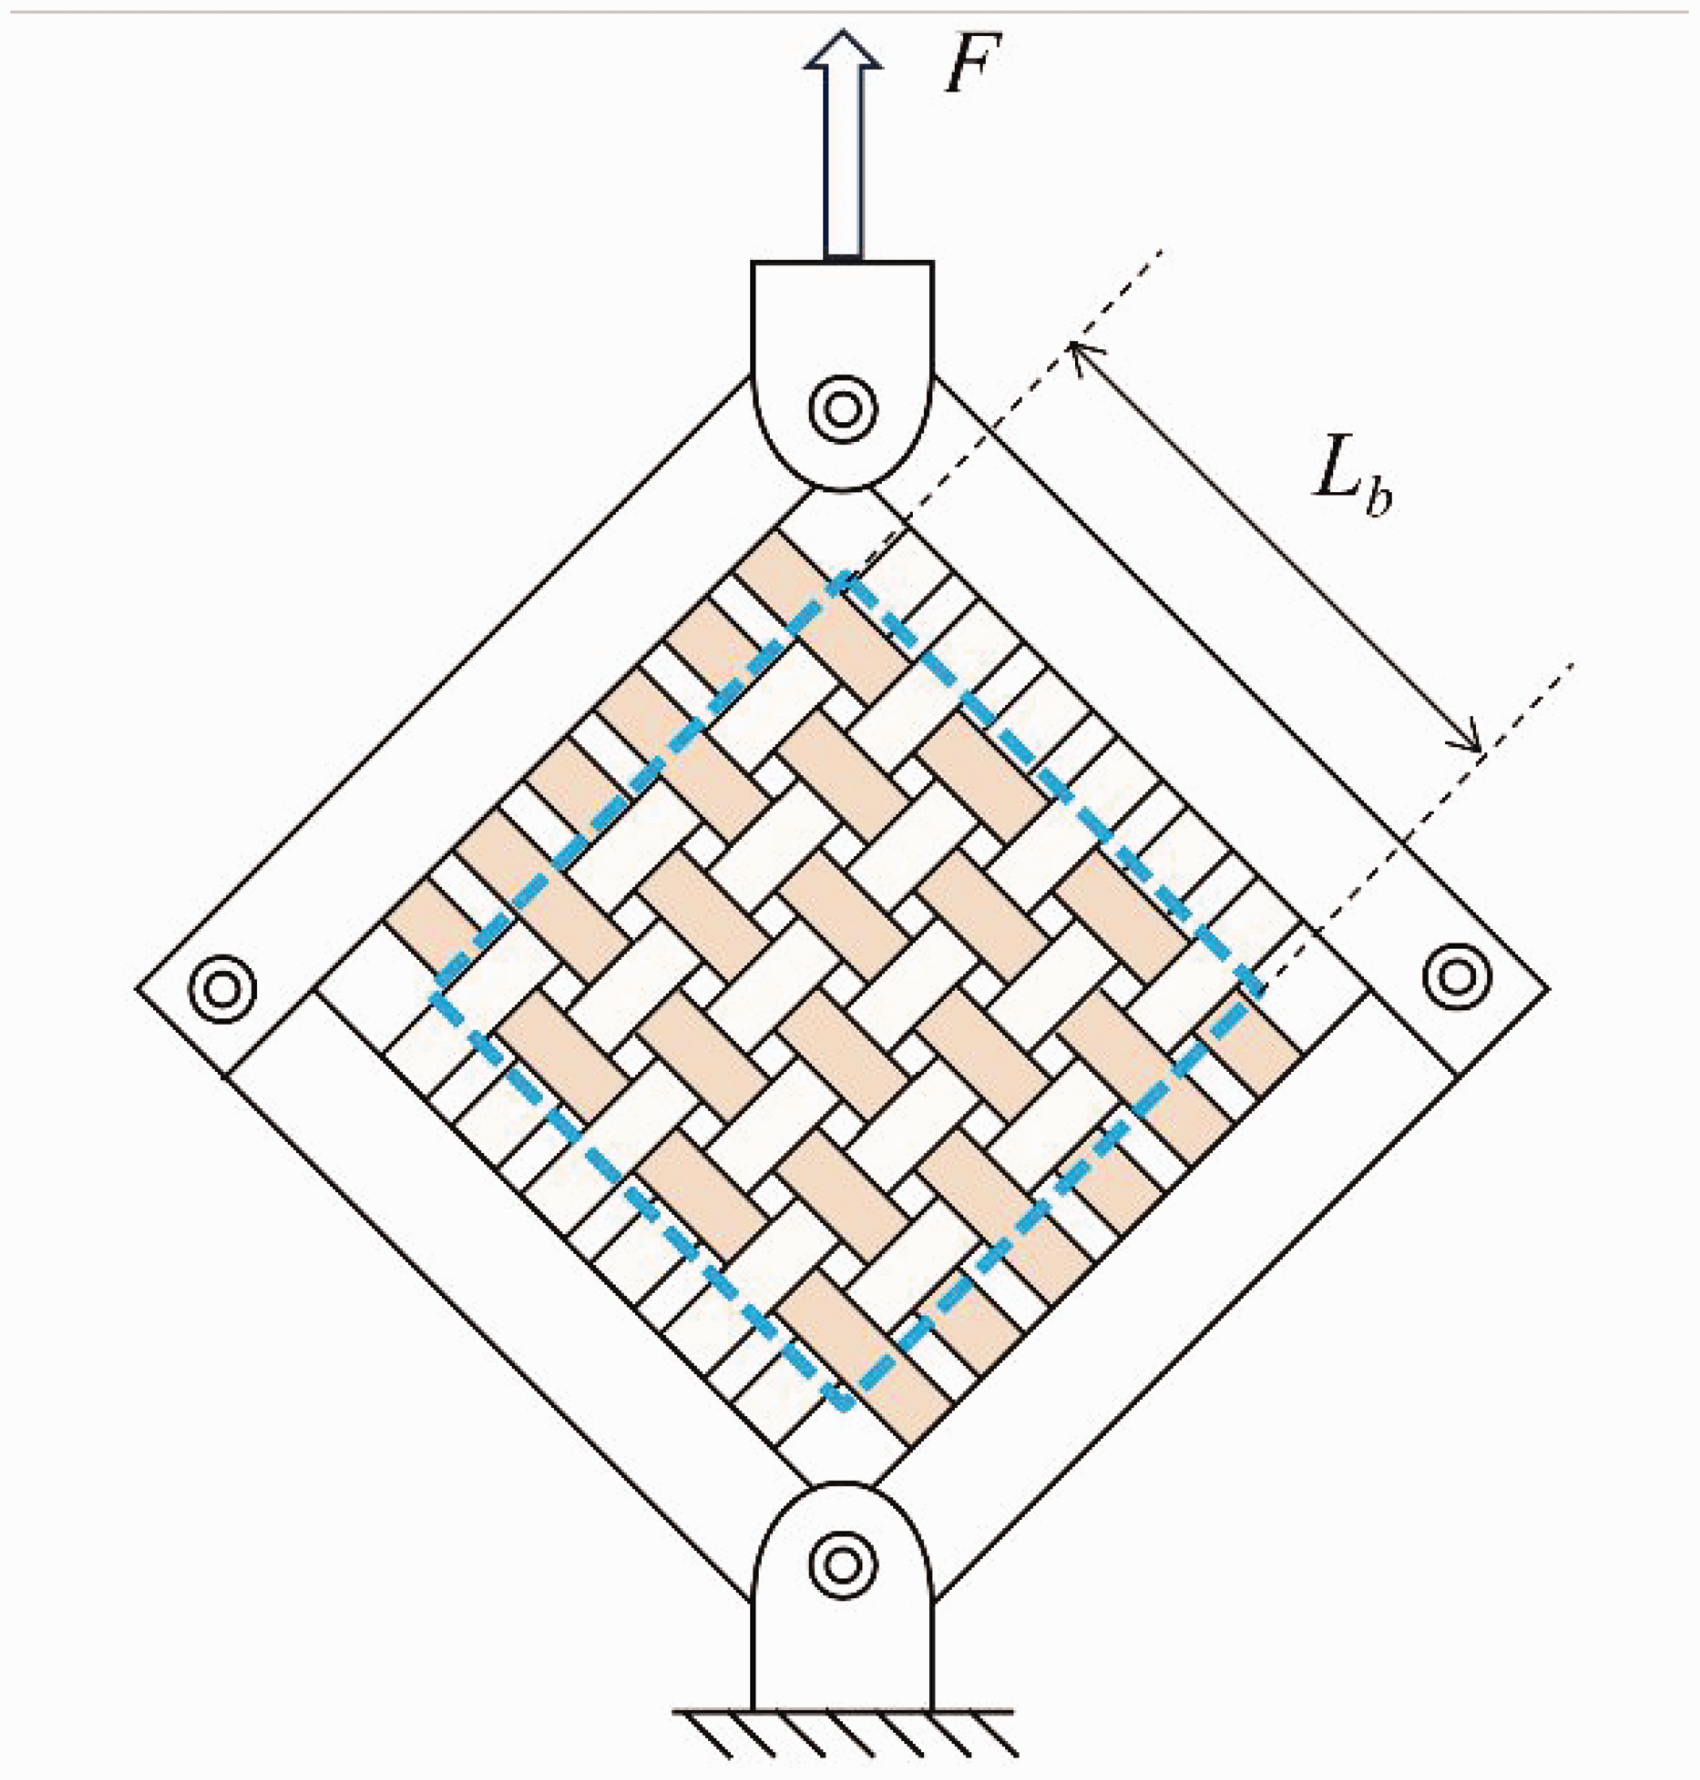
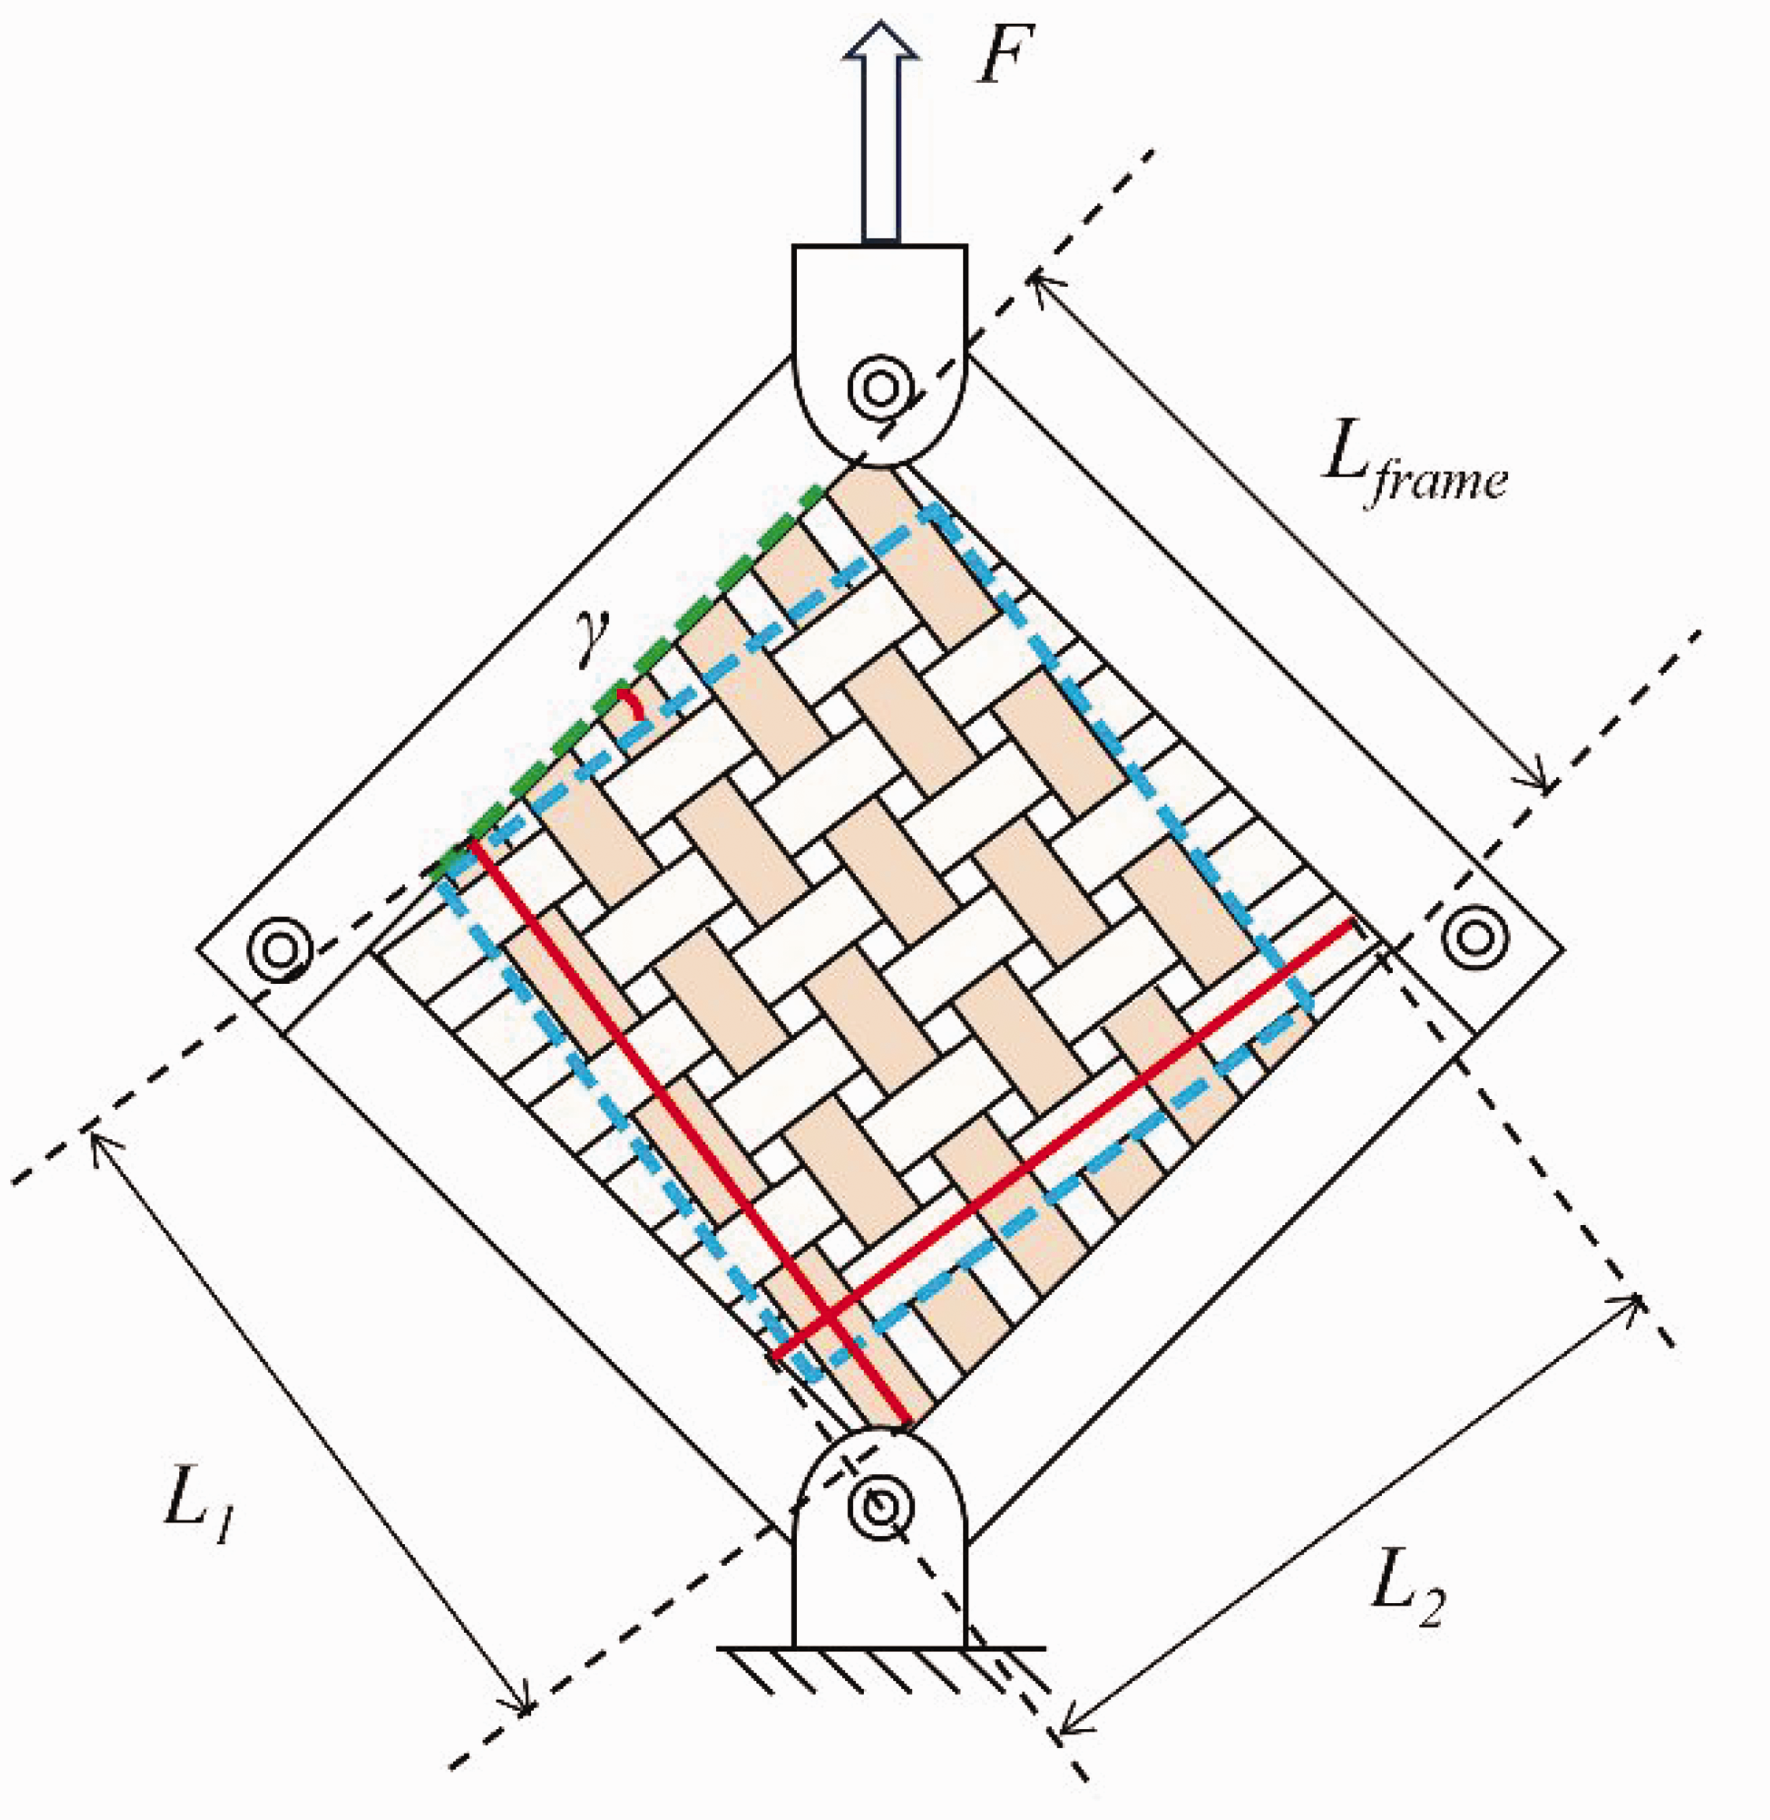
A picture frame device consisting of four equal-length rigid rods hinged at their ends is used in the experiment, in which tension is applied diagonally to induce pure and constant in-plane shear strain. As a result, the initially square geometry of the picture frame deforms into a lozenge shape, and the sample within the frame is subjected to shear strain.
The relationship between the displacement of the load on the picture frame and the shear angle is as follows:
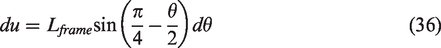
According to the principle of virtual work:
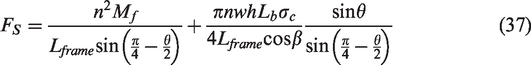
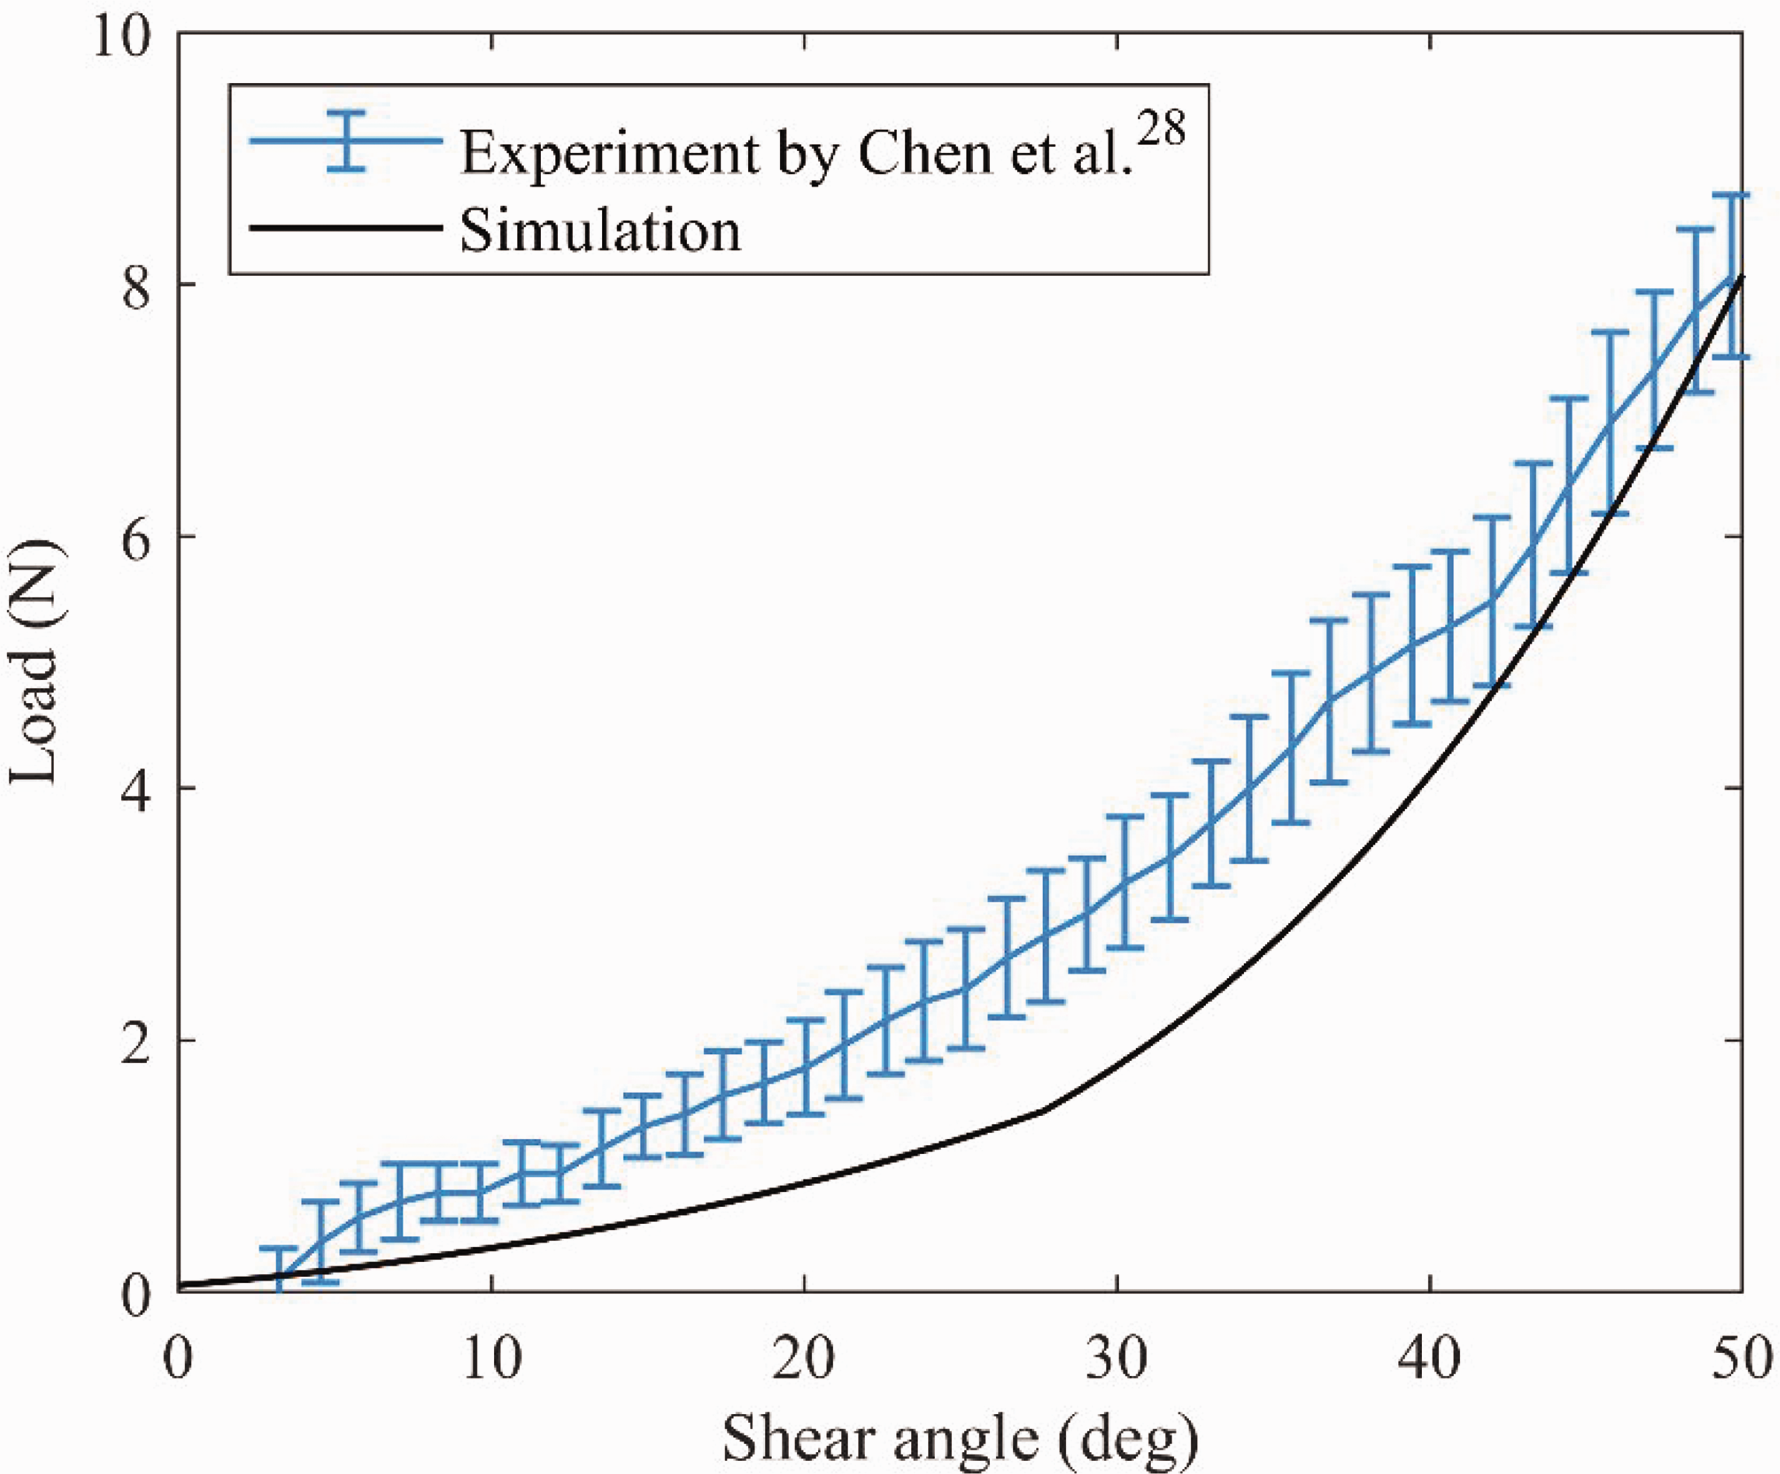
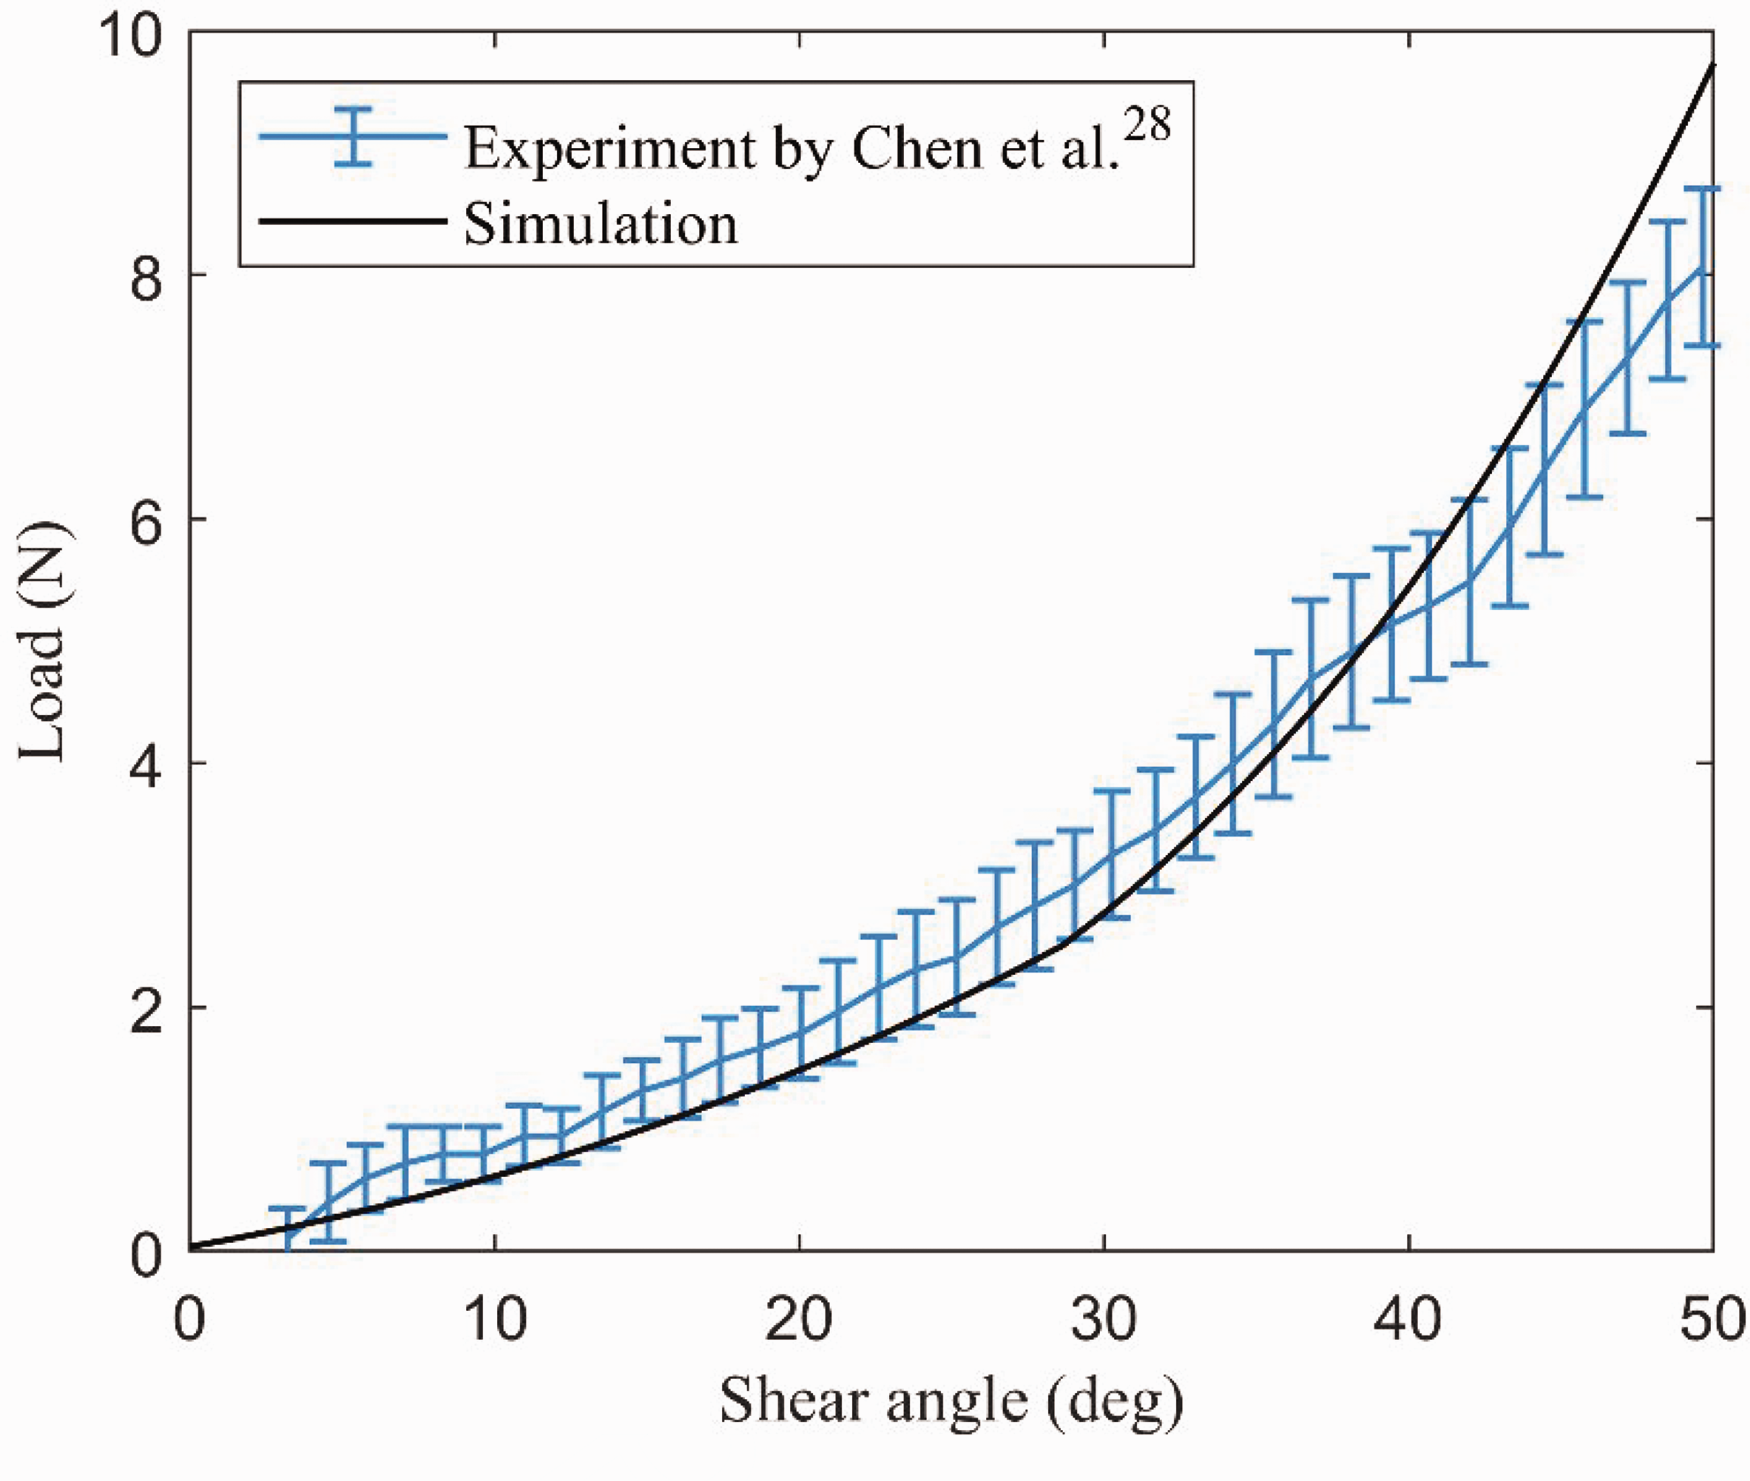
Chen et al. 28 present a detailed experimental set-up for the picture frame test of the plain weave composite fabrics. The picture frame has a size of 216 mm × 216 mm. Two samples with different effective sizes are used for picture frame tests: 15 in 2 (19-yarn) and 30 in 2 (27-yarn). The tests were performed at room temperature using a crosshead rate of 50 mm/min. Since the arm parts of the composite fabrics in the experiments do not have any yarn crossovers, it is reasonable to assume that the experimental loads are solely caused by the shear deformation of the fiber yarns in the central region. 18 The experimental and simulation results of the 15 in 2 samples and the 30 in 2 samples are shown in Figures 12 and Figure 13, respectively.

Numerical results compared with experimental data for the 15 in 2 test.
Numerical results compared with experimental data for the 30 in 2 test.
From the above results, it can be seen that for the 30 in 2 samples, the simulated results are in good agreement with the experimental data but the simulation results of the 15 in 2 samples are smaller. The reason for the discrepancy between the simulated and experimental results is due to misalignment of fiber bundles in the frame shear test, as mentioned in the previous literature. 29 Specifically, the warp and weft yarns of the woven fabric cannot be aligned parallel to the frame, resulting in a deviation from the intended orientation. During the picture shear test, the misalignment of fiber bundles causes the elongation of bundles in one direction and loosening or wrinkling of bundles in the other direction as the frame changes from a square to a diamond shape. This deformation requires not only overcoming rotational friction and mutual extrusion between the bundles but also the input of strain energy to stretch the fibers. As a result, the measured experimental data is higher than the theoretical value. So next we will use the 15 in 2 samples and another set of picture frame experimental data to demonstrate that the proposed meso-scale model can accurately simulate the picture frame experiment with fiber misalignments.
Picture frame experiment with fiber misalignment
When the fiber bundles in the woven fabric undergo deflection during a picture frame experiment, it results in a coupling force that combines tension and shear, because as the shear angle increases, either the warp or the weft is stretched and the other becomes slack. Now we try to simulate the experimental picture frame test results made by Peng et al. 15 These experiments are conducted in a picture frame with a size of 300 mm × 300 mm. We will consider the experiments of the 0.025 m2 (158 mm × 158 mm) sample and the 0.044 m2 (210 mm × 210 mm) sample with fiber misalignment. For the zero-degree fiber misalignment case, the fabric is placed in the picture frame so that there is no slack and the yarns are oriented at 45° to the direction of tension. A γ0-degree off-angle case is set up by a fiber misalignment, as shown in Figure 14.
Schematic of the picture frame experiment with initial fiber misalignment.
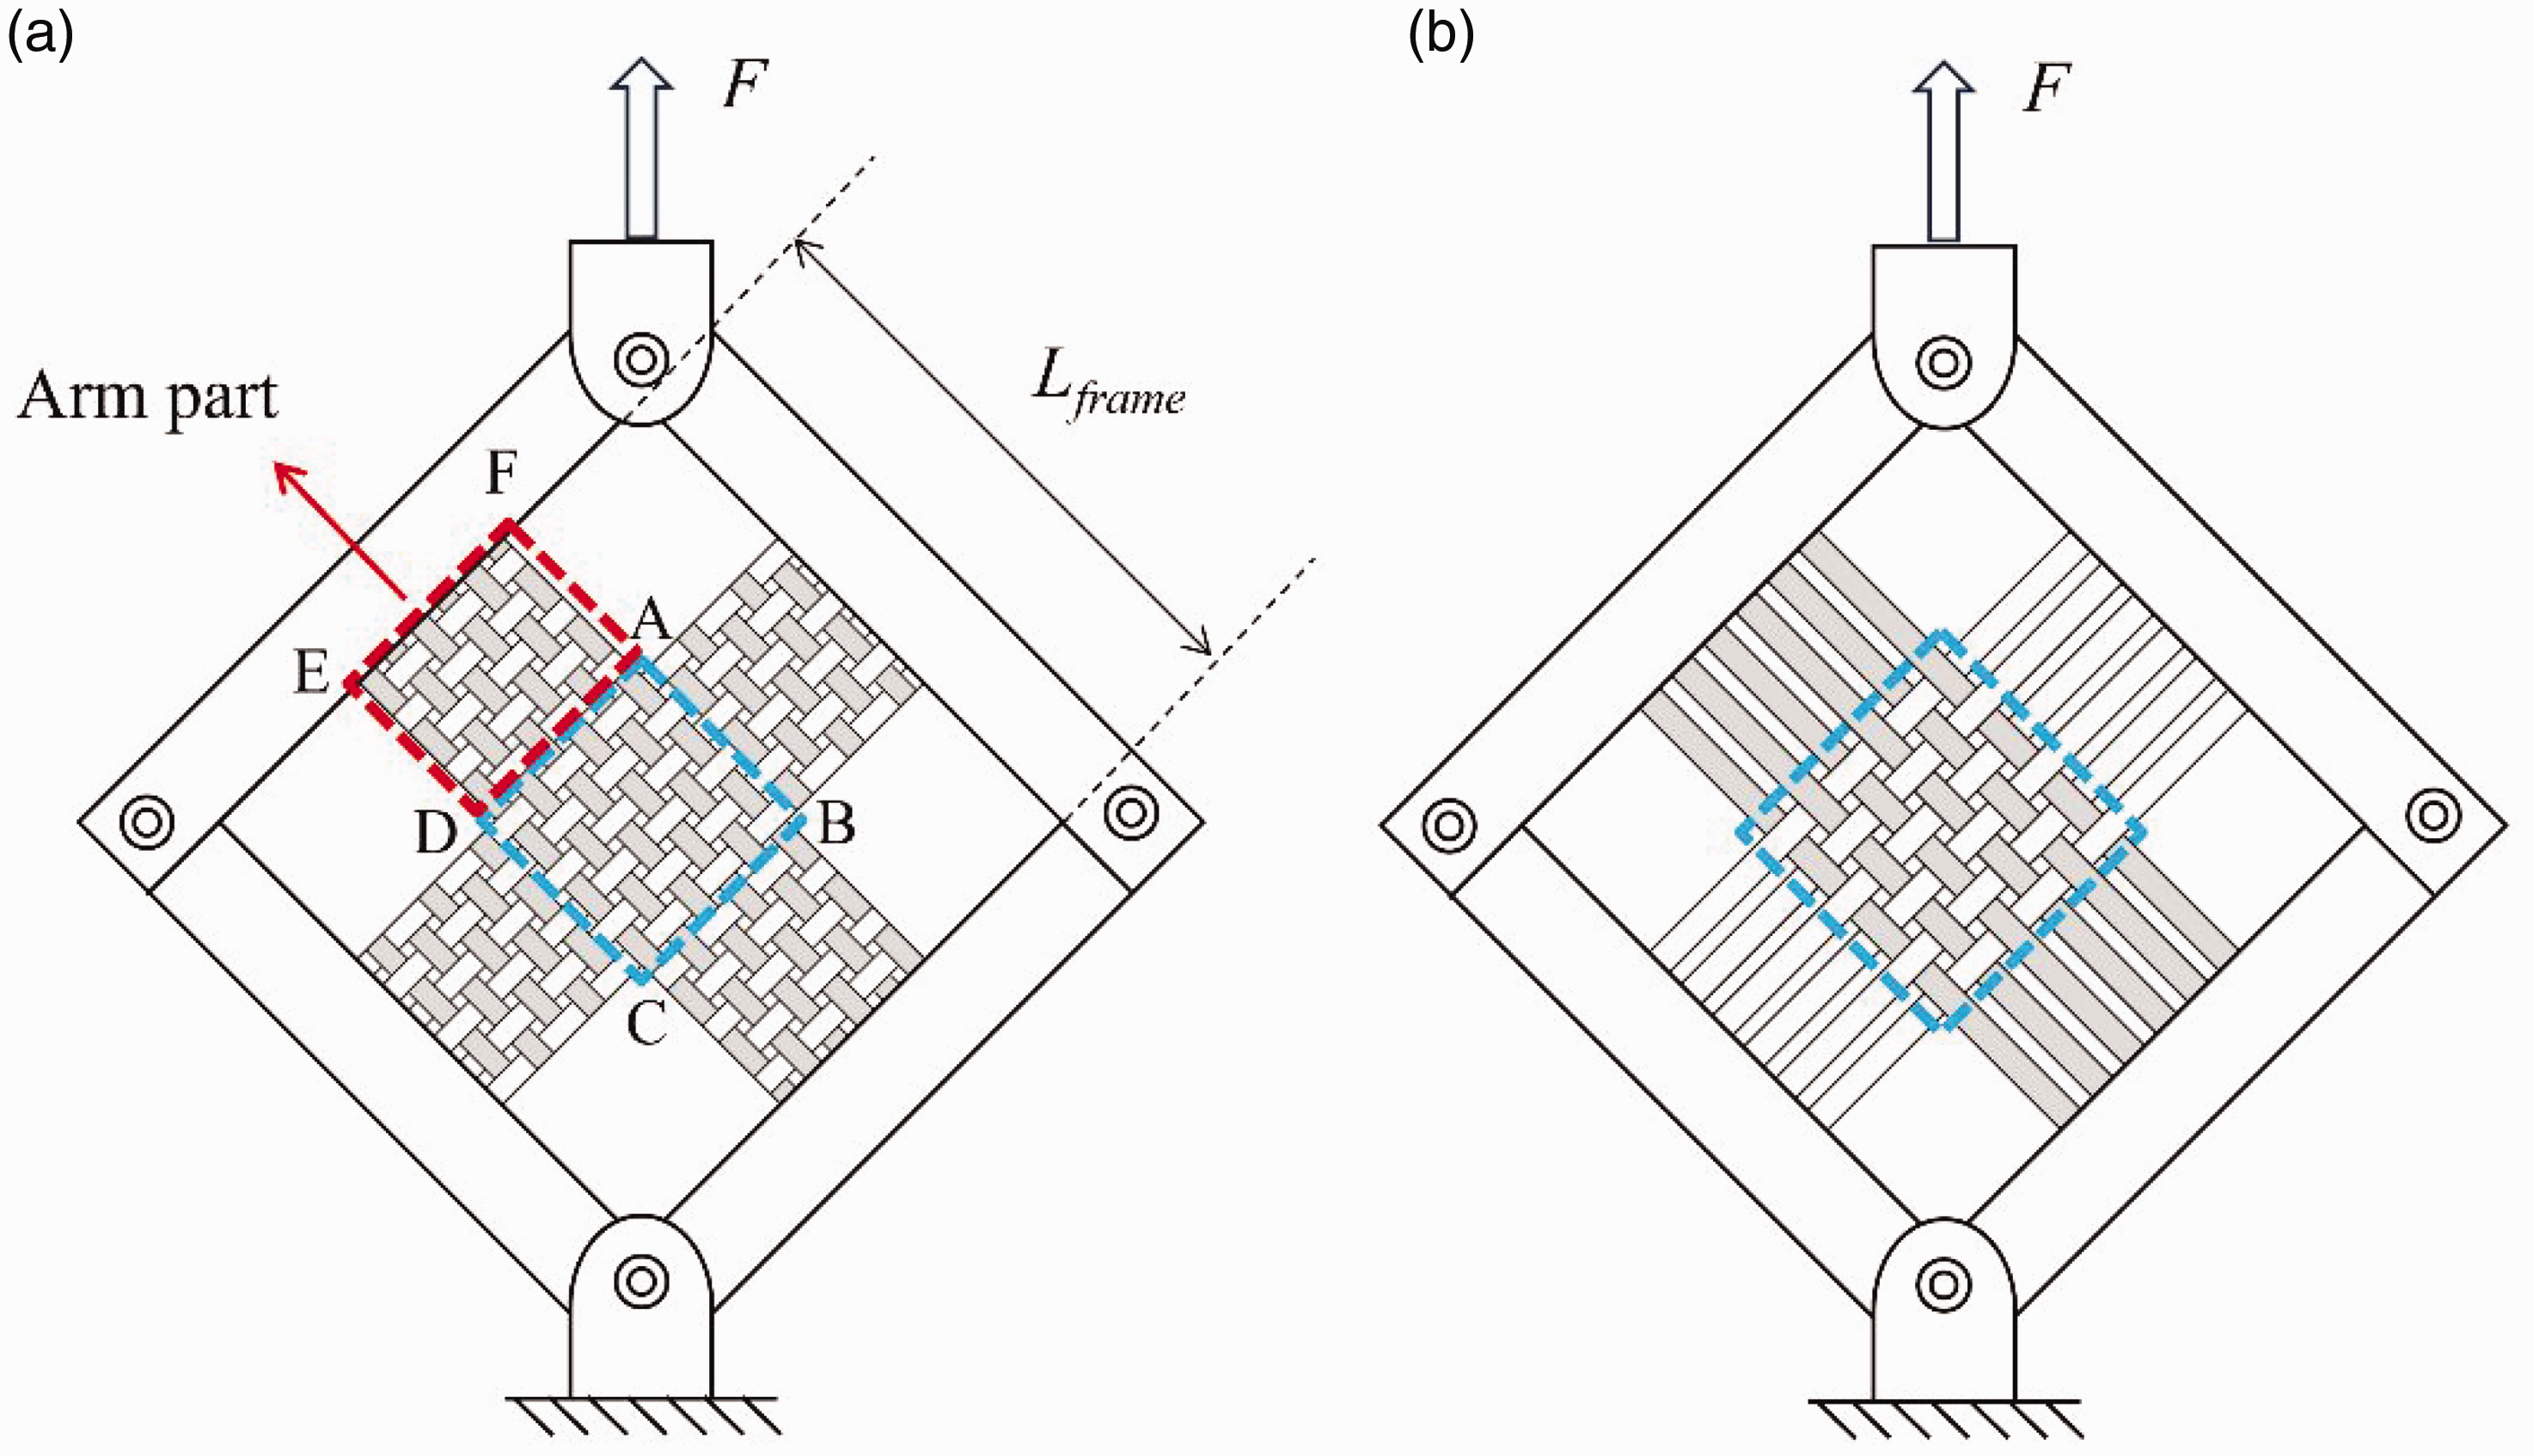
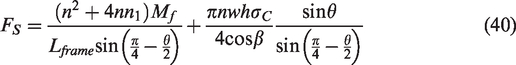
The increase in shear angle results in one of the warp or weft yarns bearing a tensile load, while the other gradually relaxes. In this study, the model only takes into account the tensile load on the fiber yarn in one direction. Moreover, the length of two fiber yarns in different directions changes with the shear angle, which can be described by the following formulas:
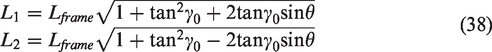
The 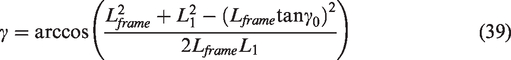
The yarns located in the arm parts are not subjected to tension forces, but they still experience the compressive strain and frictional forces between the warp and weft yarns. Therefore, it is necessary to consider the calculation of friction and compression deformation in the arm parts during the simulation. A schematic diagram of the sample is shown in Figure 15.
Schematic diagram of the experimental sample of the picture frame (a) with and (b) without fiber yarn in the arm part.
According to the principle of virtual work, the modified shear load is expressed as follows:
The algorithm describing the large deformation constitutive of woven fabrics is shown below.
1: %Calculate the tensile force of the fiber yarn 2: 3: ΔL(i) ← Equation (41) 4: 5: 6: ΔF(i) ← Equation (11) 7: F(i) = F(i–1) + ΔF(i) 8: ΔH(i) ← Equation (12) 9: H(i) = H(i–1) + ΔH(i) 10: 11: %Calculate the total tensile force of woven fabrics 12: Ffabric = n × F 13: %Calculate the shear force of woven fabrics 14: 15: FS(i) ← Equation (40) 16: γ(i) ← Equation (39) 17: 18: %Calculate the total force of woven fabrics 19: Ftotal ← Equation (42)
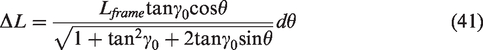
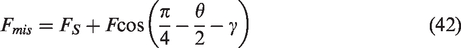
The numerical simulation results of the 0.025 m2 sample and the 0.044 m2 sample are shown in Figures 16 and 17, where the deviation angles are set to 0.83° and 0.86°, respectively.
Trellising loads of 0.025 m2 sample with 0.83° fiber misalignments.
Trellising loads of 0.044 m2 sample with 0.86° fiber misalignments.
We added the angle correction to the 15 in 2 sample in Figure 12 to get Figure 18, and the deviation angle is set to 0.12°.
Trellising loads of 15in 2 sample with fiber 0.12° misalignments.
The figures presented illustrate the successful application of the proposed mesoscale model in simulating the picture frame experiment considering fiber misalignments. The results obtained from the model demonstrate its ability to accurately capture the relationship between load and load direction displacement, given an appropriate definition of the displacement boundary conditions. This highlights the potential of the developed mesoscale model as a tool for characterizing the mechanical behavior of woven fabrics subjected to various loading conditions.
General applicability verification of the model
In the following section, we will further validate the universal applicability of the proposed model by analyzing the data obtained from uniaxial tensile tests and bias-extension tests conducted on jute woven fabric.
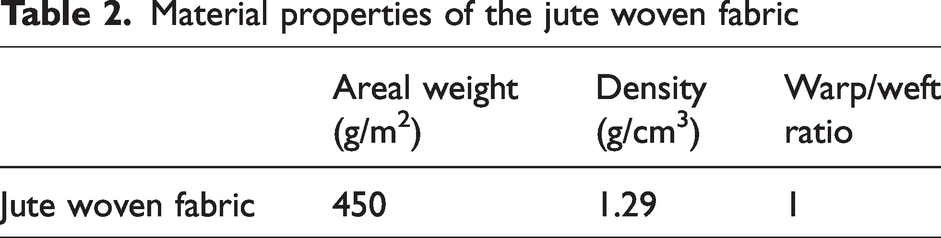
At room temperature, the jute plain woven fabric with a standard distance of 100 mm was used to perform a uniaxial tensile test at the rate of 2 mm/min. The jute woven fabric sample contains 20 fiber bundles. The material parameters of the woven fabric are shown in Table 2. The elastic modulus of the jute fiber bundles is 6162.9 MPa, and the friction factor between fiber bundles is 0.5.2,30 The width, thickness, and spacing of the jute fiber bundle are 1.00, 0.24, and 2.65 mm, respectively. The cross-section area of the fiber yarn is
Material properties of the jute woven fabric
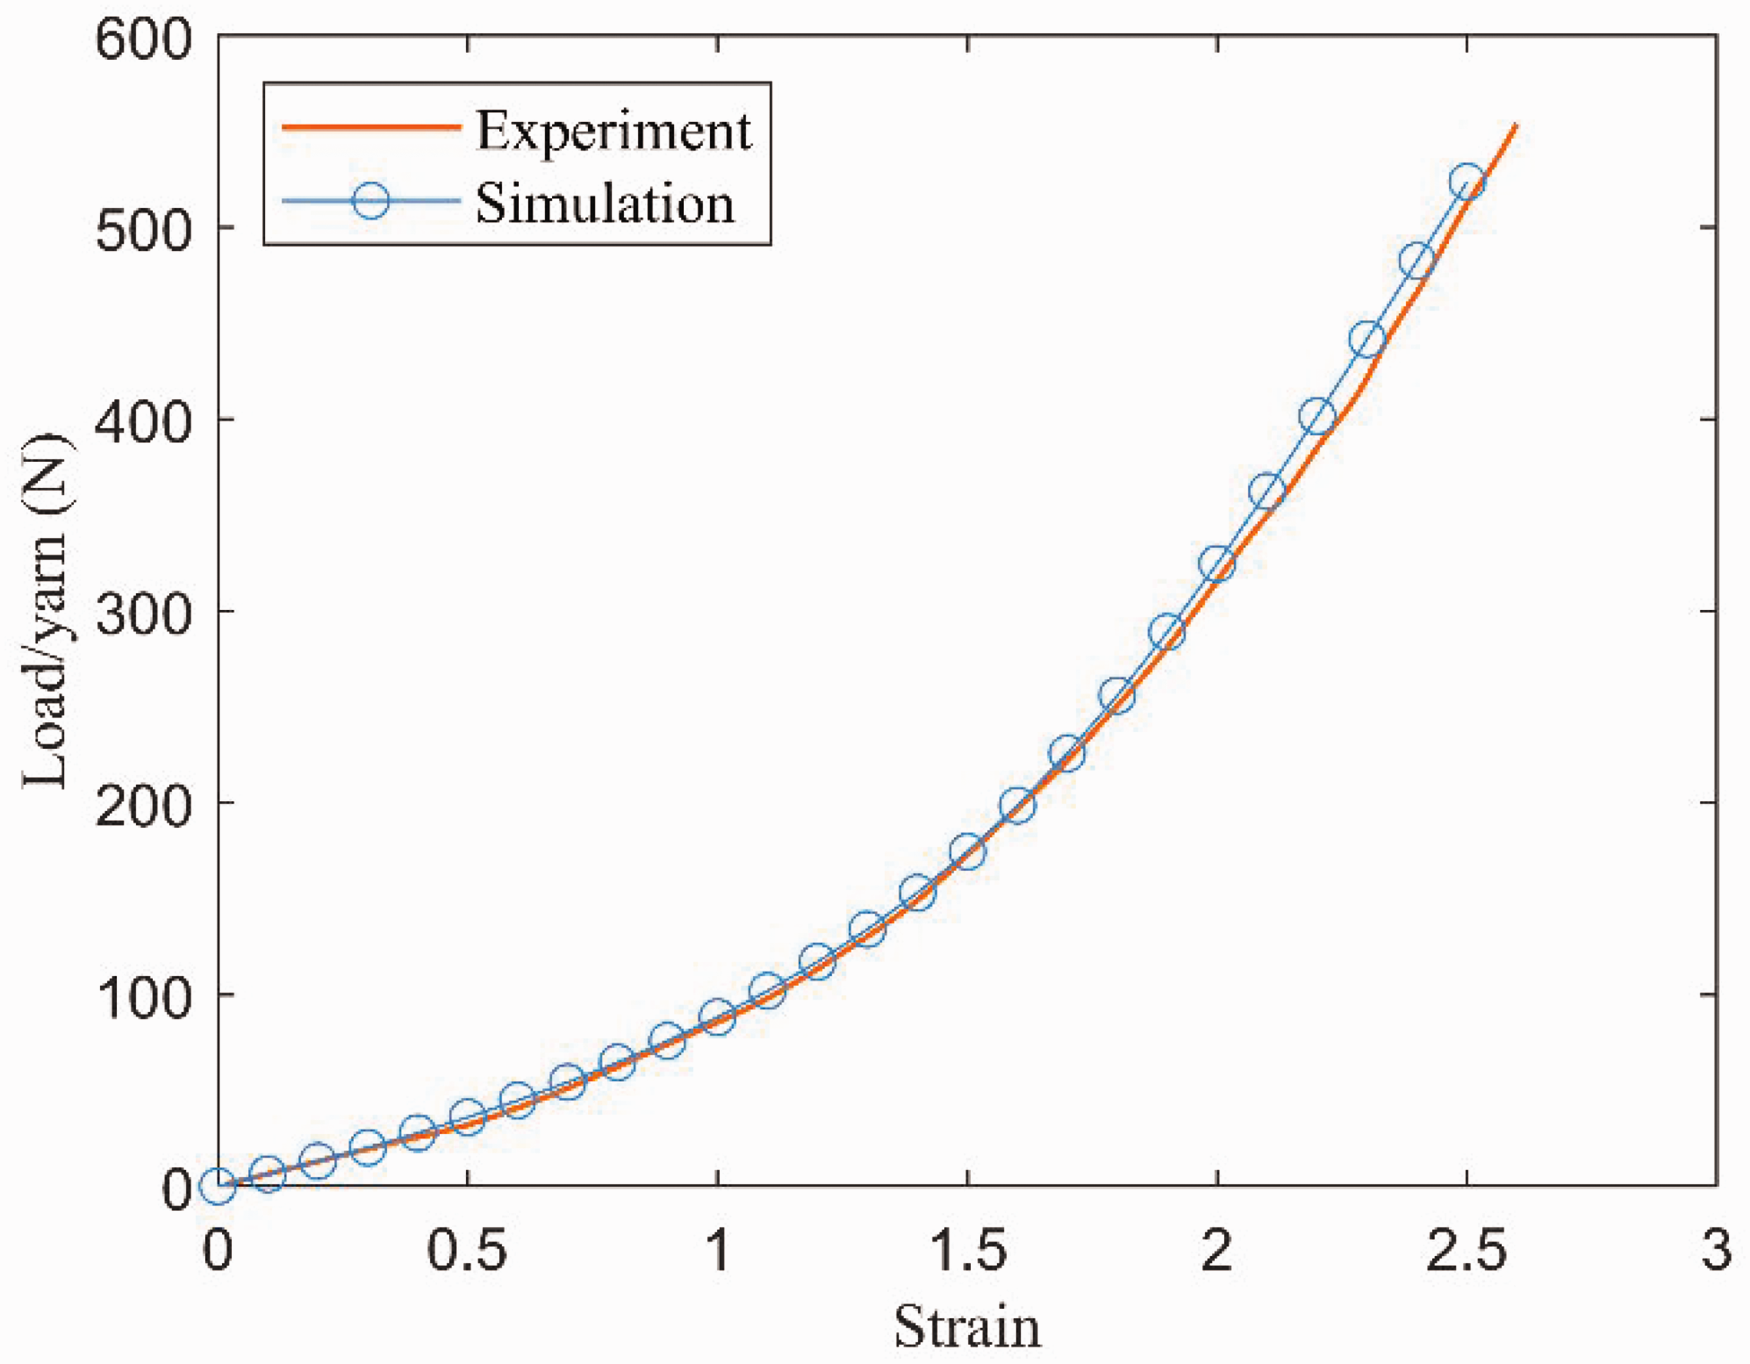
Simulation results of jute woven fabrics uniaxial tensile test.
We choose jute woven fabrics with sizes of 10 cm × 5 cm, 16 cm × 8 cm, and 20 cm × 10 cm for the bias-extension test. The middle pure shear regions of the three samples have 13, 20, and 25 warp or weft yarns, respectively. The experiment stretches three samples at room temperature at a speed of 1 mm/min. We select the sample with a size of 10 cm × 5 cm to determine the parameters required in the model, and then use the remaining two sets of data for verification. The formula of FN (Equation (14)) for the friction stage between fiber yarns can be obtained by fitting the shear curve, where 
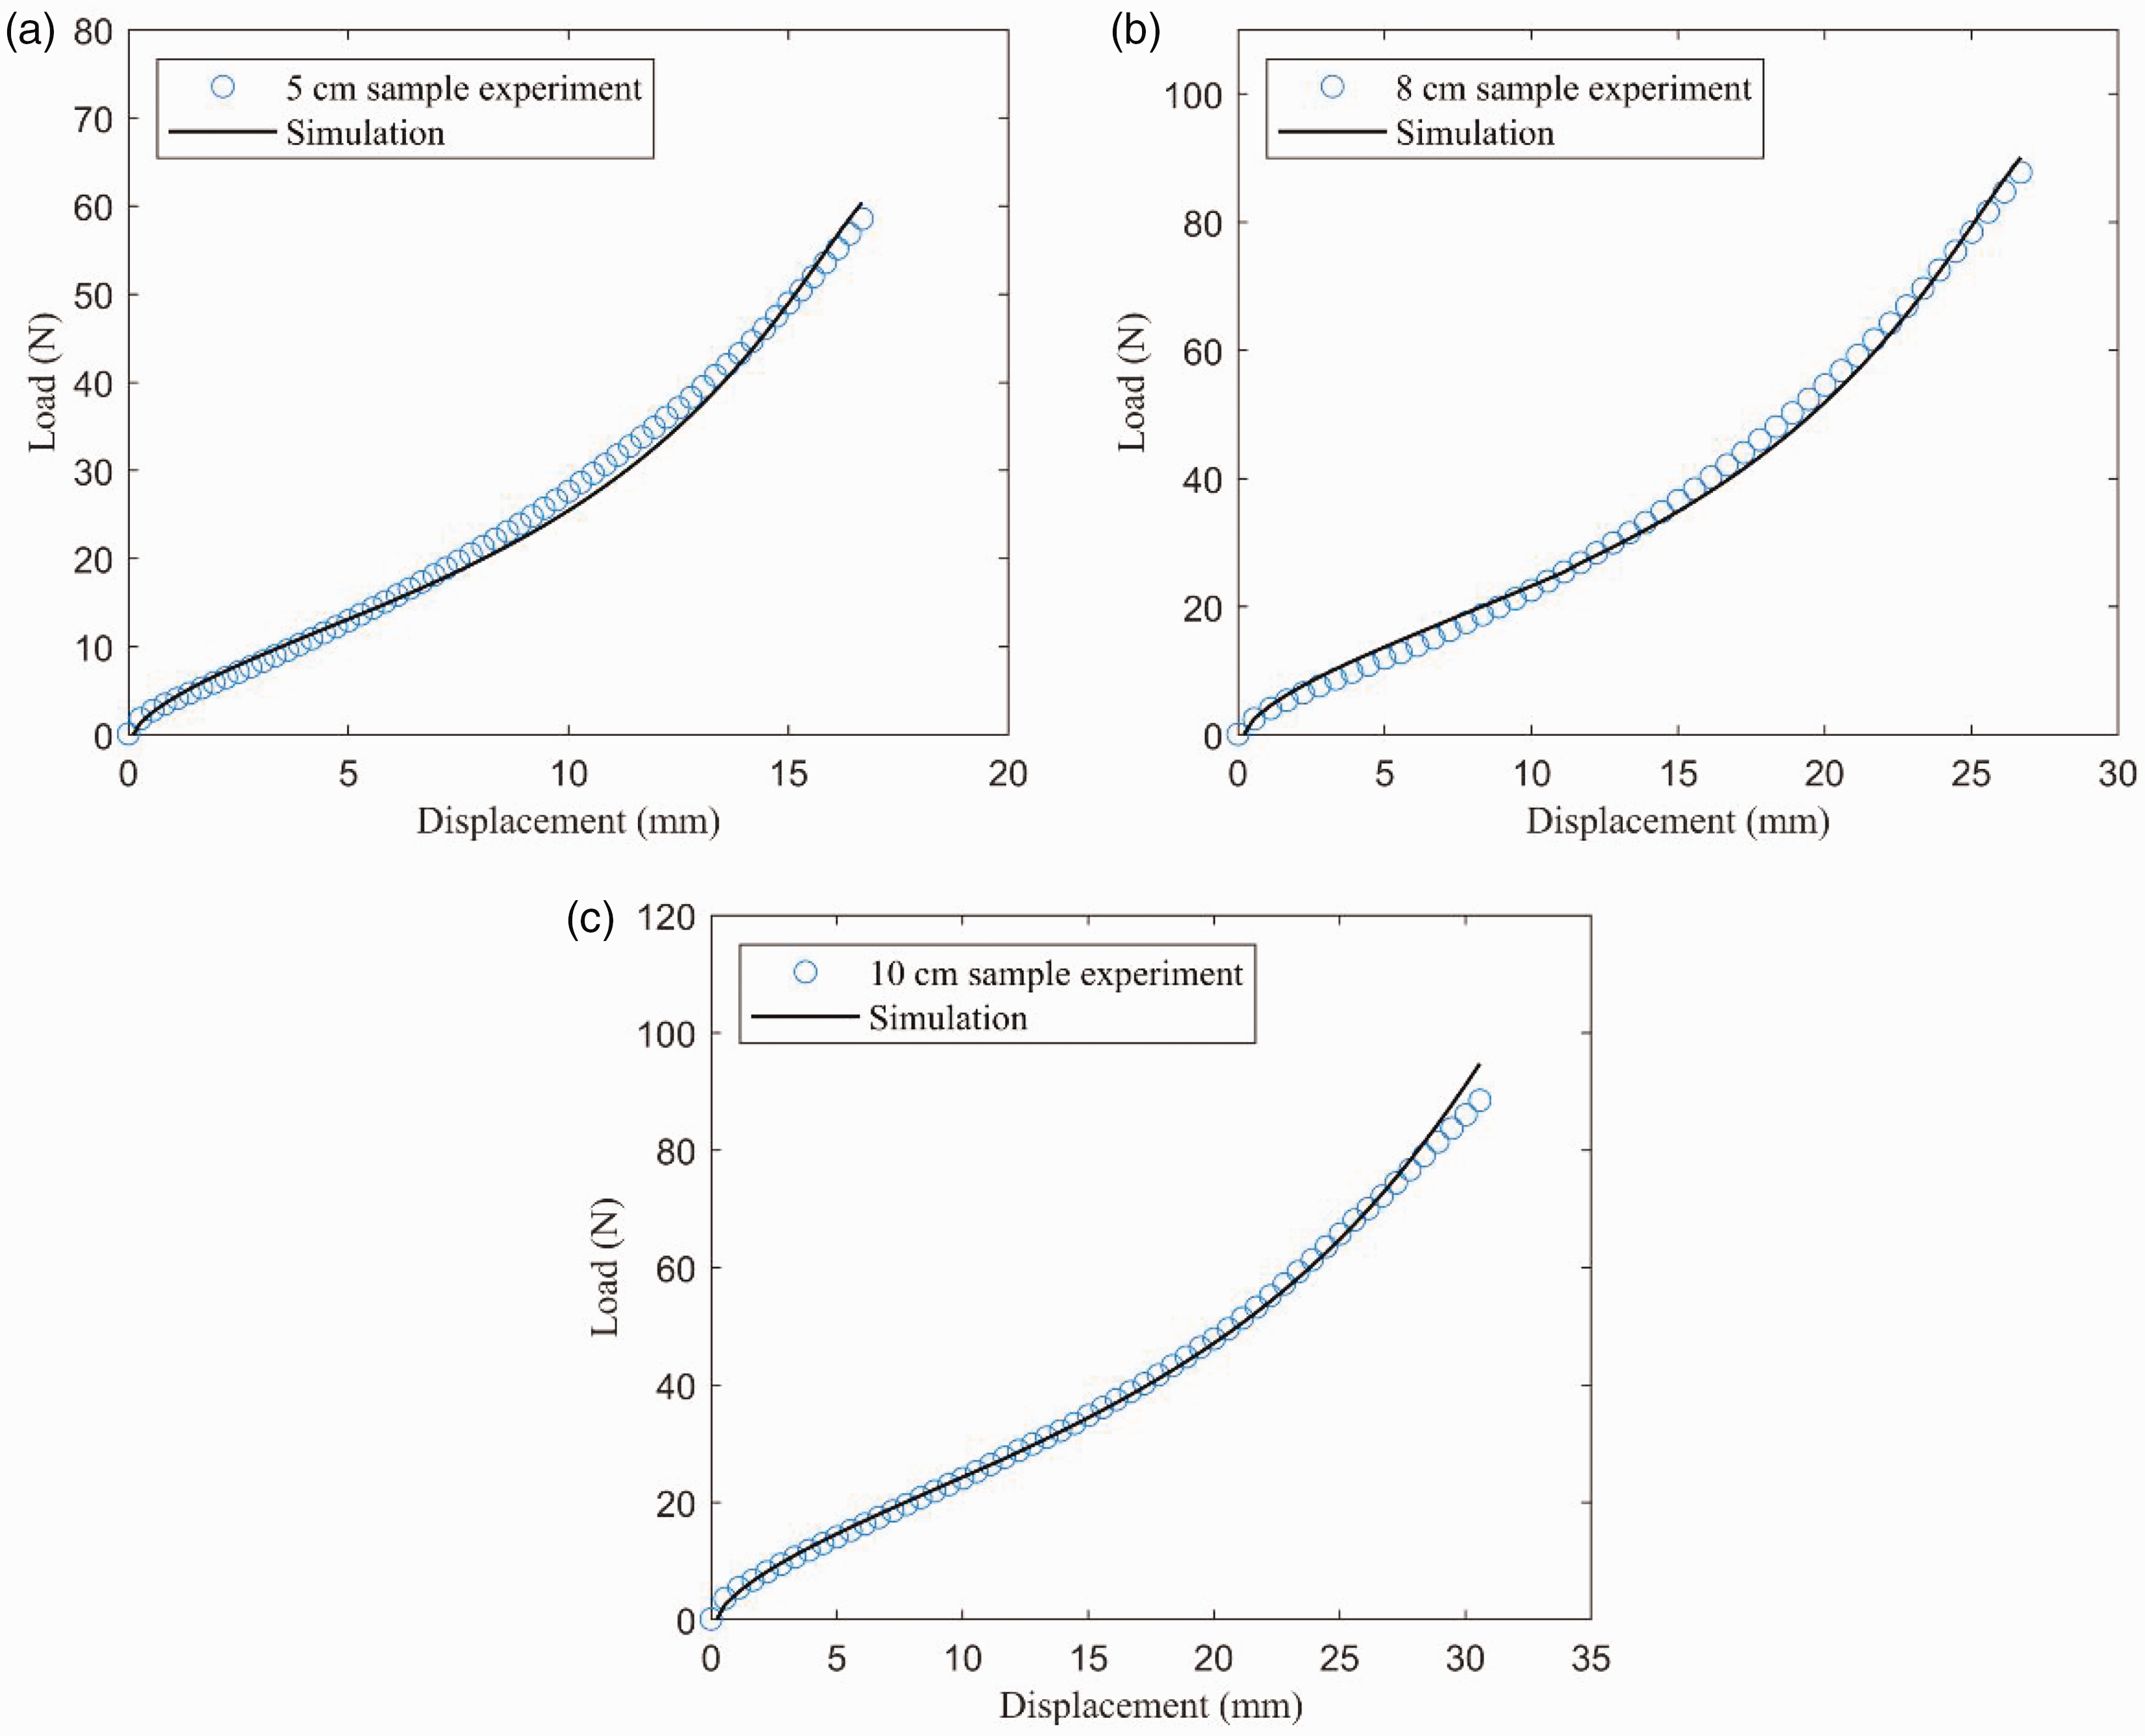
Simulation results of bias-extension experiments: (a) 10 cm × 5 cm sample; (b) 16 cm × 8 cm sample and (c) 20 cm × 10 cm sample.
Based on the aforementioned experimental results, it is evident that the jute woven fabric exhibits a higher density, resulting in a relatively short first stage of pure friction. Moreover, the shear deformation of the woven fabric primarily arises from the friction between fiber bundles and lateral extrusion. The simulation results closely match the experimental data, indicating that the model is generally applicable and accurate in capturing significant deformations of woven fabrics. These findings provide comprehensive evidence supporting the reliability and effectiveness of the model.
Conclusion
A mesoscopic model of woven fabrics is proposed in this paper to simulate the tensile and shear deformation of woven fabrics, based on the Timoshenko beam theory and the virtual work principle. Given that the material parameters of anisotropic fiber bundles remain consistent along the fiber bundle direction, we adopt the Timoshenko beam model to represent the undulated yarns in the woven fabric. This approach provides an effective means to capture the mechanical behavior of the fabric, accounting for the particularities of its composition. The relationship between the macroscopic mechanical response and the infinitesimal strain of the beam is determined through the principle of virtual work. The tensile model accurately captures the correlation between the woven structure and the macro-mechanical response of the fabric. Furthermore, the inclusion of yarn shape functions allows for easy integration of different yarn weaving structures into the model. Energy dissipation due to friction between fiber yarns and strain energy due to transverse compression are considered in the shear model. Since the model is built from the perspective of energy, the model maintains accuracy even during the slight wrinkling stage of shear deformation. However, further verification is required to ensure the model's accuracy in cases involving severe wrinkles in woven fabrics. The combination of the shear model and the tensile model enables the simulation of large deformations of woven fabrics under specific displacement boundary conditions. This comprehensive approach provides a valuable tool for analyzing and understanding the mechanical behavior of woven fabrics, encompassing both tensile and shear deformation aspects.
Footnotes
Acknowledgements
The supports from the National Natural Science Foundation, China (U20A20288, 11972225) are gratefully acknowledged.
Declaration of conflicting interests
The authors declared no potential conflicts of interest with respect to the research, authorship, and/or publication of this article.
Funding
The authors received no financial support for the research, authorship, and/or publication of this article.