
Abstract
Military personnel use protective armor systems that are frequently exposed to low-level damage, such as non-ballistic impact, wear-and-tear from everyday use, and damage during storage of equipment. The extent to which such low-level pre-damage could affect the performance of an armor system is unknown. In this work, low-level pre-damage has been introduced into a Kevlar/phenolic resin-starved composite panel using tensile loading. The tensile stress–strain behavior of this eight-layer material has been investigated and has been found to have two distinct regions; these have been understood in terms of the microstructure and damage within the composite panels investigated using micro-computed tomography and digital image correlation. Ballistic testing carried out on pristine (control) and pre-damaged panels did not indicate any difference in the V50 ballistic performance. However, an indication of a difference in response to ballistic impact was observed; the area of maximal local out-of-plane deformation for the pre-damaged panels was found to be twice that of the control panels, and the global out-of-plane deformation across the panel was also larger.
Aramid fabric, woven using aramid fibers, is used extensively in protective composite armor systems. One of the most common types is the para-aramid Kevlar® fiber-reinforced thermoset-polymer matrix composite. In terms of resin content, military composites manufactured using Kevlar® fabric are generally of two different types: resin-starved or fully impregnated composites. Resin-starved composites have a resin content ranging from 10 to 20 wt%, while fully impregnated composites have approximately 50–60 wt% and are essentially void-free. 1 The difference in resin content produces significant differences in the mechanical behavior of the resulting composites. In general, fully impregnated Kevlar composites behave in a fashion similar to other fiber-reinforced composites that use glass or carbon fiber reinforcements, but with properties being influenced by fiber characteristics. Conversely, resin-starved composites, which are the subject of this work, behave quite differently to fully impregnated composites. 2
Protective composite armor systems using resin-starved composites can be found primarily in personnel applications such as body armor and helmets.3,4 These systems can be exposed to blast debris and ballistic impact during service, where significant damage can be readily identified. Consequently, the mechanical behavior of Kevlar fibers and fabrics, both as materials in their own right and in the form of polymer matrix composites, has been the subject of a number of investigations, including studies on ballistic performance.5 –19 However, in addition to damage caused by ballistic impact, protective personal armor can also be exposed to other types of damage that can be introduced during everyday wear-and-tear (e.g., during storage of armor or repeated low-level damage such as knocks and abrasions during use), or through cleaning processes (e.g., laundering 20 ).
This work addresses the issue of whether damage imparted before ballistic testing can affect the ballistic performance and behavior of resin-starved para-aramid composite laminates. Kinsler and Collins 21 have suggested that the ballistic performance of panels with pre-damage can be improved compared with undamaged panels, although the nature of the damage was not investigated in detail. In this work, controlled pre-damage has been introduced into a resin-starved Kevlar/phenolic laminate system through tensile loading, and the pre-damaged state of the composite has been determined. The ballistic performance of pre-damaged panels has then been compared with the performance of undamaged control panels.
Materials and methods
Specimen manufacture and mechanical testing
Resin-starved aramid-fiber-reinforced polymer (AFRP) composite panels, with a phenolic matrix, were manufactured using Kevlar® 258HPP plain woven pre-preg rolls, having an areal density of 450 g·m−2. The pre-preg, manufactured by DuPont and obtained courtesy of NP Aerospace, had approximately 90 wt% fiber and 10 wt% matrix. The pre-preg roll, 1000 mm × 20000 mm in width and length respectively, had a thickness of 0.5 ± 0.02 mm. A symmetric (0/90)8 lay-up was used for the laminates (i.e., eight layers of the woven 0/90 pre-preg), and the composites were produced following the manufacturer’s instructions. In this pre-preg material, there was a resin film layer on one side only if the pre-preg and fiber tows were not fully impregnated with resin. To manufacture the eight-layer panels, the pre-preg stack was placed between two aluminum plates (2 mm thick), both wrapped with non-stick polytetrafluoroethylene sheets. The prepared stack was placed in the press (Höfer Presstechnik A-4753 with 500 mm × 500 mm plates) which had been pre-heated to 165°C, as indicated by the pre-heat temperature. A load applying a pressure equivalent to 50 bar was applied for 35 minutes at 165°C. The specimens were removed to a flat surface and allowed to cool at room temperature. All of the panels had slight warpage of approximately 1.5–2 mm especially near the edges.
Narrow coupons and two types of wide-panel specimens were manufactured using Kevlar shears (200 mm Carbon Steel Kevlar Scissors; RS-PRO 835-2700) to section the pre-preg fabric to produce the different widths. The narrow coupons were manufactured to 11 mm × 200 mm × 3.2 mm (Figure 1(a)) and Tufnol (glass fiber-reinforced polymer composite) end-tabs, 50 mm × 11 mm × 2 mm, were bonded onto the coupons. Wide-panel specimens were manufactured with two lengths 200 mm × 400 mm × 3.2 mm (Figure 1(b)) and 200 mm × 300 mm × 3.2 mm (Figure 1(c)), with mild steel end-tabs (50 mm × 200 mm × 12.7 mm) bonded to the larger panels in order to be able to pre-damage the panels through tensile loading. The Tufnol and mild steel end-tabs were both attached using epoxy adhesive (3M™ DP490 Scotch-Weld™ EPX Adhesive DP-490).
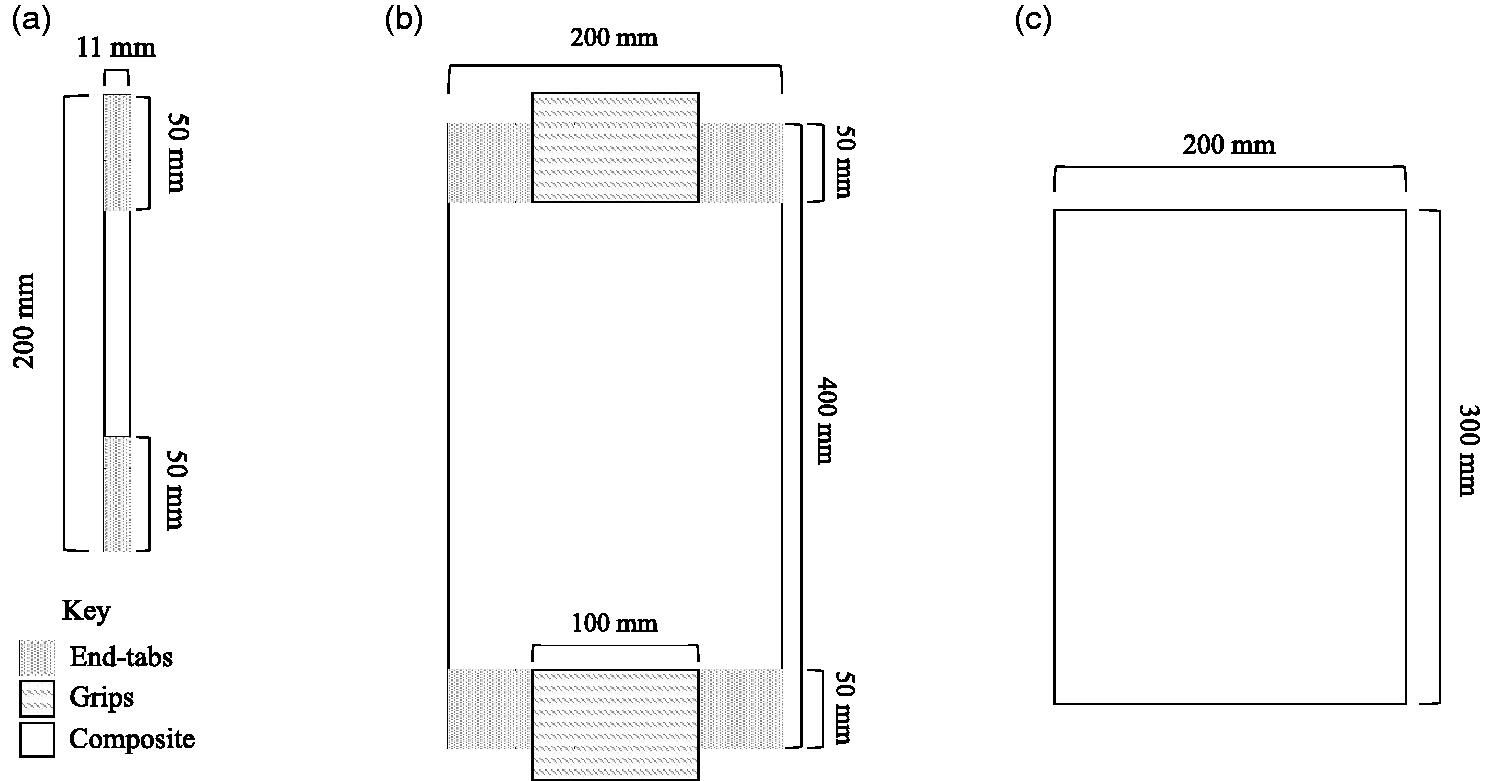
Schematic diagram showing dimensions of (a) end-tabbed narrow specimens, (b) end-tabbed wide pre-damage specimens and Instron grip width, and (c) wide control specimens.
Tensile testing to obtain the stress–strain response of the material was carried out on the narrow coupons according to ASTM D3039,22 using an Instron 1341 (100 kN load cell) with an 8800 controller and Wave Matrix control software. The strain was recorded using an Instron extensometer, gauge length 12.5 mm. Pre-damage was introduced into the end-tabbed wide panels by loading the panels to a stress of 300 MPa using an Instron 8805 (250 kN load cell; load rate of 1.8 kN·s−1) with grips having a jaw width of 100 mm. It should be noted that this was half the specimen width (200 mm), which resulted in a localized stress concentration in the region of the end-tabs, the effects of which are discussed later. In addition to the extensometer, changes in specimen dimensions were recorded using electronic digital calipers (Linear Tools 49-923-150).
Digital image correlation and µCT analysis
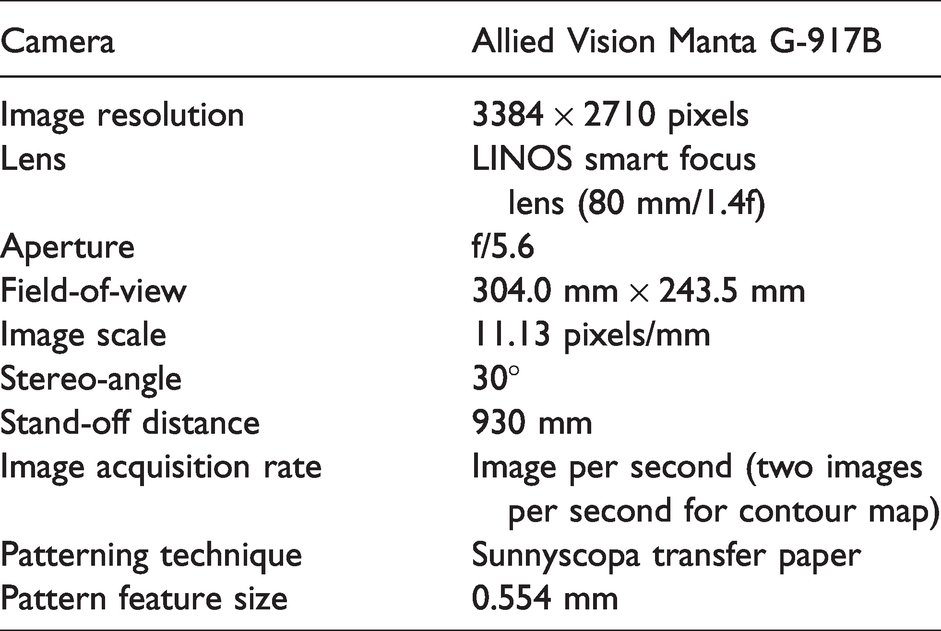
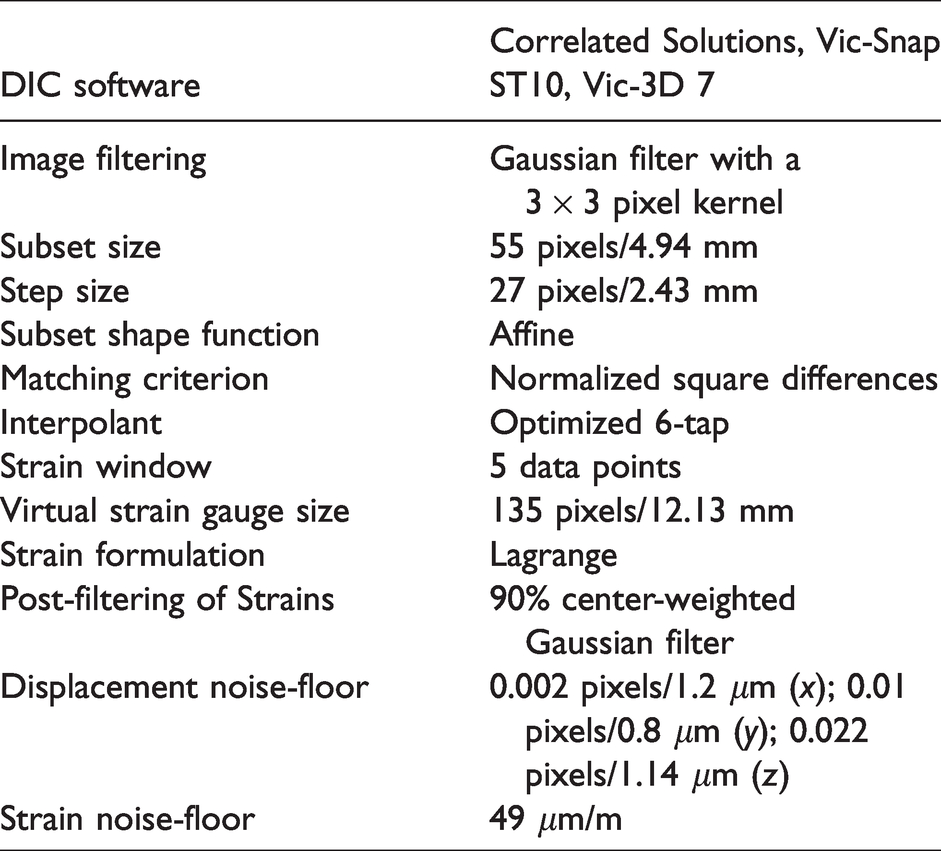
Digital image correlation (DIC) and micro-computed tomography (µCT) testing were also used to monitor the specimens and assess the damage introduced during tensile loading. The DIC set-up included twin high-resolution cameras (Manta MG917B cameras; LINOS MeVis-C 35 mm lens) mounted on a Manfrotto 475B tripod and illuminated using two Hedler Profilux LED 1000 lamps. The two cameras were vertically aligned to capture the entire specimen surface. The DIC speckle pattern was generated using SpeckleGen 1.0.5 (freeware) by setting variation, density and diameter inputs to follow SpeckleGen recommendations. The resulting pattern consisted of 0.554 mm speckles with approximately equal amounts of black and white coverage. The pattern was then applied onto the specimens using transfer paper manufactured by Sunnyscopa following the method developed by Matthews. 23 Images were captured using VIC-Snap ST10 software (Correlated Solutions). The image capture rate was set at one frame per second (fps) for tensile loading. Subsequently, the image capture rate was set at 2 fps to obtain an out-of-plane contour map after ballistic testing. The post-processing of the images and appropriate analysis was performed using VIC-3D 7 software (2018, Correlated Solutions). More details of the hardware parameters and analysis parameters can be found in Tables 1 and 2.
DIC hardware parameters
DIC analysis parameters
Two µCT systems were used to characterize the specimens: a Zeiss Versa µCT system (Versa Zeiss Xradia VERSA XRM-510) and a Nikon HMX µCT system (Nikon HMX X-TEX XT H 225L). A total of 2401 projections were captured on the Versa system for one complete rotation of the sample with equiangular spacing. The beam was set to 80 kVp and 7 W, and each projection was taken for 8 s using the 4× objective. Each projection was captured with binning set to 2×, yielding a maximum projection size of 1024 × 1024 pixels at a pixel size of 2.01 µm. A total of 3142 projections were captured on the HMX system for one complete rotation of the sample with equiangular spacing. The beam was unfiltered at 100 kVp and 7 W using a tungsten reflection target. Exposure time was 0.5 s per frame. Each projection was captured without binning on a Perkin Elmer 1621 gadolinium oxysulphide flat panel detector, at a pixel size of 5.4 µm, with analog gain set to 24 dB.
Assessment of ballistic performance
The ballistic performance of the wide-panel specimens, both for the control group (i.e., as manufactured/pristine) and the tensile loaded, pre-damaged group, was assessed using a gas gun system (barrel: 7.62 mm caliber; length: 820 mm; Refcode: 35050283). The set-up included light screens (Oehler Model 57 Infrared screen) approximately 0.65 m in front of the target to measure impact velocity; therefore, air drag correction for impact velocity was not required. The experimental set-up was based on the NATO STANAG 2920 test standard. 24 As specimens of this type and thickness had not been tested previously, a starting velocity was selected to observe the initial behavior. However, these velocities were not included in the statistical calculations because they were regarded as calibration shots.
The projectile was a 1.1 g chisel-nosed fragment simulating projectile (FSP; threat F5 in Annex C of AEP-292024) impacting the target at NATO 0° (normal to the strike face). The impact was recorded using high-speed cameras (MIRO M310; AF NIKKOR Nikon lens at 10,000 fps) to identify any projectile yaw, observe specimen strike-face deformation and to verify the velocities recorded by the light screens. A laser measure (Leica DISTO X310) was used to measure the distance between the target and gas gun to ensure consistency between tests. A witness system consisting of an A4 sheet of 80 gsm white paper backed by 5 mm rolled homogeneous armor (RHA) steel was placed 0.2 m behind the target to identify a target win/defeat (target defeat was identified by a hole in the paper, signifying a complete penetration of the target). The velocity of the projectile was adjusted by controlling the pressure of the gas gun. Each target was rigidly mounted onto a steel frame with a 100 mm × 100 mm aperture. The arrangement ensured the impact point coincided with the center of the window.
A total of 44 shots were completed on 22 specimens; the results from 20 specimens (40 shots) are presented as 4 out of the 44 shots were discounted as non-fair hits, mainly because of a projectile yaw of >5° upon impact. The results of 20 shots were taken per group of specimens, which provided reliable statistical analysis. Results were statistically analyzed using the Probit method as outlined by Helliker 25 to compare the two groups. The results were plotted as a function of projectile penetration probability against projectile impact velocity, and the gradients and the V50 velocities (the impact velocity at which there is a 50% likelihood of sample complete penetration) of the regression graphs were compared.
Results and discussion
Morphology of the resin-starved materials and tensile stress–strain curves
Figure 2(a) shows a µCT-scanned image of the edge section of a resin-starved composite. The seven dashed blue lines in the image indicate the phenolic matrix regions that bond together the eight layers of plain-weave fabric. The fiber bundles lying in the y-direction (i.e., the loading direction for tensile loading) can be seen to be significantly crimped. As a consequence of the resin-starved nature of the composites, only the fibers at the surfaces of the fiber bundles are coated with resin; the fibers within the bundles are resin-free. This is also true for the fibers in the transverse, i.e., x-direction. Within the phenolic matrix regions, occasional voids can also be observed (highlighted in Figure 2(b)). Fundamentally, the resin-starved composite consists of eight plies of plain-weave fabric bonded together by layers of resin between the plies, with the resin penetrating only the surface fibers of the bundles. This morphology has a significant impact on the stress–strain curve for the resin-starved composite, compared with the stress–strain curve of a solid structural composite. 26
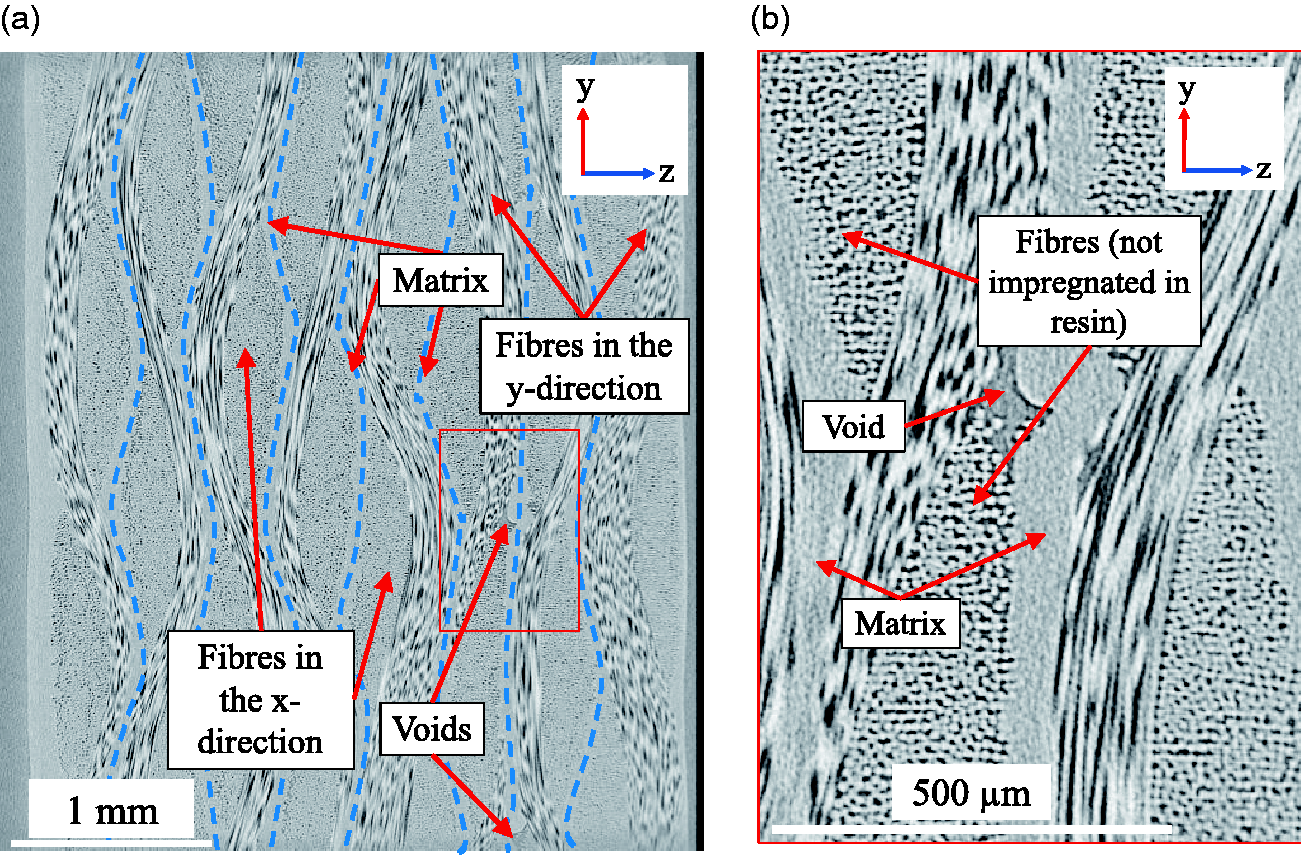
Versa µCT-scanned image of (a) the resin-starved composite showing the regions of matrix (dashed blue lines) and (b) an enlargement of the selected red region from (a) highlighting voids.
Tensile stress–strain curve for the resin-starved composite
A typical stress–strain curve to failure for the samples is shown in Figure 3(a), obtained from tensile testing the narrow specimens. The curve is bilinear, with a transition from a Young’s modulus of 3.6 ± 0.2 GPa (where here, and elsewhere, the uncertainty is the standard error) in the low stiffness region (Region 1) to a high stiffness region (Region 2) where the modulus is much higher. The Young’s modulus increases from around 20 GPa to 30 GPa near failure; a transition from Region 1 to Region 2 occurs at 2.1 ± 0.1% strain before final failure which occurs between 3 and 4% strain. Figure 3(b) shows a cyclic stress–strain curve, where a different specimen has been loaded to a strain within Region 1, unloaded and then reloaded to a higher strain, up to a maximum of 2.2% strain, which is just beyond the transition from Region 1 to Region 2. Figure 3(c) shows a cyclic stress–strain curve of a further specimen loaded to a strain within Region 2, unloaded and then reloaded to a higher strain in Region 2. These curves show that there appears to be significant hysteresis in both regions. Reproducible mechanical behavior can be observed for the three specimens, where the transition and failure points are similar.
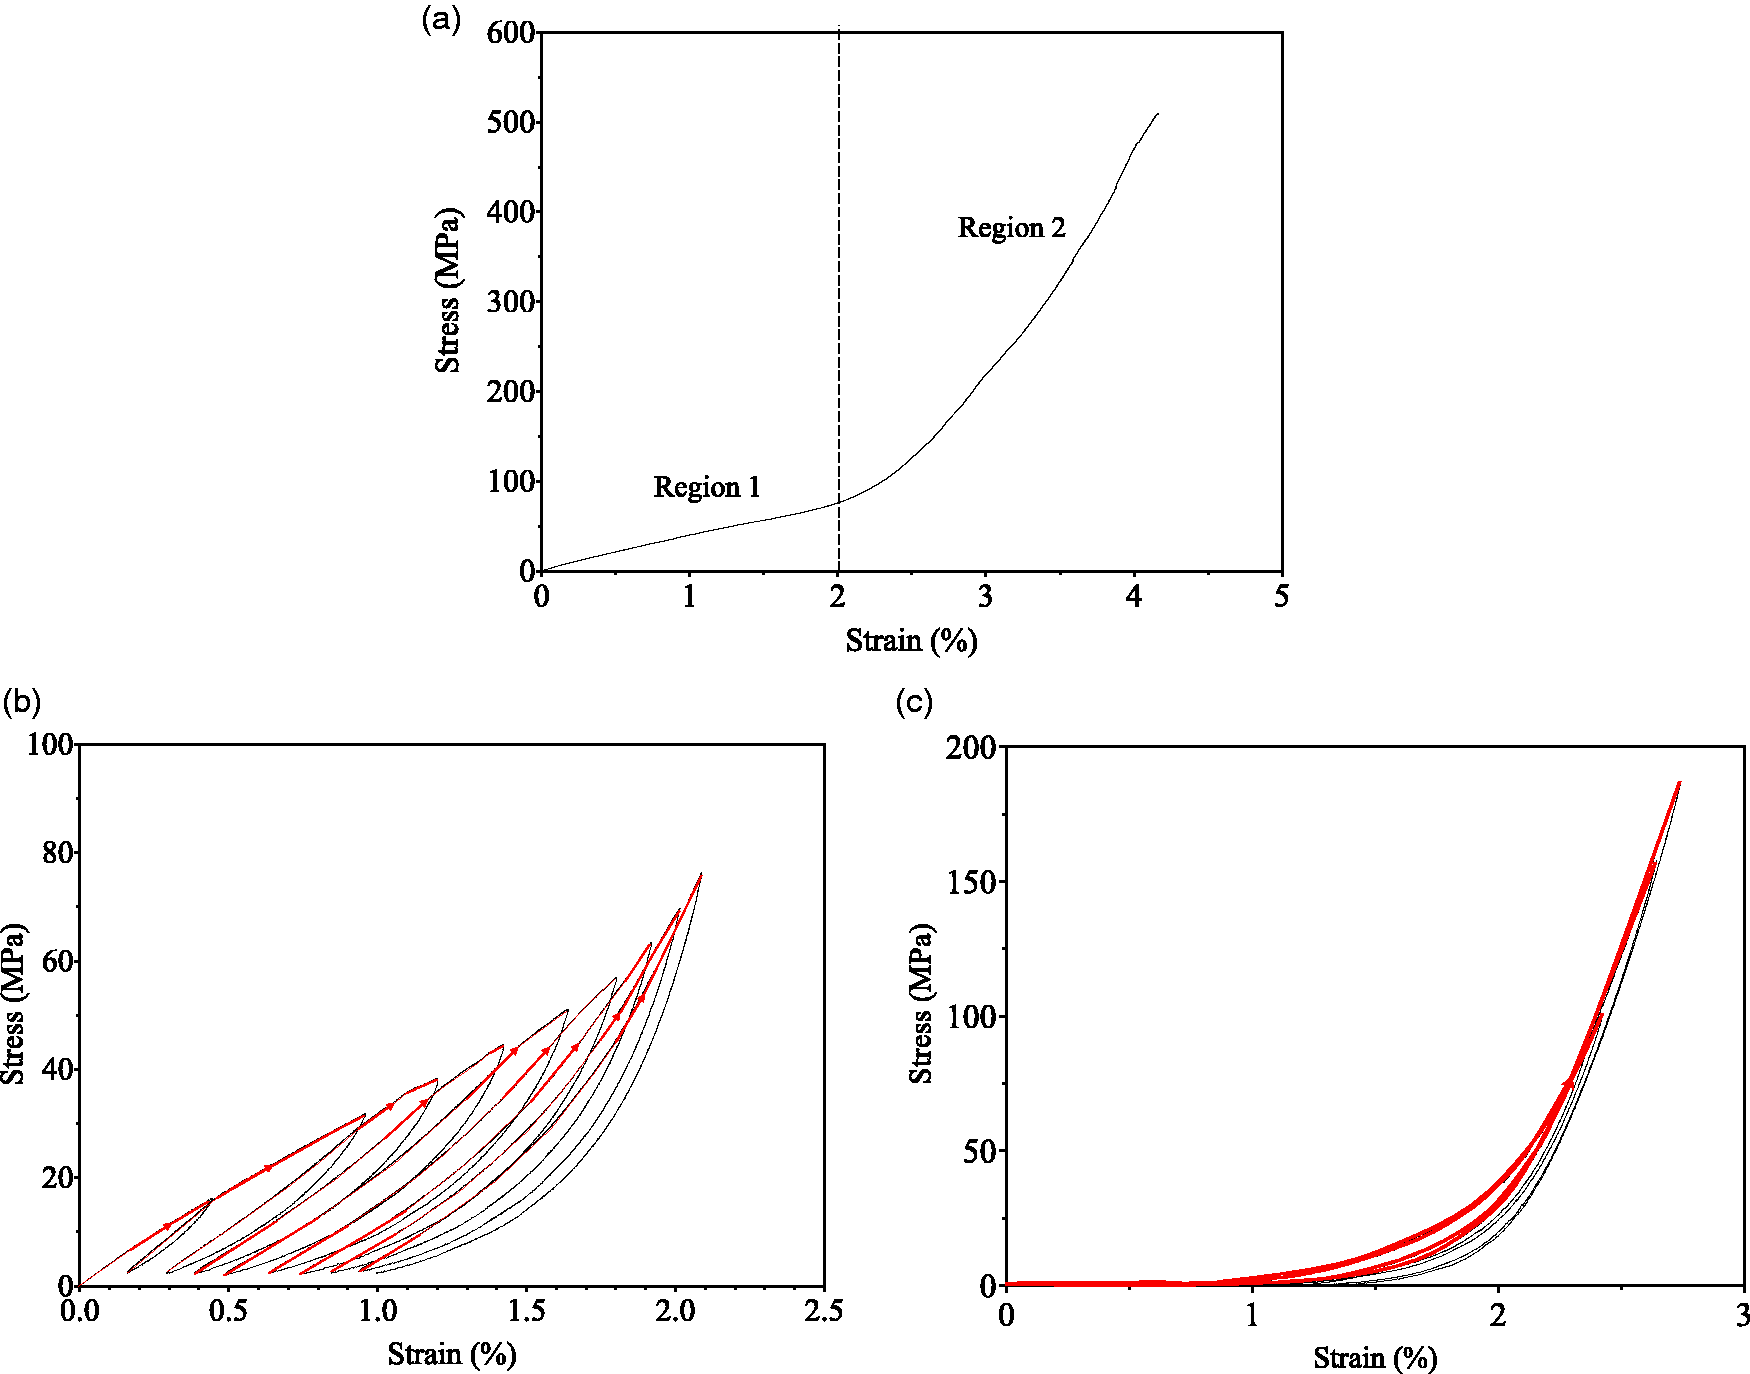
(a) Typical stress–strain curve to failure; (b) hysteresis loops in Region 1; (c) hysteresis loops in Region 2. Red lines in (b) and (c) correspond to the loading curves, while black lines correspond to the unloading curves.
In relation to the morphology of the structure, the behavior of the material in Region 1 can be understood as follows. The Young’s modulus in Region 1 originates from a combination of the contribution of (a) the resin regions between the fabric layers and (b) the outer fibers of the y-direction (axial) tows, which have been impregnated with resin and form a sheath of impregnated fibers surrounding fibers that have not been impregnated with resin (Figure 4). The fibers within the tows which are not impregnated with resin play a minor role in Region 1, although some load is transferred to them, presumably by friction between the fibers. Evidence for the effect of friction is provided by the cyclic stress–strain curves of Figure 3(b); the hysteresis loops in Region 1 show that energy is dissipated on loading and unloading, and that the specimen does not return to its original length on unloading, both effects presumably due to friction between fibers. Based on the weight fractions of fiber and matrix in the pre-preg sheet, and the densities of the fiber and the matrix (1.44 g·cm −3 and 1.07 g·cm −3, respectively), the calculated matrix volume fraction in the resin-starved composite was estimated to be 0.11 and the volume fraction of y-direction fibers was estimated to be 0.35. To estimate the volume fraction of impregnated axial fibers, it can be seen from inspecting the x-direction tows in Figure 2(a) (and similar images) that the fiber tows are flattened to ellipses with semi-major and semi-minor axes of approximately 760 μm and 130 μm, respectively. It is assumed that in Region 1, only the fibers in the impregnated sheath of the fiber bundles (which defines a volume of material approximately one fiber diameter thick; see Figure 4), together with the matrix regions that bond the layers together, contribute to the (tensile) Young’s modulus. Hence, the estimated composite modulus was 5 GPa, using the rule-of-mixtures sum for the contributions from the volume fraction of fibers in the impregnated fiber sheath (approximately 0.13) and the matrix volume fraction (approximately 0.11); the Kevlar fiber modulus and phenolic matrix modulus have been taken to be 124 GPa and 3.8 GPa, respectively.27,28 This estimate of the Region 1 modulus ignores the waviness of the fiber tows due to crimp and any contribution to the modulus from the sheath of impregnated fibers surrounding the transverse tows. The estimate is in reasonable agreement with the experimentally measured modulus of approximately 4 GPa.
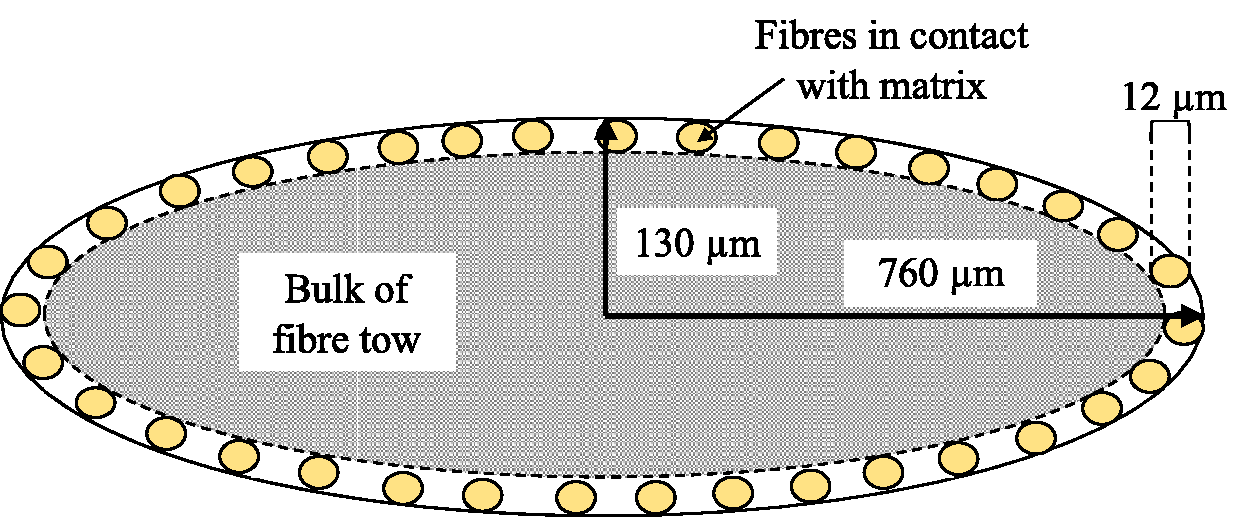
Schematic depicting dimensions of the fiber diameter and the semi-major and semi-minor axes of a fiber tow in the panel (not to scale), showing a sheath of impregnated fibers.
The transition from Region 1 to Region 2 occurs at 2.1 ± 0.1% strain, which is approximately the strain to failure of a typical phenolic resin. Consequently, at this strain, the phenolic matrix fractures and its contribution to load carrying is now negligible. The modulus in Region 2 results from the load being carried now by all of the fibers in the axial tows, not just the fibers in the impregnated sheath as in Region 1. Load transfer to the axial fibers within the tows presumably occurs by friction, and the combination of increased loading of the fibers, combined with the straightening of the tows, leads to an increasing modulus in Region 2 of the stress–strain curve. The axial tows have a composite volume fraction of roughly 0.35 and, when fully straightened, would produce an estimated Region 2 composite modulus of 43 GPa. The measured modulus near failure (at 3.6 ± 0.3% strain) is 28.7 ± 1.1 GPa (Figure 3(a)), suggesting that further straightening of the tows would have been possible if the specimen did not fail. This is supported by each hysteresis loop’s apparent increasing stiffness in Region 2 with higher peak stress (Figure 3(c)). Any fluctuations seen in Region 2 are probably the consequence of tow-straightening after the matrix has largely failed and no longer constrains the fiber tows; a gradually increasing modulus supports this suggestion. Region 1 is much smoother since no tow-straightening can occur here.
Dimensional changes during loading
During loading of the specimens, it was noticed that macroscopic dimensional changes occurred, i.e., the thickness of the specimens increased and the width of the specimens decreased; as will be seen, these changes are related to the damage introduced. Figure 5(a) and Figure 5(b) show the thickness of two narrow coupon specimens as a function of increasing load; the measurements were taken both when the coupon was under load (thickness at peak stress) and after the coupon was unloaded (thickness at zero stress). The measurements are the mean of three measurements taken at 30 mm, 65 mm and 75 mm along the gauge length. The specimens showed a negligible thickness increase up to a stress of around 50 MPa, which corresponds to a ∼2% strain. Up to this point, the thicknesses under load and when unloaded are roughly the same. Beyond ∼2% strain (i.e., Region 2), the specimen thicknesses, both loaded and unloaded (measurements taken while specimens remained within the loading machines), increase with increasing peak stress, although the rate of increase has significantly decreased, almost to zero, by ∼250 MPa (∼3% strain). At this point, the specimen thicknesses at peak stress and at zero stress under load have increased by roughly 55% and 25%, respectively. This thickness increase in Region 2 may be a consequence of a number of factors. During manufacture, the ply stack reduces in thickness from ∼4 mm to 3.2 mm; part, if not all, of this thickness reduction may be due to nesting of the plies. When the delamination occurs, the nesting is disrupted, leading to a significant recovery of the original thickness. The small decrease in thickness expected from a Poisson’s ratio contraction of the plies under tensile load would contribute only marginally to thickness changes since both the strains and the ply thicknesses are small.
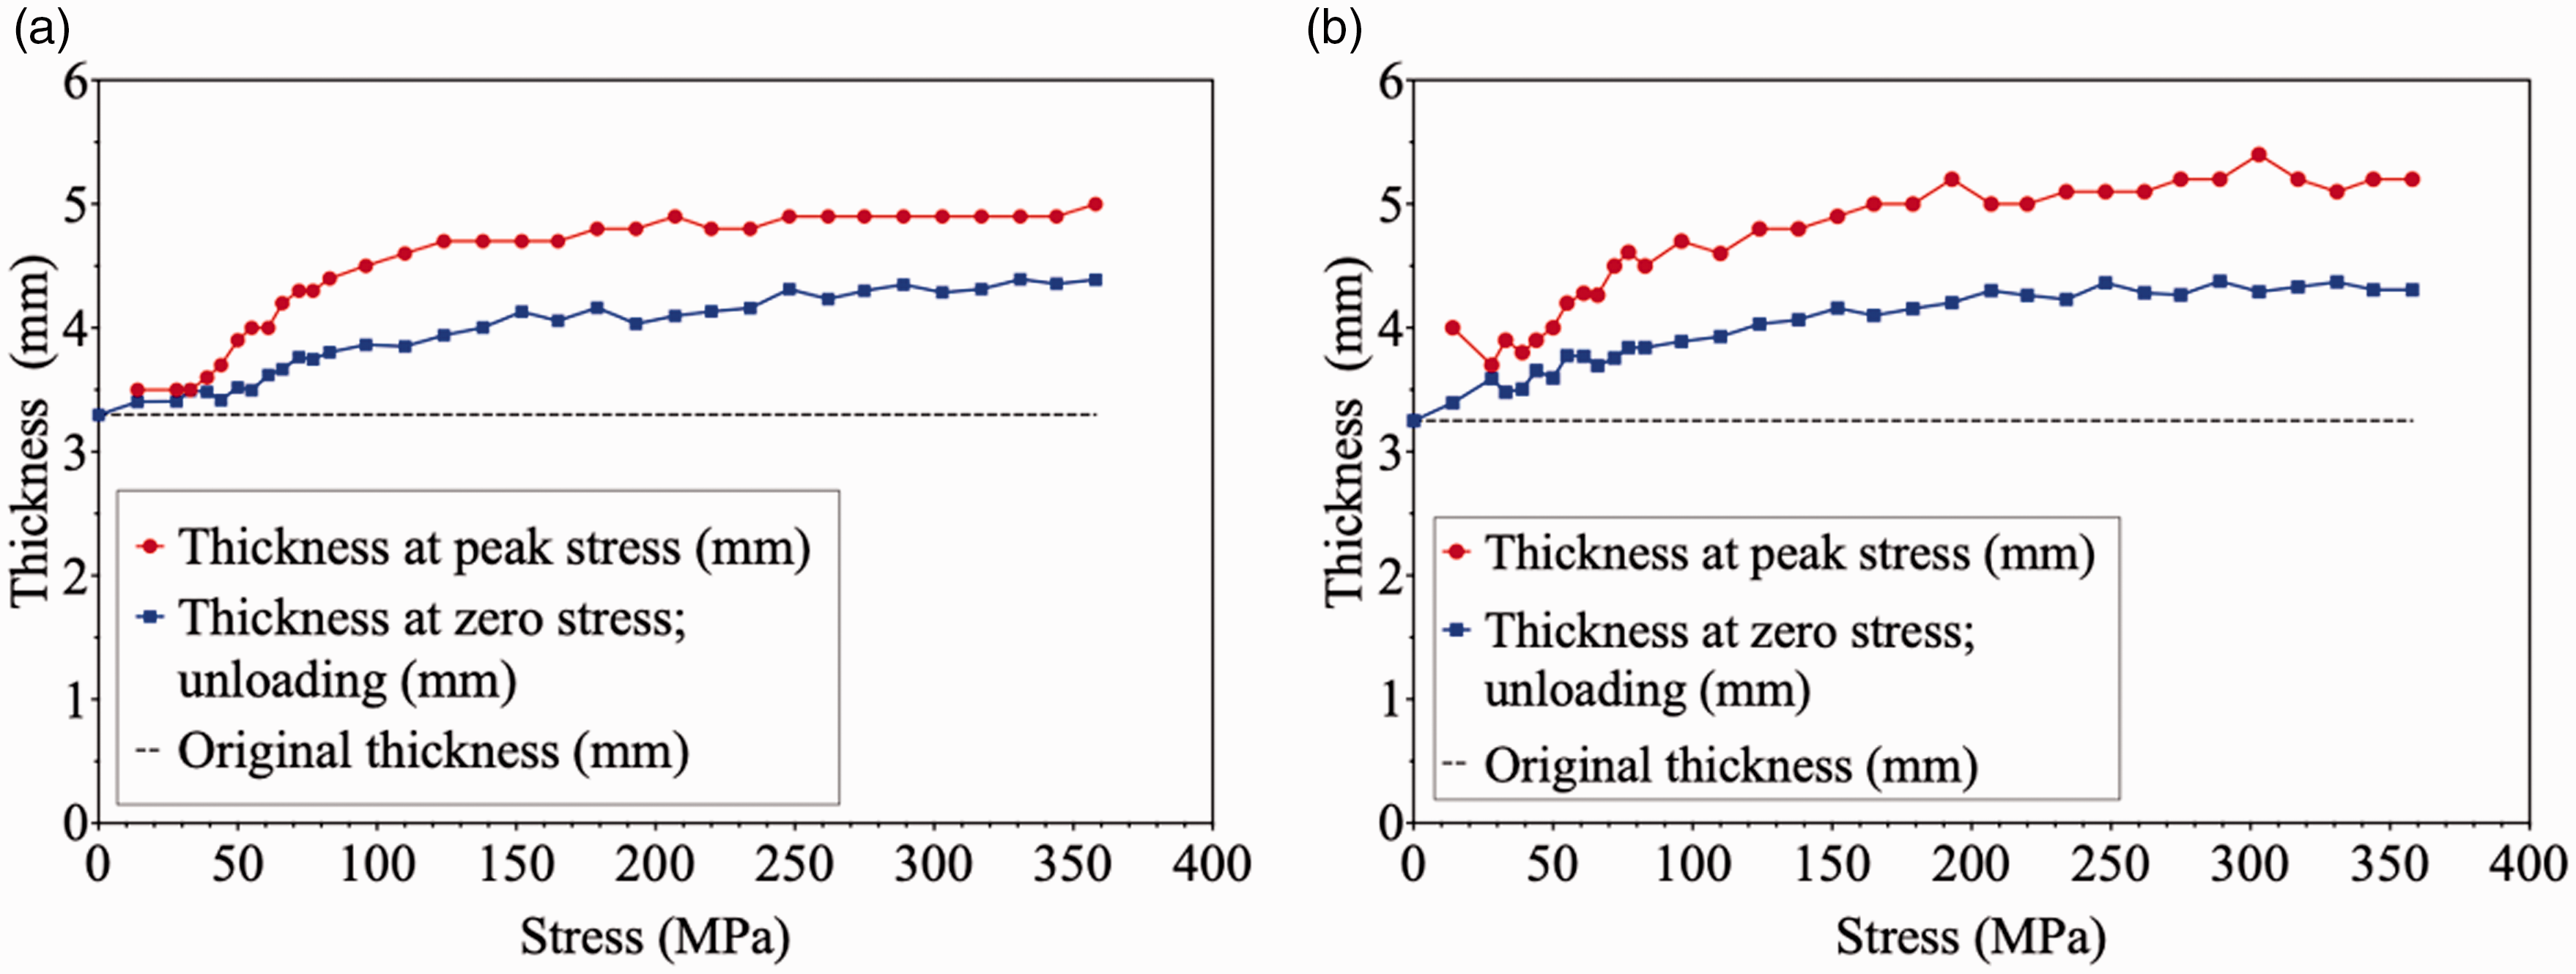
(a and b) Examples of the observed thickness increase in two different narrow aramid-fiber-reinforced polymer (AFRP) specimens.
Perhaps not surprisingly, a significant change in the loaded and unloaded widths of the specimens was observed to initiate at the transition between Region 1 and Region 2 (i.e., at ∼2% strain) with both loaded and unloaded widths decreasing with increasing strain. In order to observe the changes in width more clearly, measurements were made on wide-panel specimens. Figure 6 shows typical average width changes in a wide-panel specimen as a function of stress when both loaded and unloaded (measured at 70 mm, 120 mm and 200 mm along the gauge length). As indicated above, the onset in permanent width changes again occurred at ∼50 MPa (i.e., ∼2% strain). By ∼300 MPa, the rate of change of the width with increasing stress has reduced considerably, almost to zero. It is possible that the change in width in Region 2, after matrix failure, may be because after the delaminations develop, the loaded y-direction tows slide past each other when under load (producing a decrease in width) but when unloaded, friction prevents the tows returning to their original locations, thus producing a small and permanent decrease in width. 8
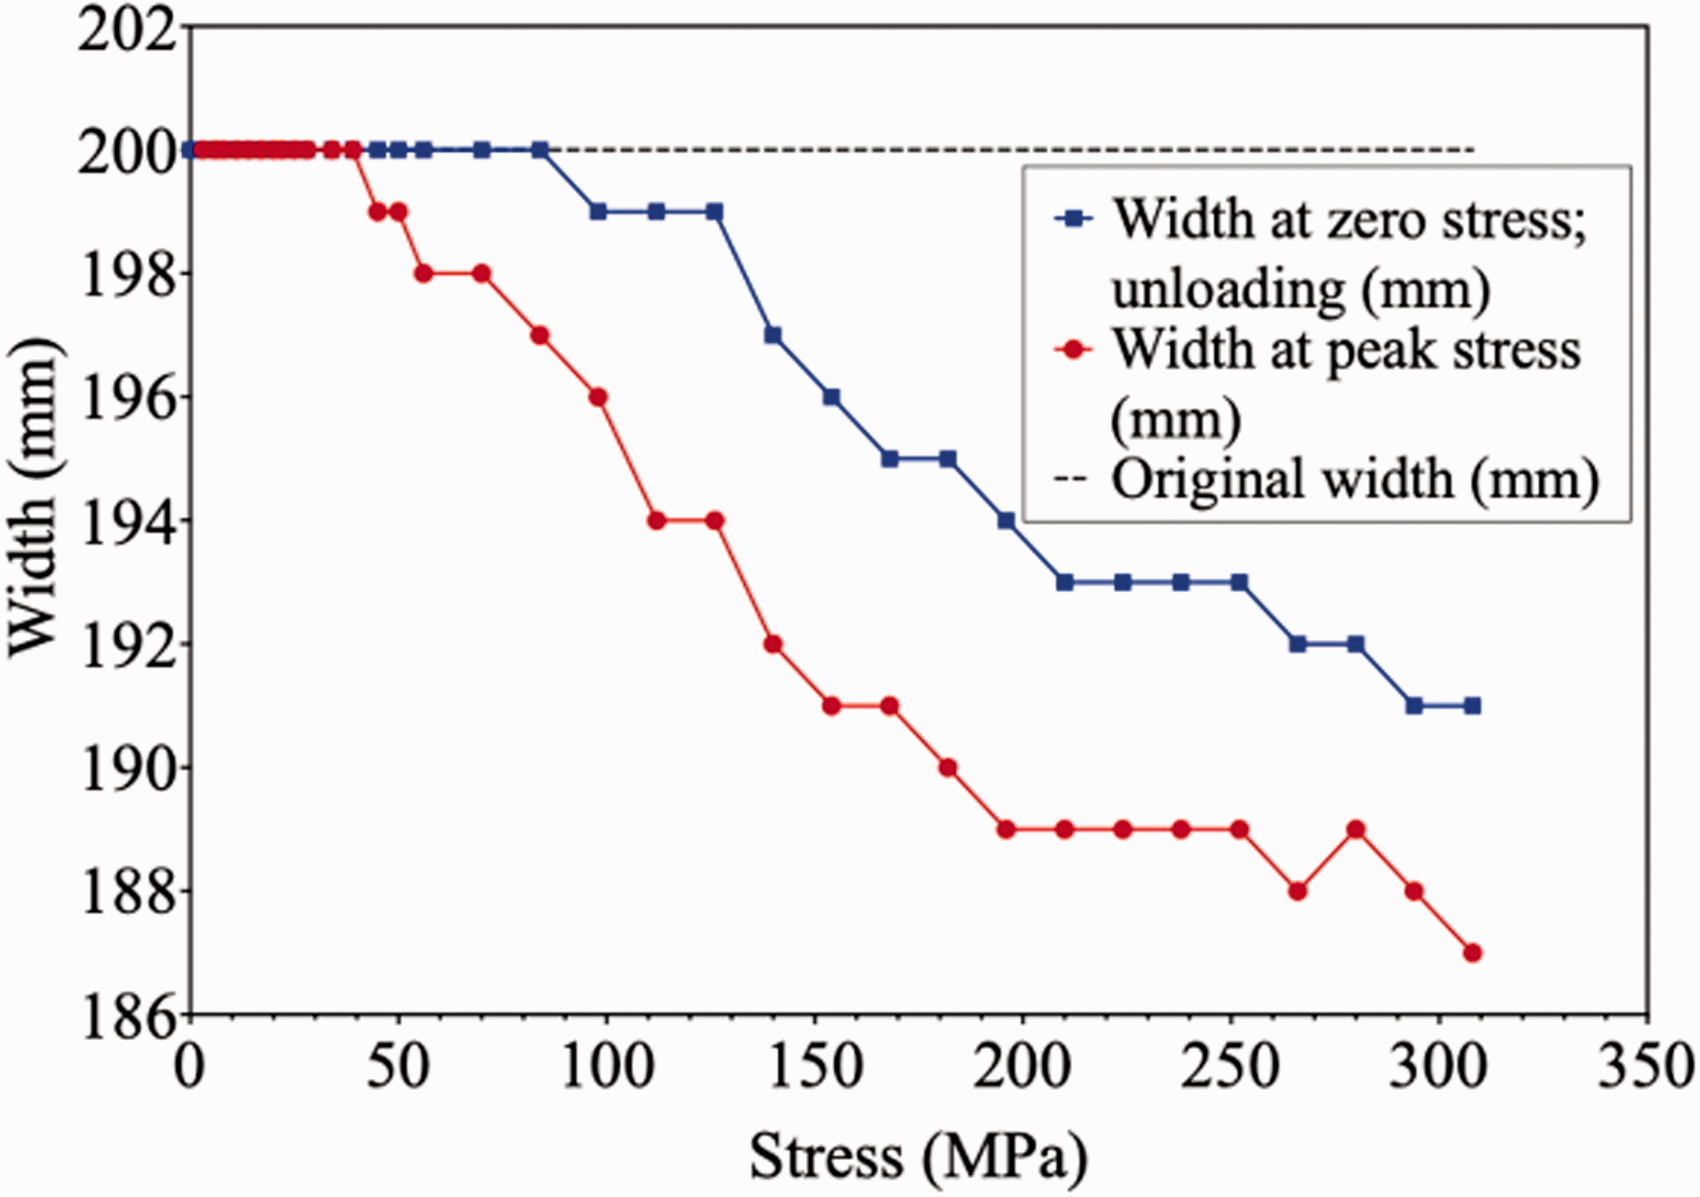
Example of the width decrease observed in wide aramid-fiber-reinforced polymer (AFRP) specimens.
In summary, for both the specimen thickness and width changes, the onset of permanent changes corresponded approximately to the transition from Region 1 to Region 2 in the stress–strain curve (Figure 3(a)). These thickness changes were investigated further using DIC, particularly with regard to the spatial distribution of the changes across the panels.
Spatial distribution of thickness changes
The measurements of specimen thickness and width described in the previous section were the average of three measurements. Using DIC, it was possible to observe the spatial distribution of both the thickness and strain changes.
In the vicinity of the grips themselves, the effects of using grips with a jaw width of 100 mm for panels that are 200 mm wide were investigated. Figure 7 shows the DIC axial strain contours for a wide specimen when under load to a stress of 75 MPa; the area that is affected by the non-uniform strain corresponds to a region of ∼50 mm from each corner of the specimen (indicated by the dashed yellow lines) where the longitudinal strains are significantly lower than in the rest of the specimen. This indicates that, for the bulk of the specimen, there is no effect of the grips.
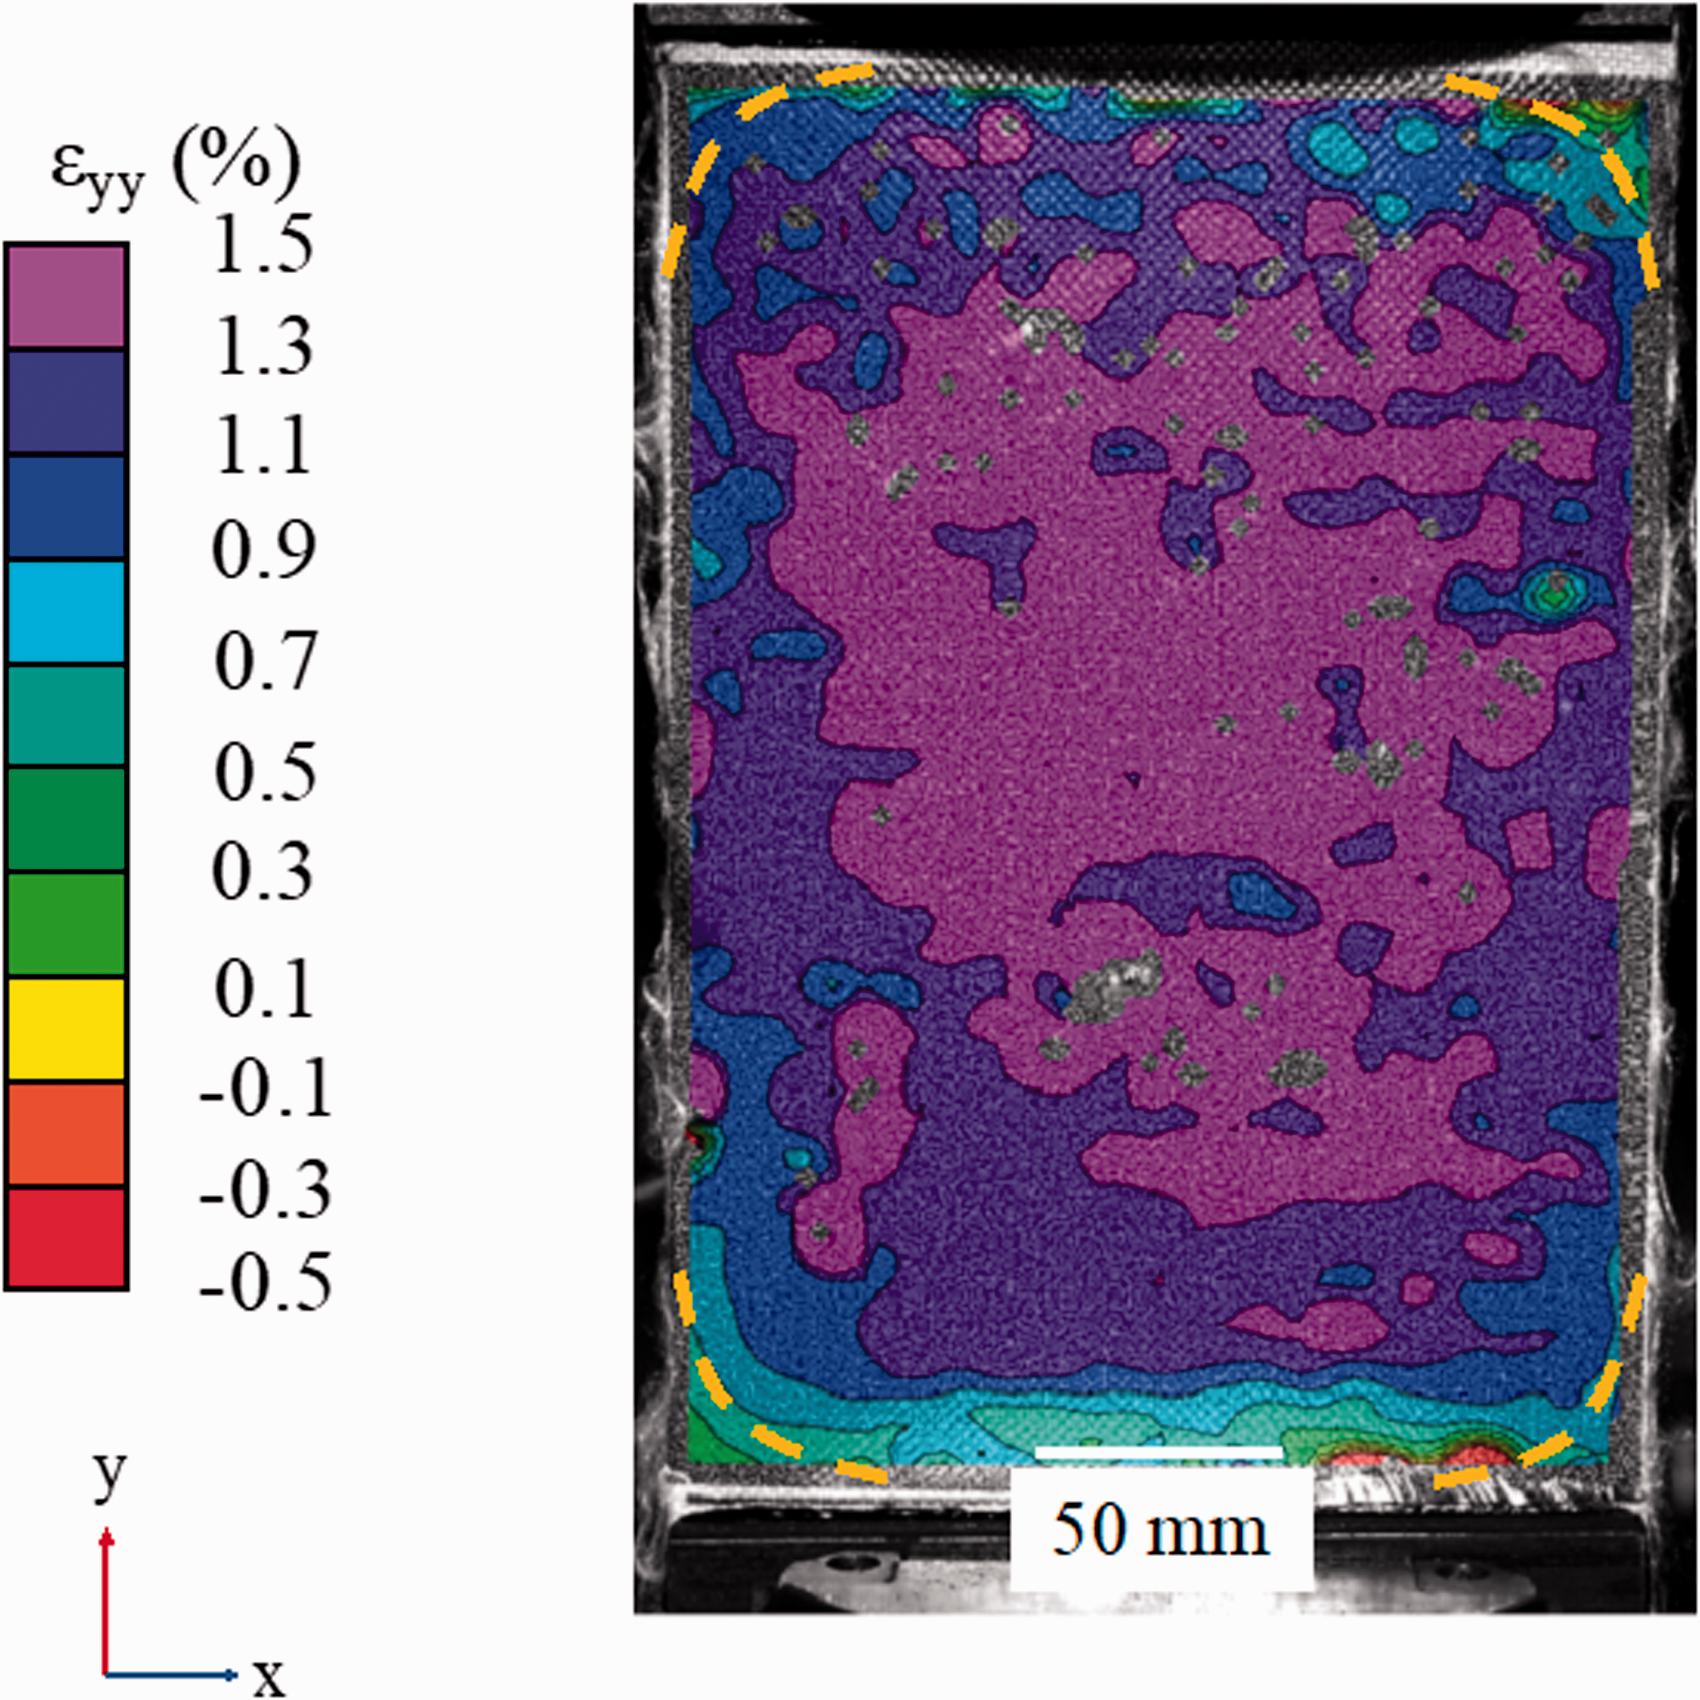
Digital image correlation (DIC) image of the εyy longitudinal strain contour at stress of 75 MPa.
The DIC technique enables the thickness changes to be observed for the whole specimen. Figure 8 shows the observed changes in the z-displacement (i.e., movement in the out-of-plane displacement, or w-values) during tensile loading. The changes in z-displacement are compared with values in a ‘zero’ reference image obtained of the entire specimen before the start of the test. The images in Figure 8 were obtained for stresses of 25 MPa (0.9% tensile strain; Region 1) and 200 MPa (2.9% tensile strain; Region 2). Positive w-values correspond to movement of the specimen out-of-plane, toward the camera, while negative w-values correspond to movement of the specimen away from the camera. The negative displacements at the panel edges are a consequence of the flattening of the slightly warped panel under load. For the low stress image (Figure 8(a)), in Region 1, there are only relatively small changes in out-of-plane displacement, and these are fairly uniform across the specimen. For the higher stress image (Figure 8(b)) in Region 2, large out-of-plane movements can be seen. There is some indication that these are not uniform across the thickness, appearing to show banding running from top to bottom of the specimen in the form of elongated islands running roughly vertically in the image. At 200 MPa, the largest out-of-plane movement measured using the DIC technique, allowing for the displacements due to the flattening of the panel under load (∼1 mm), is roughly half the value of the average measured thickness change measured for the specimens (Figure 5). The DIC measurements alone do not provide evidence of a uniform through-thickness increase in the thickness of the composite since the observed displacements could simply be a phenomenon related to the surface ply. However, when combined with the µCT evidence of through-thickness delamination presented in the next section (Figure 9), the DIC results are consistent with the general conclusion of increasing thickness of the specimens when loaded beyond ∼2% strain. The DIC results also show that the increased thickness is not uniformly distributed across the width and length of the specimens.
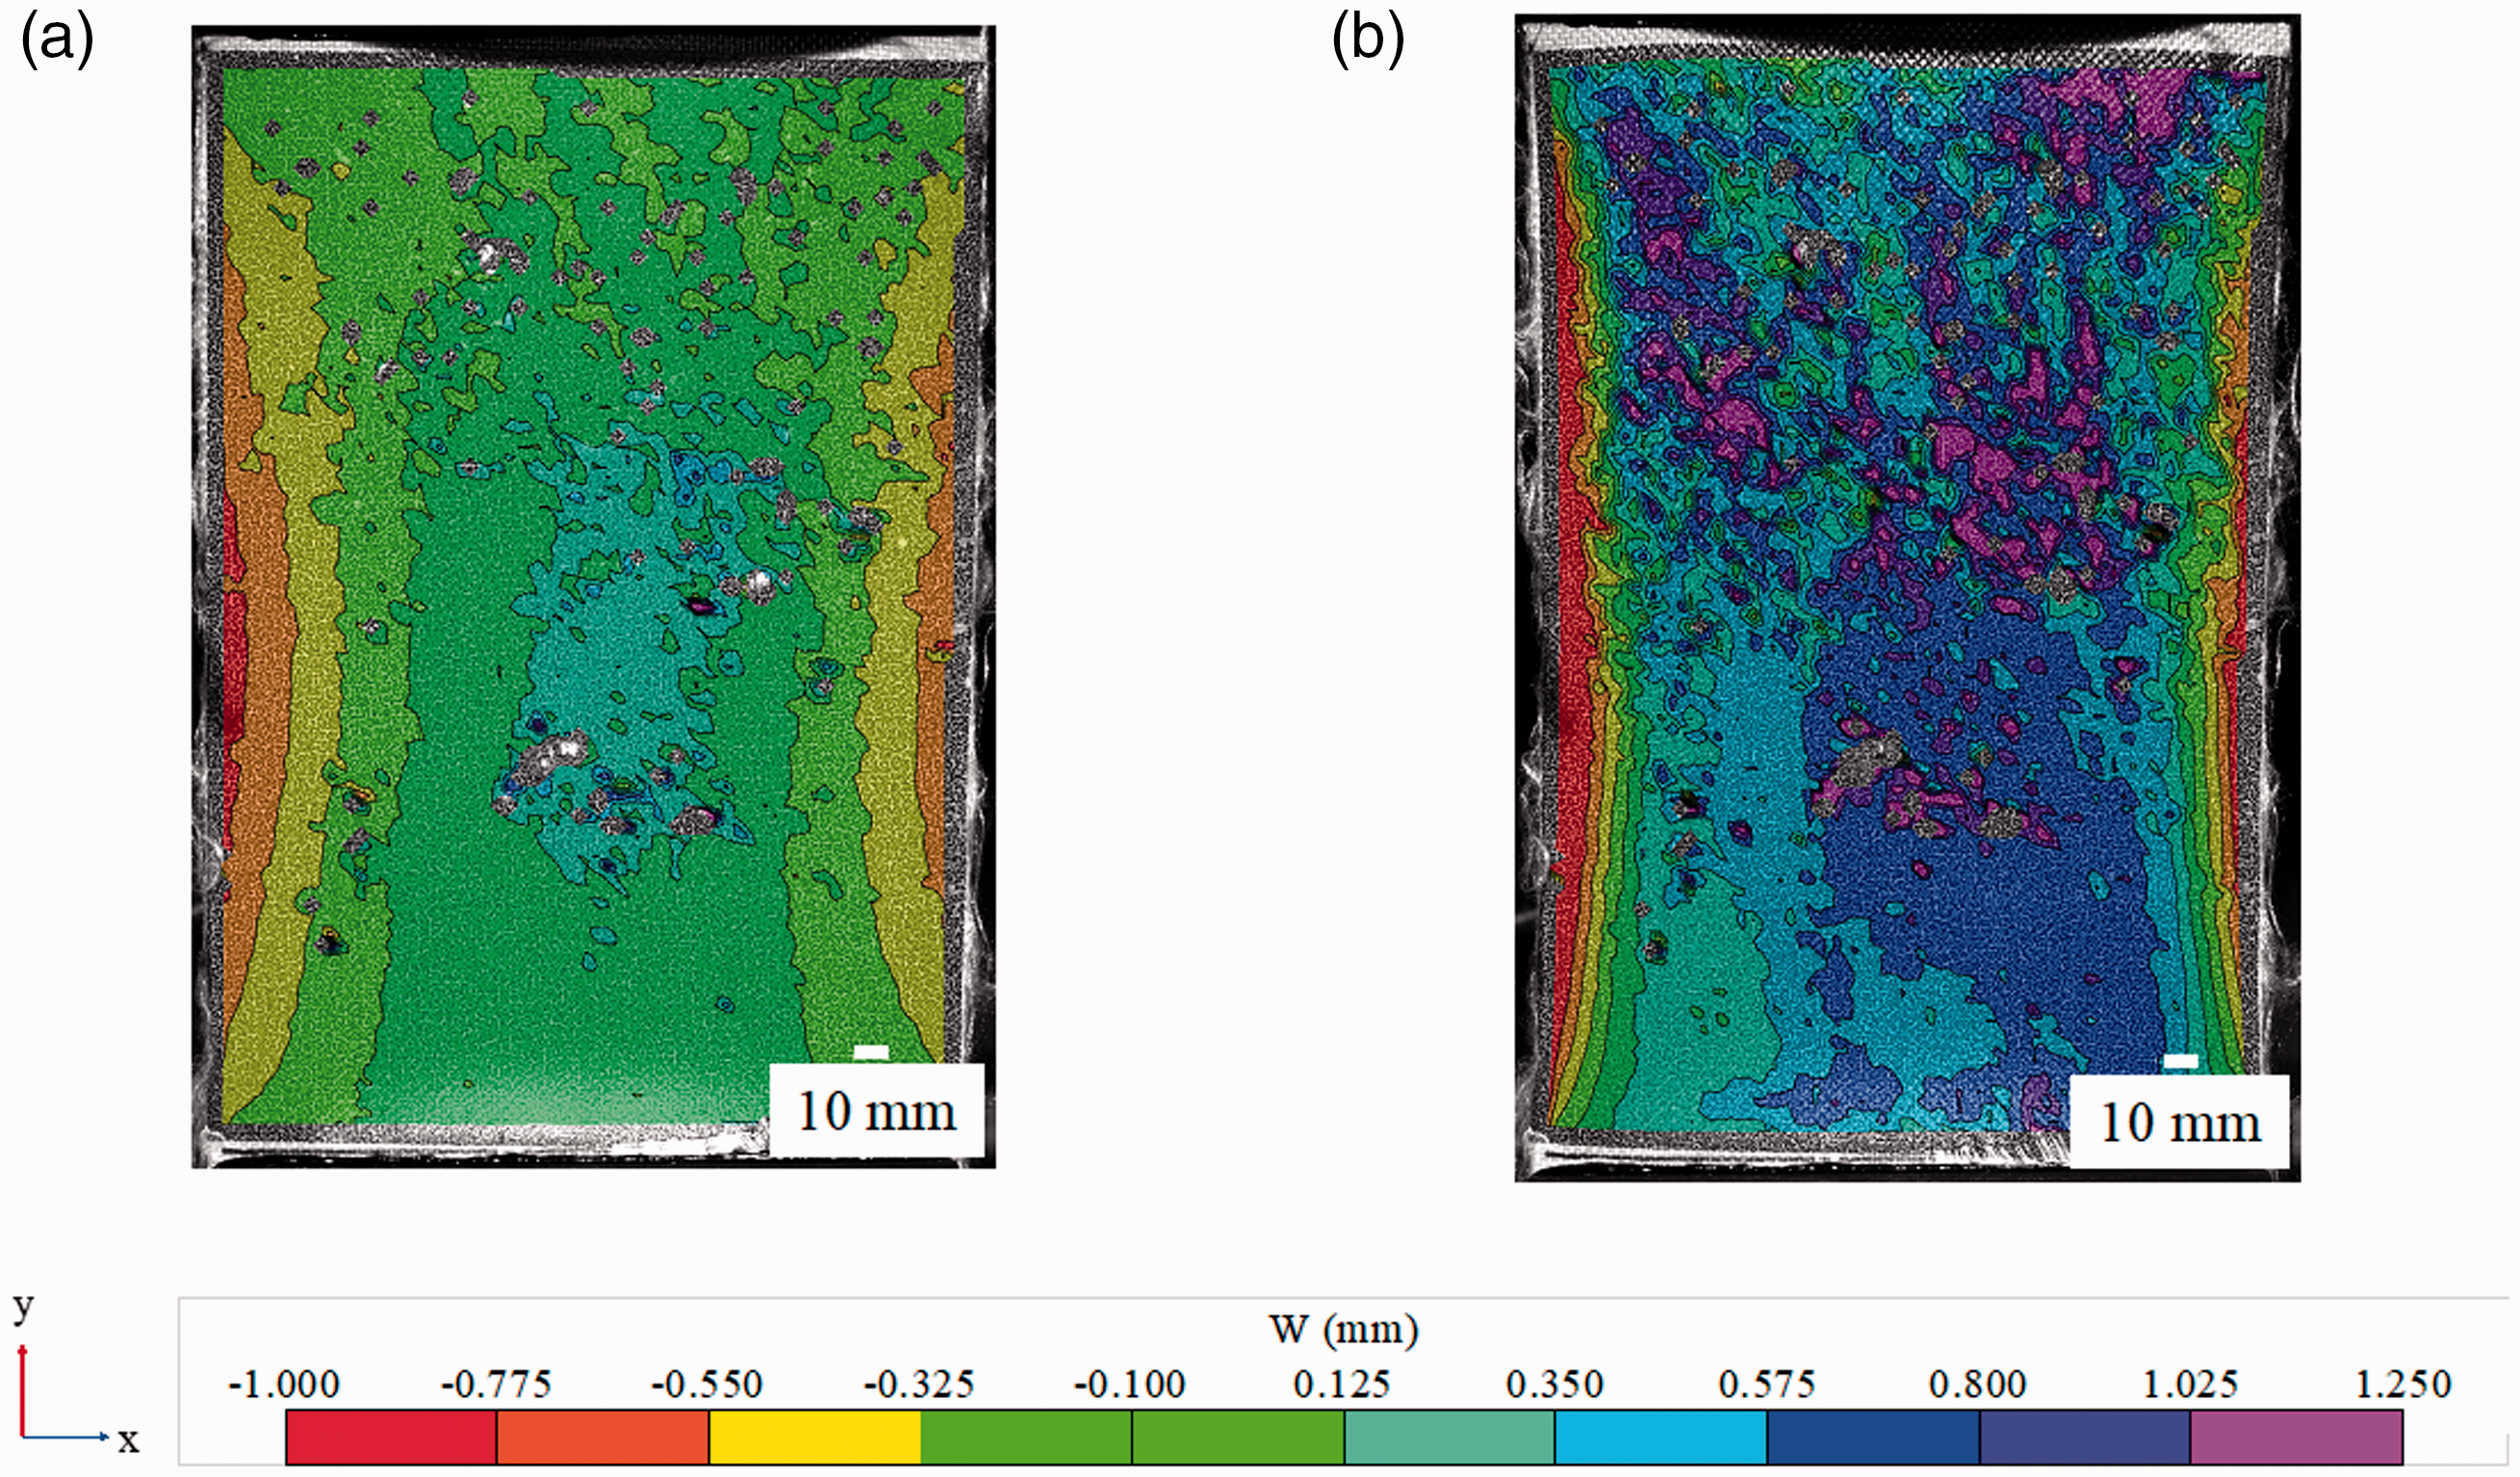
Digital image correlation (DIC) images of the change in z-displacement in a wide AFRP specimen at peak stresses of (a) 25 MPa and (b) 200 MPa.
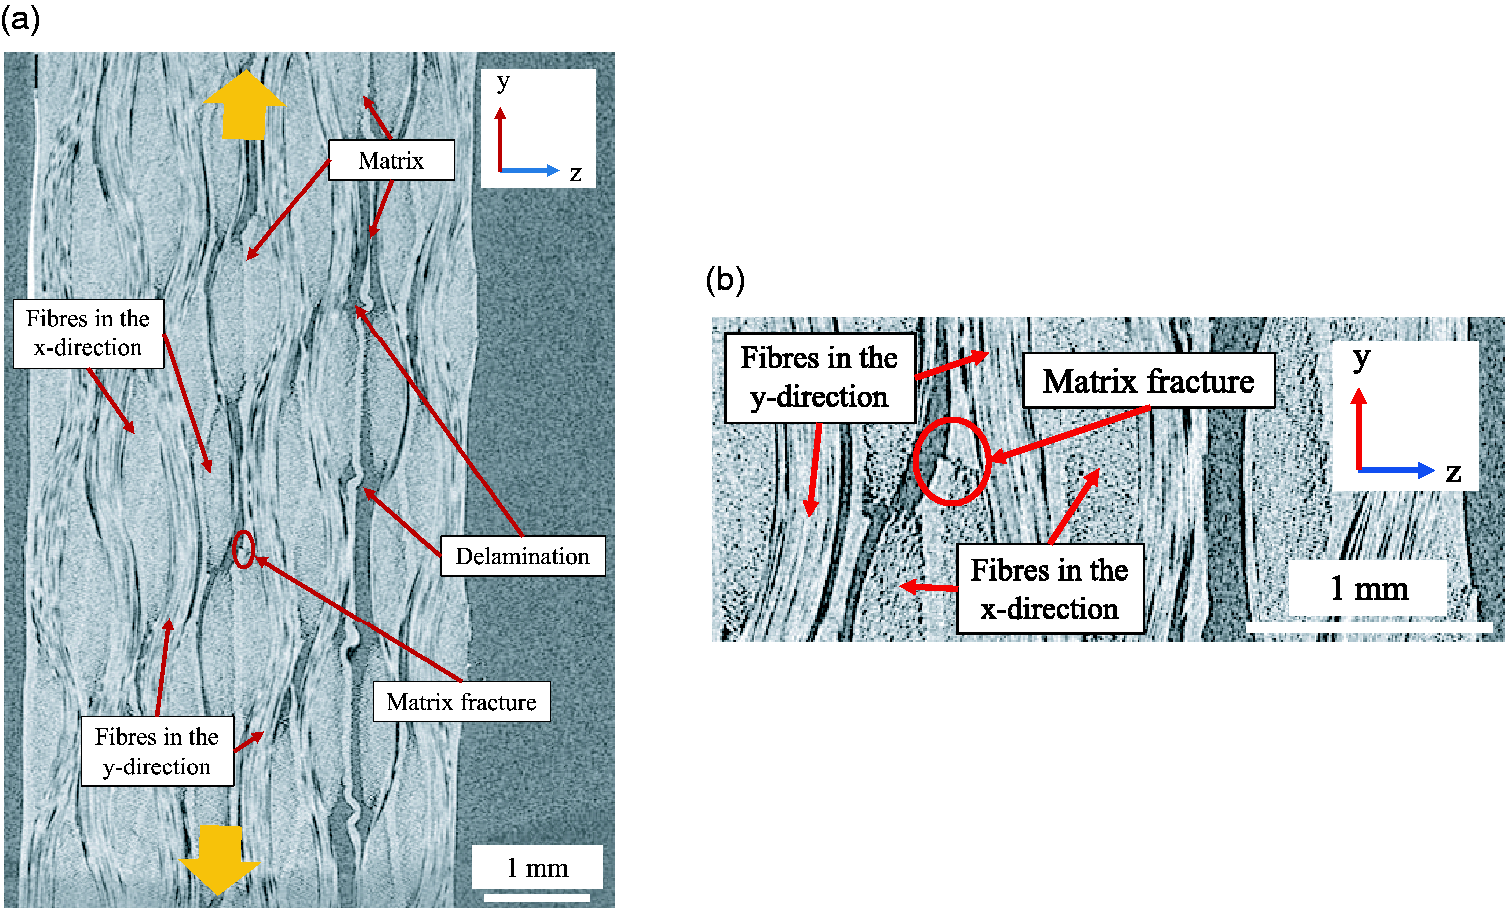
HMX µCT images in the y–z plane of (a) an AFRP specimen after loading (in the direction of the yellow arrows) to peak stress of 300 MPa and (b) a higher magnification of the matrix fracture found in (a).
µCT analysis of pre-damaged specimens
Micro-computed tomography (µCT) analysis was used to investigate the damage development in the composites under load and to try to understand, in particular, the changes in the thickness of the specimens. Figure 9(a) shows µCT sections of a narrow specimen in the y–z plane after tensile loading to 300 MPa, well into Region 2 (the loading direction is highlighted by the yellow arrows). It is clear from Figure 9(a) that the major cause of the increase in the measured thickness of the specimens is the development of delaminations at the ply interfaces. In addition, matrix fracture can also be detected, as shown in Figure 9(b). When viewed from the y-direction (i.e., viewing the x–z plane) of the same specimen (Figure 10(a)), it can be seen that the resin binding the plies together has delaminated. In many places, the imprint of fibers in the resin can also be seen (Figure 10(b)). The extent of the delaminations in the width shows that they can be up to 3 mm (Figure 10), extending 10 mm or more along the length of the specimen (Figure 9); consequently, it would not be surprising if such delamination occurring near the surface of the specimen appeared as elongated islands running vertically in the DIC images.
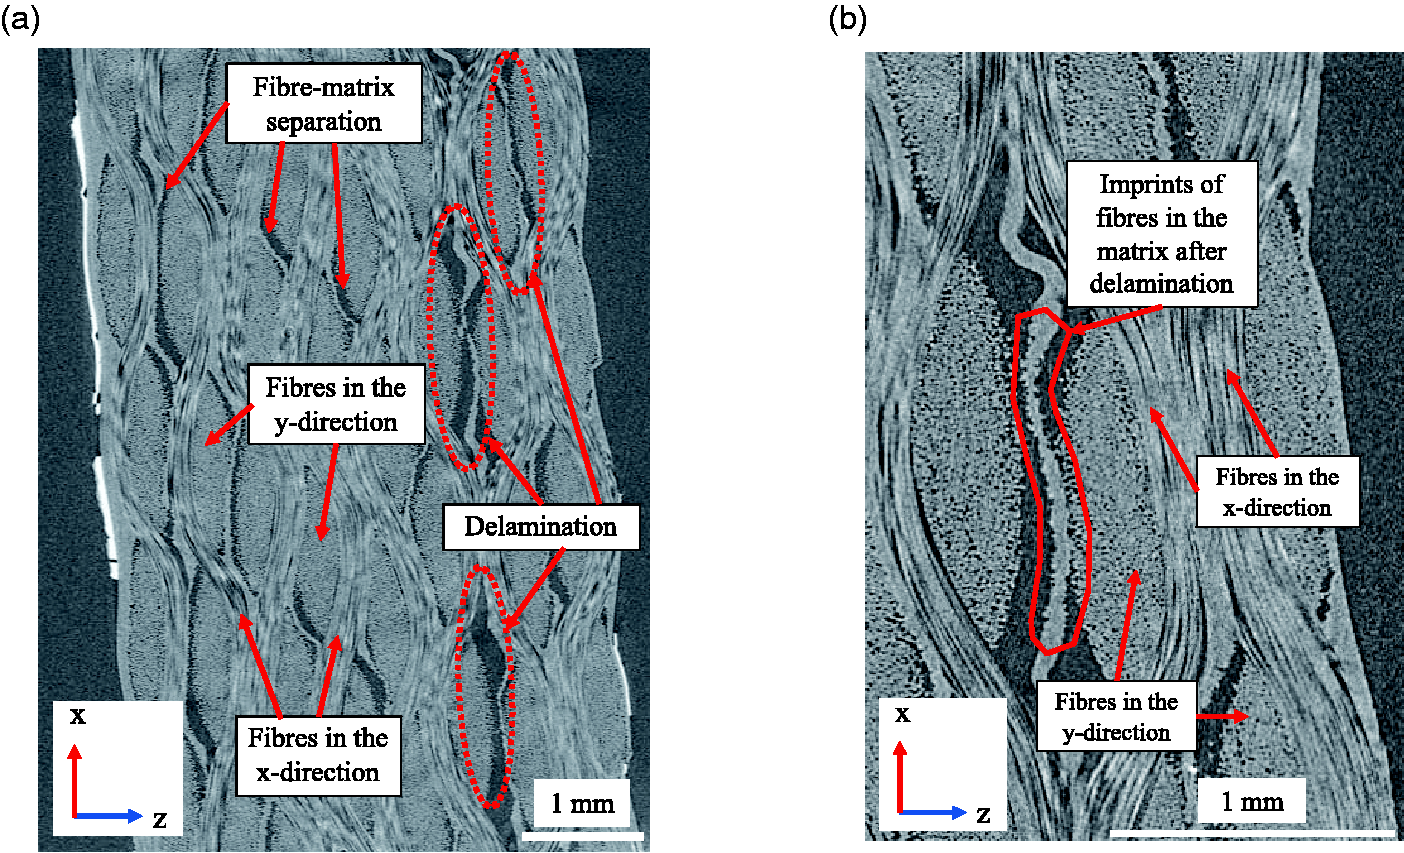
HMX µCT images in the x–z plane of (a) the specimen showing fiber-matrix separation and delaminations and (b) a higher magnification of the imprints of fibers in matrix found in (a).
Sub-micron CT was carried out at a higher resolution to attempt to identify any fiber fractures throughout the structure introduced during loading (prior to ballistic testing), but none were detected. It can be concluded that tensile loading introduced delaminations, fiber-matrix separation and matrix fracture throughout the resin-starved Kevlar/phenolic composite panels.
Ballistic testing of control and pre-damaged panels
The ballistic performance of control panels and pre-damaged panels (i.e., panels subjected to tensile loading to a maximum of 300 MPa or 3.4% tensile strain) was assessed using 1.1 g fragment simulating projectiles and the data was analyzed using Probit analysis. The raw data output gathered from the ballistic tests was binomial in nature. The output was recorded as either complete penetration or non-penetration of the specimen. The results corresponding to each projectile impact velocity were subsequently converted into binary values: 0 (non-penetrated) and 1 (completely penetrated) and analyzed using the software RStudio to compute a probability distribution based on a bias reduced generalized linear model. According to standard procedures, the Probit analysis model was used, using a 95% confidence interval (results of the regression analysis are shown in Figure 11). 25
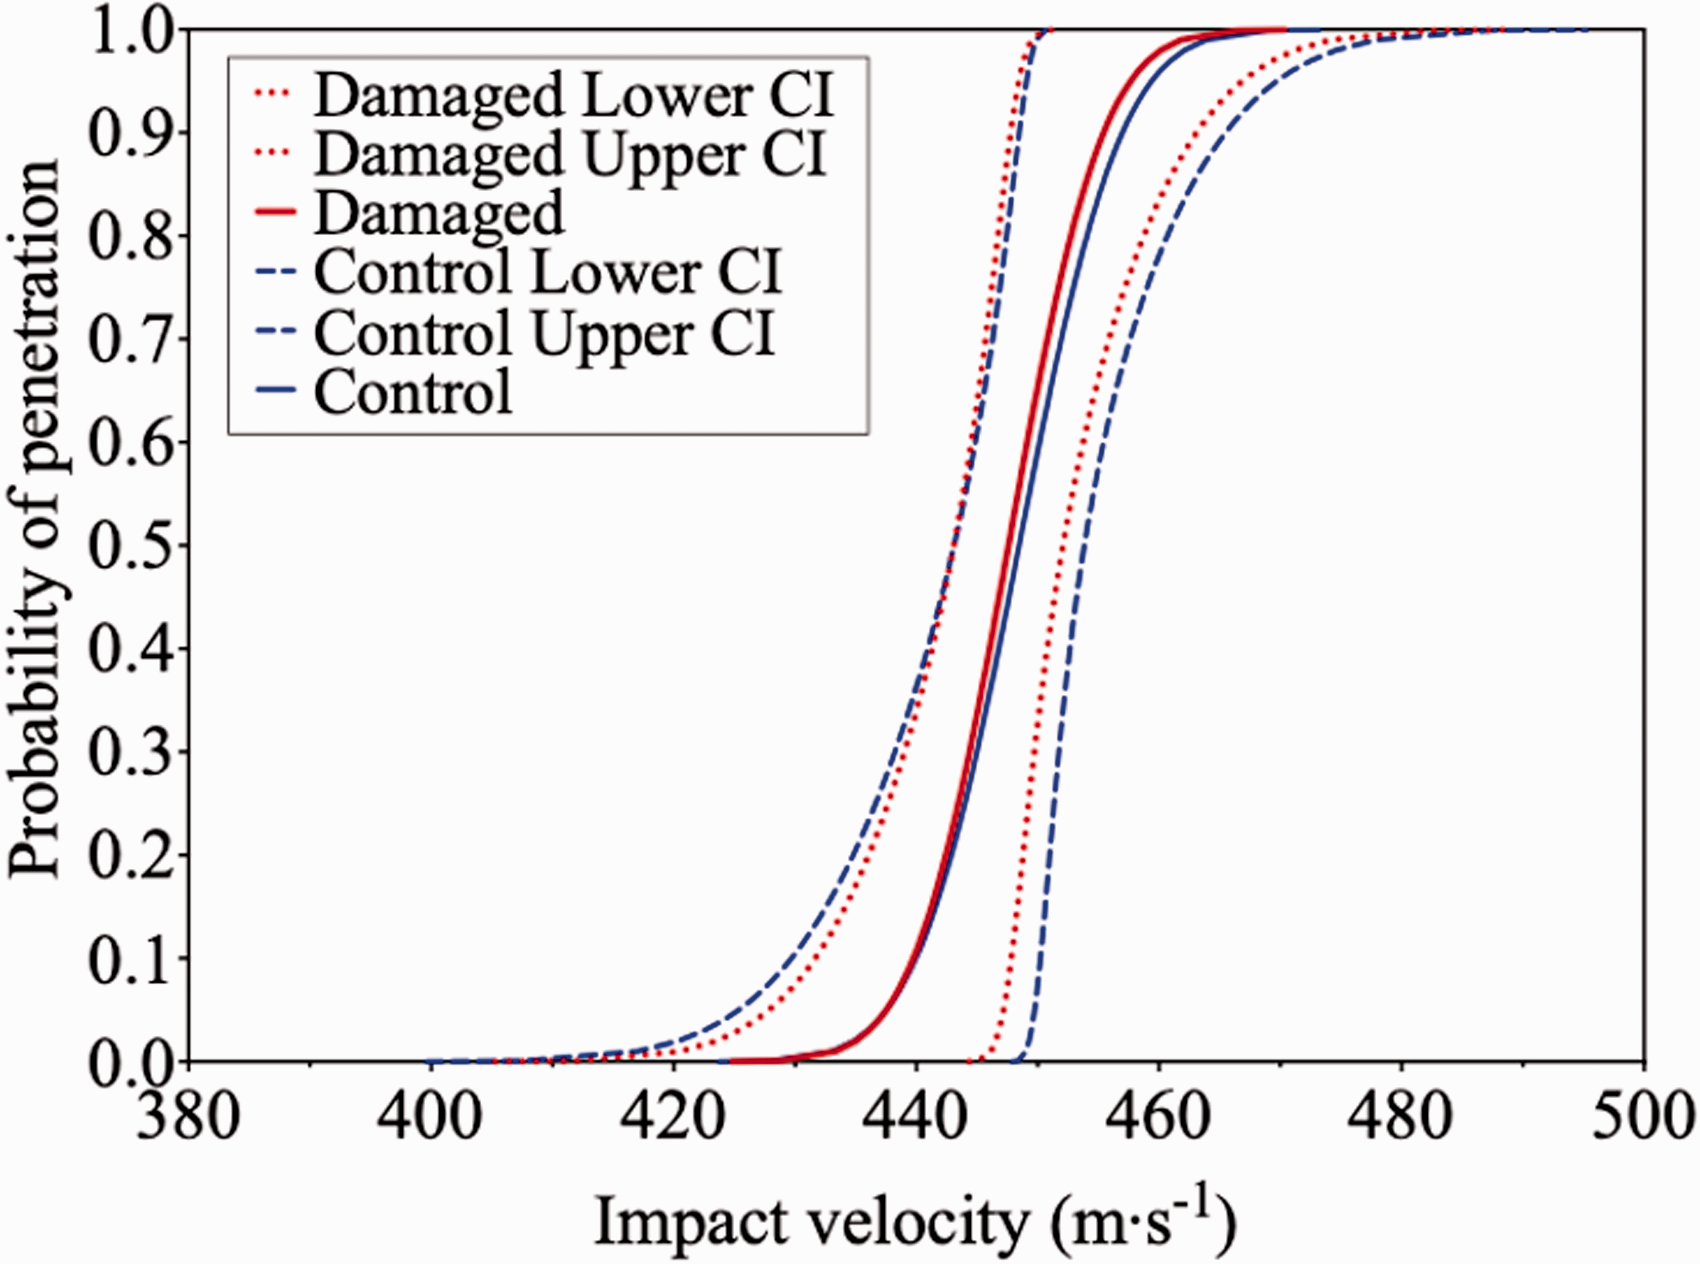
Regression model of both the control group (blue) and the pre-damaged group (red) of specimens, as calculated by Probit analysis, alongside the calculated 95% confidence intervals (CI).
The impact velocity at which there is a 50% probability of complete penetration of the sample (V50) and the corresponding standard error were calculated. The V50 was 448 m·s−1 (standard error 0.6%) for the control group and 448 m·s−1 (standard error 0.5%) for the pre-damaged group. These values did not indicate a difference in the ballistic performance of the two test groups. The p-values indicate whether any significant difference between the two sets of data could be detected. However, no statistically significant difference could be detected in the slopes of the curves, nor the location of the curves along the x-axis (p = 0.89 and 0.76, respectively).
To assess the overall residual deformation, post-ballistic impact DIC contour maps of the back face were analyzed to compare two panels (one control, one pre-damaged) that were not penetrated during ballistic testing. The two panels had been subjected to ballistic testing at the same projectile impact velocity of 439 m·s−1. In the DIC displacement contour maps (Figure 12), small areas around the point of impact show where the analysis program lost correlation because of the reflection from the lighting (i.e., no there are no colors). The zero value in each case was established as the furthest point away from the camera on the surface of each panel; all other values were displacements of the panels toward the camera.
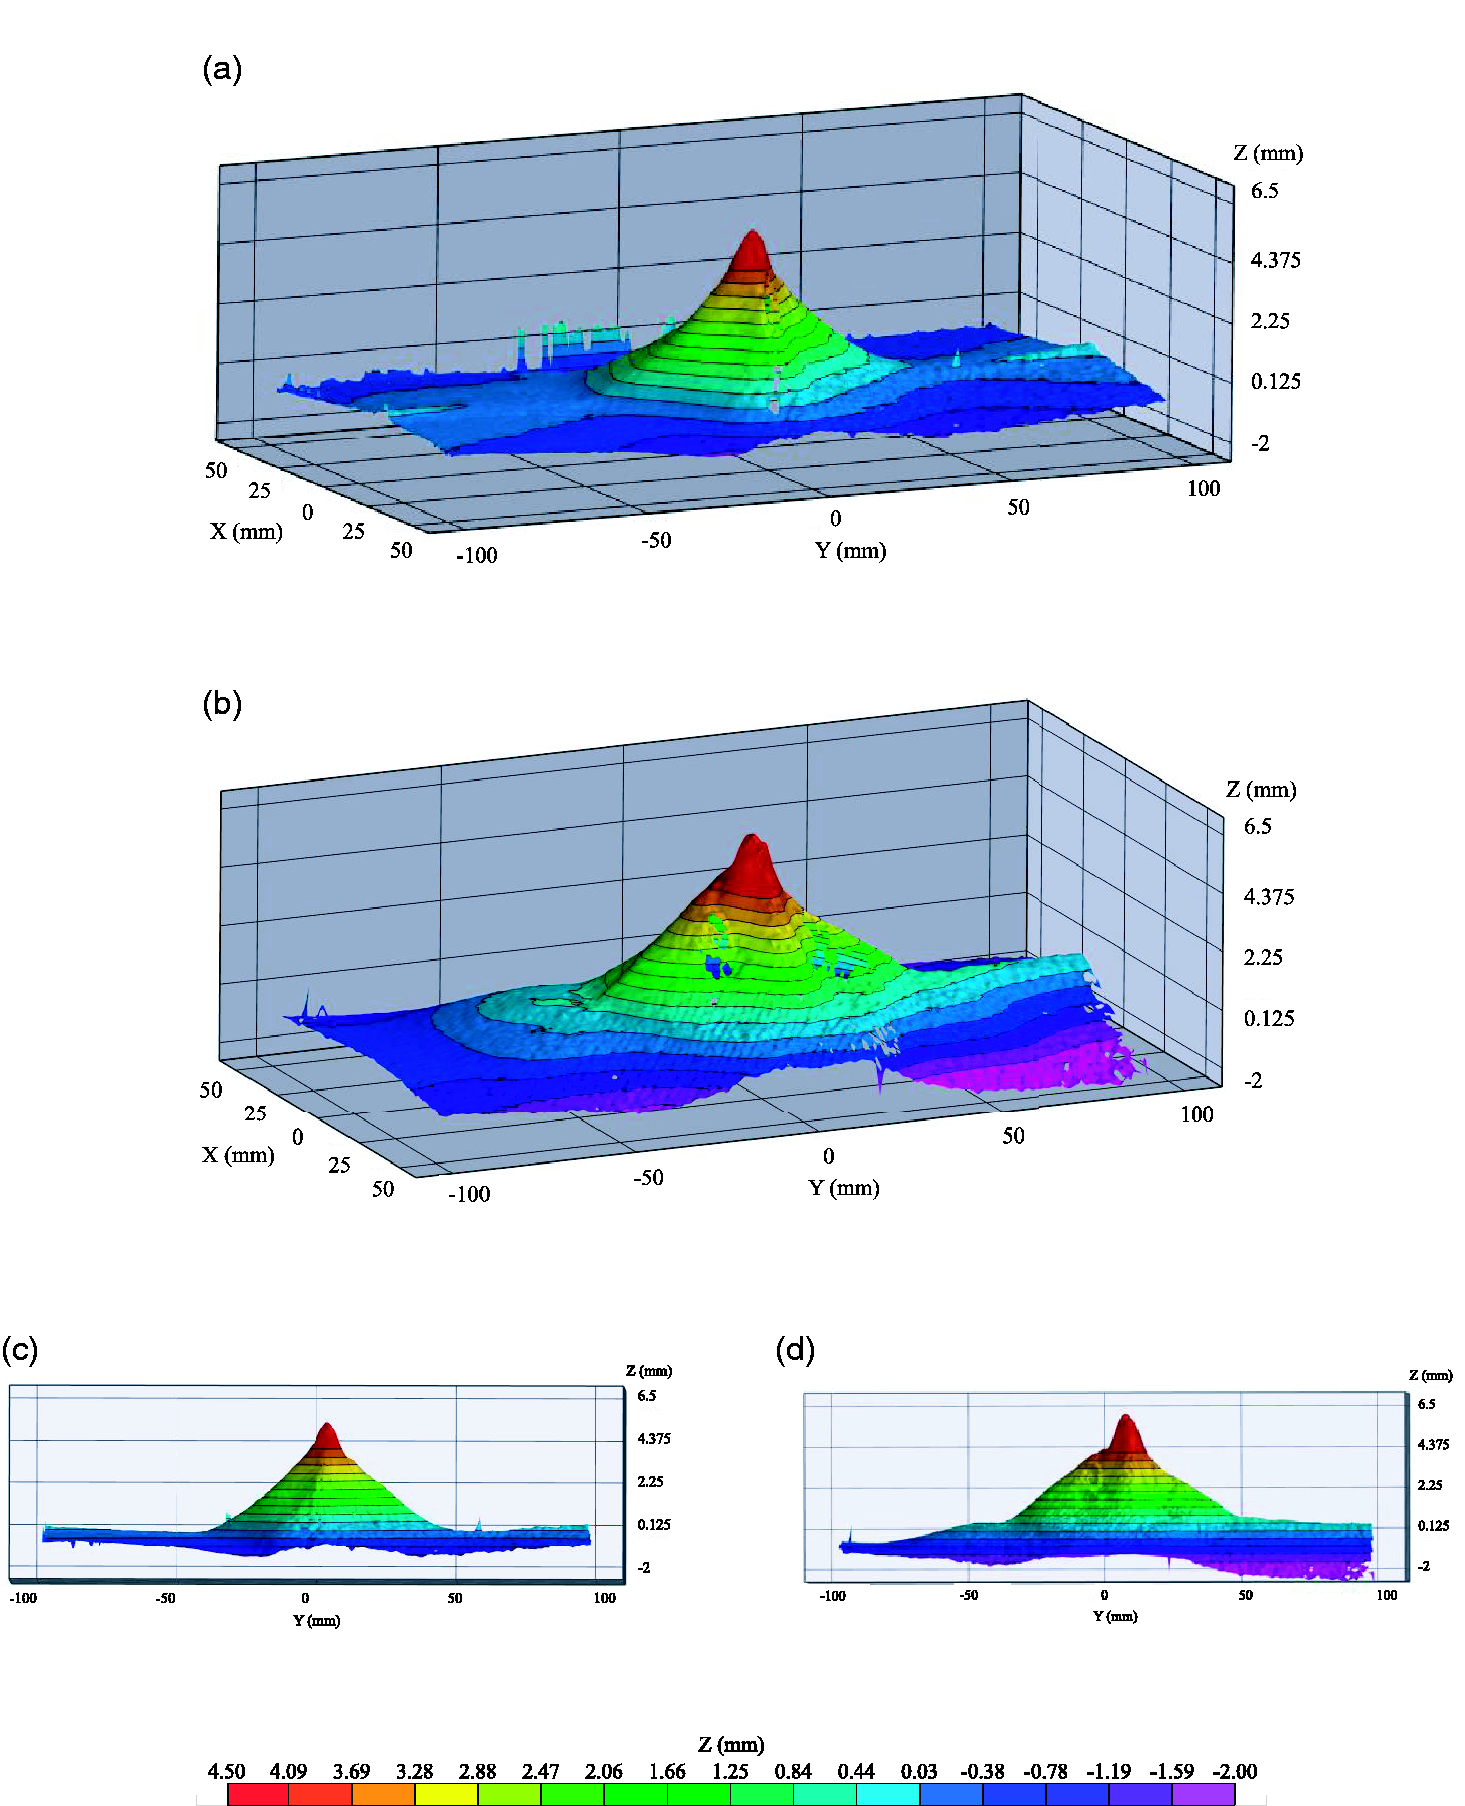
3D contour map reconstructions of the back face of (a) the control specimen and (b) the pre-damaged specimen, both subjected to an impact velocity of 439 m·s−1. (c) and (d) show the same data in 2D profile of (a) and (b), respectively.
Comparisons of the DIC images were carried out by quantifying the area of out-of-plane displacement larger than 4 mm (where any out-of-plane deformation greater than 4 mm has been defined, arbitrarily, as maximal deformation). The pre-damaged panel had almost double (i.e., ∼190%) the area of maximal deformation compared with the control. Figure 12(a) and (b) show the 3D contour maps of the panels and Figure 12(c) and (d) show 2D profile images of the same data used to estimate the difference in area. In addition, the pre-damaged panel showed not only a larger area of maximal damage, but also that the entire specimen had deformed to a greater extent out-of-plane. As indicated in Carr et al., 29 back-face deformation from non-perforating ballistic impact can cause injury to users. Consequently, while there was no identifiable difference in the ballistic V50 values between the control and pre-damaged panels, the result that there is a larger global back-face deformation exhibited by the pre-damaged panels highlights the importance of other armor performance factors in addition to considering ballistic performance.
Concluding remarks
Eight-layer Kevlar phenolic resin-starved composite specimens, with (0/90)8 architecture, were manufactured as narrow coupons and as large panels. The stress–strain behavior of the resin-starved composites has been shown to consist of two Regions. Region 1 has a low Young’s modulus of ∼4 GPa where the origin of the modulus arises from a combination of the low-volume fraction phenolic matrix and a contribution from the resin-impregnated sheath of fibers that surrounds the axial tows. A transition to Region 2 occurs at ∼2% strain, which is the failure strain of the phenolic resin; at this strain, matrix fracture occurs together with the onset of significant delamination. The Young’s modulus in Region 2 is considerably higher than in Region 1 due to the extension of the axial fiber tows; a modulus of ∼30 GPa was measured prior to failure. The consequence of the delaminations is that the average thickness of the specimens increases. The observed small width decrease in Region 2 is possibly related to movement of y-direction tows past each other during loading (enabled by the delaminations), a movement which is not fully reversed on unloading due to friction between the tows.
Panels loaded well into Region 2, so that controlled damage had been introduced, were subjected to ballistic testing, for comparison with control (pristine) panels. Statistically, no difference was found for the V50 ballistic limits of the control group and the pre-damaged group of panels. However, post-ballistic test analysis showed considerable differences in the out-of-plane deformations of the panels. The pre-damaged group showed double the area of maximal deformation compared with the control group, in addition to a larger global out-of-plane deformation. Further testing on panels with a larger number of plies (e.g., 24, 32 plies) and with damage introduced in different ways (e.g., under multiaxial loading) are both required to assess the extent to which these results are applicable to protective composite armor systems.
Footnotes
Acknowledgments
The authors would like to thank Mr A Moran (NP Aerospace: Coventry, UK), Mr W Cook (DuPont, Individual Fighting Systems: Ipswich, UK) and Dr L Boogh (DuPont: Geneva, Switzerland) for their support and technical advice with regards to materials and manufacturing procedure, Dr F Gommer (Imperial College) for assistance with manufacture of the resin-starved panels, and Mr P Haynes and Dr SJC Matthews (University of Surrey) for assistance with the experiments. The authors acknowledge the µ-VIS center at the University of Southampton for provision of tomographic imaging facilities, supported by EPSRC grant EP/H01506X.
Dstl © Crown copyright 2020. Published with the permission of the Defence Science and Technology Laboratory on behalf of the Controller of HMSO.
Declaration of conflicting interests
The author(s) declared no potential conflicts of interest with respect to the research, authorship, and/or publication of this article.
Funding
The author(s) disclosed receipt of the following financial support for the research, authorship, and/or publication of this article: This research is supported by the EPSRC (award number EP/G037388), Dstl and the University of Surrey (MiNMaT).