
Abstract
Quantitative methods (QM) are characterised as ‘hard to teach’ and often marginalised in undergraduate Sociology curricula particularly in the UK, due to many factors, including students’ attitudes towards numbers. This can lead QM to be viewed by students as not mainstream Sociology. This article argues that QM can support Sociology graduate futures due to clear transferable skills. But QM must be taught in a way that does not ‘trigger’ students’ negative dispositions towards the subject. This article, using the example of a large introductory undergraduate QM module, outlines a pedagogic approach that addresses students’ attitudes to QM, while building learner confidence. Key elements of this approach to QM include storytelling, relevance, support and value. This article ends with a discussion of the efficacy of this framework based on a two-year evaluation.
Keywords
Introduction
The demand for data skills in the UK, across all sectors, has surged in the past decade (POST, 2023): a 2021 survey of 1045 UK-based businesses found 48% were recruiting roles requiring data skills. Recent reports (e.g. Gov.UK, 2021; POST, 2023) identify a significant data skills gap in the UK: 49% of employers reported gaps particularly in ‘specialist data skills’ (POST, 2023). ‘Data skills’ are a broad category (see POST, 2023; The Royal Society, 2019), but too often the focus, within government policy making and the education sector, is on STEM (science–technology–engineering–maths) subjects as the domain of these skills (British Academy, 2015, 2022; The Royal Society, 2019). However, ‘specialist data skills’ (POST, 2023) includes statistical skills, data modelling and analysis: quantitative methods (QM) in Sociology. Furthermore, 32% of employers reported (POST, 2023) shortages in ‘non-technical’ skills: data literacy, AI literacy and understanding ethical issues related to data and AI. Clearly, as the British Academy (2015, 2022) highlight, Sociology (and Social Sciences generally) have a role to play in closing the national data skills gap, particularly as QM remain part of Sociology’s core undergraduate curricula (Williams et al., 2015). This article argues that QM provide clear transferable skills and have a crucial role in enhancing the employability of Sociology students, in a jobs market that demands both ‘technical’ and ‘non-technical’ data skills (POST, 2023). Sociology students are more likely to be female, from an ethnic minority and/or lower socio-economic background (Cant et al., 2019; HESA, 2024), thereby potentially facing greater structural inequalities in the graduate labour market than others (Bleazby, 2015): supporting their employability matters. However, Sociology students, particularly in the UK, can find QM hard to learn (see Williams et al., 2008, 2015); this article discusses why, outlining how module design must address the barriers to learning that students have, noting that Sociology students learn best when quantitative skills are embedded within their discipline. Through this approach, we argue, Sociology students can enhance their graduate futures.
Quantitative Methods and Sociology – Hard to Reach/Hard to Teach
Numerous studies (e.g. Bullock et al., 2014; Falkingham and McGowan, 2011; MacInnes, 2010; Murtonen, 2005; Murtonen and Lehtinen, 2003; Payne and Williams, 2011; Williams et al., 2008, 2015), identify QM in Sociology as hard to teach, often due to students’ ambivalent or negative attitudes. These attitudes are shaped by their 12–13 years of prior educational experiences, which influence their approach to university study. However, university course designs generally often overlook this educational ‘baggage’ (Scott Jones and Cain, 2025). Addressing Sociology students’ negative attitudes towards QM, within module design and delivery is essential. Five factors shape British Sociology students’ attitudes to QM.
Negative Attitudes to Numbers
QM involve working with numbers, specifically statistics. Sociology students’ negative attitudes towards statistics are shaped by their prior experiences with maths, often leading to ‘maths anxiety’ (Bullock et al., 2014; Onwuegbuzie and Wilson, 2003). This term describes a heightened emotional response to numbers, characterised by a presumption of failure, self-identifying as ‘bad at maths’, and avoiding numerical work. Although statistics is not the same as maths, students often conflate the two, with school maths experiences, according to Scott Jones and Goldring (2014), being a key factor in ‘maths anxiety’. Attitudes towards maths emerge early, with children as young as five categorising themselves and peers as either ‘maths people’ or not, usually along gender lines (Massey, 2023). Structural issues in UK maths education, such as an overcrowded curriculum, lack of specialist teachers and low-quality teaching (Marshall et al., 2016; Scarpello, 2007; Vorderman et al., 2011) contribute to this. Compulsory maths ends at 16, creating a two-year ‘maths gap’ for most Sociology students before university (Scott Jones and Goldring, 2014). Additionally, there is a broader cultural acceptance in Britain of ‘being bad at maths’ (Kalder and Lesik, 2011; National Numeracy, 2016).
Post-16 Subject Choices
Most Sociology students in the UK choose Humanities and Social Science A-levels, or equivalent post-16 qualifications, often to avoid STEM subjects (see Bullock et al., 2014; Williams et al., 2008). This trend is driven by the overrepresentation of female students, whose STEM/non-STEM identities are formed early in their education (MacDonald, 2014; Snow, 1959). Sociology students’ post-16 subject choices emphasise narrative and critique, leading them to presume, as Cant et al. (2019) note, that quantitative skills are not part of their discipline.
A-level Sociology
Sociology is a top 10 A-level choice in England and Wales; a key pipeline into university Sociology in those nations of the UK (Cant et al., 2019; Williams et al., 2008). The Qualifications and Curriculum Authority provides a national framework of what must be covered, but it is not proscriptive. The Assessment and Qualifications Alliance (AQA) is one of three competing exam boards that offer Sociology A-level. However, it is the largest and therefore most influential and is a key shaper, as Cant et al. (2019) note, of student attitudes to the subject. AQA’s specification (AQA, 2025) embeds research methods ‘in context’ of substantive topics (including family, crime, education). This is a direct attempt to link theory to research, which is laudable as too often they are treated as separate entities, making it difficult for students to see the connection between the two (Payne and Williams, 2011). However, the A-level is assessed solely by written exams, with no opportunity for students to actively apply research methods. The assessment of quantitative methods (AQA, 2025) involves tasks like interpreting graphs and evaluating official statistics. A survey of A-level teachers (Cant and Chatterjee, 2022) found that research methods are the most disliked topic to teach; they deemed the AQA curriculum ‘dated’ and too focused on critique over other skills that students might value. QM are often mischaracterised as ‘positivist’ (Payne, 2014) shaping students’ perceptions and reinforcing what is central to the discipline at A-level.
Quantitative Methods Positionality in Sociology
QM are recognised as a core part of Sociology’s research methods; central to undergraduate curricula according to the UK’s national Sociology subject benchmark statements (QAA, 2019). However, benchmarks do not specify how much time, or depth should be devoted to QM. Payne (2014) notes that UK Sociology predominantly uses qualitative methods. The shift away from empiricism and towards reflexivity has further complicated QM’s role in the discipline. Numerous reports have acknowledged the impact of this on QM within Sociology (e.g. Economic and Social Research Council, Heads and Professors of Sociology, British Sociological Association, 2010; MacInnes, 2010; Mills et al., 2006; Parker et al., 2008) highlighting issues such as reduced curriculum content and time for QM, a shortage of QM specialists outside of Russell Group universities and the concentration of QM research and training in a relatively small pool of universities. Consequently, Sociology students may enter university with stereotypical views of QM from A-level, which are reinforced by their degree programmes.
Delivery and Content of QM Modules
Most Sociology programmes teach research methods through compulsory modules in the first two years of study, which can be unpopular as students can feel ‘forced’ to take them (Murtonen, 2005). This conflicts with the UK’s focus on students as ‘consumers’ with choices. QM’s position in Sociology and shortage of QM specialists, in many departments, means that often QM are taught within larger methods modules (Scott Jones and Goldring, 2015) meaning that they can be squeezed for space and time amid a ‘crowded’ curriculum. This means that students either have only a superficial grasp of QM or are rushed through content without, what MacInnes (2010) identifies as essential time for practice in order to develop learning. Even standalone QM modules face curriculum crowding, as they try to cover ‘everything’ (Scott Jones and Goldring, 2017). Additionally, students may fail to see the relevance of QM (as one of our students put it, ‘what’s the fucking point of this?’) within their Sociology programme; Scott Jones and Goldring (2015) and Williams et al. (2008) note that this can be exacerbated by the lack of QM methods, conceptual language or statistics being used within students’ other modules.
Negative or ambivalent student attitudes establish QM as ‘troublesome knowledge’ (Meyer and Land, 2005), creating a key barrier to learning. In the metric-driven environment of UK higher education, research methods and standalone QM modules are often cut to maximise metrics like student satisfaction and progression. However, with a pedagogic approach that addresses student attitudes, QM can be effectively taught; and improve various student metrics, including Graduate Outcomes, which are crucial in the public discourse on Sociology as a ‘value’ degree.
Sociology Graduate Futures
Debates about the value of a degree have intensified, especially after the Office for Students (2022) announced numerical thresholds for continuation, completion and positive graduate destinations to address ‘poor quality courses’. Concerns about ‘social congestion’ (Brown, 2013: 6) due to the high number of graduates competing for limited jobs (Tholen and Brown, 2017; Wright and Wei, 2022) have also grown. Sociology, as a non-vocational subject, is often included in debates about ‘low value’ degrees, implying it does not provide ‘value for money’ and leads to higher graduate job market uncertainty (Bradley and Waller, 2018). The Graduate Outcomes survey shows 89% of UK graduates are in work or further study 15 months after graduation, compared with 67% of Sociology graduates (HESA, 2024). Sociology graduates may take longer to enter graduate careers (Bradley and Waller, 2018) than the 15 months survey point. These debates affect perceptions of key stakeholders, including prospective students (and their parents), university leaders and employers. Employers may question the value of recruiting Sociology graduates compared with STEM graduates, and students may have similar concerns, impacting their confidence to apply for jobs, affecting future career trajectories.
As noted previously there is a growing demand (POST, 2023) for graduates with data skills, across all sectors, as businesses become increasingly data-driven. Despite concerns about graduate oversupply, the Government report that the data sector faces an undersupply of graduates; the most common role being entry-level data analysts, which require skills in descriptive statistics and visualisation (Gov.UK, 2021). Crucially the data industry is looking to recruit data-literate Social Science graduates who have the narrative, critical and social-contextualising skills that STEM graduates may lack. Research methods, particularly QM, provide Sociology students with transferable skills, such as data literacy and translation, meeting this demand (Scott Jones and Cain, 2025). And as Scott Jones and Cain (2025) note, getting the foundations right creates a clear platform for further learning of more advanced statistical techniques. This is not to suggest that QM are the panacea to Sociology’s woes in the contemporary HE sector, but rather they can be seen as something to further support our students within the complex structural inequalities they inhabit.
Sociology students are more likely to be from diverse and disadvantaged backgrounds; institutional reputation is a form of capital (Raffe and Croxford, 2013). Attending elite universities offers a head-start in graduate careers irrespective of discipline (Bradley and Waller, 2018; Souto-Otero and Białowolski, 2021); for example, Graduate Outcomes survey scores (80%) for Sociology graduates from the elite Russell Group of universities are close to the UK average for all graduates (HESA, 2024). Students at modern universities are more exposed to ‘low value’ degree narratives (Pham et al., 2024; Smith and Smith, 2024; Tomlinson, 2008). These students are more likely to be from lower socio-economic backgrounds and ethnically diverse (Bathmaker et al., 2016; Rafferty, 2012; Social Mobility Commission, 2023), adding precarity to their career trajectories. When students from a typically under-represented group study a subject like Sociology, at a less selective university, it is crucial that their programme of study includes content that will help them to stand out to an employer in the graduate job market. This is, of course, an over-simplification of a much bigger issue, and may ultimately do little to reduce the structural inequalities that exist in the labour market (Tholen and Brown, 2017; Tomlinson, 2008, 2017; Wilton, 2011). However, the very real issue of oversupply of graduates in the labour market, coupled with the narrative that graduates will have better life chances because of higher education, means that the need to ‘stand out’ in the graduate labour market has grown in importance. This concept of ‘positional advantage’ (Brown et al., 2004: 5) is therefore not simply about the skills and experience the graduate has developed, but how these credentials fare when compared with those of other graduates competing for the same jobs. Students at our university are more likely to be groups typically under-represented in higher education. Among growing concerns about the structural and agentic barriers more likely to be faced by our students and graduates, we identified the teaching of QM as an opportunity to provide something that would help to give them what Smith and Smith (2024: 412) describe as ‘the edge’ in the graduate labour market. With the right pedagogic approach we think that other Sociology programmes could embed more QM, improving student learning of research methods and enhancing graduate futures.
Working with Quantitative Evidence (WQE)
To illustrate our pedagogic approach, we use the example of Working with Quantitative Evidence (WQE), a first-year compulsory module with annual enrolment of 360–375 students across three programmes: Criminology, Sociology and joint programme, Criminology and Sociology. WQE’s students are diverse: 48% BAME (Black and Minority Ethnic), 1 37% Quintile 1 (POLAR4) 2 and 48% are first-generation university attendees. Half of the cohort studied A-level Sociology, 75% are female and 90% stopped studying mathematics at age 16. These students reflect the typical profile of Sociology students in the UK (Cant et al., 2019; HESA, 2024), with greater ethnic diversity and social disadvantage, mirroring our university context.
WQE is a 12-week module with weekly interactive lectures and smaller lab-based workshops (30–35 students). It focuses on descriptive statistics, including types of variables, interpreting frequencies, measures of distribution and variance, crosstabulations and framing data with theory. Students use SPSS© for their analyses. The module assessment is a research report where students analyse data from Crime Survey of England and Wales or British Social Attitudes Survey, choosing five variables to answer a set research question. They are assessed on their data interpretation and theoretical framing skills. WQE is part of a vertically integrated QM spine. In the second year, students take Quantitative Data Analysis (QDA), which builds on WQE; introducing inferential statistics. In the third year, students can choose to specialise in QM, with half their modules focused on QM. The entire QM spine follows the same pedagogic approach.
Supporting Positive Attitudes towards QM
Student attitudes towards QM significantly influence their engagement and learning (Tapia and Marsh, 2004). Our pedagogic approach, recognising that Sociology students often view QM as ‘troublesome knowledge’, a barrier to learning (Meyer and Land, 2005), focuses on addressing these attitudes. As a Q-Step Centre, part of a national initiative (2013–2021) to increase quantitative skills in Social Science graduates (Nuffield Foundation, 2025), we have developed our approach over a decade. Research (see Ralston, 2020; Tapia and Marsh, 2004; Williams et al., 2008) indicates that countering negative attitudes and fostering positive dispositions towards statistics are crucial for student success. Embedding QM within the student’s discipline, rather than using generic approaches, separated from discipline-context, is essential to address the root of negative attitudes. Tapia and Marsh (2004) highlight that an approach that only tackles negative student attitudes may build confidence and value; but unless it enables positive dispositions towards learning QM through motivation and enjoyment, it will be less likely to succeed. This view is supported by research (e.g. Hunt et al., 2011; Ralston, 2020; Scott Jones and Goldring, 2017; Yáñez-Marquina and Villardón-Gallego, 2016) on statistics teaching across various disciplines; we would argue that confidence, value and enjoyment increase motivation, but that without confidence students are unlikely to succeed. Our primary aim in WQE is to build confidence to achieve competence, ensuring that our pedagogic approach recognises and meets the needs of the diverse nature of our student cohort: it does this in five main ways.
Acknowledging Maths Anxiety
Studies (e.g. Bullock et al., 2014; Williams et al., 2008) suggest that Sociology students often have negative feelings towards numbers, viewing QM as ‘maths’. These feelings range from ambivalence and dislike to anger, upset and fear, rooted in a lack of confidence (Chinn, 2012; Onwuegbuzie and Wilson, 2003). Ninety per cent of WQE students stopped formal maths education at 16, in common with their peers (Scott Jones and Goldring, 2014) and have done little numerical work since, due to post-16 subject choices. Instead of telling students that statistics is ‘not maths’, we address the issue directly in week-one activities. In the opening lecture, students anonymously post their worries about working with numbers using the app Padlet©, identifying it as a shared cohort experience. As well as validating student feelings (Cheon et al., 2018), it allows the lecturers to briefly explain why students may feel this way. Interactive ‘Surprising Stats’ quizzes (via the app Mentimeter©) and ‘Silly Stats’ themed activities (e.g. ‘Bat Stats’ at Hallowe’en) are used to stimulate curiosity and enjoyment (Chinn, 2012; Tapia and Marsh, 2004), disrupting anxieties, building a reassuring atmosphere and possibly piquing interest in attending further sessions. Additionally, ‘number desensitisation’ activities are used (see Scott Jones and Cain, 2025), such as identifying special numbers (e.g. birthday, anniversary); and exploring attitudinal data (e.g. British Social Attitudes Survey on social acceptance of same-sex relationships) in a ‘numbers change lives’ exercise. In the latter, students explore the connection between data, policy and legal reforms. These activities aim to ‘desensitise’ students towards statistics, encouraging engagement and motivation to attend classes (Cheon et al., 2018), though they may not build confidence.
Telling Stories with Numbers
Sociology students excel in critique and narrative (Cant et al., 2022; Williams et al., 2015) but often struggle with QM, seeing them as just numbers. Studies (e.g. Carter and Jones, 2025; Scott Jones and Goldring, 2017) suggest a ‘storytelling’ approach can enhance confidence. In WQE we emphasise narrative, encouraging students to ‘tell stories’ with data presented in class, using their sociological imaginations, incorporating theory from other modules. Doing this means the students are doing something familiar, while placing QM skills within a suite of Sociology skills (Cant et al., 2019; Payne and Williams, 2011; Scott Jones and Goldring, 2017) – not standalone or disconnected from the discipline. ‘Storytelling’ fosters creativity and acknowledges multiple interpretations of data, allowing students to explore the intersections between theory, research methods, data and researcher positionality.
In lectures students are encouraged (with ‘what’s the story here?’ prompts) to use Mentimeter© to interpret descriptive statistics by identifying trends (positive/negative/no change) and exploring the possible reasons for them. They are prompted to frame their interpretations with theories from other modules and consider additional variables that could further develop or alter the story. In weekly labs, students conduct data analysis using SPSS© and are encouraged to ‘tell stories’ with their findings, exploring different interpretations. This narrative approach, using real data and Sociology topics, has been shown (e.g. Adeney and Carey, 2011; Bullock et al., 2014; Payne and Williams, 2011; Scott Jones and Goldring, 2017) to enhance student confidence and competence in QM.
Space, Time and Scaffolding
The narrative focus of WQE is supported by three key fundamentals: space, time and scaffolding. Research methods curricula are often criticised (e.g. MacInnes, 2010; Scott Jones and Goldring, 2017) for being too crowded, especially when limited space is available for QM. This can lead to crammed topics and insufficient time for mastery, causing students to lose a sense of direction and see how topics interrelate (Scott Jones and Goldring, 2015). This is not unique to QM modules, especially in the current higher education environment where programmes are under pressure to be more ‘efficient’, but we would argue that QM’s inherent ‘troublesome knowledge’ means that they have greater impact on student learning.
WQE focuses completely on the foundations of descriptive statistics. In the past it included multivariate analysis and statistical testing; these were removed to ‘slow’ down the pace of learning (Scott Jones and Goldring, 2015), focusing on getting the ‘basics right’ from which students can build in subsequent years. More time is allocated to fewer topics, with longer labs for practice, using real data from the UK Data Service, which addresses MacInnes’ (2010) time to practice requirement for learning QM. Scaffolding, according to Vygotsky (1978) and Meyer and Land (2005) is crucial for building student confidence. Tutors use Mentimeter© to gauge student confidence levels, adjusting teaching accordingly. If feedback is that students need to reinforce learning, then the tutors will recap, often using an alternative approach; if the students feel confident about something, then the class will celebrate that, enhancing a sense of shared community. An overall module ‘roadmap’ introduced in week one shows how each week’s content fits together to support learning, linking WQE content to other modules on the programme. Each lecture and lab starts with a recap of the previous week and ends with ‘next week on WQE’ to highlight how each week works together. In labs, students learn SPSS©, which adds a further layer of challenge (Scott Jones and Goldring, 2015) to learning QM; this is scaffolded through a task-list card to track student proficiency, which students and tutors ‘tick off’ as tasks are completed. Immediate and constant feedback through weekly tasks and quizzes helps increase motivation (Johansen et al., 2023); potentially building confidence and competence.
Supporting Relevance and Value of QM
Studies show that Sociology students often struggle to see the relevance and value of QM to their studies and future careers (see Adeney and Carey, 2011; Bullock et al., 2014; Payne and Williams, 2011; Scott Jones and Goldring, 2017). The narrative focus of WQE and its module design are supported by horizontal and vertical integration within the Sociology programme. Horizontal integration across first year links theory, QM and social policy modules within the same semester, ensuring that topics are interconnected. This is a common approach (e.g. Adeney and Carey, 2011; Bullock et al., 2014) to making QM relevant, often taking the form of data being explored on the theory or policy module to allow students to apply data skills elsewhere in their programmes. In terms of providing relevancy (and practice) for students this is useful, but we would argue that an approach that integrates across modules fully has the potential for greater benefits as it shifts away from an occasional ‘spotlight on’ approach to one where theory–methods–policy are intrinsically linked. To illustrate with ethnicity as a core topic: in the same week that the theory module discusses changing accounts of ethnicity, in WQE we ask why and how ethnicity is measured. The interlinking of changing and contested measurement with concept is essential to learning in both modules. That same week the policy module explores inequalities relating to ethnicity, demonstrating that complex measures of ethnicity, beyond BAME, facilitate greater insight into structural inequalities. This takes significant time and effort across module teams and can be easily disrupted: if module leaders change, programmes are revised and so on. Likewise, ensuring that the modules in each semester integrate with each other is a further layer of complexity. Crucial to our success has been departmental support, with the senior leadership team committed to greater integration of the programme. Tapia and Marsh (2004) identify the ‘departmental level’ as pivotal in terms of its power to influence and shape programmes, deploy resources and encourage staff. It is the most precarious level; even if tutors themselves are committed to programme integration, they may find themselves without strategic support to do it. The contested positionality of QM within UK Sociology (Payne, 2014) amplifies this precarity: as departmental heads change, curriculum priorities may change. We acknowledge the precarity of our programme’s horizontal integration (and its lack of completeness) but highlight that there are potential benefits to students’ learning of both theory and QM through this approach. Our ability to simplify and ‘slow down’ WQE is facilitated by the vertical integration of QM: in year two, students build on WQE to focus on inferential statistics, with an option to specialise in QM in their final year. This continuity helps students see how QM fits into Sociology and appreciate its value. Vertical integration shares some of the challenges of horizontal; however, we have one QM team who teach across all year groups and manage the QM ‘spine’, which is a legacy of our Q-Step Centre status. Integration can help students value QM’s role in supporting their overall performance and their learning in other modules. Moreover, it can facilitate an appreciation of the value of QM for their employability. WQE emphasises transferable data skills and their relevance to various careers. Weekly task-cards highlight skills learnt that can be listed on CVs, career spotlights in lectures and employability events like ‘data day’, which showcase data industry opportunities, highlighting the employability benefits of QM. Nevertheless, it is difficult to evaluate the impact of such activities, especially at a first-year level when students are less focused on careers. However, we would argue that highlighting potential employability ‘gain’ from QM encourages students to reflect on skills learnt and QM’s value to them.
Playfulness and Community
In large cohort modules like WQE, students can feel anonymous and isolated particularly in lectures, which can be exacerbated by anxieties about QM: this can make them more likely to not engage or attend (Scott Jones and Goldring, 2017). Enjoying WQE can shift negative attitudes towards QM. Encouraging playfulness and community makes learning active and fosters confident learners (Nørgård and Moseley, 2021; Nørgård et al., 2017). The WQE lecture is a space for playfulness, drawing on the idea of lecture as ‘spectacle’. For example, the module has a Spotify© playlist that students populate with songs related to statistics, played at the start and end of lectures. Interactive methods on lecture slides, such as funny memes and cartoons, are used to engage students. Weekly ‘Silly Stats’ introduce new concepts and demystify terminology, focusing on humour and play to create a welcoming and reassuring atmosphere. In labs, interactive techniques support collective and inclusive learning, with materials and delivery addressing different learning styles.
Evaluating the Pedagogic Approach
Four fundamental questions address the efficacy of this pedagogic approach: does this approach to teaching QM reduce statistical anxiety as students progress through their degree? Does this approach to teaching QM increase students’ confidence in working with QM, as they progress through their studies? Does this approach to teaching QM show differential outcomes in relation to other first-year modules? And does this approach to teaching QM show differential levels of overall student satisfaction in relation to other first-year modules? The first two questions were addressed through a two-year survey of students’ attitudes, while the latter two questions were evaluated through a review of module performance data and End of Module survey data.
Evaluating Anxiety and Confidence in QM Students
Ethical approval was granted by Manchester Metropolitan University’s ethics committee (Ethos number 23686) to conduct a two-year survey of students. Two measures were used to assess whether students’ attitudes changed over a two-year period. Both measures used common techniques for creating latent constructs through multiple statements, both underwent reliability and validity testing. Statistics Anxiety was measured using a revised version of Nielsen and Kreiner’s (2018) HFS-R, which was an original measure of statistics anxiety for students in Denmark. The measure used a scale consisting of 20 items, originally coded one to four; ranging from ‘no anxiety’, ‘a little anxiety’, ‘some anxiety’ and ‘a lot of anxiety’. A higher score therefore indicated a greater level of anxiety. Students’ confidence with QM was measured using a scale consisting of 12 items that discuss students’ confidence, requiring respondents to agree with a series of statements related to confidence studying a statistics module, coded one to five from ‘strongly disagree’ to ‘strongly agree’. The statements apply items from Pintrich et al. (1991) to create a total scale, with revisions to wording, following the work of Williams et al. (2008) and Ralston (2020). A higher score here equals greater confidence with working with statistics.
The sample consisted of undergraduate students enrolled in QM modules (WQE in year one, QDA in year two and Becoming a Quantitative Researcher (BQR) in year three) in the Sociology department at Manchester Metropolitan University. Data was collected through electronic self-completion surveys during academic years 2021–2022 and 2022–2023, with samples aggregated per study level. Surveys were distributed in week four of the 12-week modules to avoid biases from start-of-year or assessment anxieties. Students were purposively sampled, by receiving an invitation and direct link to participate in the survey, which they only received if they were studying the module at that time. To avoid socially desirable responses, students were invited to take part via email invitations and could complete the surveys outside of class. All responses were anonymous, and it was emphasised that students could not be identified, nor would the survey affect their grades. Students consented to participate, knowing their data could not be retrieved once submitted. Table 1 shows total student participation and provides an estimate of the number of students in each year group. The survey was answered over two academic years, meaning the estimate is based on the sum of how many students were in the year group at the start of each year.
Student participation in the evaluation.
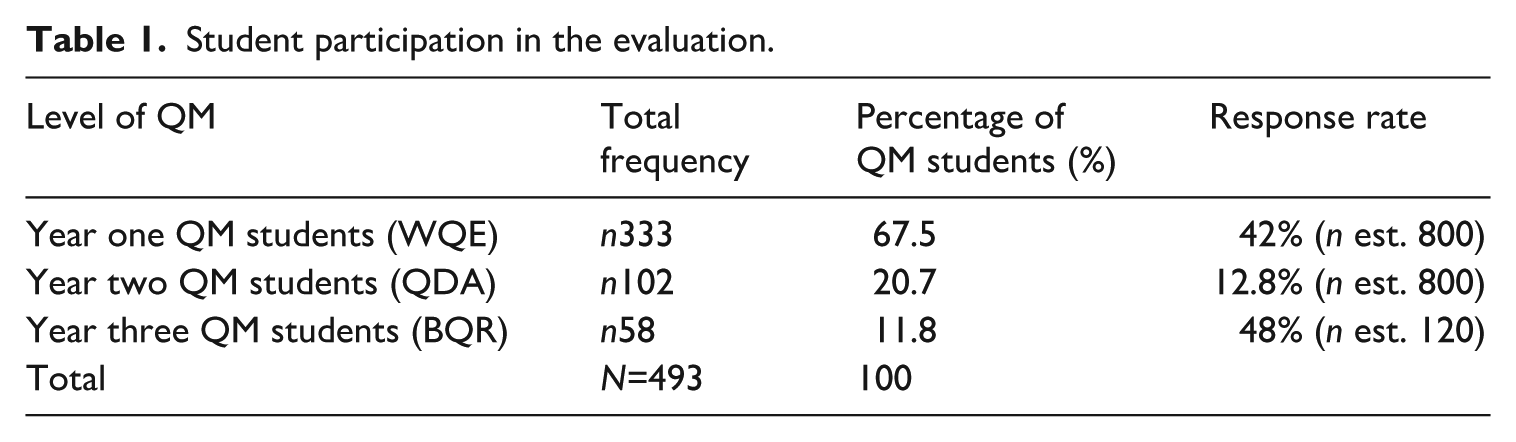
The response rate for year one and three students is high; the much lower response rate for year two make the results speculative. Descriptive statistics for both measures are presented in Tables 2 and 3.
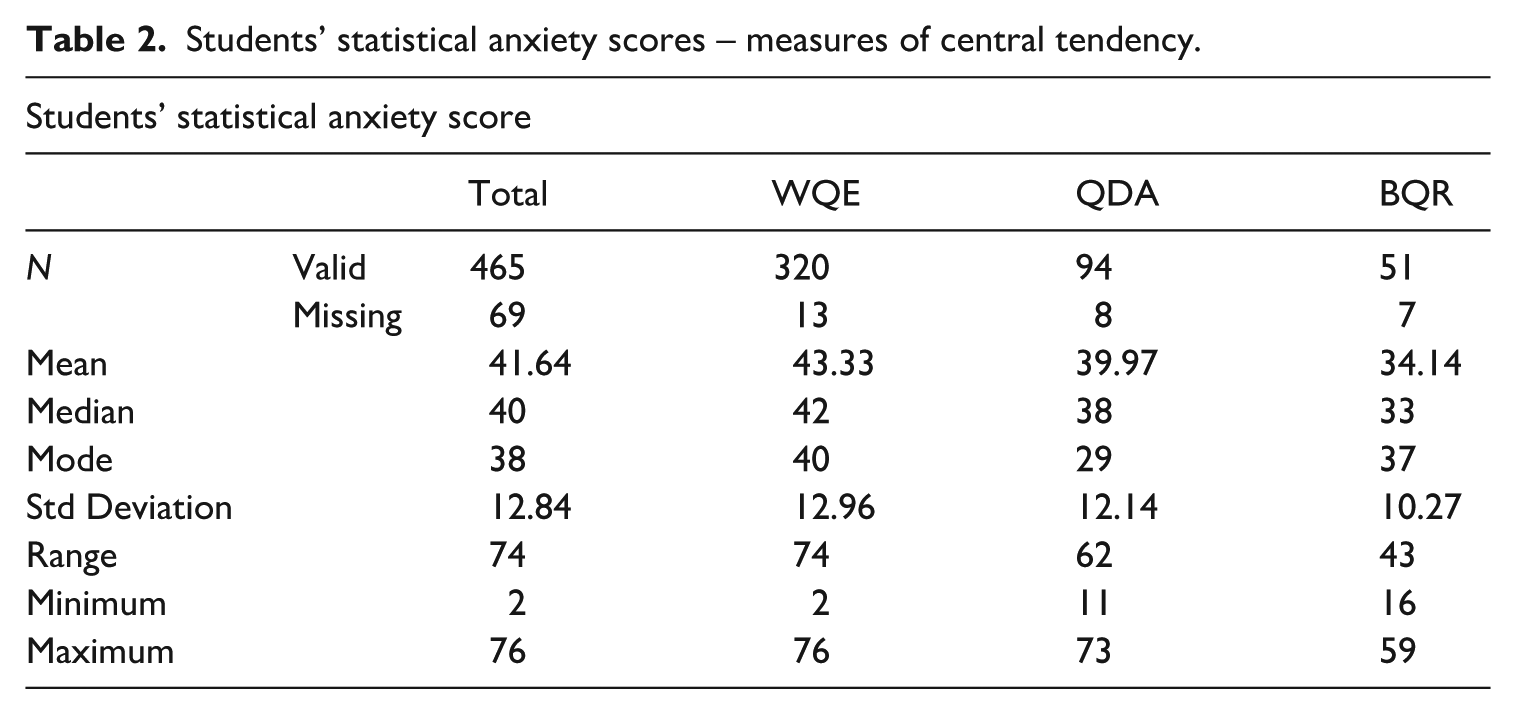
Students’ statistical anxiety scores – measures of central tendency.
Students’ confidence with statistics score – measures of central tendency.
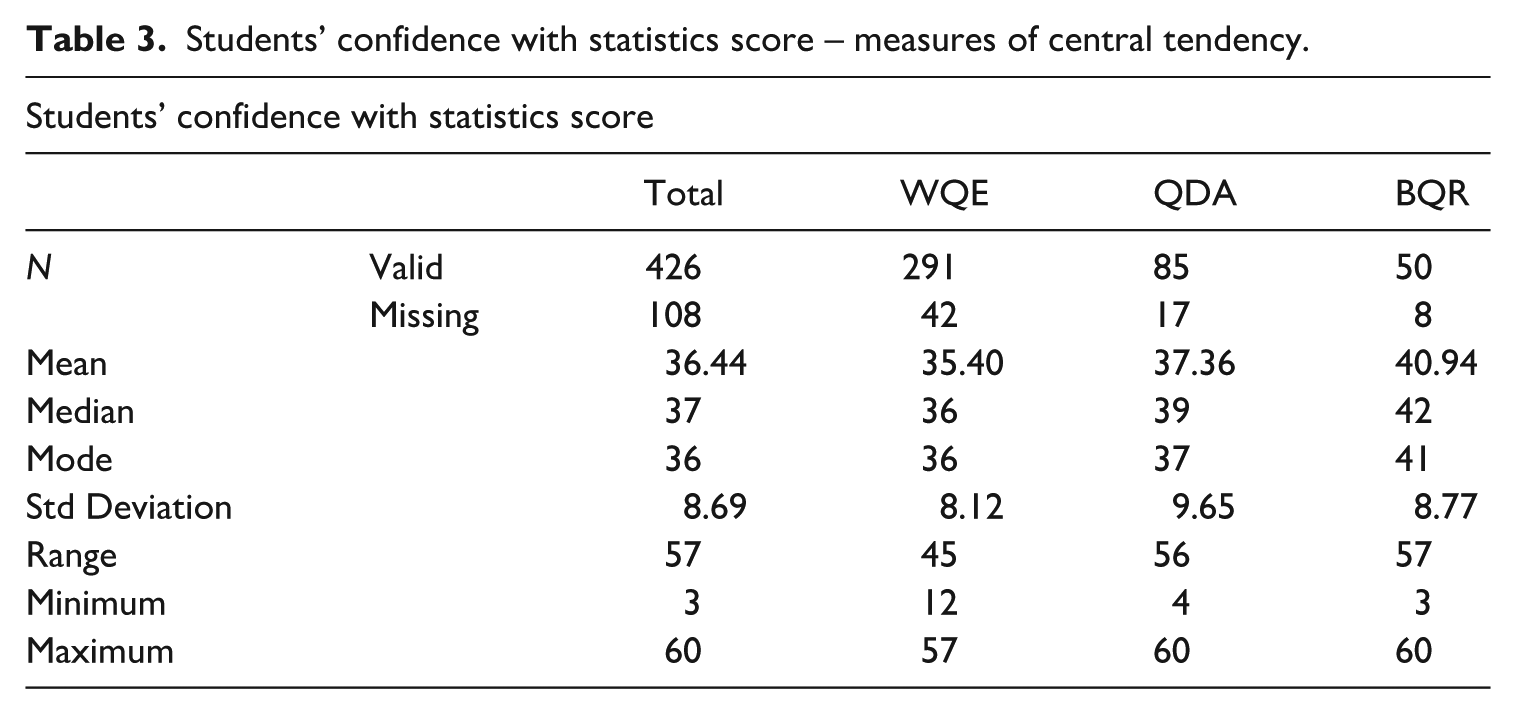
Table 2 shows the mean statistics anxiety for the sample to be close to the median of 40, with a slight skew towards anxiousness; indicating the sample to not be predominantly more or less anxious with respect to the measure used. The median anxiety scores decreased from 42 (year one) to 38 (year two) and 33 (year three). The range of scores decreased each year, from 74 (year one) to 43 (year three), indicating a reduction in variability. The maximum scores remained high (76 in year one, 73 in year two), suggesting some students continued to experience high anxiety. Smaller sample sizes in years two and three make the identification of a positive trend tentative. This decrease in anxiety by second year and again by third year has been noted anecdotally by tutors. The reduction in median scores suggests a general decrease in anxiety, though the persistent high maximum scores indicate ongoing challenges for some students.
Table 3 shows median confidence scores increased from 36 (year one) to 39 (year two) and 42 (year three). The range of scores widened in years two (56) and three (57), indicating diverse changes in confidence levels. However as Table 3 shows a substantial number of responses were missing (n=108), making the positive trend speculative. The increase in median scores suggests a general rise in confidence, though the widening range and missing data indicate variability and caution in interpreting the trend. Our findings do not indicate high degrees of bias towards anxiousness or confidence; echoing the results of similar studies (see Ralston, 2020; Williams et al., 2008).
Evaluating Student Success and Satisfaction
We reviewed performance data for all year one modules between 2021 and 2023, focusing on mean coursework marks and pass rates. Data for each module was combined per semester to compare performance, with WQE results kept separate, as shown in Table 4. Semester B includes WQE alongside theory and social policy modules, while Semester A is the first semester of studies.
Module performance data 2021–2023.
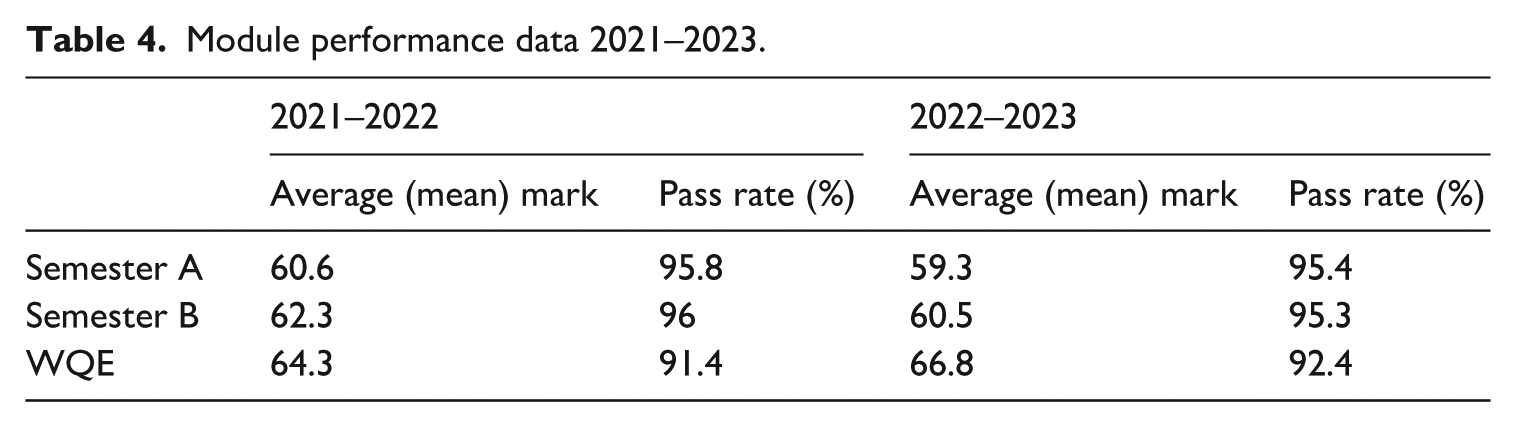
Table 4 shows a slight increase in marks and pass rates from Semester A to B, possibly due to students settling in. WQE has higher marks compared with other modules. First-year students tend to perform better in WQE but have a higher likelihood of failing compared with other modules. The pedagogic approach shows some success in improving marks but not significantly affecting pass rates, suggesting QM remain a barrier for some students to overall first-year success. Module performance data present a mixed picture: first-year students are more likely to do better but also more likely to fail on WQE than their other modules
An End of Module survey is available for students to complete anonymously via their virtual learning environment (VLE). This asks a series of Likert-scale questions regarding their module, which generates overall scores as percentages. Completion of the survey is voluntary; the survey is issued during the last three weeks of the module. We reviewed End of Module survey data for academic year 2024–2025 as this was the first year the survey had a response rate above 3%; the 2024–2025 survey includes the same modules whose data is shown in Table 4. Table 5 shows the percentage of students satisfied with modules, displaying the results for three core questions: ‘Overall, I am satisfied with the quality of this module’ (‘overall satisfaction’); ‘The teaching staff on this module are good at explaining things’ (‘overall teaching’); and ‘The feedback on this module has helped me improve my work’ (‘overall feedback’). Aggregate scores for all first-year modules (excluding WQE) were generated for comparison.
End of Module survey results (2024–2025).
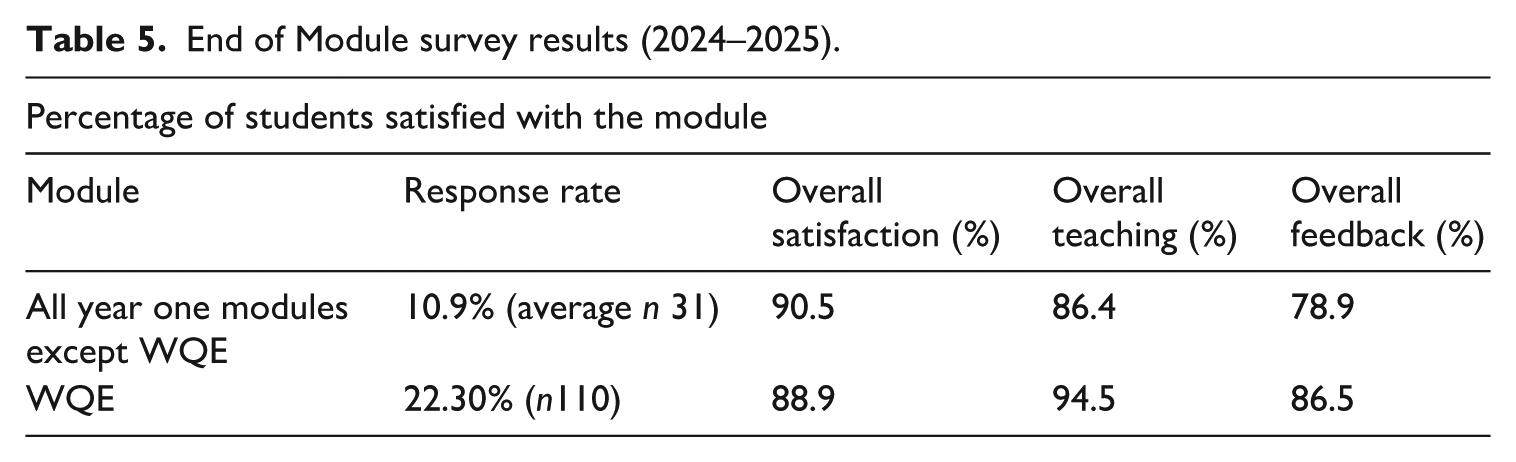
Interestingly WQE students were more likely to respond, indicating higher engagement and recognition of the pedagogic approach, through higher satisfaction with teaching and feedback. The data should be treated cautiously due to the low response rate for the other modules.
Reflections on Teaching QM to Enhance Graduate Outcomes
This article argues that Sociology students’ negative attitudes towards QM hinder engagement and learning. To address this, the WQE module adopts a pedagogic approach inspired by Tapia and Marsh (2004), focusing on scaffolding, engagement and career relevance. We argue that the cause of negative attitudes to QM lies within the pre-university backgrounds and experiences of Sociology students, allied with perceptions of mainstream Sociology and traditional styles of teaching QM. The evaluation of the efficacy of our approach is speculative; the data is not robust due to low response rates and missing data. Nevertheless, anxiety levels decline, and confidence levels increase broadly across the levels of the programme. Student average marks are slightly higher on the QM modules than the other compulsory modules. High marks imply competence with QM (and possibly increase in confidence), which may be an artefact of the approach, particularly given the attention to scaffolding, engagement and subject–career relevance; furthermore, the End of Module survey identified higher than average satisfaction with teaching and feedback. Some students perform well without gaining confidence, suggesting competence does not always equate to self-efficacy – as evidenced by the increased maximum anxiety score and widening of the range of confidence scores. Importantly, tutor observations, albeit anecdotal in nature, highlight that those students who continue beyond second-year compulsory QM into optional final-year QM study are not solely the students who have consistently been confident in using QM from years one to three.
We acknowledge that the approach outlined in this article has benefited from our Q-Step Centre status. Vertical and horizontal integration is challenging, especially on large programmes with competing demands. It requires considerable management authority and will to drive it. In this era of higher education cuts to programmes and staffing this means such an approach is precarious. There is no clear evidence from our evaluation that linking QM with theory modules improves student performance. However, intuitively, linking modules together should help students (Payne, 2014; Payne and Williams, 2011) and we would argue that greater integration between theory and methods likely enhances learning and warrants further research.
Our approach demonstrates that a ‘conversion’ model to QM works for Sociology students: by the end of year two, around 20% of our students consistently choose to specialise in QM for their final year of study. This suggests that building confidence and competence in years one and two fosters self-efficacy and interest in QM to pursue them further. In contrast, direct recruitment into QM programmes from year one – attempted by many Q-Step Centres (Rosemberg et al., 2022) – has seen mixed results, likely due to the initial negative attitudes students hold towards QM.
Sociology students often face structural inequalities in the graduate job market (Bradley and Waller, 2018), but in-demand QM skills (POST, 2023) can enhance their employability. The Q-Step programme evaluation (Rosemberg et al., 2022) showed that Q-Step students tend to earn more and secure graduate roles faster than their peers. Graduate Outcomes survey data is not yet available for our 2021–2023 cohorts, but HESA (2024) data shows that those who graduated in 2020 have graduate prospects scores higher (69%) than sector average for Sociology graduates. Moreover, the students who specialised in QM at year three have scores (81%) equivalent to Sociology graduates from Russell Group universities. Obviously quantitative skills are not the only factor influencing graduate employment but this data, while acknowledging it is not robust, suggests that such skills enhance graduate employability for our students. This suggests our efforts to boost employability through QM are having a positive impact. Clearly, more research is needed into the influence of QM skills on employability, but we can surmise for our students that quantitative skills are giving them Smith and Smith’s (2024) ‘edge’ in the graduate jobs market.
Footnotes
Funding
The authors received no financial support for the research, authorship and/or publication of this article.