
Abstract
Ethnic minorities fare less well on average in the labour market than their white British counterparts. Experimental research shows that employers discriminate against ethnic minority applicants while hiring, but it is impossible to say from these studies how much of minorities’ overall disadvantage – which reflects compositional differences and search behaviour as well as hiring – is due to discrimination. This article connects results from two UK-based field experiments with ethnic penalties estimated from comparable samples of the UK Labour Force Survey and Understanding Society to show the relation between hiring discrimination and labour market penalties, for several ethnic minority groups. Higher hiring discrimination is indeed associated with worse ethnic employment penalties, but similarly discriminated against groups do not necessarily face the same ethnic penalties. We provide a discussion of possible reasons for this variation. Our research points to socio-economic resources and supply-side differences among ethnic groups as plausible explanations.
Introduction
Ethnic minorities are generally less likely to be employed or to have good jobs than the majority group, even after accounting for socio-economic differences (Heath et al., 2008; Van Tubergen et al., 2004). It is crucial to know to what extent these net gaps (often referred to as ‘ethnic penalties’) reflect differences between ethnic minorities and the majority in terms of their characteristics, resources and labour market behaviour; or if they reflect discrimination where employers are less likely to hire an ethnic minority applicant than an identical majority applicant. The literature has generally focused either on estimating average ethnic penalties (i.e. the net gaps in outcomes remaining after controlling for demographics, human capital, social capital and other relevant characteristics) using statistical analyses of secondary data (Berthoud, 2000; Carmichael and Woods, 2000; Heath and McMahon, 1997); or on showing the presence of ethnic discrimination in hiring through field experimental methods targeting employers’ decision making (see, for example, Neumark, 2018; Quillian et al., 2017; Zschirnt and Ruedin, 2016). There has however been little or no research exploring the relationship between the findings from these two different approaches.
This article connects the two approaches to answer the following important question: ‘is hiring discrimination related to the relatively worse employment outcomes for ethnic minorities in the UK?’ More specifically, do minorities whose net outcomes (that is, ethnic penalties) are worse also experience higher rates of discrimination, while those whose net outcomes are closer to those of the majority experience lower rates of discrimination? We estimate ethnic penalties from the Labour Force Survey – a large representative survey; and compare these penalties with estimates of the hiring discrimination faced by ethnic minorities in the UK obtained from two field experiments. We take as a starting point in this comparison the observation that the net labour market outcomes of ethnic minorities, captured by ethnic penalties, depend both on supply-side factors – differences in minorities’ search strategy and (un)observed characteristics – and on demand-side factors – hiring decisions of employers. Field experiments, however, address exclusively the demand side. Hence, it is necessary and important to combine evidence from both perspectives. Already a decade ago, Pager (2007: 120) suggested, as one promising avenue for further research on discrimination, that future studies ‘should make efforts to empirically map the findings from audit studies [the term she uses to refer to field experiments] onto population surveys of job search and employment patterns’. We take up this challenge in the current study.
The next section defines key concepts and explains the conceptual framework in more detail. We then discuss the data used in this study and show the relation between hiring discrimination and ethnic penalties. We find that ethnic penalties in employment are indeed larger for more discriminated against groups, but similarly discriminated against groups do not necessarily incur similar ethnic penalties. While we cannot in this article identify the mechanisms through which some minority groups obtain better labour market outcomes than others facing similar rates of hiring discrimination, we consider several options. Group-differences in the process of looking for work, particularly by activating social networks and community resources, seem a likely explanation of why certain groups manage to bypass discrimination by employers.
Conceptual Framework
Ethnic discrimination in hiring (hiring discrimination) and ethnic penalties on the labour market are generally measured through different methods. On the one hand, the ethnic penalties literature has established from statistical analysis of survey data that many ethnic minority groups in the UK have, on average, a lower probability of being employed and work on lower quality jobs than the white British majority possessing the same qualifications (Berthoud, 2000; Carmichael and Woods, 2000; Heath and McMahon, 1997). The discrimination literature on the other hand has established from field experiments that ethnic minority applicants in the UK are, ceteris paribus, less likely to receive a positive reply to their application than the white British majority (Heath and Di Stasio, 2019; Wood et al., 2009). While discrimination is often assumed to cause these ethnic penalties, it is not possible to show this without connecting these two strands of research. Figure 1 presents the conceptual link between hiring discrimination and ethnic penalties. Our starting point, then, is that hiring discrimination – estimated through field experiments – is likely to represent one crucial component of the overall ethnic penalties generally found, although not necessarily the only component.
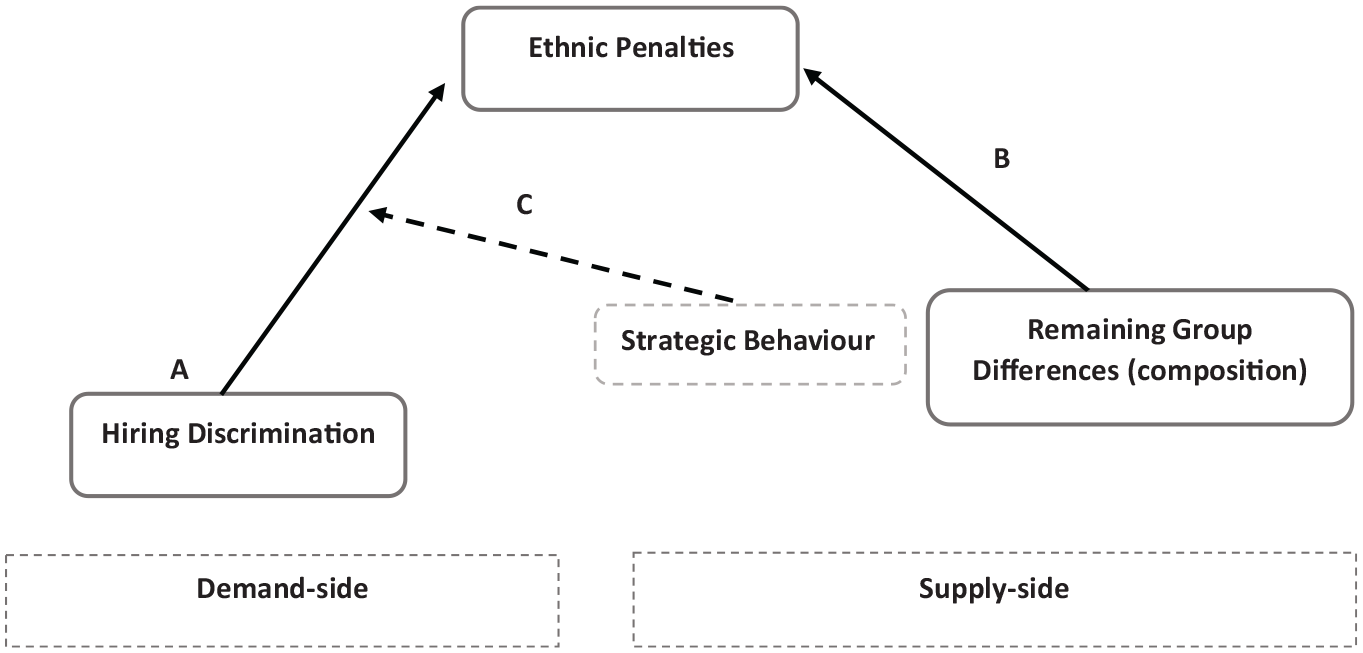
Conceptual framework.
First (A), Hiring Discrimination is the extent to which ethnic minorities are less likely to proceed in the hiring process than majority members with identical credentials and CV. The extent of hiring discrimination is generally measured through field experiments. Field experiments come in two forms – audit studies and correspondence tests – both relying on matched pairs or sets of fictitious applicants which are identical except for the characteristics (such as ethnicity) that allegedly cause discrimination, with audit studies using in-person applications and correspondence tests relying on written applications. These matched applicants respond to real vacancies in random order. Ethnicity is typically signalled by the foreign-sounding names of the applicants, their reported mother tongue or pictures in settings where this is commonly included. Discrimination is then measured as the average difference in the responses that majority and minority applicants receive to their applications. The principal strength of audit and correspondence tests is that they employ the key experimental feature of random assignment to treatment while taking place in real labour market contexts (Pager, 2007; Pager and Shepherd, 2008). For this reason, they are considered the gold standard for discrimination research, although they do have some limitations. 1
British experiments establish that ethnic minority applications suffer discriminatory decisions by employers at the point of hire: keeping all else constant, members of ethnic minority groups are less likely to receive a positive response than majority applicants when applying for a job (Bagley and Abubaker, 2017; Heath and Cheung, 2006; Heath and Di Stasio, 2019; Wood et al., 2009). Discrimination does not, however, affect all minorities to the same degree: white minorities are generally treated more favourably than visible minorities, for example South-Asian or black minorities, while little difference is found between these latter two groups. These risks of discrimination are persistent. A comparison of field experiments over time shows no downward trend in discrimination in the UK (Heath and Di Stasio, 2019) or the USA (Quillian et al., 2017).
Second (B), Ethnic Penalties refer to the net differences in labour market outcomes of ethnic minorities compared to the majority after controlling for observed characteristics. A large body of literature established ethnic penalties in the UK in employment and occupational status (Blackaby et al., 2005; Cheung, 2013; Dustmann and Theodoropoulos, 2010). As opposed to the consistent and relatively undifferentiated presence of hiring discrimination, there is more variation in the size of the ethnic penalties between groups and over time. White minorities generally do as well as or even better than the UK majority; and Indian and Chinese minorities generally outperform Pakistani/Bangladeshi minorities (Li and Heath, 2008). Li and Heath (2008) show a reduction in ethnic penalties over time for some groups – notably Indian, and to some extent black Caribbean men, in the UK, which contrasts with the lack of improvement in discrimination as evidenced from field experiments (Heath and Di Stasio, 2019).
Ethnic penalties may result from hiring discrimination but ascertaining this would require controlling for all compositional and behavioural differences between ethnic groups on the supply-side – including any unobserved differences in, for example, job search behaviour. In previous studies, after controlling for possible compositional differences – such as differences in qualifications (Zwysen and Longhi, 2018), language skills (Dustmann and Fabbri, 2003) and social class background (Zuccotti, 2015) – the difference between minorities and the majority is reduced, but substantial unexplained gaps remain. An exception is the work by Koopmans (2016) showing that ethnic penalties in labour force participation (a different outcome from that usually studied in the ethnic penalties literature) for Muslim women disappeared when accounting for ‘socio-cultural values’ including language skills, networks and liberal gender values. As it is impossible, using survey data, to rule out the possibility that additional but unobserved factors may explain ethnic penalties these studies cannot demonstrate that discrimination causes the ethnic penalties.
Third (C), Strategic Behaviour can shape the impact of hiring discrimination on ethnic penalties. Field experiments, by design, keep not only individual characteristics but also job search behaviour constant, since the fictitious applicants by design apply for the same jobs (or type of job). They therefore do not account for ethnic differences in job search. This strategic behaviour can take several forms: knowing how to present yourself to the employer (Hiemstra et al., 2013); changing the amount and quality of jobs applied to (Pager and Pedulla, 2015); or avoiding discrimination by becoming self-employed, relying more on the public sector (where discrimination appears to be lower) and searching through social networks rather than more formal methods (Battu et al., 2011; Modood and Khattab, 2016). If these strategies differ between groups, different ethnic penalties may arise for ethnic minority groups who face similar risks of discrimination as those groups who search more strategically may be able to bypass discrimination to some extent.
In this article we compare the hiring discrimination results from field experiments, which can be seen as counterfactual estimates of the disadvantage on the labour market that would occur if all compositional differences (both observed and unobserved) and labour market behaviour were kept constant (the B and C paths in Figure 1), with the actual labour market disadvantage of a comparable representative group as obtained through statistical analyses of secondary data (ethnic penalty). As surveys cannot account for all possible differences in composition and strategic behaviour, the difference between the estimates from field experiment and those from surveys indicates the role played by any differences in composition or strategic behaviour, or both.
Data and Methodological Approach
Measuring Discrimination from Experimental Data
We make use of two field experiments on ethnic discrimination carried out in the UK: 2 one funded by the Department of Work and Pensions (DWP) in 2008 and 2009 and published by NatCen (Wood et al., 2009), and the other funded by Horizon2020 and conducted in 2016 and 2017 in five European countries including the UK (Lancee et al., 2019).
Wood and co-authors (2009) sent fictitious competitive applications to open vacancies in large diverse cities. The experiment covered nine different occupations: IT support, accounts clerk, sales assistant, office assistant, care assistant, IT technician, accountant, HR manager and teaching assistant. Three applications – two from a randomly varied ethnic minority group and one from the majority, keeping gender constant – were sent to each of 987 vacancies between November 2008 and May 2009. They signalled ethnicity through names typical of white British, Pakistani and Bangladeshi; black African; black Caribbean; Indian; and Chinese adults. Discrimination was measured as the difference in the proportion of positive responses received by majority and minority groups. The CVs that were sent out all related to relatively young applicants (between 20 and 35), with some work experience (ranging from two years to around 15), who had British nationality and had at least GCSE qualifications. A positive response was defined as being called back for an interview or other form of positive response (e.g. request for information about wage expectations).
The second set of field experimental data was gathered in England between 2016 and 2017 as part of the GEMM (Growth, Equal Opportunities, Migration and Markets) project. Unlike the DWP field experiments, only one application was sent to each employer. 3 Applicants varied by their ethnicity as well as by other randomly varying characteristics. Vacancies were sampled from an online job portal and covered six occupations – cook, store assistant, receptionist, payroll clerk, sales representative and software developer – which vary by skill level and required customer contact. Ethnicity was signalled by the name of the applicant as well as by mother tongue. A sentence in the cover letter reiterated the ethnic background of the applicant and explained that all relevant qualifications and training had been obtained in the UK. In view of its comparative design, the GEMM field experiment included a larger number of minority groups than is usual in single country studies but also oversampled two groups of special interest in the UK. Overall, the GEMM design included 25% of applications from majority members, 25% from applicants with Nigerian and Pakistani origins (in roughly equal proportion) and 50% of applications from 33 other minority groups. We grouped the origin countries into eight regional groups: white British, Pakistani and Bangladeshi, black African (Ethiopia, Nigeria, Uganda and Somalia), Eastern European (Albania, Bulgaria, Greece, Poland, Romania, Russia), Western European and the USA (France, Germany, Italy, Netherlands, Norway, Spain, USA, Ireland, abbreviated to West), Middle Eastern and North African (Egypt, Iran, Iraq, Lebanon, Morocco, Turkey, abbreviated to MENA), remaining Asian countries (China, India, Indonesia, Japan, South Korea, Vietnam), Caribbean and South American (Mexico, Trinidad and Tobago, Jamaica). Applicants were either born in the UK or arrived when they were younger than six; they also had around four years of work experience. A positive response was defined as receiving an invitation to (pre-)interview or a request for more information, and a negative response as a rejection or no response. 4
Measuring Ethnic Penalties from Secondary Data
We compare the odds ratios of being an employee or self-employed rather than unemployed – estimated from surveys – to the odds ratios of receiving a positive call-back in the two hiring discrimination experiments. For both analyses white British constitutes the reference category. Economically inactive respondents are excluded from the survey data in order to limit differences due to self-selection into work. We use the UK Labour Force Survey data (UKLFS), a quarterly representative sample of the UK population, to estimate ethnic penalties through a logistic regression of the probability of being employed.
In order to obtain sufficiently large samples, we pool UKLFS quarters from 2007, 2008, 2009 and 2010 to create a comparison set for the 2008/2009 DWP experiments. UKLFS data are pooled from 2014 through to the second quarter of 2017 to estimate ethnic penalties comparable to the 2016/2017 GEMM experiments. We use country of birth and nationality as well as self-reported ethnicity to create ethnic groups which are comparable in the survey and field experiment data. 5
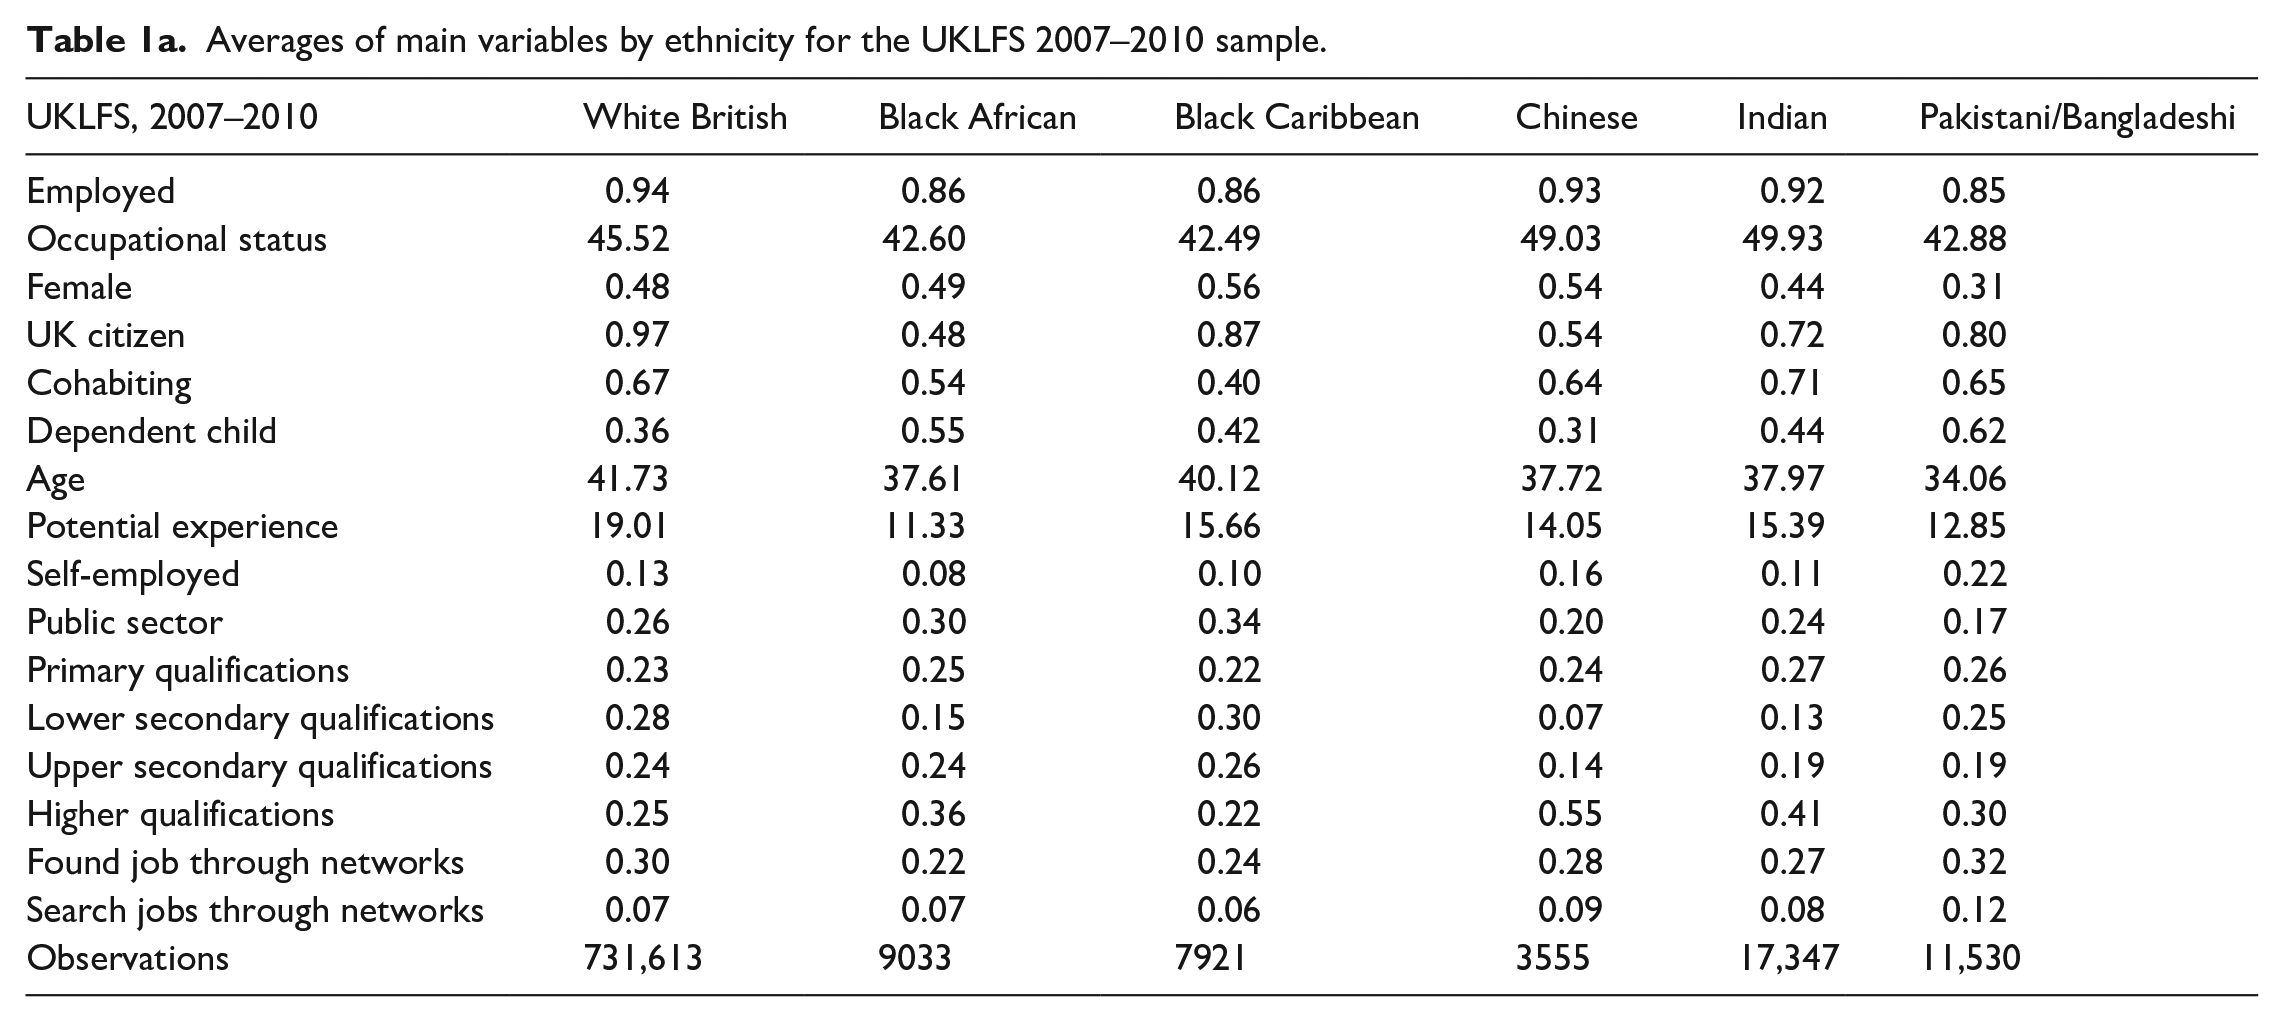
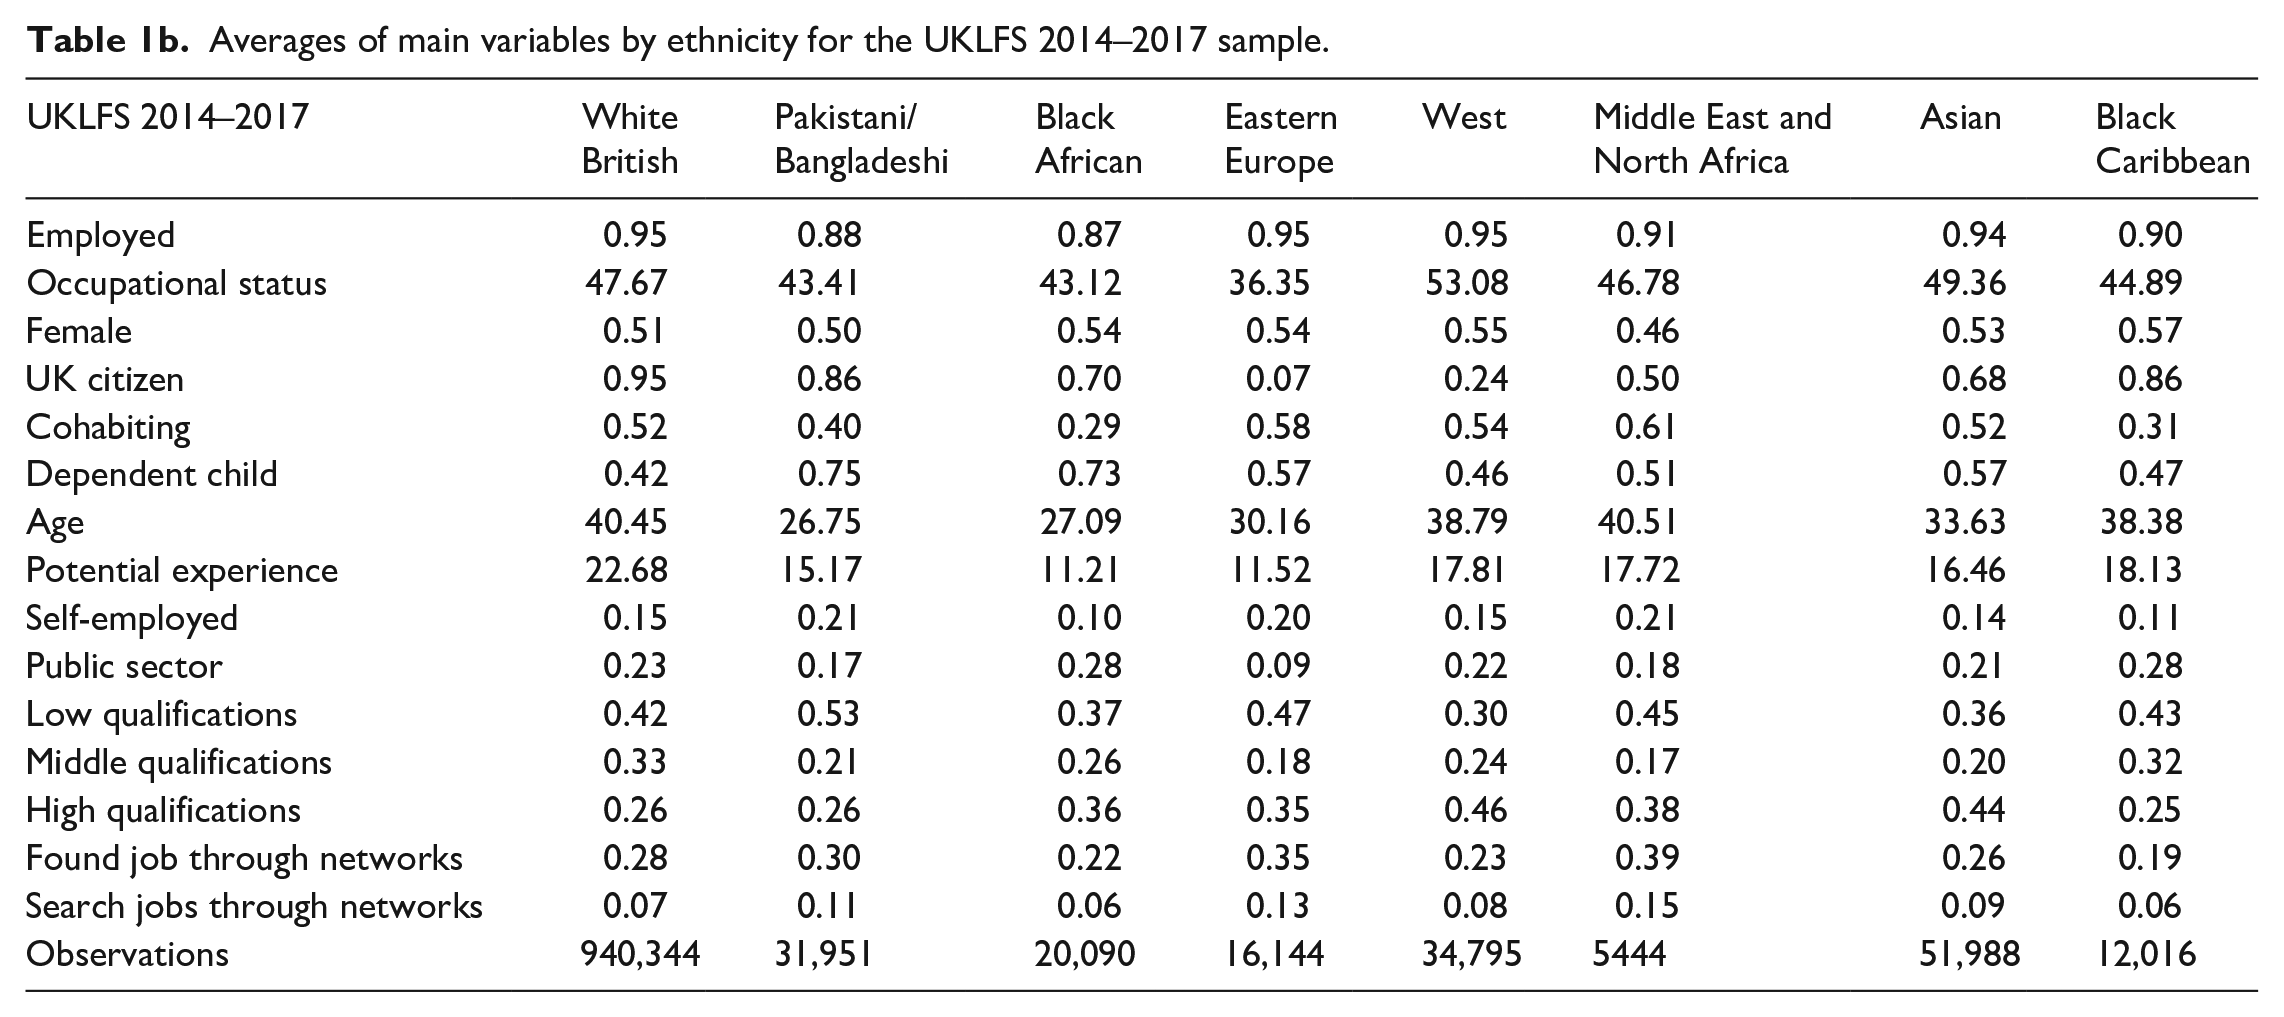
The independent variable of interest is a set of ethnic dummies which capture ethnic penalties. The model controls for: time since leaving full-time education, age and age squared, highest obtained qualifications, having UK citizenship, whether respondents are cohabiting with a partner and whether a dependent child is present in the household, as well as fixed effects for region and year of survey. Table 1a and Table 1b show descriptive statistics for the two datasets. Appendix B in the online supplementary material presents the results from these regressions.
Averages of main variables by ethnicity for the UKLFS 2007–2010 sample.
Averages of main variables by ethnicity for the UKLFS 2014–2017 sample.
Findings
Gaps by Ethnic Groups
Figure 2 shows the estimated discrimination in the GEMM and DWP experiments and the corresponding ethnic penalties estimated from the UKLFS. Odds ratios below 1 indicate that the probability of a positive response from the employer (ethnic discrimination) or the probability of being employed (ethnic penalty) is below that of the white British.
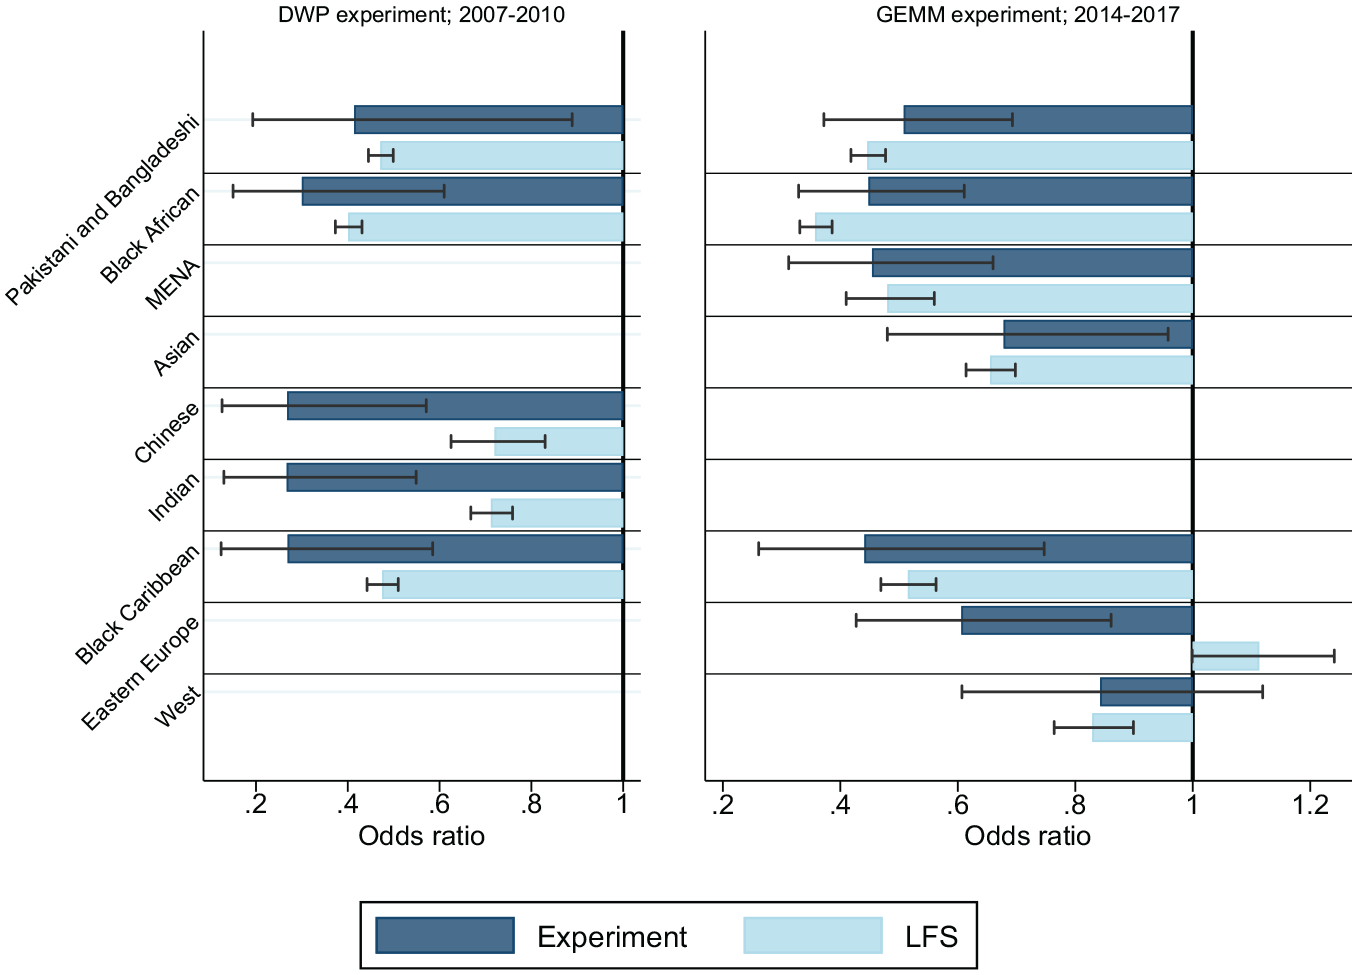
Odds ratios of hiring discrimination and corresponding ethnic penalties.
A first clear observation from the earlier DWP experiment (left panel) is that, as reported by Wood et al. (2009), all ethnic minority groups are substantially 6 less likely than the white British to receive a positive call-back when applying for a job. However, while there are no discernible differences in hiring discrimination between the groups, the ethnic penalties do differ substantially (consistent with the previous literature). Most notably, Chinese and Indian minorities fare better than black African, black Caribbean and Pakistani/Bangladeshi minorities with respect to ethnic penalties, despite their very similar risks of hiring discrimination.
The second panel of Figure 2 shows the estimated discrimination from the GEMM experiment and the corresponding ethnic penalties. Apart from white western minorities, 7 all other groups are less likely to receive a call-back than the white British. The GEMM data indicate worst discrimination for black African, black Caribbean and Pakistani and Bangladeshi applicants, followed by Asian and Eastern European applicants, and no discrimination against western minorities. In comparison, ethnic penalties in employment are smallest for Eastern Europeans, who are even more likely to be employed than the majority group, and western applicants, followed by Asian and black Caribbean minorities, while minorities from the Middle East and North Africa, other African countries and Pakistani/Bangladeshi minorities do worst.
In both field experiments non-white minorities have lower call-back rates than white British, regardless of their ethnic group. In the GEMM experiment white western minorities stand out as the only minority group not being discriminated against, while white Eastern European minorities do face discrimination. Ethnic penalties vary more between non-white groups, however, with Indian, Chinese and other Asian minorities having better labour market outcomes (lower ethnic penalties) than other minority groups who face similar levels of hiring discrimination in the field experiments. Black African minorities stand out as doing worst both in terms of discrimination and ethnic penalties.
Gaps by Occupation
The second analysis compares ethnic penalties – averaged over all minority groups – at different skill levels. Both the DWP and GEMM experiments included occupations for which applicants typically have lower, middle and higher qualifications. Table 2 compares the occupational differences in hiring discrimination with the ethnic penalty with respect to employment at that occupational level (as opposed to working in a lower quality job or being unemployed). 8 We estimate the ethnic penalties for subsamples having similar levels of skills as those involved in the field experiments 9 and, in the case of the DWP experiments, similar potential labour market experience. The odds ratios are averaged over ethnic groups. 10 As before, the lower the estimate, the greater are the risks of discrimination and the magnitude of the ethnic penalties.
Odds ratios of discrimination at different occupational levels and average ethnic penalties with respect to jobs at comparable levels.
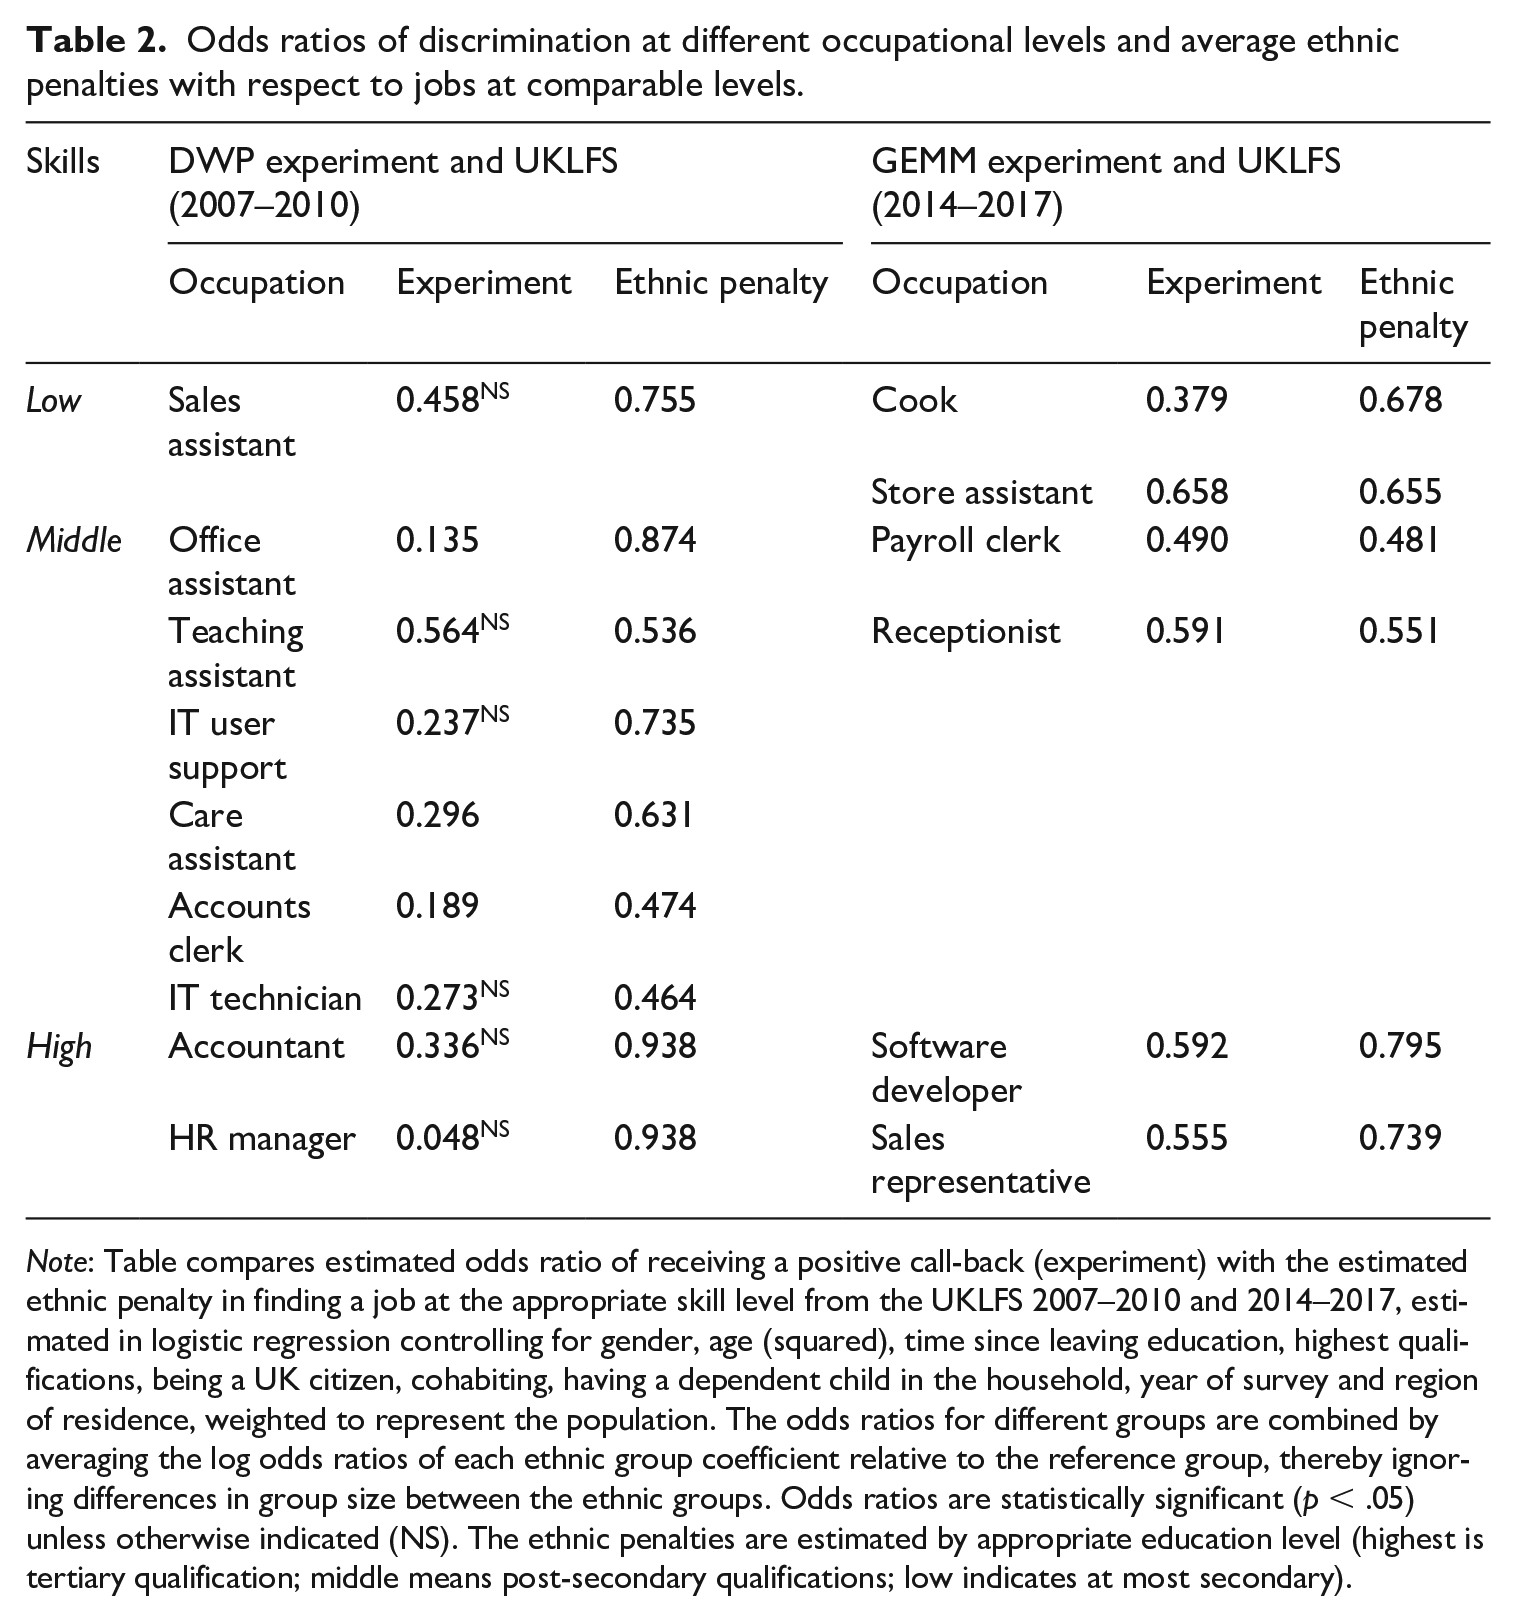
Note: Table compares estimated odds ratio of receiving a positive call-back (experiment) with the estimated ethnic penalty in finding a job at the appropriate skill level from the UKLFS 2007–2010 and 2014–2017, estimated in logistic regression controlling for gender, age (squared), time since leaving education, highest qualifications, being a UK citizen, cohabiting, having a dependent child in the household, year of survey and region of residence, weighted to represent the population. The odds ratios for different groups are combined by averaging the log odds ratios of each ethnic group coefficient relative to the reference group, thereby ignoring differences in group size between the ethnic groups. Odds ratios are statistically significant (p < .05) unless otherwise indicated (NS). The ethnic penalties are estimated by appropriate education level (highest is tertiary qualification; middle means post-secondary qualifications; low indicates at most secondary).
The GEMM experiment shows substantial discrimination of similar magnitude at all occupational levels. In the case of the DWP experiments the discrimination rates are all very imprecisely estimated, but the point estimates also suggest relatively strong discrimination at all occupational levels. In contrast, ethnic penalties are substantially lower among the higher skilled than the lower skilled subsamples. This suggests that, despite the consistently high discrimination they face, minorities are not much less likely to obtain good jobs than the majority when they are highly educated. Ethnic penalties remain substantial among the lower qualified, but they also seem to be relatively small compared to the estimated hiring discrimination. There may be more options for very low-status employment at this level. The middling groups, however, struggle to find jobs that match their qualifications.
Patterns of Discrimination and Penalties: A Discussion
Figure 3 compares the ethnic penalties estimated in the usual way from the LFS data with hypothetical ethnic penalties based on the rates of discrimination found in the field experiments. Instead of ethnic dummies the model includes the hiring discrimination rate specific to each group as estimated in the field experiments. The counterfactual ethnic penalty is then the predicted employment penalty compared to the white British majority for minority respondents experiencing the group-specific discrimination rate (all other controls being included).
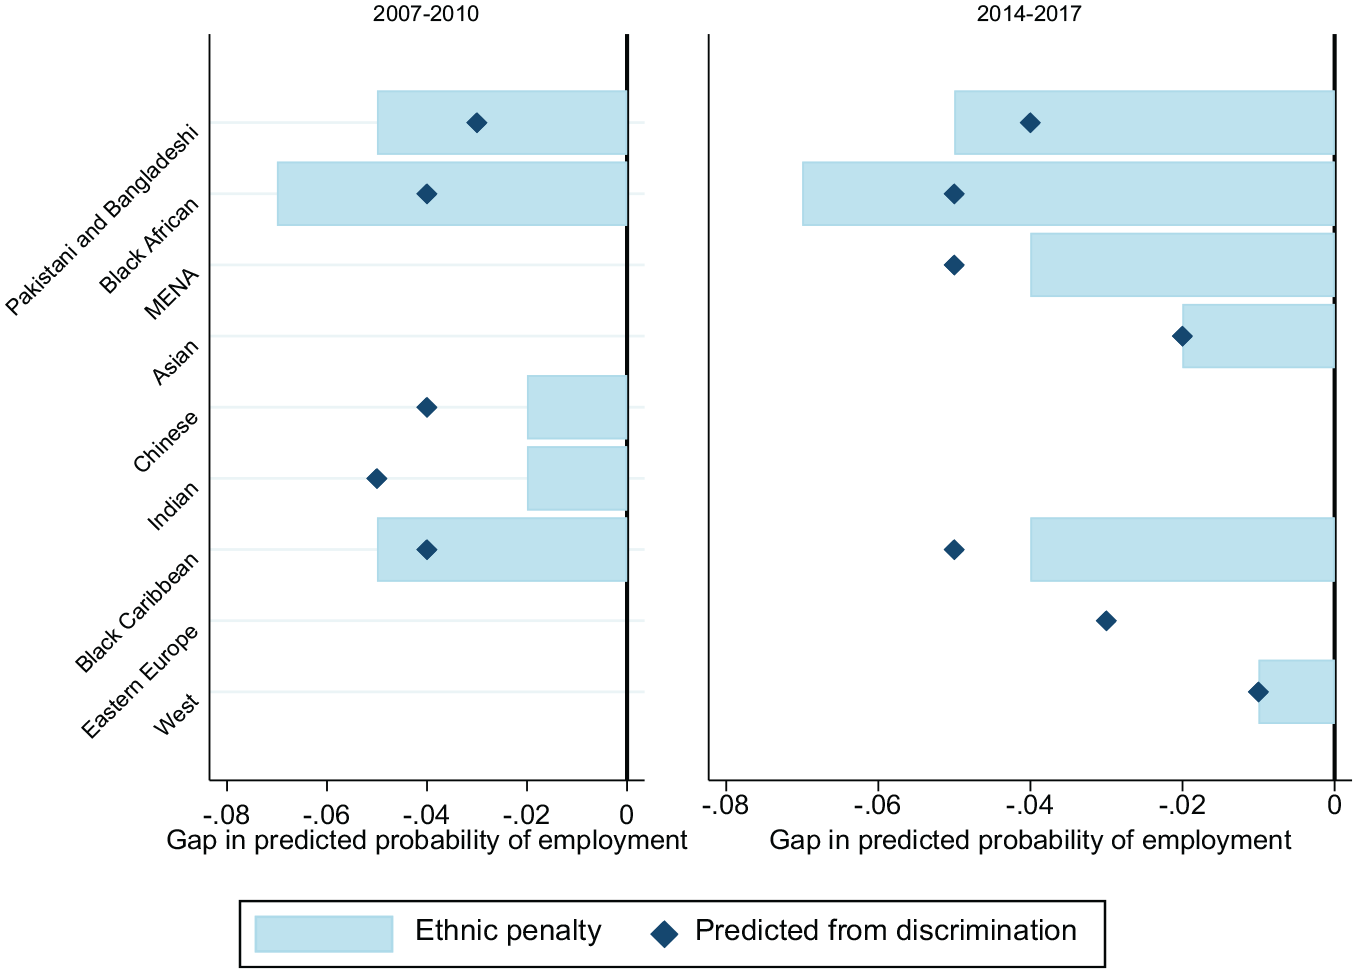
Ethnic penalties in employment, estimated from survey data and predicted from field experiments.
Comparing the two sets of estimates points to three clusters of minorities. First, a cluster of minorities with high employment penalties that match their relatively severe hiring discrimination: black African, Pakistani/Bangladeshi, Middle Eastern and North African, and black Caribbean. Second, a cluster of minorities facing low employment penalties in line with lower hiring discrimination: white western minorities, and Asian minorities in the GEMM results. Third, minorities with lower employment penalties than would be expected given their substantial hiring discrimination rates: Chinese and Indian minorities in the DWP results, and Eastern European minorities in GEMM.
These differences in ethnic penalties at different levels of discrimination point to the need to focus on the different potential mechanisms operating on the supply-side (Modood and Khattab, 2016). In this section we discuss two broad possible mechanisms which could generate the differences shown in Figure 3: selectivity and strategic behaviour.
First, differences between ethnic groups in their resilience to hiring discrimination may reflect remaining unobserved characteristics resulting for example from the initial selectivity of these groups. The children of more positively selected migrant groups benefit from higher aspirations, more parental support and resources, and a stronger community network (Ichou, 2014; Van de Werfhorst and Heath, 2019). In their comparative study on the selectivity of migration by ethnic groups, Van de Werfhorst and Heath (2019) show black African migrants to be most positively selected in terms of their education compared to non-migrants, followed by Chinese and Indian migrants. Pakistani are weakly positively selected, while black Caribbean and Bangladeshi migrants are weakly negatively selected compared to stayers. The initially strong positive selection of Indian and Chinese migrants might explain some of the resilience of these communities, but this explanation falls short of explaining the worse outcomes for black Africans.
Second, minorities may react to (perceived) discrimination on the labour market by avoiding discriminatory employers. One option to do this is through a higher reliance on self-employment (Light, 2005; Modood and Khattab, 2016). A recent study does indicate that self-employment is more often due to economic necessity for ethnic minorities than for white British (Brynin et al., 2019). Based on the UKLFS sample (Tables 1a and 1b) self-employment is highest among Pakistani/Bangladeshi, Eastern European and North African and Middle Eastern minorities; and in 2007–2010 also for Chinese and to some extent Indian minorities. A higher rate of self-employment may therefore play a limited role in overcoming disadvantage but does not explain differences between groups and the enduring disadvantage of Pakistani and Bangladeshi minorities well enough.
The public sector is sometimes put forward as a fairer employer where discrimination would play less of a role (Wood et al., 2009), although recent research in Denmark suggests this may not be true (Villadsen and Wulff, 2018). In the UKLFS sample only black Africans and black Caribbeans are more likely than the white British to work in the public sector, while South- and East-Asian workers and East-European workers do not have high probabilities of working in the public sector, indicating it is unlikely that strategic employment in the public sector explains the relatively favourable outcomes (relative to those expected) observed for Indian, Chinese and East-European minorities in Figure 3.
Another strategy to avoid discriminatory employers is to cast a wider net and apply to any job, including jobs below one’s skill levels (Pager and Pedulla, 2015). This would reduce the employment gap while resulting in minorities working in lower quality jobs compared to similar white British. We therefore compare the ethnic penalties in employment with the ethnic penalties in occupational status, measured as the international socio-economic index (ISEI) (Ganzeboom et al., 1992), conditional on being employed. Results are available in Tables A2a and A2b in the online Appendix A. The groups with high employment penalties also face substantial ethnic gaps in occupational status, while the occupational status gaps are positive for Indian and Chinese workers (2007–2010) and western minorities (2014–2017). The ethnic penalties in occupational status are very high for Eastern European minorities (2014–2017) however. Combined with the earlier finding of an ethnic premium in employment for Eastern Europeans, this analysis suggests that this group may achieve high employment at the cost of working in lower quality jobs (Johnston et al., 2015).
Minorities may search for jobs through their social networks rather than other methods when faced with high (perceived) discrimination. Several studies do indeed find that ethnic minorities in the UK are more likely to search for work through social networks than the majority group (Battu et al., 2011; Giulietti et al., 2013). Chinese, Indian and Pakistani/Bangladeshi job seekers in the 2007–2010 UKLFS rely more on social networks than the white British majority or black Africans and black Caribbeans, although their higher search through networks does not always result in a higher rate of jobs found through networks. In the 2014–2017 UKLFS the use of networks in job search is highest for Eastern Europeans, North African and Middle Eastern minorities, Pakistani/Bangladeshi and Asian minorities.
Network use alone does not therefore fully explain the combination of patterns shown in Figure 3. However, social networks may be a successful strategy only for the more resourceful communities who can provide support in finding good jobs – such as Chinese, Indian or ‘other white’ minorities – while more disadvantaged groups such as Pakistani and Bangladeshi minorities would not have access to similar resources and support within their ethnic networks (Zhou, 2005). Previous studies showed that the effectiveness of minorities’ social networks depends on the resources available within often ethnically segregated communities (Dustmann et al., 2016; Patacchini and Zenou, 2012). If groups facing high discrimination have to rely more on their social networks for finding good employment, socio-economic differences at the group level – which reflect the resources and type of information available within the ethnic network – will carry over through time and replicate differences between groups. This reasoning is consistent with results from a recent study conducted in the USA, showing that white and black job seekers have similar access to networks, but differential returns due to the lower likelihood that blacks’ contacts mobilize key resources leading to job placement (Pedulla and Pager, 2019). A similar mechanism may be driving our results. The groups that do relatively better than expected are also the groups with generally better educational outcomes and socio-economic resources (Modood, 2005), in combination with higher reliance on social networks in the job search.
Descriptively then, the patterns shown in Figure 3 cannot be fully explained by only looking at differences in selectivity, or differential job search strategy. The combination of high reliance on social networks for some minority groups, such as Chinese, Indian and Eastern European, combined with high resources within the own community, may however explain their relatively better-than-expected labour market outcomes. However, this is a tentative conclusion that needs to be empirically tested in future studies.
Robustness Tests
We test the robustness of these results using four different specifications. First, we restrict the sample in the LFS to reflect the experimental CVs more closely in terms of age, nationality, qualifications and work experience. Second, we re-estimate the ethnic penalties using the UK Household Longitudinal Study (UKHLS) instead of the LFS. Neither of these tests changes the hierarchy of ethnic penalties. Third, we test whether group differences in cultural values or norms as well as language skills can function as drivers of ethnic penalties as well as driving hiring discrimination. Including these concepts does not change the ethnic penalties in a meaningful way. Finally, we split up the analyses by gender. Results are generally consistent, but ethnic discrimination seems overall worse for Asian women than men. These tests and their results are presented in full in Appendix C in the online supplementary material.
Conclusion
We argue that to understand the occurrence of ethnic disadvantage in the labour market, data on hiring discrimination obtained from field experiments must be connected to observed labour market outcomes. Using data from recent experimental studies on labour market discrimination in the UK together with representative data from the UK Labour Force Survey for comparable groups, we show a sizeable positive relation between the degree of ethnic discrimination recorded in field experiments and the overall disadvantage faced by ethnic minorities on the labour market. This strongly suggests that ethnic penalties reflect hiring discrimination, and generally groups that experience worse hiring discrimination also have higher ethnic penalties in employment.
The extent of congruence between ethnic discrimination and labour market outcomes varies strongly between groups, however. The congruence is greatest among black African, African and Middle Eastern and Pakistani/Bangladeshi minorities, who are most consistently discriminated against and who also experience substantial employment gaps. At the other end, western-origin minorities face little discrimination and little ethnic disadvantage. In contrast, the congruence is weaker among Indian and Chinese minorities who are discriminated against but do not experience ethnic penalties as high as would be expected based on the level of discrimination recorded in field experiments. We also find that the more highly qualified, while still discriminated against, are more resistant to this disadvantage and able to find appropriate work, while those with middle and lower qualifications face more struggles in finding appropriate jobs.
We discuss possible reasons that may account for these differences. While we do not test these explanations directly, we propose that some of the better-performing ethnic groups might have access to more resourceful social networks that can help in finding jobs through other channels than responding directly to vacancies.
While this article provides a start, future work must connect the growing number of field experimental studies on discrimination to labour market outcomes as observed in corresponding populations. By gathering more data on why discrimination results in large ethnic penalties for some groups and fewer for others it may be possible to find ways to combat discrimination more effectively. Shifting attention to the strategic search behaviour of ethnic minorities would also mean recognizing that these groups have agency and that their labour market success is not unilaterally determined by employers’ discretion. Future research therefore likely requires more detailed data on the job search process and on the resources of the ethnic community in the face of perceived or anticipated discrimination.
Supplemental Material
sj-pdf-1-soc-10.1177_0038038520966947 – Supplemental material for Ethnic Penalties and Hiring Discrimination: Comparing Results from Observational Studies with Field Experiments in the UK
Supplemental material, sj-pdf-1-soc-10.1177_0038038520966947 for Ethnic Penalties and Hiring Discrimination: Comparing Results from Observational Studies with Field Experiments in the UK by Wouter Zwysen, Valentina Di Stasio and Anthony Heath in Sociology
Footnotes
Funding
The authors disclosed receipt of the following financial support for the research, authorship and/or publication of this article: this research is part of the GEMM (Growth, Equal Opportunities, Migration and Markets) project, funded through the European Union’s Horizon 2020 research and innovation programme under grant agreement No. 649255.
Supplemental material
Supplemental material for this article is available online.
Notes
References
Supplementary Material
Please find the following supplemental material available below.
For Open Access articles published under a Creative Commons License, all supplemental material carries the same license as the article it is associated with.
For non-Open Access articles published, all supplemental material carries a non-exclusive license, and permission requests for re-use of supplemental material or any part of supplemental material shall be sent directly to the copyright owner as specified in the copyright notice associated with the article.