
Abstract
Research has led to broad agreement among scientists that anthropogenic climate change is happening now and likely to worsen. In contrast to scientific agreement, US public views remain deeply divided, largely along ideological lines. Science communication has been neutralised in some arenas by intense counter-messaging, but as adverse climate impacts become manifest they might intervene more persuasively in local perceptions. We look for evidence of this occurring with regard to realities and perceptions of flooding in the northeastern US state of New Hampshire. Although precipitation and flood damage have increased, with ample news coverage, most residents do not see a trend. Nor do perceptions about past and future local flooding correlate with regional impacts or vulnerability. Instead, such perceptions follow ideological patterns resembling those of global climate change. That information about the physical world can be substantially filtered by ideology is a common finding from sociological environment/society research.
Keywords
Introduction
‘We can see it, and we can feel it.’ President Obama in a White House video on climate change, 3 August 2015.
By late 2015 human activities had raised atmospheric carbon dioxide (CO2) concentrations past 400 parts per million, levels unseen for millions of years. Barring significant reductions in fossil fuel use and deforestation, a doubling of pre-industrial CO2 levels (from about 280 ppm) will occur in the first half of the 21st century. The timing and priority of disruptions from greenhouse warming and ocean acidification are topics of ongoing study, but there is an extensive and growing body of research leading to broad agreement among scientists that these problems are substantial, with effects that are already being felt. This scientific consensus has been strongly expressed through interdisciplinary reviews (IPCC, 2013; Melillo et al., 2014), statements by leading science organisations (e.g., AGU, 2013), direct surveys of scientists (Doran and Zimmerman, 2009), and published scientific reports (Anderegg et al., 2010; Cook et al., 2013; Oreskes, 2004). Widespread concern among active scientists is unmistakable at major conferences and in journals.
Recent adverse consequences attributed (with varied confidence) to greenhouse gas buildup include floods, droughts, wildfires, heatwaves, rising sea levels or the poleward spread of invasive species, insect pests and disease in various parts of the world. The United States, as the second-largest direct emitter of CO2 (after China) but having also a large indirect footprint as a global consumer, must play a key role in achieving meaningful reductions. In stark contrast to the evidence-based consensus among scientists, however, US public and political views on the reality of this problem remain deeply divided (Hamilton et al., 2015a; McCright and Dunlap, 2011; Marquart-Pyatt et al., 2014; Wiest et al., 2015). Prominent politicians repeat accusations that climate research is a ‘hoax’, or seek to defund even satellites that study the Earth (Samenow, 2015). Ideological news media lead in efforts to discredit climate science (Feldman et al., 2011).
Scientific evidence apparently is not getting past the intense counter-messaging (Boussalis and Coan, 2016; Mann, 2013; Oreskes and Conway, 2010) to reach a large segment of the US public. Science communication often adopts a ‘post-political’ framing (Anshelm and Hultman, 2014; Kenis and Lievens, 2015; Wilson and Swyngedouw, 2015) that problematises CO2 itself, without addressing the economic and political forces behind it. Such framing leads to emphasis on technical or behavioural solutions (Dunlap and Brulle, 2015a). Opposition to science and CO2 reductions, on the other hand, has been vociferously political. Sociologists cognisant of economic and political forces have studied this opposition, but less commonly as part of interdisciplinary teams (Dunlap and Brulle, 2015b). The separation of disciplines goes both ways, with mainstream sociology inclined to downplay the importance of biophysical conditions for modern industrial societies (Dunlap, 1980).
But perhaps biophysical conditions, in the unwelcome form of harm from extreme weather events, will intervene more persuasively than science. That may have happened with certain storms, heatwaves or droughts elsewhere in the world, where political rejection of climate science is less entrenched (Lee et al., 2015). Could it shift US public opinion as well, with local events acting as a ‘gateway drug’ to open thinking about global change (Cutler, 2015; Leiserowitz et al., 2012)? This article describes research exploring that question, but finds an odd disconnect between realities and perceptions of flooding in the northeastern US state of New Hampshire.
Appropriately for this interdisciplinary topic, the authors include physical and social scientists, drawing on diverse kinds of data. Our hypothesis of a relationship between New Hampshire flooding realities and perceptions originated with a climatologist (Wake), who also developed flood history and climate content for this article. To measure flooding perceptions, statewide survey questions were designed and analysed by a sociologist (Hamilton), while a geographer (Hartter) and a sociologist (Safford) contributed additional survey data from interdisciplinary projects elsewhere. Another sociologist (Puchlopek) examined archives of news-media flood coverage. Thus the conceptualisation, data collection, analysis and interpretation involved collaboration across disciplines, which is essential for well-grounded environment/society research.
The Great Climate Change Divide
Partisan and ideological divisions stand out dramatically in surveys of US public opinion about climate change. Liberals and moderates (or Democrats and Independents) tend to agree that anthropogenic climate change is real, while conservatives (or Republicans and especially Tea Party supporters) more often reject it (Hamilton and Saito, 2015; Shwom et al., 2015). These divisions widened in the 21st century (McCright and Dunlap, 2011) and may now exceed those on hot social issues such as gun control or abortion (Hamilton, 2014). Political indicators dominate among individual characteristics as predictors of climate-change beliefs (Hamilton et al., 2015a; McCright et al., 2014a).
Some other characteristics, notably gender and education, show effects on climate beliefs as well. An education×politics interaction has been widely replicated (Hamilton, 2008, 2011; Hamilton et al., 2015a; McCright, 2011; McCright and Dunlap, 2011), along with similar interactions including objectively-assessed science knowledge (Hamilton et al., 2012), numeracy (Kahan et al., 2012) or self-assessed understanding (Hamilton, 2011; McCright and Dunlap, 2011) in place of education; and politics indicated by questions about party, ideology or worldview.
Where research permits comparisons, regional differences stand out too and can rival individual-level political effects in magnitude (Hamilton and Keim, 2009; Hamilton et al., 2014). Place-to-place variations in views of climate change reflect cultural, economic and geographical/climatic factors, with net impacts that are easy to see but hard to untangle. Geographic vulnerability or recent experience with climate-related disasters arguably should have great influence, but in practice the geographic variations often seem more related to economics and culture.
Studies commonly depict the political divide through analyses that separate the parties. Figure 1 offers a different visualisation. Data points are 25 US counties surveyed with 104 to 883 interviews per county (over 10,000 in all) during 2010 to 2014 for the Community and Environment in Rural America (CERA) and Communities and Forests in Oregon (CAFOR) research projects. Hamilton et al. (2014) provide an overview of CERA and CAFOR with citations to earlier studies.
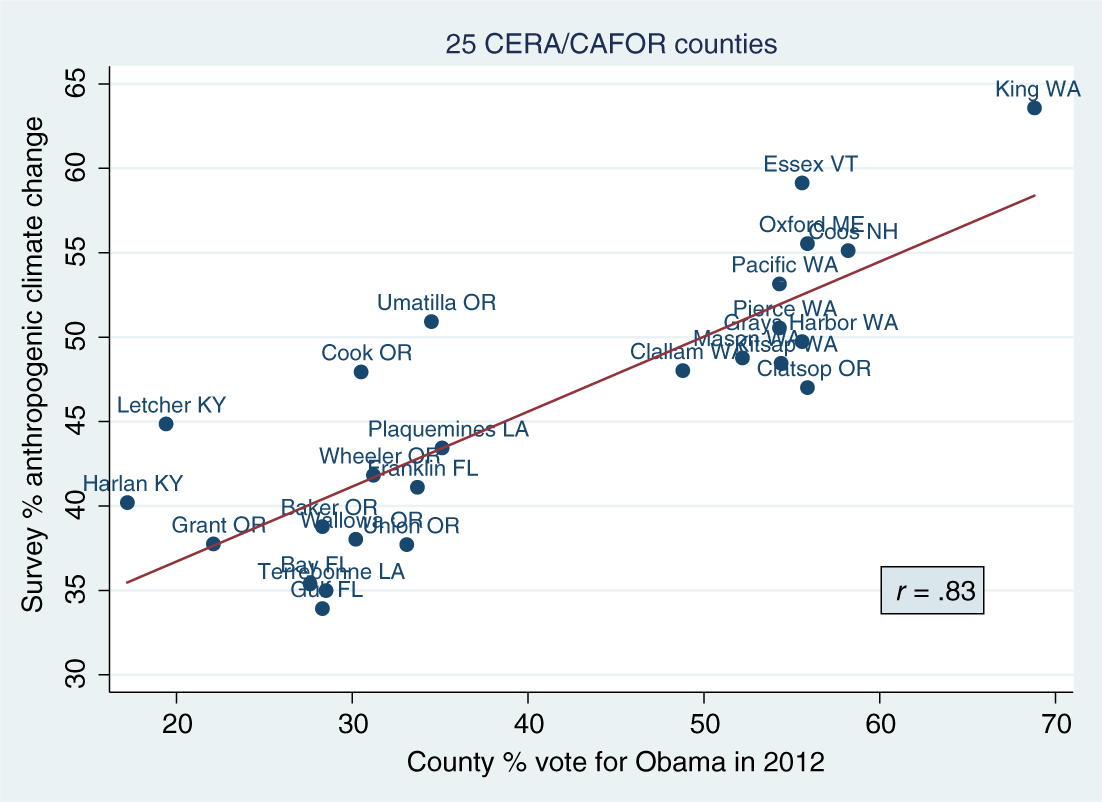
Percentage accepting anthropogenic climate change from CERA or CAFOR surveys (10,422 interviews conducted 2010 to 2014) vs county per cent vote for Obama in 2012, across 25 US counties.
The CERA/CAFOR surveys carried a standard question on climate change, shown here with percentages from the nationwide 2012 General Social Survey (Hamilton et al., 2015a):
Which of the following three statements do you personally believe?
Climate change is happening now, caused mainly by human activities. (53%) Climate change is happening now, but caused mainly by natural forces. (39%) Climate change is NOT happening now. (4%)
Respondents could also say they do not know, or give no answer (3%). Order of response choices was rotated to avoid bias. A now/human response corresponds to the main point of consensus statements by science organisations, providing a robust indicator for individual acceptance of anthropogenic climate change with high criterion validity (Hamilton and Saito, 2015; Hamilton et al., 2014). Figure 1 graphs the weighted CERA/CAFOR percentage of now/human responses against each county’s vote for Obama in the 2012 presidential election (New York Times, 2012).
The +0.83 correlation between county-level climate beliefs and voting seems remarkable given the imprecision of survey sampling, conducted over a period of five years. Certainly the CERA/CAFOR counties are a nonrandom selection from the US. Are these results a fluke? Few other climate-survey datasets provide local resolution on so many small places, but Figure 2 presents a modest replication using data from all 10 counties of New Hampshire, where the same climate question has been asked in more than 13,000 interviews (305 to 3725 per county) since 2010 (Hamilton et al., 2015a). A correlation of +0.88 between New Hampshire county-level climate beliefs and presidential voting again is striking.
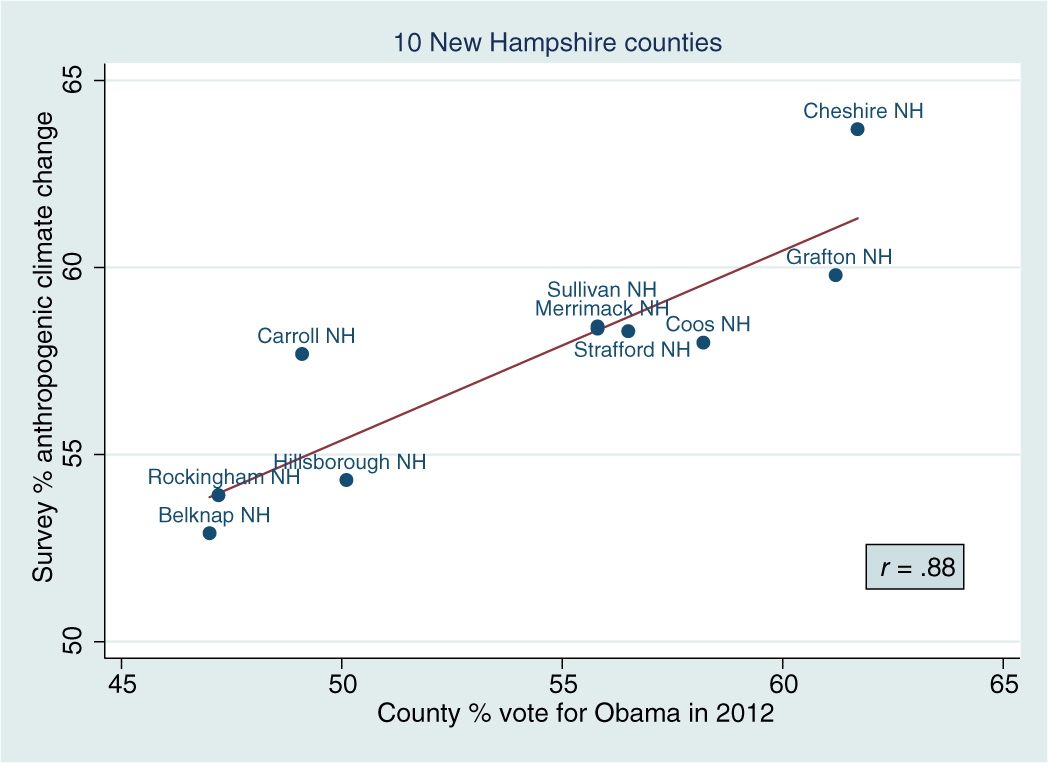
Percentage accepting anthropogenic climate change from Granite State Poll surveys (13,677 interviews conducted 2010 to 2015) vs county per cent vote for Obama in 2012, across 10 New Hampshire counties.
Results from these two sets of counties invite further replication, although their consilience is initially impressive. A recent article applied statistical downscaling methods to extract county-level estimates of climate change beliefs from national-level survey data (Howe et al., 2015). A validation test found a correlation around +0.5 between the downscaled estimates and direct measures from a set of county surveys similar to those plotted in Figure 1 (Hamilton et al., 2015b). That correlation was interpreted as modest support for the downscaling approach, but now seems overshadowed by stronger correlations between Obama vote percentages and direct measures in Figures 1 and 2. From this evidence, vote percentages might provide a practically superior, although theoretically unsatisfying, proxy for county-level climate beliefs.
The scatterplots dramatise how deeply politicised even local opinion has become about global change. Local polarisation extends also to perceptions of local weather that might evoke global change – such as increased flooding in the state of New Hampshire.
New Hampshire Flood Realities
Global mean surface temperatures have risen at a rate of roughly 0.17 °C per decade since 1970. Some seasons and places have warmed faster, but even so the change in mean temperature remains small compared with daily weather. Consequently, many people do not experience warming directly, though it might be clear statistically or through impacts on ecosystems and seasons. More tangible, although causally ambiguous, signals come from weather-related disasters.
In New Hampshire such disasters most often involve flooding. Figure 3A graphs federal expenditures on flood-related disasters from 1990 to 2014 (FEMA, 2015) to make a key point: the frequency and damage from floods became dramatically higher starting in 2005. Large events include the Alstead/Keene floods (October 2005), Mother’s Day Flood (May 2006), Patriots Day Flood (April 2007) and Hurricane Irene (September 2011).
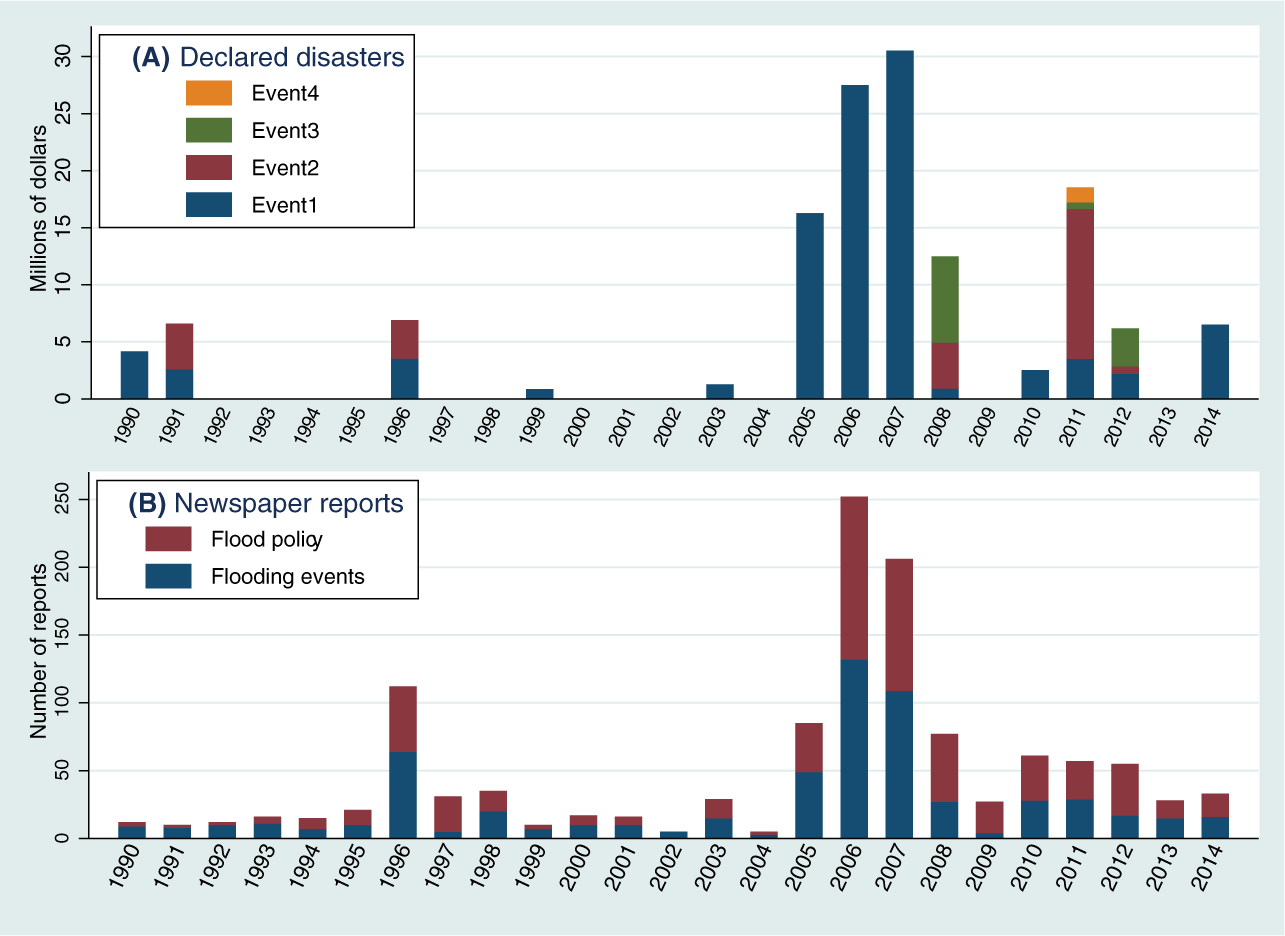
(A) Federal expenditures on flood-related presidentially declared disasters and emergency declarations in New Hampshire, in constant 2014 dollars; (B) Number of reports about New Hampshire flood policy/planning and flooding events in the Union Leader.
Figure 3B tracks news about flooding. Shown are annual counts of reports in the state’s leading newspaper, the New Hampshire Union Leader, based on 1990–2014 archives. We categorised articles as being mainly about New Hampshire flooding events, about New Hampshire flood policy or planning, or about flood issues elsewhere (fewer and not graphed). Results in Figure 3B depict a large increase in flood-related articles starting in 2005, roughly following the disasters graphed in Figure 3A.
Disaster declarations and newspaper reports are social constructs, but the increase in flooding was physical. Geographically, the White Mountains in northern New Hampshire serve as the headwaters for four of New England’s major rivers. The Androscoggin and Saco rivers flow east into Maine, while the Connecticut and Merrimack rivers flow south into Massachusetts. Many small rivers make up a coastal watershed that reaches the Atlantic mostly through the Piscataqua River. European-Americans originally settled along these rivers and their tributaries, and there was a subsequent movement of people to cities and larger villages on rivers during a period of water-powered industrialisation in the mid-19th century. The historical settlement pattern places communities at risk of flooding, the most costly natural hazard that New Hampshire experiences.
In response to the damage caused by floods in the first half of the 20th century, the US Army Corps of Engineers built flood-control dams and reservoirs on the Connecticut and Merrimack Rivers and their tributaries (FEMA, 2006, 2010; Olson, 2008). Despite flood control efforts, flooding has recently increased. A series of closely spaced floods (Flynn, 2008; NH-CFMC, 2008; Olson, 2006, 2007) damaged infrastructure and caused loss of life in the populous southern half of the state. Analysing long-term flow records for New England watersheds with minimal human influence, Collins (2009) concludes that flood magnitudes in New Hampshire and across New England have increased since 1970. Armstrong et al. (2012, 2014) show that the magnitude and frequency of floods across New England are increasing, again on rivers with minimal human impact. Other analyses confirm increases in both precipitation and extreme precipitation events in New England (Douglas and Fairbanks, 2011; Hayhoe et al., 2007; Hodgkins and Dudley, 2011; Melillo et al., 2014; Spierre and Wake, 2010). The causes of rising flood damage in New Hampshire include both an increase in impervious cover (i.e., buildings and pavement) associated with urban development (Nowak and Greenfield, 2012) that serves to increase runoff; and the increase in extreme precipitation events, especially in the southern half of the state (Wake et al., 2011a, 2011b).
Attribution is difficult for individual weather events, but theory and trends point toward global change. For example, overall precipitation across the US has increased, as have the frequency and magnitude of the heaviest rainfall events (Walsh et al., 2014). Warmer air can contain more water vapour compared to cooler air, and the amount of atmospheric water vapour has increased over land and oceans (Santer et al., 2007). More water vapour in the atmosphere means there is more water that can fall as rain. Dynamical aspects of the atmosphere change, influencing weather patterns and storms. In mid-latitudes such as New England, there has been an increase in extreme precipitation events associated with fronts (Kunkel et al., 2013). Projections of future climate suggest that the recent trend towards increased heavy precipitation events will continue in the northeastern US (Hayhoe et al., 2007) and across the country (Wuebbles et al., 2013).
For a local view of consequences, Figure 4A graphs daily discharge records from a gauge on the Lamprey River, a substantial tributary in the coastal watershed of southeast New Hampshire. Horizontal lines mark the top one per cent of daily discharge, and also the level (7300 cubic feet per second or cfs) described as a ‘100-year flood’ in a federal study of flood risks (FEMA, 2005). A 100-year flood is defined statistically as occurring on average once every 100 years, or with a one per cent probability in any one year. Such a discharge had been recorded only once (7360 cfs, 7 April 1987) on the Lamprey prior to the 2005 report. But this 100-year flood level was surpassed the following year – 7600 cfs on 15 May and 8400 cfs on 16 May 2006, coinciding with the Mother’s Day Flood that was more damaging in other parts of the state. The following year, on 17 and 18 April, the nominal 100-year level was passed again. Changing conditions pose a challenge for infrastructure and rules designed in a different era when climate was assumed to be stationary (Milly et al., 2008).
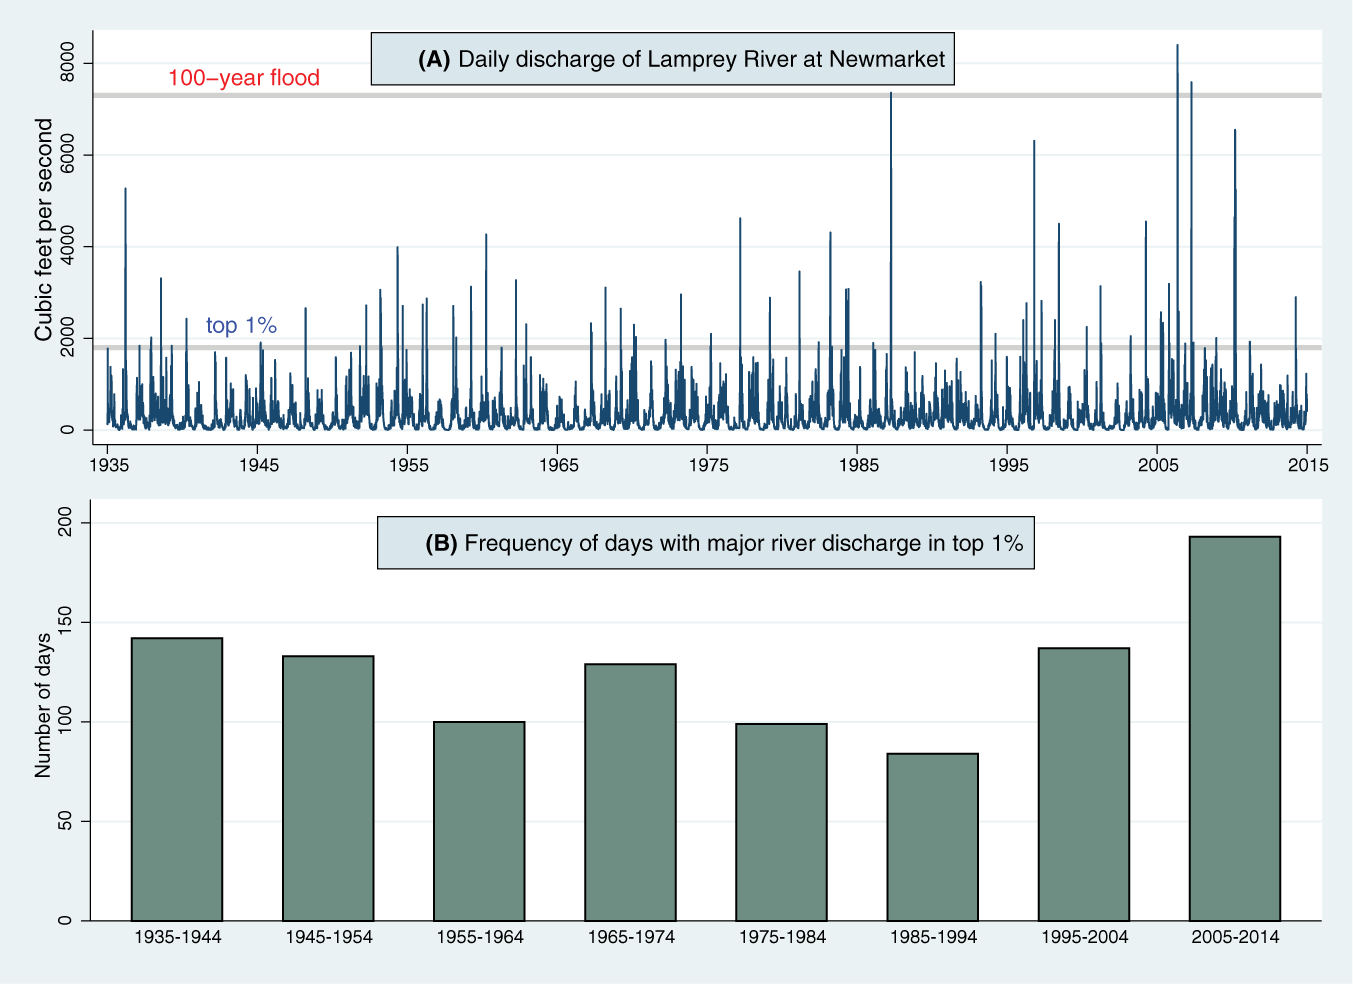
(A) Daily discharge of the Lamprey River near Newmarket in southeast New Hampshire, showing top 1% and a 2005 estimate of the ‘100-year flood’ discharge; (B) Frequency of days with discharge in the top 1% for at least one of five.
Figure 4A depicts only one river in coastal New Hampshire. Figure 4B constructs a rough statewide summary by counting the number of days each decade on which at least one of five rivers representing the state’s major drainages experienced flows in their top one per cent. Over 1985–1994 there were 84 days with high flows by this measure; the count rises to 137 for 1995–2004, and then 193 for 2005–2014, the highest decade on record.
Thus, whether measured in terms of damage, news reports or water flows, New Hampshire flooding over the past decade substantially departed from what had gone before. In the next section we test public awareness.
New Hampshire Flood Perceptions
The Granite State Poll (GSP) conducts telephone surveys interviewing random samples of New Hampshire residents four times each year. Since 2010 the GSP has carried a general climate-change question among its usual mix of political and opinion items. The climate change responses, summarised by county in Figure 2, have proven surprisingly stable through time (Hamilton et al., 2015a).
While tracking general beliefs about climate, the GSP also experiments with knowledge questions. Self-assessed understanding of climate change is high, but for an ideological subgroup this confidence appears unconnected to basic knowledge (Hamilton, 2015). Early GSP knowledge questions were global in scope, such as the meaning of ‘greenhouse effect’. Public concern and research have increasingly drawn attention to local impacts and extreme events, however. Two recent questions asked about flooding, the most visible extreme climate-linked events in this state.
Comparing the past 10 years with 20 or 30 years ago, do you think that number and size of destructive floods in New Hampshire have increased, decreased or stayed about the same?
Over the next few decades, do you think that number and size of destructive floods in New Hampshire are likely to increase, decrease or stay about the same?
Given the well-publicised rise in flood disasters, we meant to test whether public awareness of past floods, and expectations about the future, might have bypassed the deep ideological divisions afflicting global climate change. The flood questions were carried on polls in July and September/October 2015, a total of 2661 interviews. Table 1 lists these questions together with background items known to predict general climate-change views (Dietz et al., 2007; Hamilton and Keim, 2009; Hamilton et al., 2015a; Marquart-Pyatt et al., 2014; McCright and Dunlap, 2011; Shao et al., 2014; Whitmarsh, 2011; Xiao and McCright, 2007).
Flood questions, climate change, ideology and background variables. Shown with codes used for regressions in Table 2, and weighted response summaries from the July and September 2015 surveys (2661 interviews) for most questions but a larger collection of surveys (13,677 interviews) for climate.
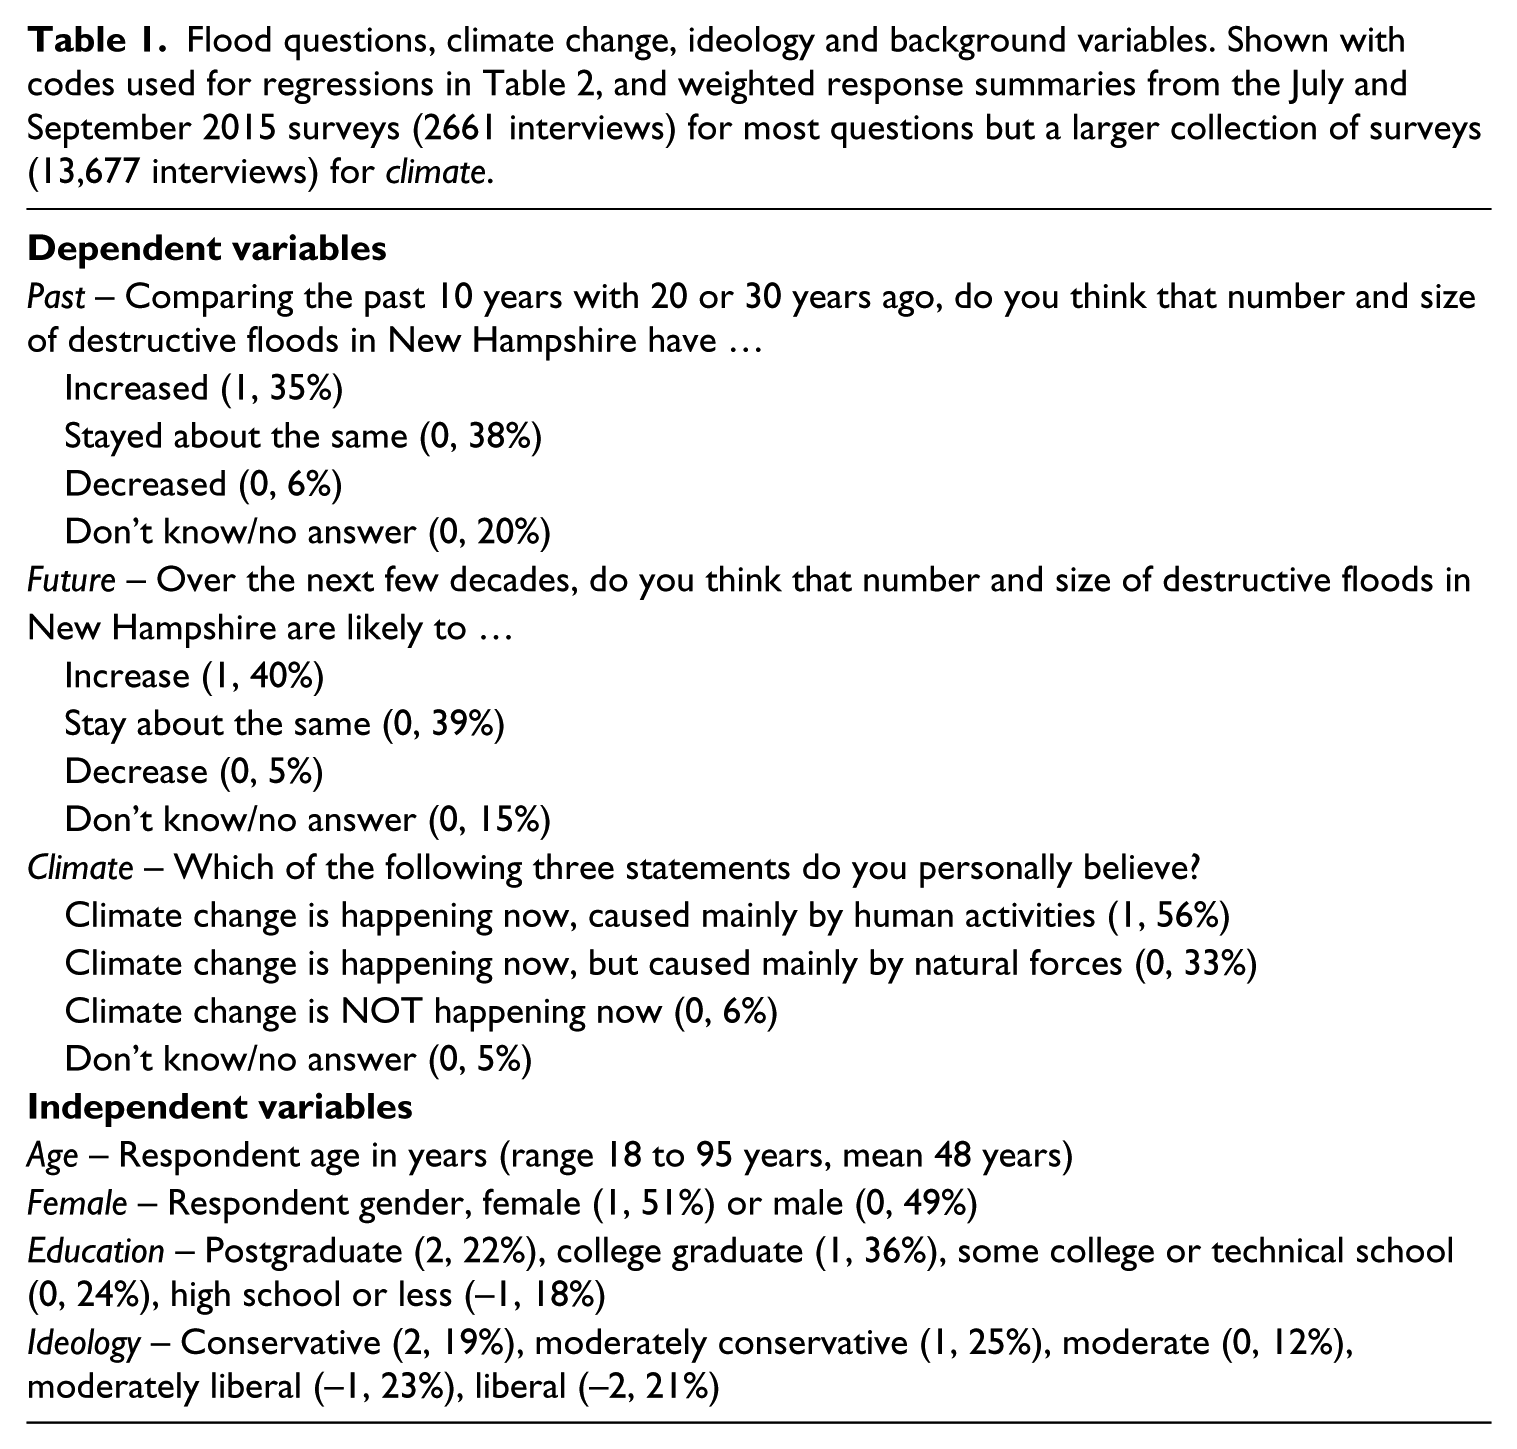
The flood question results are charted in Figure 5A and 5C. Our past-flooding item asked respondents to compare the past 10 years with 20 or 30 years ago. Figure 5B offers a relevant objective comparison: the frequency of two-day periods with four inches or more of precipitation (Menne et al., 2009; USHCN, 2015). Such extreme-precipitation events became more common in the past decade, in keeping with the rising flood volume, damages and news reports graphed earlier. Objective records notwithstanding, only 35 per cent of survey respondents think that flooding has increased. More critical to planning, just 40 per cent expect it to increase in the future.
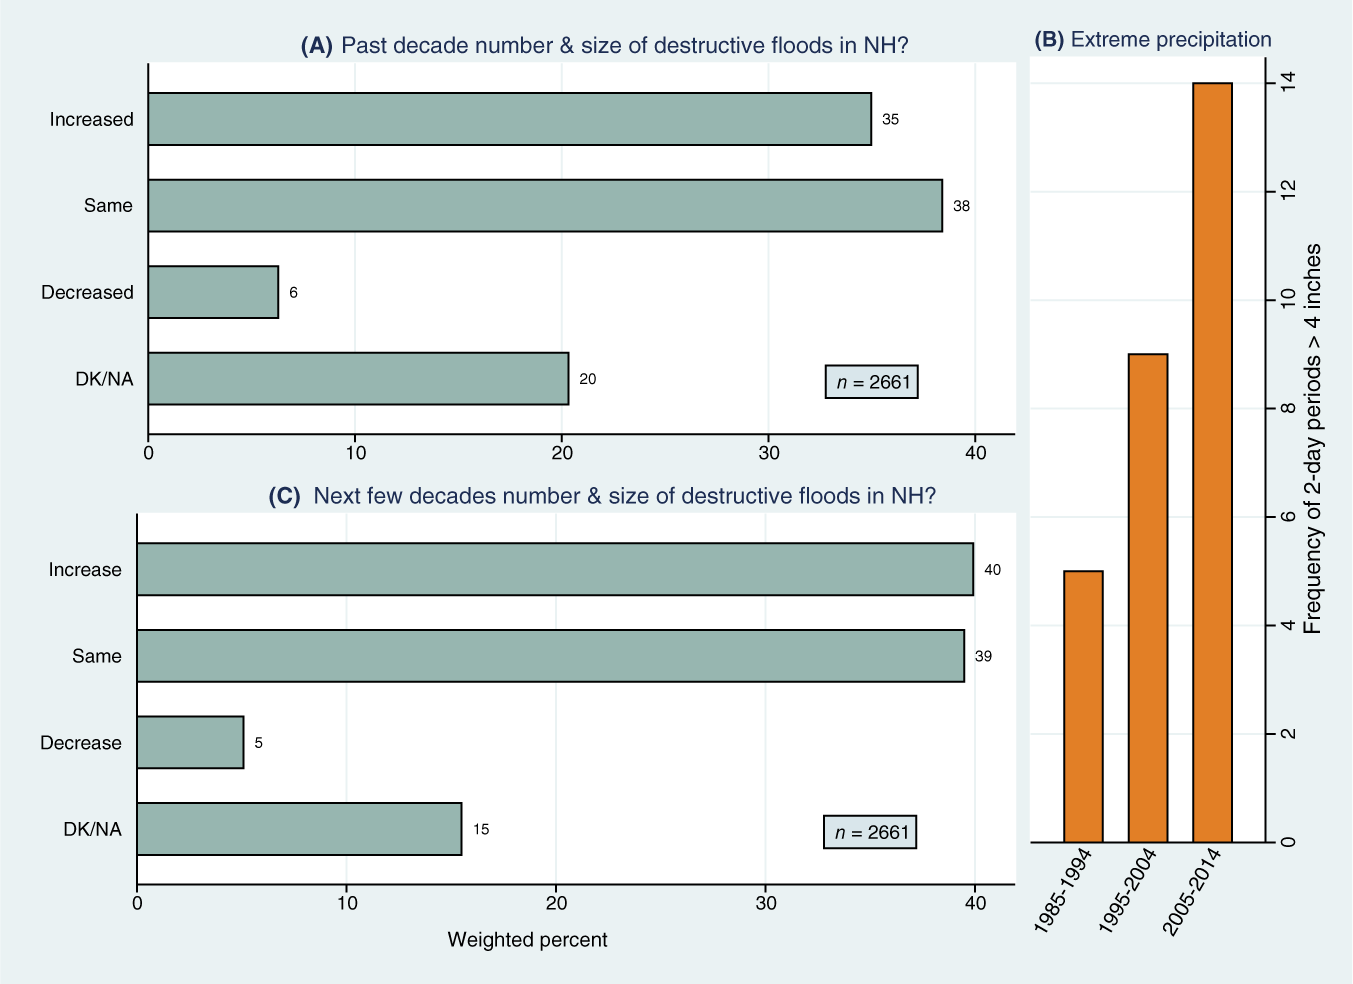
(A) Survey responses about floods in New Hampshire over the past decade compared with 20 or 30 years ago; (B) Observed frequency of extreme precipitation events by decade (from USHCN data); (C) Survey responses about floods over the next few decades.
Disconnections between public perceptions and past realities, or climatological projections for the future, align with the initial results from a study under way in eastern Oregon (Hamilton et al., 2016). Summer warming there has raised wildfire risks, while the warming itself went unnoticed by much of the public. In both regions, a plausible explanation is that most people lack firm knowledge of historical climate or future projections, unlike scientists with research reports and data. But relatively few answered either the New Hampshire flooding or the Oregon warming questions with ‘I don’t know’. Moreover, the answers they chose are not random.
General climate-change beliefs correlate with political views. Unfortunately that can apply also to perceptions regarding local climate phenomena, even when not explicitly linked to global change. Figures 6A and 6B show ideological gradients in flood responses, contradicting hypotheses that the state’s recent experiences could bypass the climate-change divide. The liberal–conservative gap amounts to 26 points on the past-flooding question, widening to 43 points on the future-flood question, which hints more obviously at climate change. The ideological gradient steepens with a 63-point gap on our direct question about anthropogenic climate change (Figure 6C). Most of the contrast between Figures 6A, 6B and 6C occurs among moderate or liberal respondents. Conservatives remain steadfast in rejecting that floods have increased in the past decade, will increase in future decades, or that humans are changing the climate.
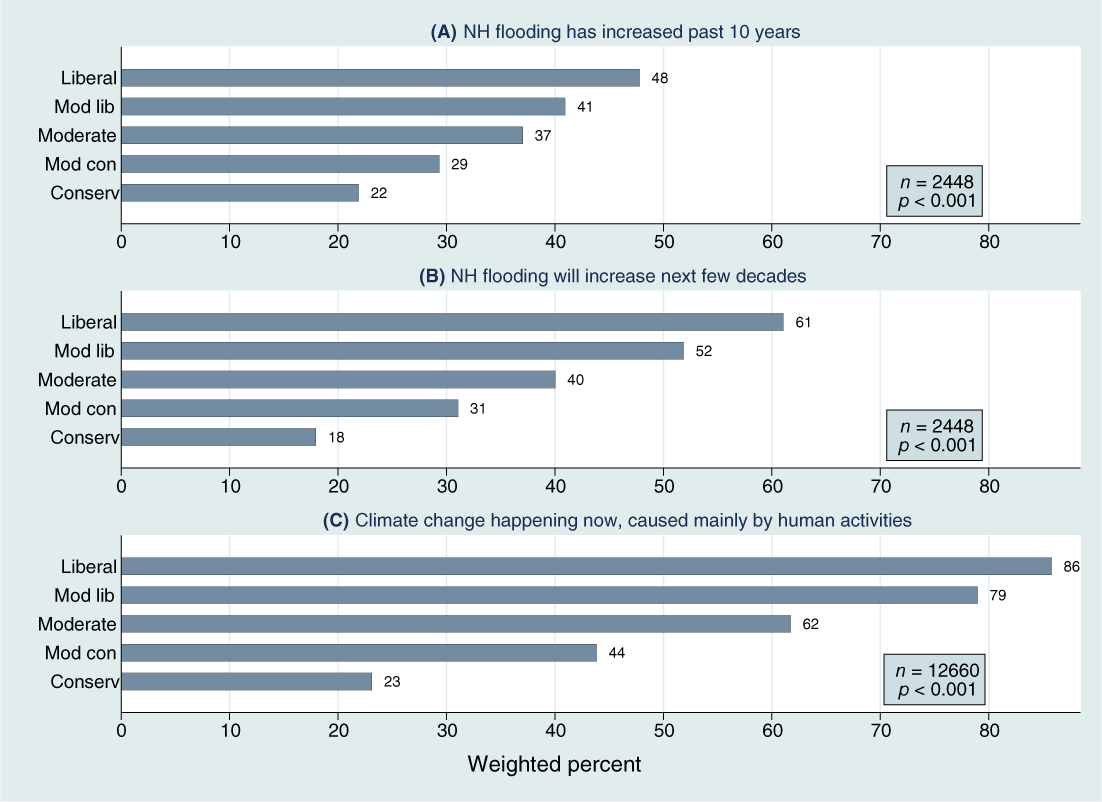
Percentage who think that (A) destructive floods in New Hampshire have increased over the past decade; (B) floods are likely to increase in the next few decades; or (C) climate change is happening now, caused mainly by human activities – by self-described ideology.
That local, physical questions about flooding evoke ideologically-scaled responses is another sign of the depth of divisions on climate. The next sections test ideological effects alongside education, demographics and geography.
Social Bases of Flood and Climate Change Beliefs
Since the paradigmatic paper by Van Liere and Dunlap (1980), a substantial literature has arisen on ‘the social bases of environmental concern’ – demographic and ideological characteristics that predict survey responses to environment-related questions. The literature by now encompasses hundreds of datasets and topics (e.g., Dietz et al., 2005, 2007; Dunlap et al., 2001; Hamilton and Safford, 2015; Hamilton and Saito, 2015; Jones and Dunlap, 1992; Klineberg et al., 1998; Olofsson and Öhman, 2008; Xiao and McCright, 2007).
Findings have converged on some overall conclusions. In US public samples, concern about environmental problems, or perceptions of environmental risks, or trust in environmental scientists (which some researchers view as measures of the same latent variable) tend to increase with education. Age and gender effects are less consistent than those of education, but environmental concern commonly decreases with age, and is higher among women than men. Political, ideology or worldview indicators prove far more consistent in predicting most environment-related views. Describing a nonpartisan ‘environmental consensus’ that existed among US public and politicians in the 1960s and early 1970s, Buttel and Flinn (1978) presciently suggested this consensus would fracture; see McCright et al. (2014b) for one confirmation that it did. In recent data, political orientation even modifies the effects of education or information variables, which are the second most important class of predictors.
These general patterns recur with our questions about flooding. Table 2 presents results from regression of flood responses on ideology and background characteristics. Dependent variables for Table 2 employ binary {0,1} coding defined in Table 1. Alternative multinomial models require three times as many parameters but reach substantially the same conclusions. The predictors in all models are a standard set known, with high reproducibility, to affect general climate change views (see Hamilton et al., 2015a for replication across 35 surveys). Representing geography, we include nine {0,1} indicators for county of residence, with Hillsborough forming the comparison category. Model 3 shows how the same predictors affect general climate change beliefs, using data from a larger set of surveys.
Ideology, background characteristics and county of residence as predictors of flood and climate change responses (variable definitions and codes given in Table 1). Odds ratios from weighted logistic regression. ‘Correctly classified’ means y = 0 and predicted probability < 0.5, or y = 1 and predicted probability > 0.5.
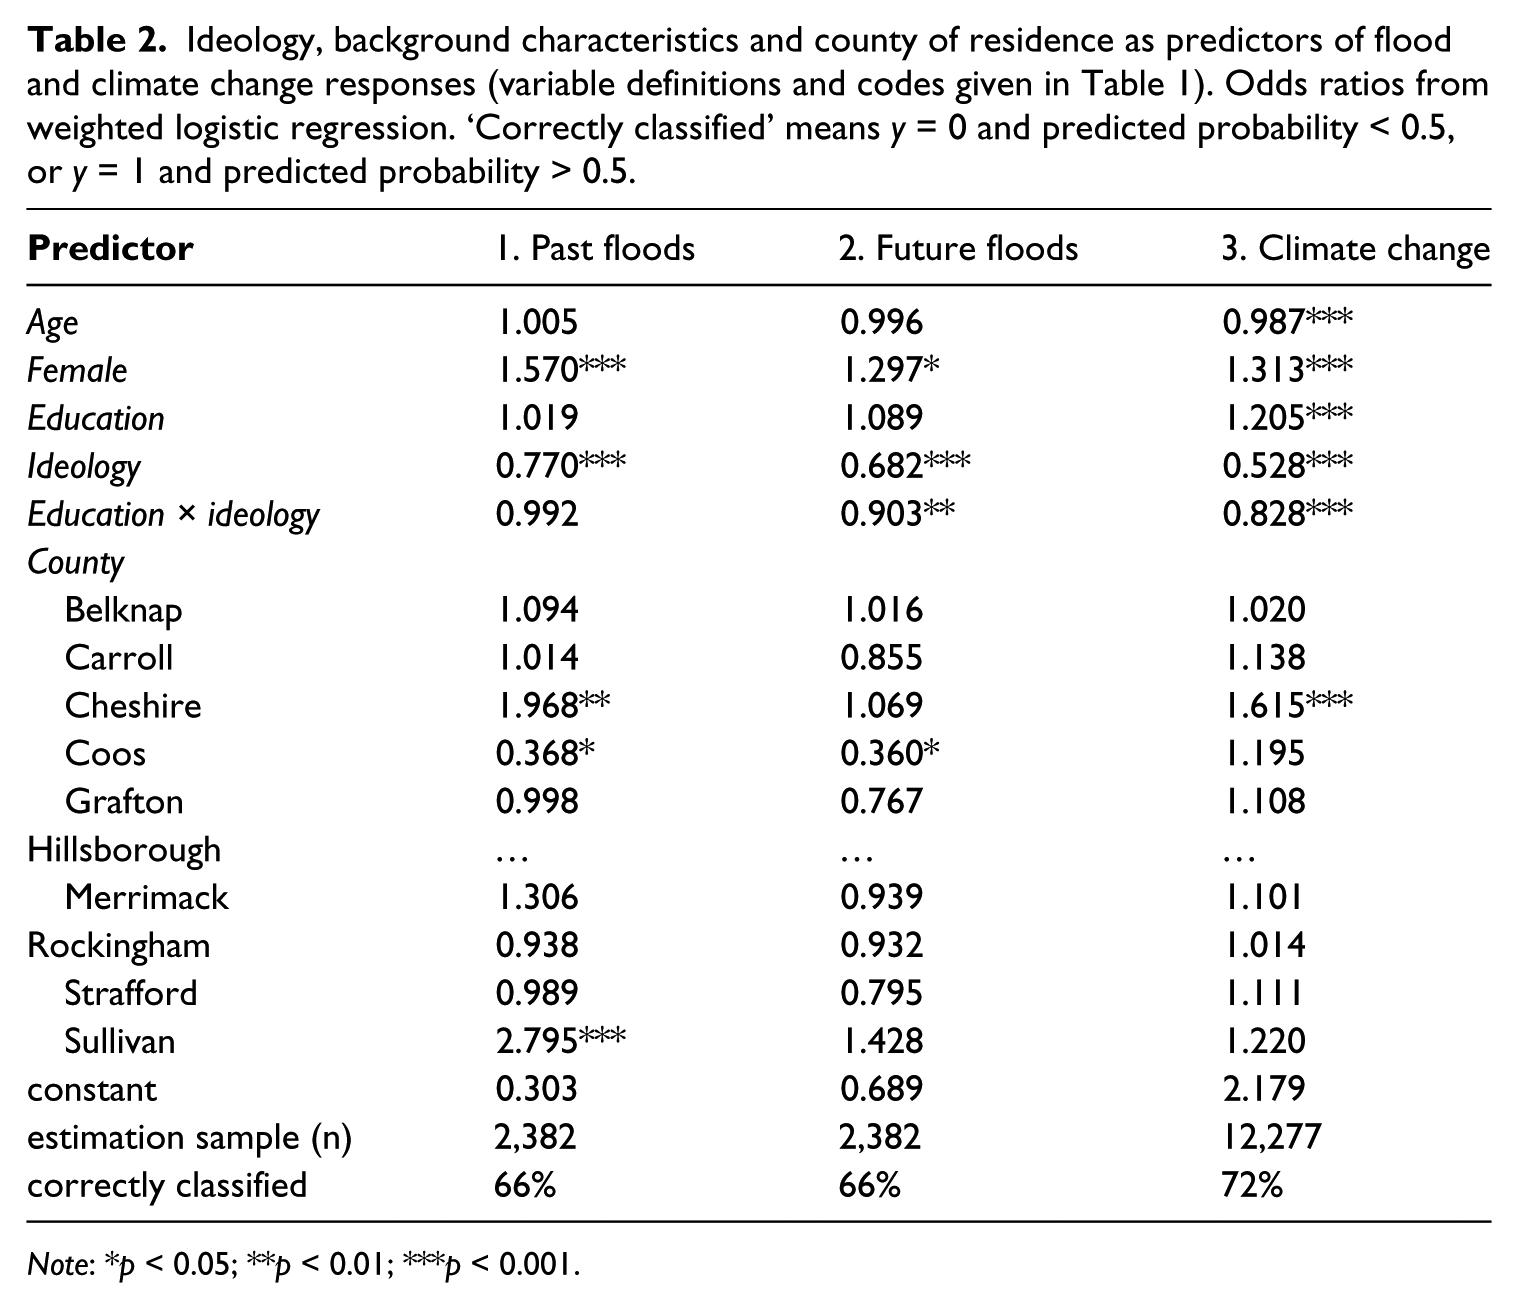
Note: *p < 0.05; **p < 0.01; ***p < 0.001.
Odds ratios in the table denote multiplicative effects on the odds of an ‘increased flooding’ or a ‘climate changing, caused by humans’ response. Ratios greater than 1.0 correspond to ‘positive’ effects; those below 1.0 correspond to ‘negative’ effects. For example, the odds of responding that flooding increased in the past decade are 57 per cent higher (multiplied by 1.57) among women compared with men, other things being equal. Similarly, the odds of a past-flooding-increased response decline by 23 per cent (multiplied by 0.77) with each point on the 5-point ideology scale, so they are 65 per cent lower (multiplied by 0.774 = 0.35) among conservatives than among liberals.
Given the variables’ coding, the main effects from ideology represent its effects among respondents with some college (education = 0). Similarly, the main effects of education represent its effects among political moderates (ideology = 0). Significant or not, most of the predictors in Table 2 affect flood responses in the same direction (odds ratios above or below 1.0) as they do climate change beliefs, seen in Model 3.
This analysis adds future flooding in New Hampshire to the growing list of environment and science topics for which information×politics-type interactions have been detected (e.g., Hamilton, 2008, 2011; Hamilton et al., 2012, 2014; Kahan et al., 2012; McCright and Dunlap, 2011; Shao et al., 2014). The education×ideology effect on future flooding responses is visualised as an adjusted marginal plot (Mitchell, 2012) in Figure 7. This graph, drawn in terms of probabilities rather than odds, shows that ideology impacts beliefs about future floods regardless of schooling. But ideological divisions are much greater among people with college or postgraduate educations. Conservatives with postgraduate education rarely think that floods will increase (predicted probability below 0.2). Liberals with postgraduate education usually do think that floods will increase (probability 0.7).
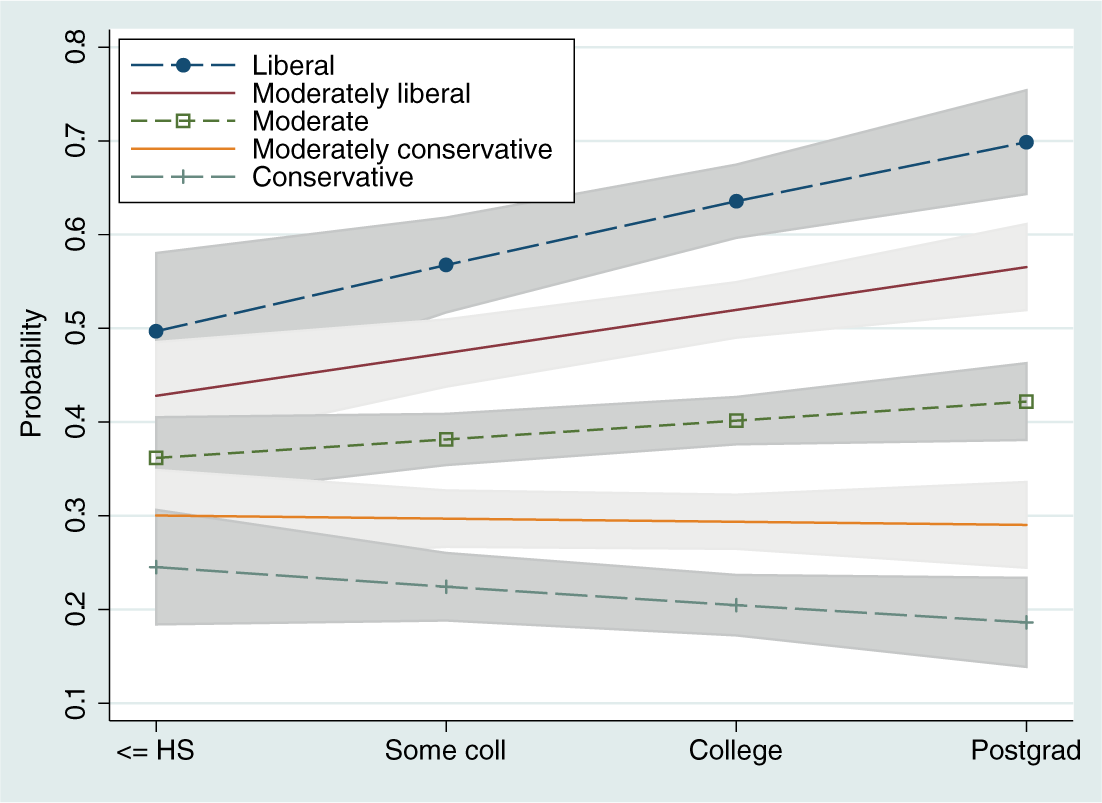
Interaction of education and ideology affects the probability of a ‘floods likely to increase in the future’ response. Adjusted marginal plot calculated from model 2 in Table 2, with 95 per cent confidence bands.
A similar interaction occurs with the general climate-change question in Model 3. Interactions of this type have been explained in the literature with reference to substantively overlapping theoretical frameworks including biased assimilation (Borick and Rabe, 2010; Corner et al., 2011; McCright and Dunlap, 2011), elite cues (Brulle et al., 2012; Darmofal, 2005; Guber, 2012; McCright and Dunlap, 2011) and cultural cognition (Kahan et al., 2011). Better educated or information-rich individuals are more aware of partisan-identified positions, and more selective in acquiring information from mass media, internet and other sources to reinforce their prejudices. Such bias theoretically could afflict people of any persuasion, as some experiments suggest (Campbell and Kay, 2014; Kahan, 2013). Consequently, one might view interactions like Figure 7 as just reflecting opposite bias among information elites on left and right. Sources of information about climate change are not really symmetrical, however, being heavily influenced by science on one hand and mainly political on the other. Thus, instead of symmetrical biases, such interactions could result from liberals and moderates being generally more inclined to credit scientific arguments, while conservatives more often reject them, on topics of controversy. Survey findings of higher liberal/moderate trust in scientists across topics ranging from climate change to nuclear power or vaccination support the latter interpretation (Hamilton, 2015b; Hamilton et al., 2015c).
How environmentalism generally and climate change in particular became such partisan topics has been studied by sociologists including Brulle et al. (2012), Brulle (2013); Jacques et al. (2008), McCright and Dunlap (2011) and McCright et al. (2014a, 2014b), who describe top-down (‘elite countermovement’) campaigns that subsequently took hold as cultural markers (Kahan et al., 2011). We interpret the ideology and education×ideology effects in Table 2 and Figure 7 as evidence that ideologically-informed beliefs about climate change can generalise, in many people’s minds, to shape thoughts about past and future local floods.
Hillsborough county, New Hampshire’s most populous and near average on the three dependent variables, serves as a base for comparison in Table 2. Odds ratios give the contrasts between Hillsborough and each of the other counties. We had expected that people in counties that experienced devastating floods over the past decade (such as Rockingham, Strafford and Cheshire) might display greater concern, compared with those who live where flood control structures mitigate risks (such as Coos, Grafton, Sullivan or Merrimack), but apart from Coos that is not generally the case. Coos county, which has significantly below-average responses to both past and future flooding questions, experienced its largest flood more than 70 years ago; since 1970, only one major flood took place on the Androscoggin (1998) and one on the Upper Connecticut (1979) (FEMA, 2013). Coos is represented by only 61 individuals in our data, however. Sullivan county, an unexplained outlier in the opposite direction (above average), is represented by just 96 individuals. Given these limited subsamples from the smallest counties, we regard the county effects on flooding responses (Models 1 and 2) as not robust, in need of further replication. County effects on climate-change beliefs (Model 3) are based on a larger dataset.
Discussion
At global and multi-decade timescales, climate change poses risks so broad, varied and potentially catastrophic that mitigation by reducing greenhouse emissions must be a core point of discussion. At local and shorter time scales, however, mitigation becomes almost symbolic, while adaptation demands immediate attention. But adaptation too requires a sense of how the system is changing, which even at local levels can trigger ideological resistance. Perceptions and realities of New Hampshire flooding are one case in point.
Anthropogenic climate change raises the probability of heavy-precipitation events and coastal flooding. Development expanding the area of impervious cover, or building up vulnerable areas, raises the likelihood of flood damage even without climate change, and would exacerbate problems as change occurs. Conversely, a suite of strategies could help to avoid, manage or reduce the consequences, as could projects designed to lessen the magnitude of floods. Adaptation efforts would enhance community resilience to floods and other climate change risks (Lopez-Marrero and Tschakert, 2011; Moser and Boykoff, 2013; Nelson, 2011). Positive actions are not costless, however. They need support based on a realistic assessment of changing risks and vulnerability, which is why public perceptions about future floods matter.
Proximity of recent floods should, in principle, raise awareness that floods have been increasing, and that scientists project higher risks in the future. This hypothesis led us to expect certain geographical patterns in flood perceptions, but such patterns are not evident in our data. Instead we find that ideology remains the most consistent predictor of perceptions about local flooding. A post-political, physical framing of New Hampshire flood perceptions succeeds no better than its counterparts for perceptions about global climate change. While physical events undoubtedly can impact perceptions, in this instance such impacts appear mild and contingent compared with those of ideology.
More immediate, severe or prolonged physical events might have greater impacts. Learning that worse disasters can change opinions would be un-reassuring, however, from the standpoint of averting crises or irreversible change before it is too late. More research is needed on effective ways that science communication about local impacts can counter media-reinforced biased assimilation even without looming disasters.
Understanding relationships between environmental and social change calls for interdisciplinary research, including designs where dependent variables are social, and the independent variables include environmental as well as social factors. Such designs effectively import natural-science data and knowledge into social-science analytical frameworks. They can address different questions, and admit more social complexity, than the complementary efforts to incorporate ‘human dimensions’ within basically natural-science frameworks. One recurring result from social-science based interdisciplinary research, exemplified here, is that among some individuals, information about the physical world is substantially filtered by ideology. Environmentally-driven models, or politics-free data, may overlook this important constraint. Ideology remains the elephant in the room, even when researchers would rather talk about other things.
Footnotes
Acknowledgements
The University of New Hampshire Survey Center conducted all telephone interviews for CERA, CAFOR and the Granite State Poll. The Carsey School of Public Policy provided logistical and administrative support.
Funding
Climate questions on the Granite State Poll have been supported by grants from the National Science Foundation (New Hampshire EPSCoR EPS-1101245; The Living Bridge IIP-1230460), and by the Carsey School of Public Policy and Sustainability Institute at the University of New Hampshire. CERA and CAFOR surveys were supported by grants from the US Department of Agriculture National Institute of Food and Agriculture (2010-67023-21705, 2014-68002-21782), Environmental Protection Agency, National Oceanographic and Atmospheric Administration (AB-133F-11-SE-0724), Ford Foundation, Neil and Louise Tillotson Fund, and at the University of New Hampshire the Carsey School of Public Policy, Sustainability Institute and the College of Liberal Arts.