
Abstract
This article seeks to revisit the French social space 30 years after Pierre Bourdieu first mapped it in Distinction. Using data from the International Social Survey Programme, it deploys geometric data analysis to construct a model of the space of class positions that is remarkably similar in its structure to that presented by Bourdieu despite three decades of economic transformation. The relationship with occupational groups and geographical space is also familiar, though gender and, to a greater extent, age are perhaps more prominent than when Bourdieu was writing. The article then goes on to demonstrate the multidimensional nature of symbolic violence, in the form of perception of one’s place, and the manner in which social reproduction is misrecognised. On the latter point, it transpires that while there is recognition of unfair advantage, not only is faith in meritocracy the prevailing view but the dominated are the most likely to deny that having educated parents makes a difference to whether one ‘gets ahead’ or not.
Introduction
Forty years ago, Pierre Bourdieu (1984, orig. 1979) proffered a radical new vision of class relations. Defined not in terms of exploitation or life chances, as with Marxist and Weberian approaches respectively, but in terms of the major principles of misrecognition in a social order, that is to say, the arbitrary properties securing legitimacy or value in the eyes of others, it broke with convention in at least two ways. The first was a step away from occupation as the be-all-and-end-all of class location: jobs certainly matter, but class is not reducible to positions in the production process or labour market, such that those not in work are somehow outside or only indirectly implicated in the class system, because the prime sources of misrecognition in capitalist social orders, or ‘capitals’, can be possessed by people with and without paid employment. The second was a thoroughgoing spatialisation of class: the class structure is not a series of neatly-bounded boxes arranged in order of high/low, with employers, managers and professionals defining the top and manual workers the bottom, but a relational and multidimensional system of difference based on volume and composition of capital possessed. The class structure is, in other words, a ‘social space’, and its multidimensionality matters for grasping not only the genesis of divergent ways of life and outlooks but the operation of domination.
After decades of miscomprehension and partial application, Bourdieu’s topological redefinition of class relations has now begun to capture the imagination. Countless scholars have sought to test his famed thesis that there is a close relationship between social position and lifestyle practices, though many of them have ignored or dismissed the spatialisation of class underpinning it. Others have taken the latter seriously, however, deploying tailored statistical techniques to model social spaces appropriately and examine not just Bourdieu’s specific theses on lifestyles and politics but novel topics like the social differentiation of fear and angst (Schmitz et al., 2018). These efforts have been undertaken in certain corners of Europe, especially Scandinavia, and demonstrated not just the easy transposability of Bourdieu’s scheme from its 1970s French test site to 21st century Denmark, Norway or Great Britain but its fruitfulness for advancing understanding of practice. Yet what of the original test site itself? Is contemporary France still characterised by the same broad structure of domination and struggle that necessitated Bourdieu’s celebrated model all those years ago, or have subsequent socio-economic transformations, from deindustrialisation to entrenched neoliberalism, introduced mutations and modifications of some kind?
Moreover, while the numerous investigations of class and lifestyles usually tend to presuppose the relationship is wrapped up with domination, few have actually examined on a broad scale the degree to which the social space is implicated in structuring self-perception and self-evaluation. Nor, importantly, have many explored another face of misrecognition: the misperception of social reproduction, especially among the dominated, as a question of merit and aspiration rather than unequally distributed family resources. This article endeavours to fill the gap by returning to the nation for which the very notion of social space was initially devised and, using data from 2009 and tools of geometric data analysis, constructing a model of the French class system in the new millennium and its suffusion with misrecognition.
The social space and misrecognition in 20th century France
The model of the French social space diagrammed by Bourdieu (1984, pp. 128–129) in Distinction, consolidating and elaborating ideas that had been brewing for over a decade, is defined by a three-dimensional distribution of a triad of capitals: economic capital, covering money and wealth; cultural capital, denoting mastery of legitimated symbolic systems; and social capital, in the form of connections, memberships and capital by proxy. The primary dimension of difference is capital volume, distinguishing those with high levels of all forms of capital from those with low holdings. The second dimension is capital composition, polarising those whose capital stocks are weighted toward the economic variety and those whose stocks are disproportionately comprised of cultural capital. The third dimension is trajectory, or transformation of capital possession over time, identifying those sections of the space that are ‘on the rise’ and those that are declining in numbers and capital holdings. The full set of oppositions matter because they denote differences in conditions of existence – possibilities and impossibilities, the likely and the unlikely, the feasible and the unfeasible, etc. – and thus schemes of perception and appreciation, i.e. habitus.
Although position in the social space is not dependent on occupation, jobs do require and return capital in patterned ways. The result is a homology between the space and what Bourdieu termed the ‘division of labour of domination’ (Bourdieu & Wacquant, 1993, p. 24). In Bourdieu’s model for 1970s France, well-paid and highly educated professionals, intellectuals and executives gathered at the top of the volume axis, manual workers of varying skill level and industry populated the bottom and various administrative, junior and technical roles as well as shopkeeping were ranged in between. However, rupturing with one-dimensional occupational or class hierarchies like socio-economic scales or the Erikson–Goldthorpe–Portacarero (EGP) scheme, there were also oppositions by capital composition: at the top of the social space, intellectuals stood opposed to business owners, with professionals in between, and in the middle belt of the space cultural intermediaries stood opposed to shopkeepers. Closely entwined with this were geographical differences: cultural fractions of classes were closely associated with metropolitan residence due to the concentration of educational opportunities, graduate jobs and consumptions sites in cities (Paris above all), while economic fractions were more likely to live in towns or, especially toward the bottom of the social space, villages.
The division of labour is one of domination because the holders of different positions are endowed with different degrees of symbolic power, that is, the capacity to have one’s definition of the world and what matters taken seriously and accepted by others, including in relation to one’s own place and worth relative to others – which, when it means swathes of people perceive or feel themselves to be in some way classed as inferior to others (less ‘successful’, ‘smart’, ‘authoritative’ and so on), results in symbolic violence. This capacity is distributed multidimensionally, however: while those with lower capital of all kinds may be subject to varied forms of symbolic violence – denigrated for being ‘poor’ and ‘unintelligent’, for example – Bourdieu also emphasised the battle between those richest in cultural capital and those richest in economic capital to establish their prime possession as the major principle of worth in the social order, giving rise to mutual deprecation and efforts to intervene in public affairs via media, politics and so on. Bourdieu was of the view that, in his time, the holders of economic capital were winning the battle, rendering them the dominant fraction of the dominant class and the holders of cultural capital the dominated fraction (e.g. Bourdieu, 1993, p. 43).
If symbolic power results in people perceiving their place and value relative to others, it also feeds into their perception of how they got into that place. The dominant put forth, earnestly enough, justificatory narratives of how they got to where they are – ‘theodicies of their own privilege’, as Bourdieu (1987, p. 16), put it, or ‘sociodicies’. They underscore their talent, vision or work ethic, and deny or downplay social advantages – in a nutshell, they ascribe their position largely to merit, which necessarily means defining those in lower positions as having less merit. These notions are perpetuated through the media, politics and education system, with the perverse result, according to Bourdieu, that the dominated, lacking the conditions of life facilitating mastery of the discourses that question the role of ‘merit’, are more likely to believe positions in society, including their own, to be a product of individual attributes rather than unequally distributed resources (Eagleton & Bourdieu, 1992, p. 114).
Into the new century
Following a decade or so of neglect, dozens have now taken up Bourdieu’s topological model of class and used it to fruitfully unpick the multidimensional nature of social differentiation across varied European nations, from Denmark and Norway to the UK and Belgium (e.g. Atkinson, 2017; De Keere, 2018; Flemmen et al., 2018, 2019; Prieur et al., 2008; Rosenlund, 2009). Not only that, but they have deployed geometric data analysis (GDA) to do so: a family of techniques championed by Bourdieu, and exploited in Distinction, because they are designed to spatialise relations between variables and can thus provide an apposite map of social structures or homologous position-takings. In all cases volume and composition of capital do indeed emerge as the key principles of social difference, signalling the transposability of Bourdieu’s model into the 21st century and across different national contexts.
Yet what of France itself? While there has been some interest in exploring the relationship between class and lifestyles (e.g. Coulangeon, 2017; Coulangeon & Lemel, 2007; Lebaron & Bonnet, 2014; Robette & Roueff, 2017), and an effort to map the top slice of the class structure (or ‘field of power’) using GDA (Denord et al., 2011), an updated model of the French social space in toto based on empirical analysis has not been forthcoming. 1 This is despite the considerable passage of time since its original construction and the substantial socio-economic change that has occurred in the meantime. There has been the relentless growth of the service sector – from 66% of the workforce to 74% between 1991 and 2009 alone – and the corresponding decline of heavy industry – from 29% to 23% in the same period – as well as feminisation of the workforce – with a ratio of female to male labour force participation climbing from 0.71 in 1991 to 0.82 in 2009 – and a ‘second education boom’ – the proportions of the population with at least upper secondary and post-secondary education surging to 61% and 24% respectively by 2009. 2 A concurrent precarisation of employment, moreover, was said by Bourdieu (1998) himself to have fallen disproportionately on not only those divested of capital but those working in the public sector, even at the higher levels.
What effect might these changes have had on the structure of the French social space? Bourdieu offered a few clues in later years. There had been, he posited, a degree of homogenisation of the dominant class and a resultant narrowing of the horizontal ‘gap’ between the economic and cultural poles of the social space in the wake of transformations of the education system – making higher education a much more common possession (Bourdieu, 1996) – and the housing market – as home ownership and inheritance proliferated (Bourdieu, 2005, p. 34). Could the Gallic social space have become effectively unidimensional, therefore, meaning that the multi-axis model of class relations is less applicable on its home soil, or are we merely witnessing another phase – in line with Bourdieu’s arguments in Distinction – of ‘retranslation’, that is, the reappearance of relational differences between classes and class fractions at new levels of the education system or between new sectors of the economy?
Subsequent scholarship in France throws only partial light on the issue. Fierce debates have erupted over the trajectory of the middle class(es) relative to other countries, with some tracing their mutation or decline while others assert their consolidation (Chauvel, 2006; Goux & Maurin, 2012; Hugrée et al., 2017; see also contributions to Coulangeon & Duval, 2013, 2015), and Piketty (2020) has underscored not the homogenisation of elites in Western democracies, France included, but their bifurcation, with the ‘Brahmins’ (the highest educated) facing off against the ‘merchants’ (the wealthiest). The continued force of social origin, moreover, in structuring both working-class engagement with tertiary education 3 and relative standing within the middle classes (Goux & Maurin, 2012) has been persistently highlighted. Yet these diagnoses, where they venture beyond narrative accounts, case studies or single-class analyses, are typically based on substantialist criteria – job characteristics and occupational groupings, for example – or on a juxtaposition of deciles, leaving the overall relational, topological configuration of social positions vis-a-vis capital in its various forms a mystery.
Furthermore, while there have certainly been many studies in Bourdieusian vein of symbolic power and violence at play, manifest in a negative sense of place, self-worth and comparison with notions of ‘merit’ (e.g. Atkinson, 2010; Gillies, 2005; Skeggs, 1997), and while some of them emphasise lateral as well as vertical struggles in the social space (e.g. Jarness, 2017), they are overwhelmingly confined to the UK or Norway and based on qualitative research. The latter fact is for good reason: qualitative research allows the sociologist to tap into rich expressions and emotional consequences of symbolic violence. It does, however, make it difficult to generalise to the wider population, let alone other countries, and this is important because some have come to claim that resistance, criticism and denunciation of others, or even the ‘system’, are far more pervasive than Bourdieu assumed, even amongst the dominated. Chief among them is Bourdieu’s erstwhile colleague, Luc Boltanski (e.g. 2011), who has built a whole conceptual edifice on a foundation of critique of Bourdieu’s model which, apparently, paints individuals as indoctrinated dupes. Whatever the misreadings underpinning that perspective (see Atkinson, 2020a), it still raises the empirical question of whether belief in the myth of merit outweighs denunciation of the system and how exactly it corresponds with the social space.
Data and method
Exploration of the foregoing questions is made possible by data from the French subsample of the 2009 module in the International Social Survey Programme (ISSP) on ‘Social Inequality’ (n = 2655). 4 While most widely used cross-national surveys – such as the European Social Survey – tend to restrict measures of social position to income, education level and perhaps parental occupation/education, the ISSP module contains seven variables sufficient for constructing a more rounded model of the social space: household income level, household savings, domestic property value, education level, number of books in the family home when the respondent was a teenager and mother’s and father’s occupations when the respondent was a teenager (see Table 1 for frequencies). The first three variables proxy economic capital, educational level acts as a measure of acquired cultural capital and number of books in the home indicates inherited cultural capital. Parental occupations indicate social origins, and possibly current social capital, but since mothers in the top occupational category are highly likely to have been teachers or cultural producers (47%, as opposed to 21% of men in the same category), rather than managers or other professionals, the variable for maternal occupation may also operate as an indicator of inherited cultural capital. Other variables identifying discipline of study or possession of stocks and shares, the addition of which would certainly have yielded a more nuanced map, are absent from the dataset and we have to content ourselves with a blunter approximation of the object under investigation. 5 Crucially, though, we are not producing a distorted model of the space by using inappropriate variables (such as, for example, indicators of lifestyle or taste).
Category frequencies of active variables.
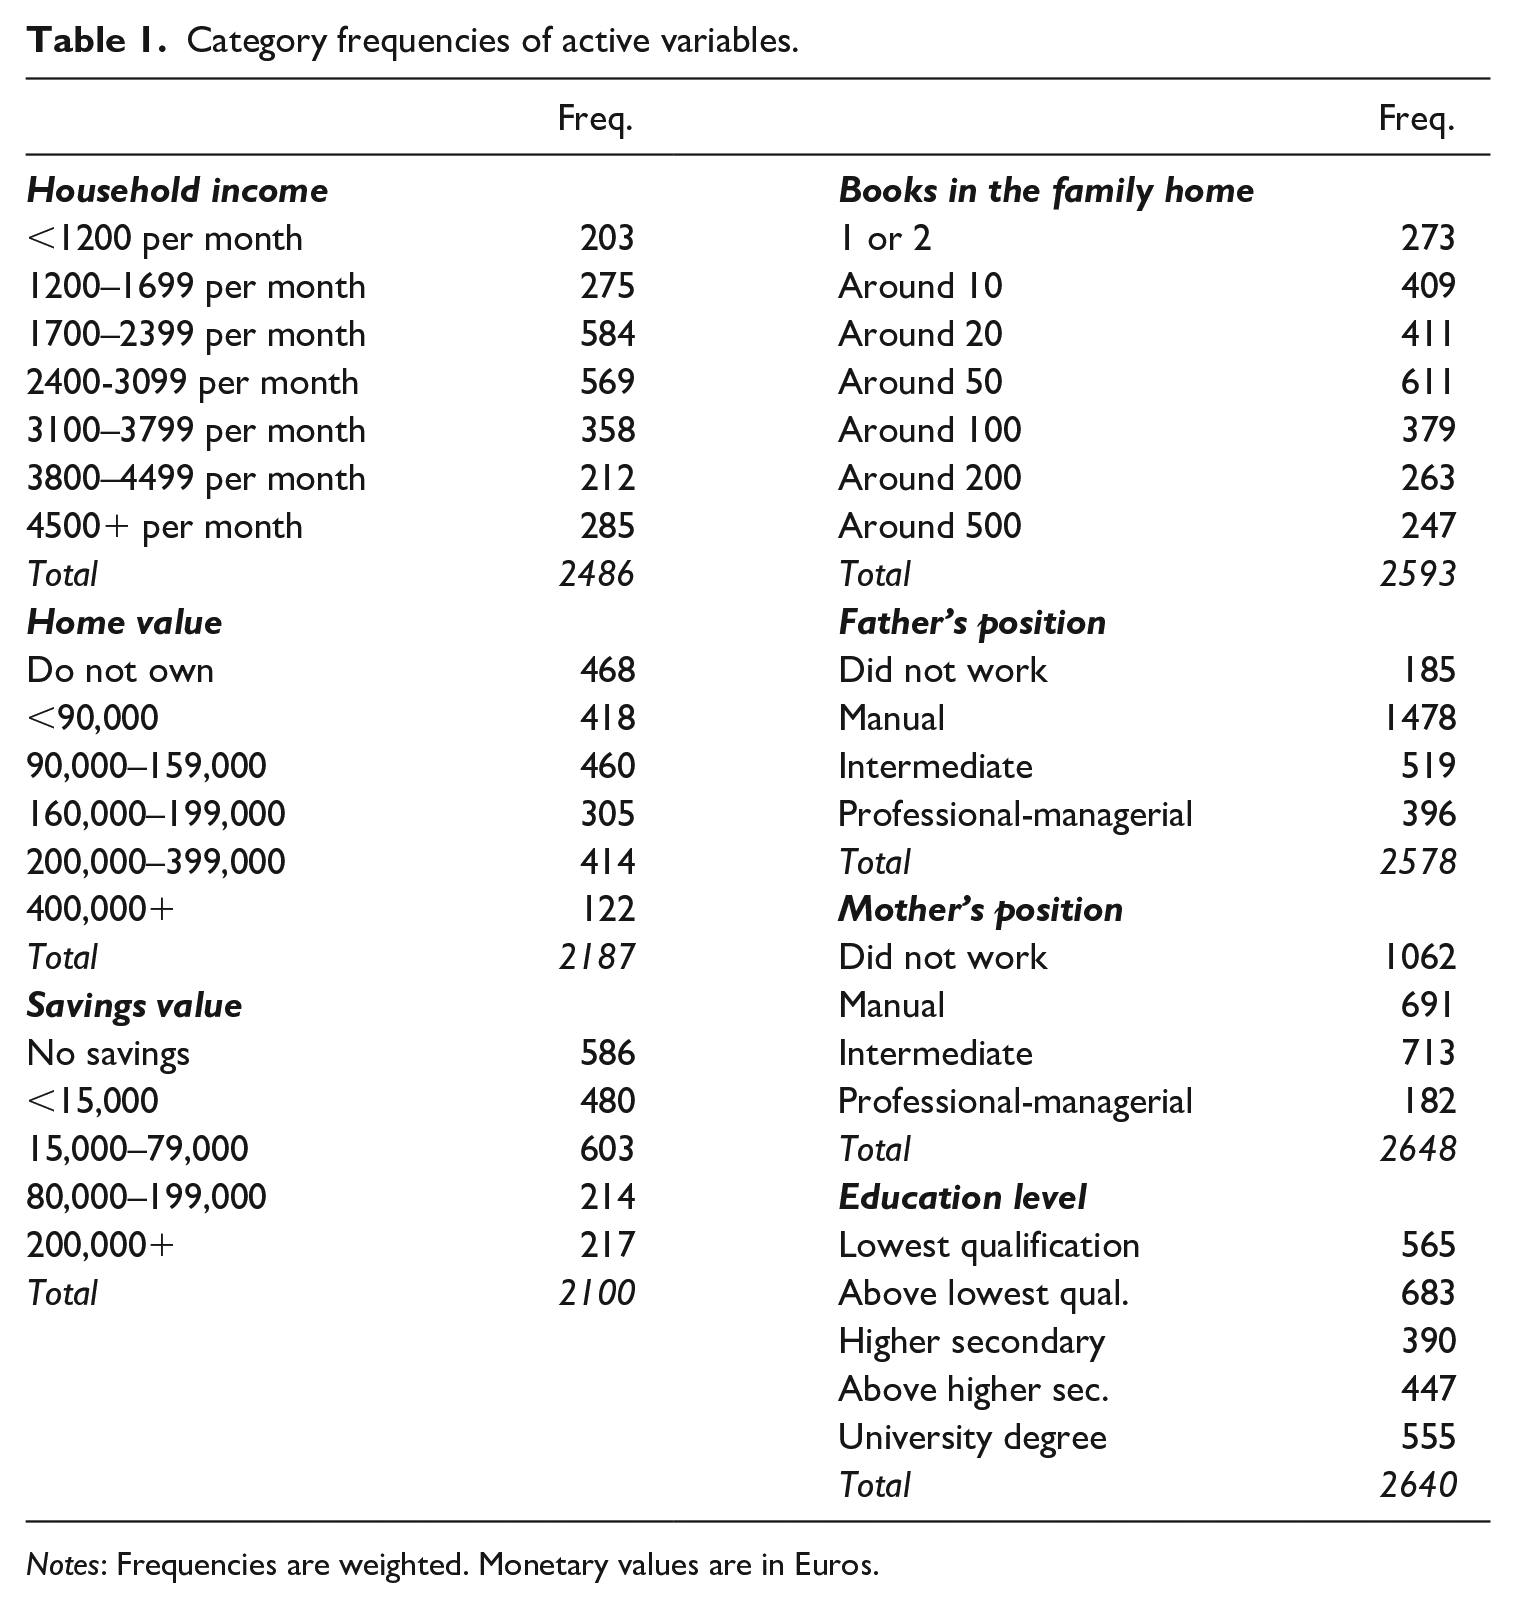
Notes: Frequencies are weighted. Monetary values are in Euros.
As in most contemporary analyses serious about constructing models of multidimensional social structures, the tools of GDA are applied. This means that the goal is to identify latent structures of association between the capital indicators and array them spatially, i.e. in terms of distance and direction along multiple axes, the importance of these axes being judged by the amount of variance (inertia) within the data they explain. The initial strategy was to deploy Bourdieu’s own favoured technique of multiple correspondence analysis (MCA). This method is intended to handle multiple nominal variables, that is, categorical variables where there is no obvious ranking or ordering of the constituent categories, such as industry of employment. In this instance, however, MCA produced what is known as the Guttman effect: the first axis of the space separated high values from low values while the second axis distinguished extremity categories (high/low capital) from middling categories, thus distributing individuals and categories in a U-shape. This is a clear indication that the variables in the model take on an ordinal structure – that is to say, there is a clear rank-ordering of constituent categories (low to high) – and correlate (Hjellbrekke, 2019: 96; Le Roux & Rouanet, 2004, pp. 220–221). The task is usually to then try and counteract the Guttman effect by recoding variables or including multiple nominal variables. Since neither tactic proved efficient in this case, the decision was taken to deploy Categorical Principal Components Analysis (CatPCA) instead (also known as nonlinear PCA). 6 CatPCA operates in almost exactly the same manner as MCA but is able to handle any and all types of variable simultaneously and, when variables are defined as ordinal, it focuses on whole variables rather than categories of variables. The result is a space defined by vectors, or the ‘directions of travel’ of variables rather than individual category coordinates, and it banishes the Guttman effect entirely. 7 The relationship between variables and axes is determined via factor loadings (variables with a loading of 0.4 or above on an axis are conventionally considered important to it) and relative contributions to axis inertia (variables with above-average contributions are deemed ‘explicative’).
CatPCA was developed outside the French tradition of GDA and is typically used in the social sciences for constructing scales for regression. Some might think it a resolutely linear or even ‘positivist’ – and certainly non-Bourdieusian – technique, therefore. Yet CatPCA, when aptly used, can and should be considered firmly part of the wider GDA family in which MCA is embedded, just as standard PCA for continuous variables already is (see Le Roux & Rouanet, 2004). From a purely technical point of view, it is extremely close to – and could even be said to integrate – MCA and standard PCA. All yield multi-axis models organising variance between variables spatially and can thus be taken to offer approximations of principles of social differentiation and distance, so they are all in tune with Bourdieu’s multidimensional, topological brand of relationalism – all that differs is the type(s) of variable they can array (see further Atkinson, 2020b; Blasius & Greenacre, 2006, 2014; DiFranco, 2016; Joye et al., 2020).
Inserting CatPCA into the GDA tradition involves a specific approach to supplementary variables, that is, variables which do not contribute toward constructing the space but which have relationships with it that can be explored. When set as multiple nominal, as they are in the current analysis, their component categories bear coordinates in the space and focus is directed toward the distances between them. The location of a category on an axis relative to the centre of the space (the barycentre) is assessed using the ‘typicality test’, which determines whether a category is atypically located on the axis compared to the sample as a whole, and the gap between one category and another is judged to be ‘notable’ if it is 0.4 units (standard deviations, or SDs) or more and ‘large’ or substantial if it is 1.0 SDs or more (see Hjellbrekke, 2019; Le Roux & Rouanet, 2004, 2010; Le Roux et al., 2020).
Among the supplementary variables to be scrutinised are a measure of sense of place and several indicators together tapping into the presence and power of sociodicy. First, respondents were required to gauge where they think they are positioned in the social order on a ten-point scale, with 1 denoting ‘the bottom’ and 10 ‘the top’. This has been reduced to a six-point scale here, aggregating the top three and bottom three categories respectively, since people were, somewhat tellingly, extremely unwilling to place themselves in the extremity boxes (cf. Evans & Kelley, 2004). While such a scale cannot claim to substitute for the fine-grained portraits of symbolic violence divulged by qualitative research, and is doubtless inflected by strategies of self-presentation in the interview situation, there should be no doubt that consciously and explicitly placing oneself at or toward ‘the bottom’ of society, on the basis of arbitrary yet seemingly natural yardsticks of worth imposed by others, necessarily assumes a perception – surely loaded with damaging affective consequences (shame, embarrassment, guilt) – that one would generally be considered (and may just be) inferior to almost everyone else. 8
Second, there are several questions asking respondents to comment on how important they believe several factors are in ‘getting ahead’, which can be taken to denote, in practical terms, accessing higher reaches of the social space. These factors include two common indicators of supposed ‘merit’ – ‘hard work’ (hrdwk) and ‘ambition’ (ambit) – as well as two indicators flagging social reproduction – ‘coming from a wealthy family’ (wealth) and ‘having well-educated parents’ (edpar). Responses were recorded on a five-point Likert scale of importance: ‘essential’ (+++), ‘very important’ (++), ‘fairly important’ (+), ‘not important’ (-) and ‘not important at all’ (—). Once again, such questions cannot match the subtlety and variety of perceptions disclosed by qualitative research, but what they lack in nuance they make up for in extrapolative capacity. And if Bourdieu is right, then we might expect widespread agreement that ambition and hard work are the key and denial of the role of wealthy and/or educated parents, especially among the dominated. If Boltanski is correct, on the other hand, then we might expect rather more people, including people at the bottom of the social space, to question the role of hard work and ambition and to identify and denounce capital transmission.
A familiar trio
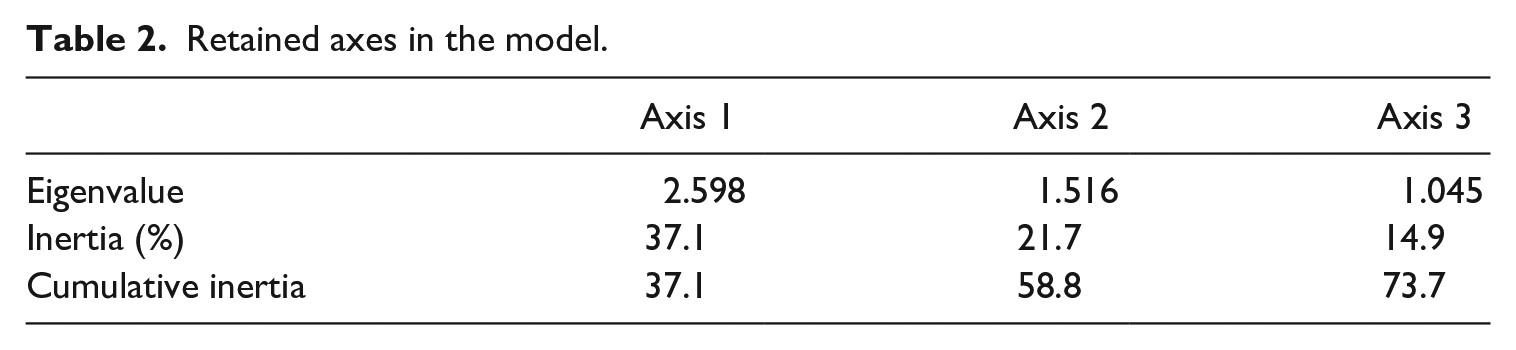
The CatPCA model of the contemporary French social space comprises three dimensions. 9 The first of these, accounting for 37% of the inertia, is characterised by positive factor loadings above 0.4 for all variables (Tables 2 and 3). Those who have higher incomes and wealth holdings, in other words, are also likely to have higher education levels, to have had parents in professional/managerial work and to have had plenty of books in the family home when they were teenagers, while those with lower stocks of economic capital also tend to have lower social origins and fewer tokens of cultural capital. The axis might thus be characterised as one of capital volume, distinguishing the dominant from the dominated. However, the factor loadings are not of equal magnitude: acquired and inherited (cultural) capital appear to be the most prominent, alongside household income, and indicators of wealth (as well as mother’s social position) less important. Examination of the relative contributions of the variables to the axis confirms that this axis might not, in fact, be one of capital volume in any straightforward sense but is instead heavily weighted toward cultural capital and income, as if to emphasise the powerful correlation between education, earnings and social origins and, with that, the persistence of widespread social reproduction.
Retained axes in the model.
Factor loadings and relative contributions of variables.
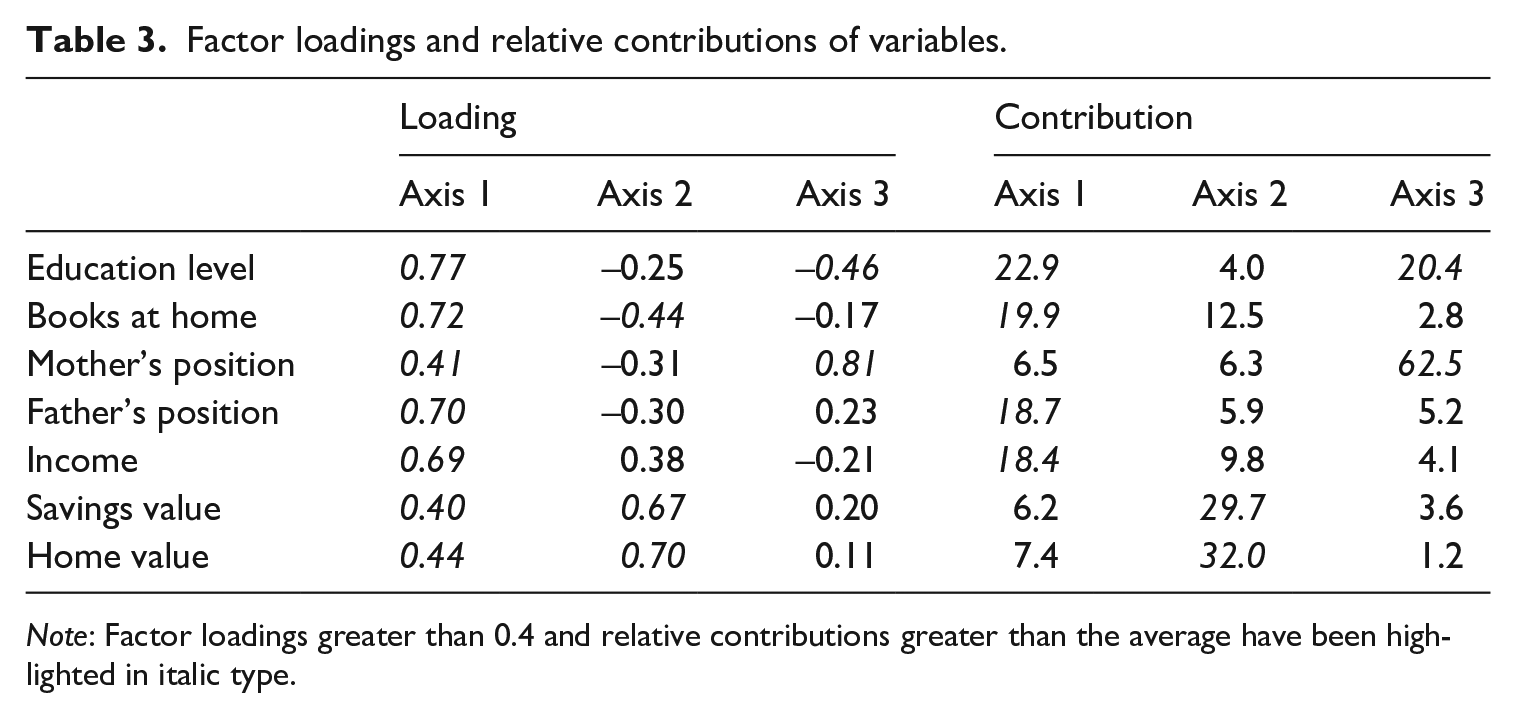
Note: Factor loadings greater than 0.4 and relative contributions greater than the average have been highlighted in italic type.
The second axis, meanwhile, accounts for 22% of the variance and is defined by an opposition between the indicators of wealth, which are closely related to income, and inherited cultural capital in the form of books in the home, which is also closely related to maternal and paternal social positions and acquired cultural capital. Once again, however, while it would be tempting on the basis of factor loadings alone to describe this axis as one of capital composition, when looking at the relative contributions of the variables it transpires that the axis is defined principally as a wealth axis, with book ownership falling just below the threshold of explicative status. In conjunction with the composition of Axis 1, the consequence of this prominence of wealth on the second axis in the plane of the first two dimensions is a slight skew compared to the hypothesised model of capital volume and capital composition: the indicators of economic capital are pulled downwards and to the right of the model and the indicators of cultural capital are both higher up the first dimension and closer to the centre point of Axis 2 as might have been expected, as if the model has been rotated ever so slightly clockwise (Figure 1). This skew can, in fact, be modelled geometrically by taking the centre point, on both axes, between the indicators of economic and cultural capital, as a proxy for balanced yet high capital stocks, and determining the degree of tilt between it and the statistical axes (12.7 degrees). Doing so allows us to construct hypothetical vectors for capital volume and capital composition, harmonising the statistical model and the theoretical model, and we can even, for presentational purposes, calculate rotated coordinates for all other modalities in the space. 10
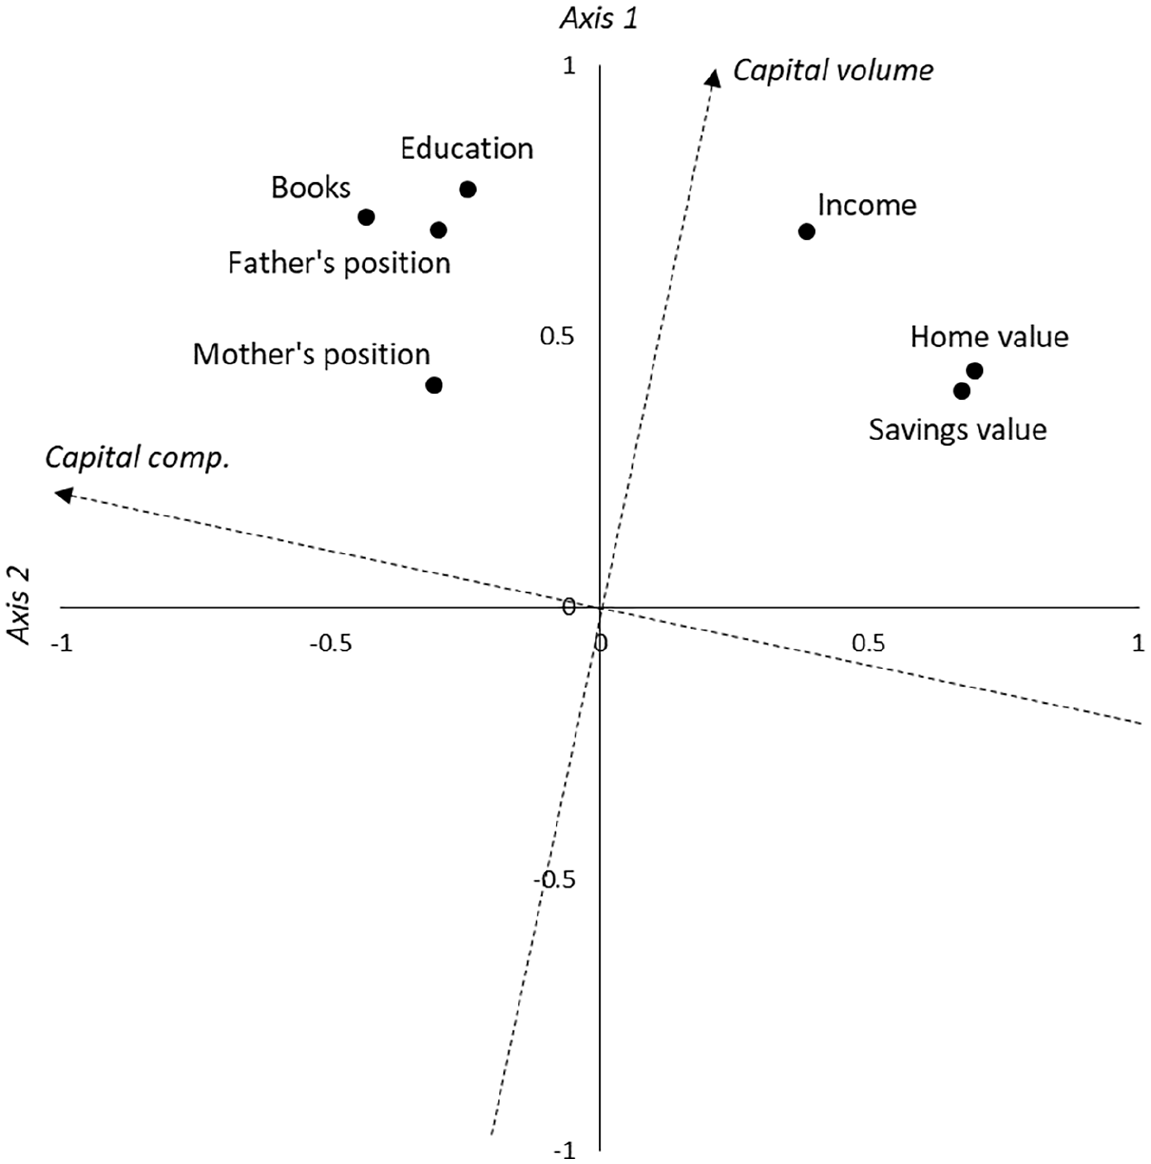
Factor loadings on axes 1 and 2, with modelled vectors for capital volume and capital composition.
First, however, there is a tertiary axis to determine. Accounting for 15% of the variance, the third dimension is comprised of an opposition between two variables, though others are related in coherent ways. On the one hand, there is mother’s class position when the respondent was a teenager, which correlates with father’s occupation. On the other hand, there is the respondent’s education level, which correlates with income. There is, therefore, an opposition between social origins and present position, polarising those from higher social origins with lower educational capital and incomes and those from lower social origins with higher educational capital and incomes – or, in short, polarising the downwardly mobile and the upwardly mobile. The third axis of the space, in line with Bourdieu’s model, might thus be characterised as approximating trajectory within the social space.
Homologies
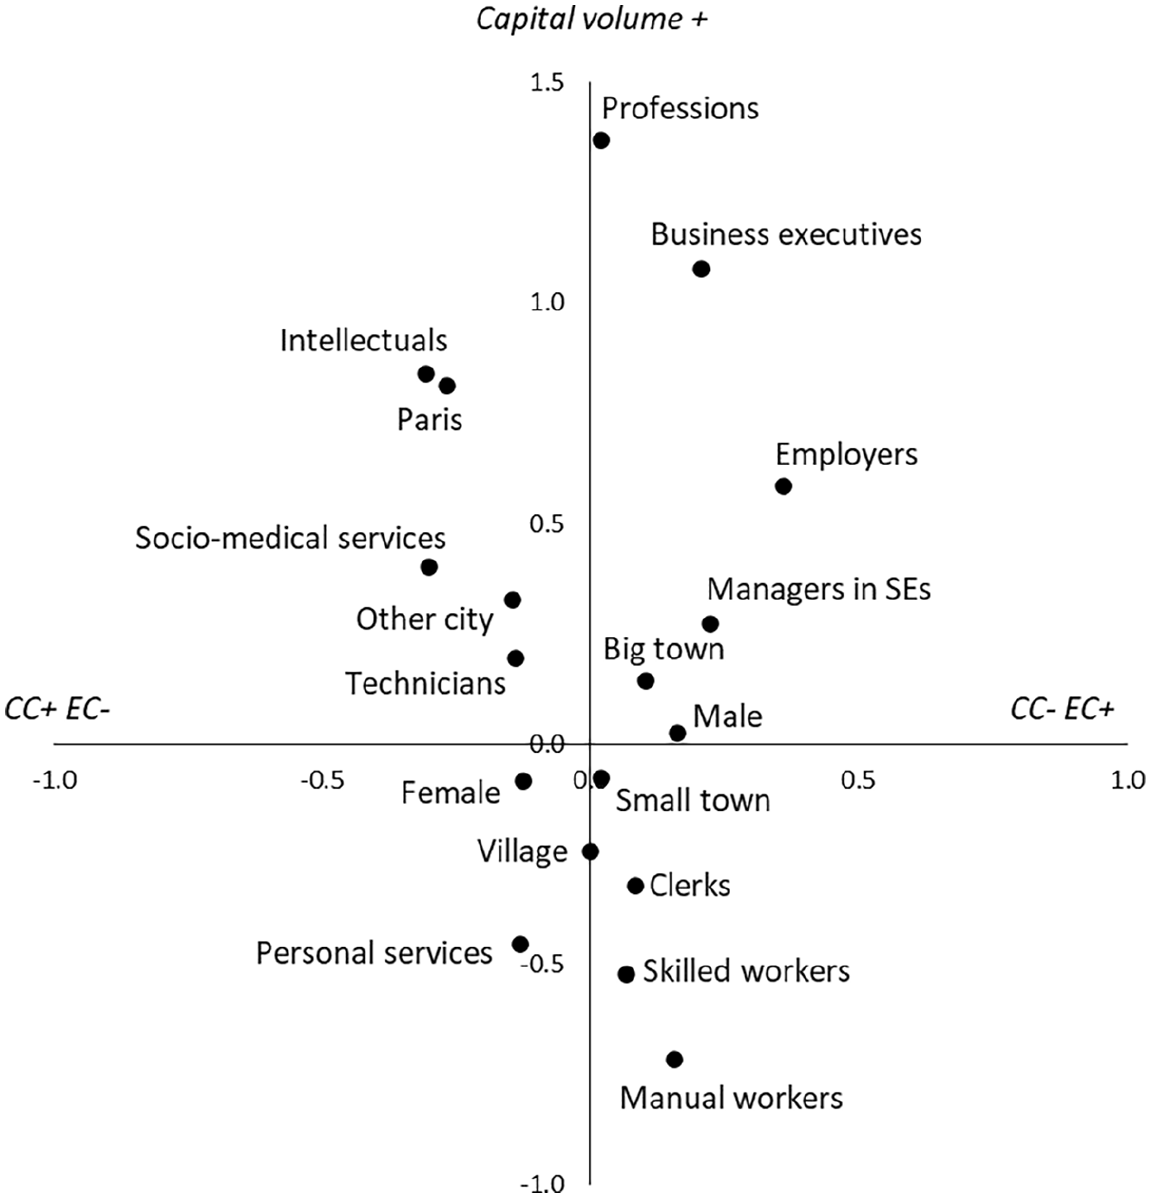
Inspection of supplementary variables discloses a series of homologies between the structure of capital and other properties signifying both continuity and change over time (Figure 2; for frequencies, coordinates and typicality test results, see the Appendix). Take, for example, the division of labour of domination. 11 The premier axis of differentiation, distinguishing dominant and dominated, corresponds clearly with an opposition between, on the one hand, employers and professional-managerial positions, 12 and by extension participation in the field of power, and, on the other, manual, skilled and personal service work demanding fewer credentials and yielding lower pay. Clerical work also gravitates toward the lower portion of the space, while technicians and socio-medical service workers sit between the higher and lower locations. At the same time, however, the categories are polarised – admittedly not to the same degree, though differences are still statistically significant 13 – by capital composition. This is most evident in the upper region of the space, where employers and business executives – corporate managers and business-related professionals – orient toward the right of the space, defined by a greater weight of economic to cultural capital, the professions (doctors, dentists, lawyers, etc.) sit in the middle, with fairly balanced (and very high) stocks of capital, and the ‘intellectuals’ – covering teachers, scientists and cultural producers, as the major agents and mediators of the intellectual field – gravitate toward the left side of the space, defined by a greater weight of cultural to economic capital. The intellectuals are closely associated with residence in Paris, with all its geographical concentration of opportunities for the acquisition of cultural capital, the attainment of graduate employment (including in higher education and research) and the consumption of highbrow culture. Although we cannot tell whether the gap between intellectuals and the masters of the economy has shrunk or enlarged over time, everything would seem to indicate there is still sufficient social distance within the top region of the social space to contest any notion that the relationship between the division of labour of domination and capital is unidimensional.
Coordinates of supplementary modalities in the rotated space.
The chiastic structure at the peak of the social space is repeated in the middle zone, where living in a town or village, away from the cultural centre, is more likely: socio-medical workers (including many that Bourdieu would have dubbed ‘cultural intermediaries’, like counsellors and youth workers) gather toward the cultural pole of the space, in direct opposition to the managers of small enterprises (SEs), who occupy a place close to that once occupied by shopkeepers. Given the relation between the cultural pole of the space and parental position, this suggests the overriding role of social origin is to distinguish the ‘middle classes’ horizontally. The same lateral opposition reappears at the bottom of the space, where workers in personal services are associated with higher holdings of cultural capital and manual workers, skilled workers and clerical workers with economic capital. The distance between points is less pronounced, however: that between personal service workers and manual workers, for instance, fails to reach the threshold of notability (0.22 SDs) while those between business executives and intellectuals (0.55) and between managers in SEs and socio-medical services (0.48) do. Despite substantial shifts in the educational and industrial landscape of France, i.e. the proliferation of credentials and the growth of low-paid service work since the 1970s, therefore, and unlike in other countries (Atkinson, 2020b), the dominated class seems to remain almost as homogeneous in terms of capital composition in 2009 as it did three decades earlier.
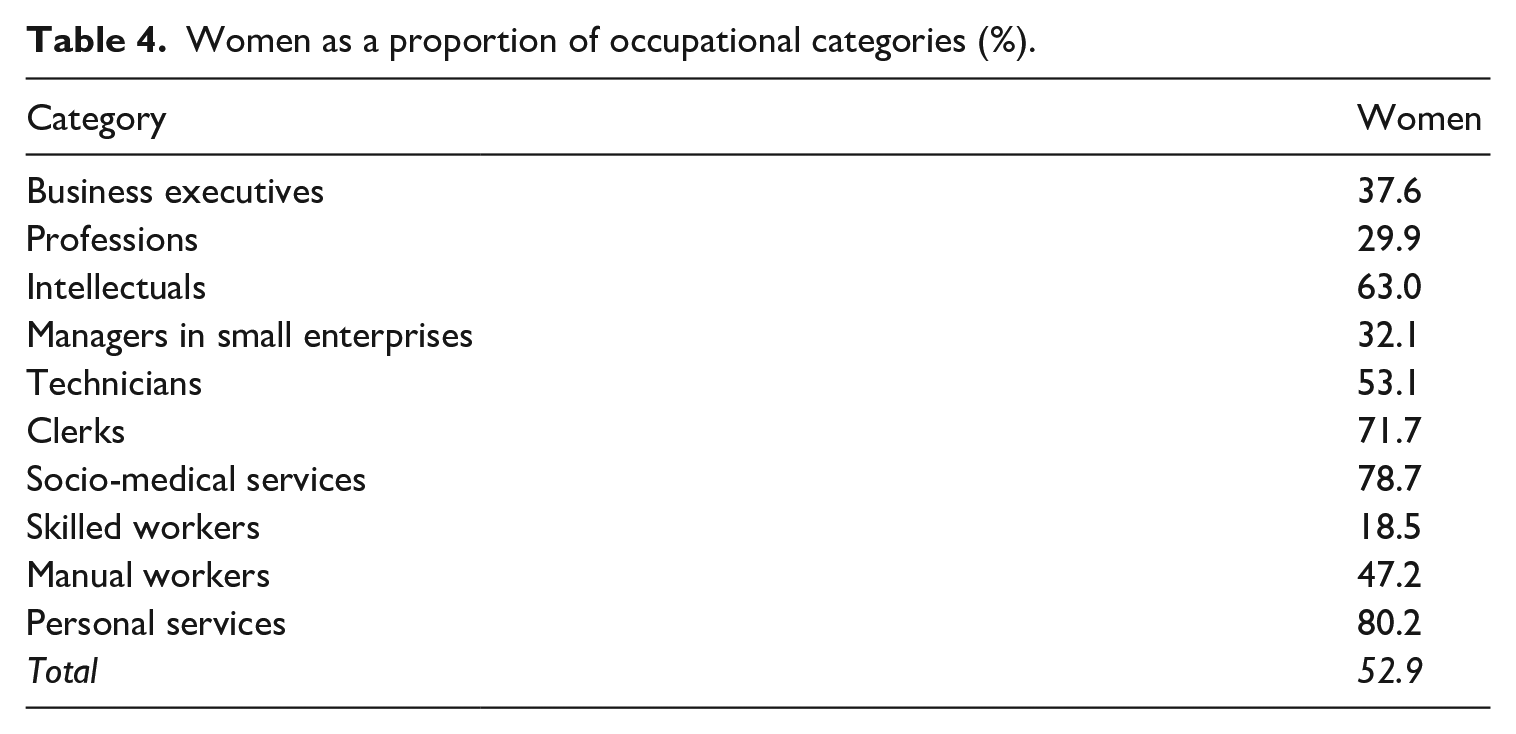
The division of labour of domination is profoundly gendered, with cultural fractions tending to be highly feminised and economic ones more likely to be male-dominated (Table 4), and this is bound to generate specific perceptual associations and evaluations of zones of the social space, but the differences between men and women in the CatPCA space per se are modest. The coordinates are atypical on both dimensions, but this is likely to be skewed by the large n of the categories (Hjellbrekke, 2019, p. 68), and the distances between them are slight, especially on Axis 1 (the SDs are 0.04 and 0.30 for Axes 1 and 2 respectively). The indicators of economic capital being measured at the household level means that differences in, for example, pay levels and promotion prospects are counteracted by the specific effects of partnering, though that inevitably points to gender differences and inequalities in the allocation and circulation of resources within households.
Women as a proportion of occupational categories (%).
The relationship between age and the space, however, is clear and substantial: youth is associated with higher holdings of inherited and acquired cultural capital, while older age is associated with both economic capital and, at the top end, with a lower volume of capital overall (Figure 3). This is likely to be due in part to life-course effects, namely the accumulation of personal wealth, i.e. domestic property and savings, through time, but it also implicates generational effects, specifically the greater chance of younger people having acquired higher levels of education and having parents (especially mothers) with higher education levels (and thus more books in the family home) and in professional-managerial roles in the wake of educational expansion and transformation of the division of labour of domination. The consequence is, in any case, an inescapable blending of capital composition with trajectory effects.
Modalities with atypical coordinates on Axis 3.
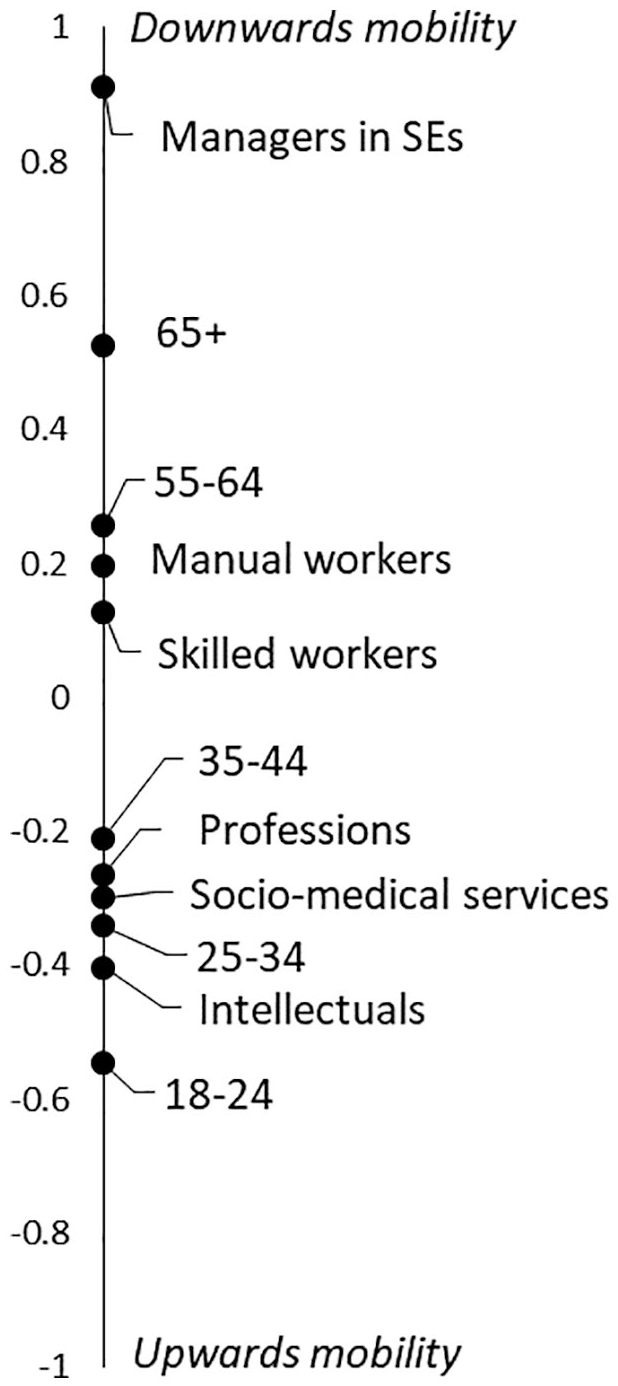
There is, however, Axis 3 distinguishing the upwardly mobile and the downwardly mobile (Figure 4). Downwards mobility seems to be associated with manual and skilled work, and above all management in small enterprises, as if signalling occupational categories on the decline, but also older age, while upwards mobility is associated with youth and newer positions demanding cultural capital. Put in the context of Axis 2, it would now appear that the third dimension is specifically identifying two polarised tendencies: on the one hand, younger people from lower social origins benefitting from new educational and occupational opportunities to accumulate capital, and, on the other, older people originating from higher class backgrounds who seemingly failed to reproduce their parental social position (perhaps because there was less ‘room at the top’ when they entered the labour market).
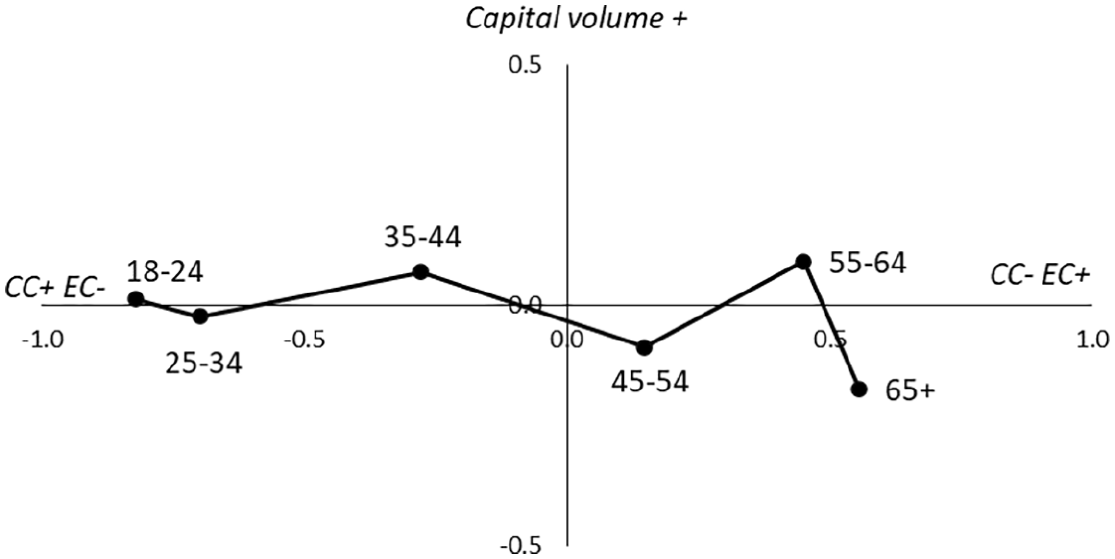
Coordinates of age categories in the rotated space.
Sense of place and misrecognition
Everything would so far seem to suggest that the French social space is resolutely multidimensional, despite decades of socio-economic change, that the major dimensions of differentiation are more or less the same as Bourdieu posited 30 years earlier and that they correspond in familiar ways with the division of labour of domination and geography, even if there are some nuances, like the bleeding of trajectory effects on to the second axis. There is also evidence to suggest, moreover, that its multidimensionality is crucial for grasping the full structure of symbolic power and symbolic violence – that both the vertical and horizontal axes, in other words, are axes denoting not just differences in conditions of life but relations of domination. There is a clear and orderly correspondence between perceived place in the social order and the premier axis of the CatPCA model (see Table A2) and, once rotated, with capital volume (Figure 5). At the same time, the trajectory of self-perception toward the zenith of the space indicates that it is inhabitants of the economic zone of the dominant region – the ‘dominant dominant’, that is – that are most likely to perceive themselves at ‘the top’ of society. The younger, cultural fraction of the dominant class, possessing fewer economic resources, are thus less likely to place themselves at ‘the top’ despite their considerable stocks of acquired and inherited cultural capital. 14
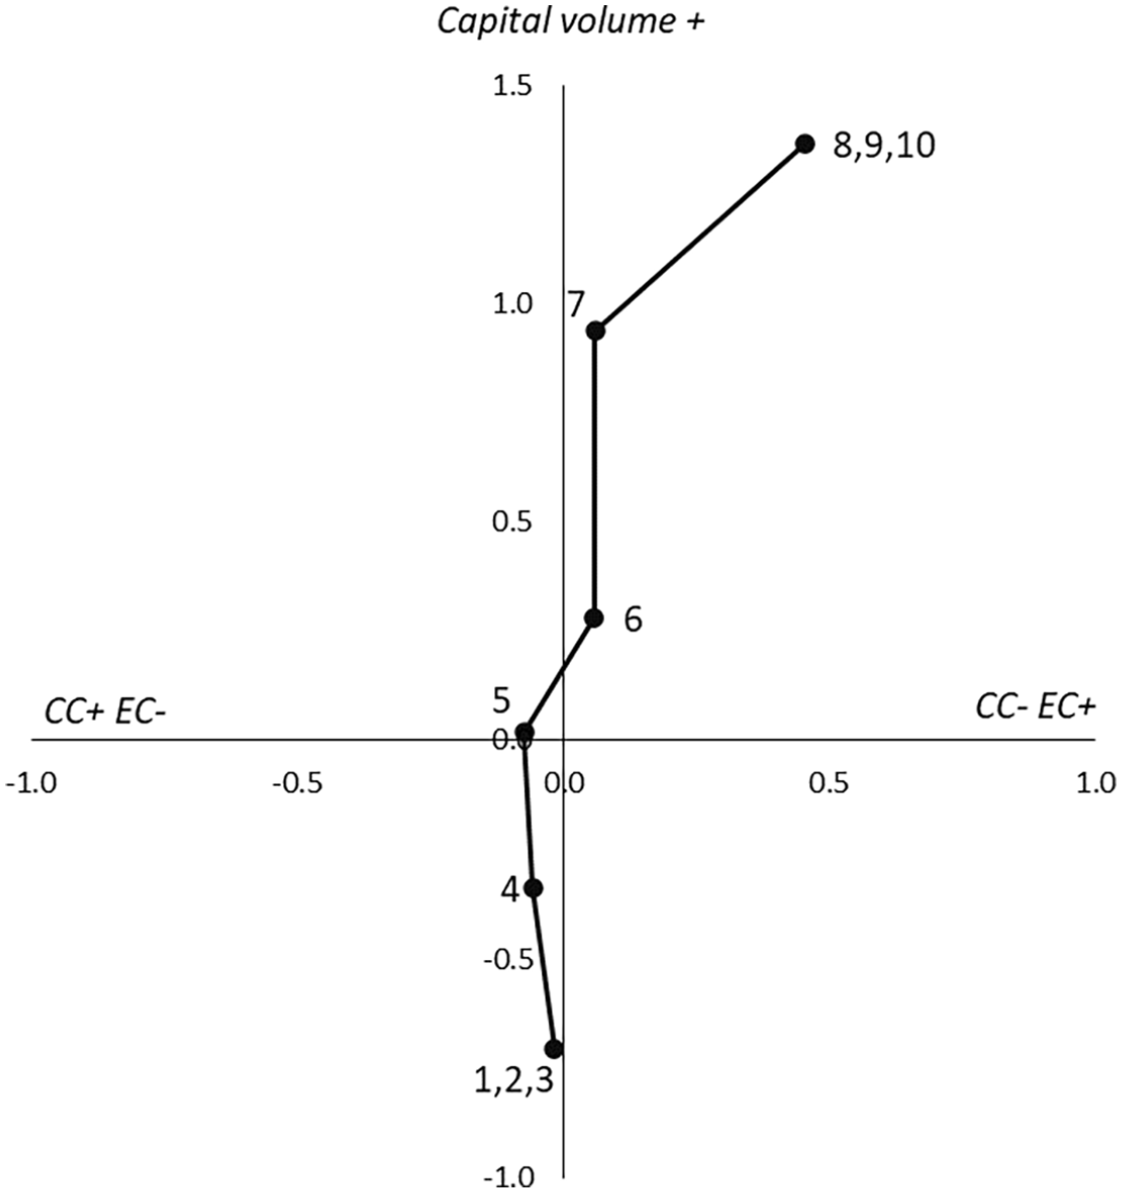
Self-placement in the rotated space.
The degree to which self-placement taps into self-worth, however, depends on how people perceive they got into their place – whether, that is, those at the top and bottom think they and others are where they are because of individual capacities/failings or family resources. A preliminary glimpse at the frequencies on the relevant questions already makes one thing abundantly clear: hard work and ambition are widely regarded as not only important but very important, or even essential, in determining who gets ahead (Table 5). Only 10.5% of people disagree on hard work and just 8% are sceptical about the role of ambition. Having wealthy parents, on the other hand, is generally seen as unimportant, or fairly important at best, and those who see it as rather more consequential are in the minority. So far, then, it would seem that Bourdieu may be closer to the mark than Boltanski: the majority seem to have internalised the sociodicy that ambition and merit matter more than money. However, the question on having educated parents elicits somewhat different responses. This factor is far more likely to be perceived as important, and even very important, in determining who ‘gets ahead’ in 21st century France, though the minority disagreeing (16.3%) is larger than any other group dissenting from modal opinion so far.
Relative importance of factors in ‘getting ahead’ (%).
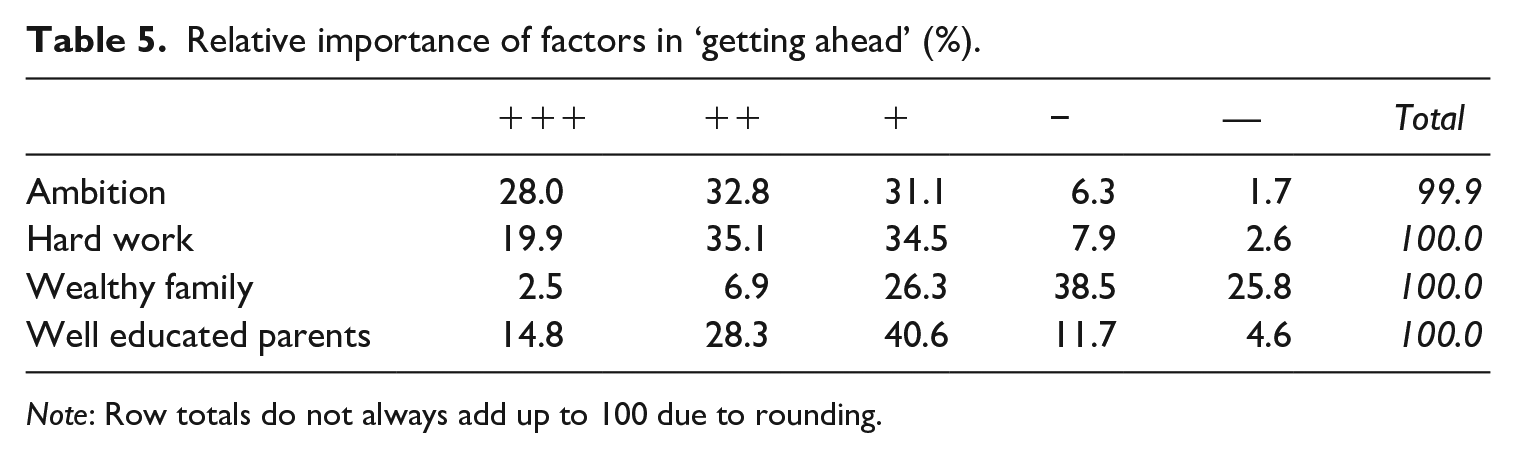
Note: Row totals do not always add up to 100 due to rounding.
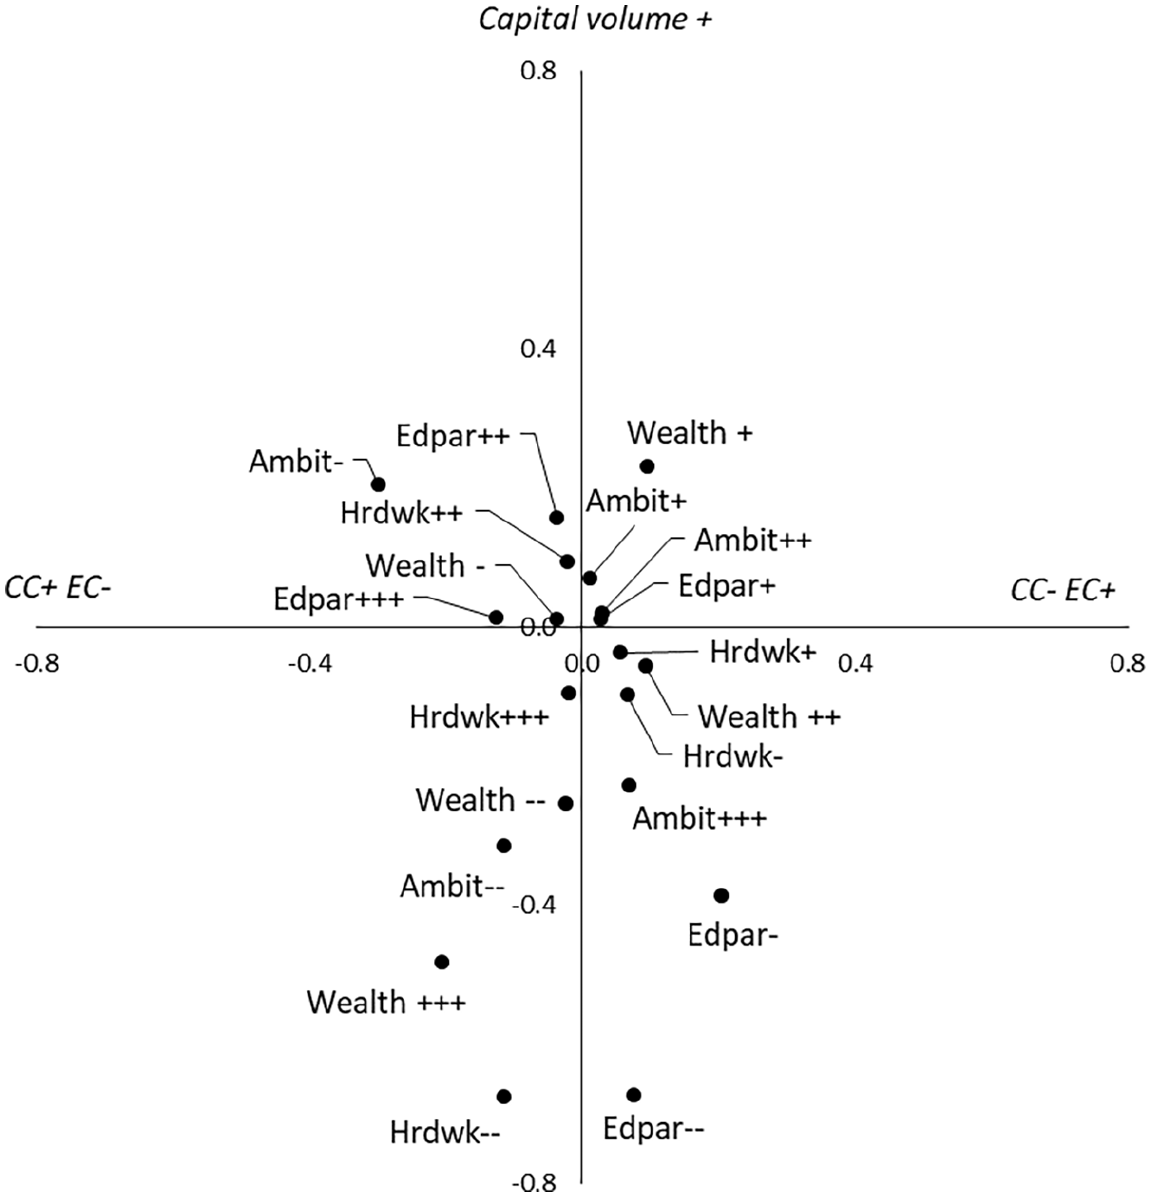
Examining the distribution of the responses within the CatPCA space discloses a fair degree of clustering around the barycentre, particularly of the most popular categories (Figure 6). These are the ‘common sense’ views, closest to being what Bourdieu called doxic: hard work and ambition are fairly if not very important to determining places in the social order, but also having educated parents makes a difference. Some of these categories still register atypicality on the raw axes, but their large size is worth bearing in mind. More telling, however, is the distribution of dissenting views. There is the association of the view that ambition is unimportant with the cultural pole of the central belt of the space, for example, as if to denote that those with a modicum of cultural capital but trapped in middling positions in the division of labour, who also tend to be younger, are critical of tropes around aspiration. Even more revealing, though, are the views corresponding with the dominated zone of the space. People here are most closely associated with strong rejection of the roles of hard work and ambition, as well as the view that a wealthy background is essential to getting ahead – and more so toward the cultural pole of the space. It should be remembered, however, that these cynical or critical responses are extremely rare – comprising barely more than a few percent – and, what is more, the far more common responses that wealth is not important at all and ambition and hard work essential are also associated with the lower portion of the space, albeit slightly higher up than the dissenting views (where people are more likely to place themselves below the middle than right at the bottom). Critical voices are hardly the norm amongst the dominated, then – most are instead firm believers in meritocratic principles, and more avid believers than those higher up the space.
Views on what it takes to 'get ahead' in the rotated space.
Most illuminating, perhaps, is the location of the view – a minority view, for sure, but a substantial one nonetheless – that having well-educated parents does not matter for getting ahead. Those thinking it unimportant, against the common perception, are typically to be found in the lower right quadrant of the space, in the region corresponding with clerks, skilled workers and, of course, a lower self-placement (i.e. the second lowest if not lowest category), and it may be that some people in skilled or clerical roles believe they ‘got ahead’ in their jobs without educated parents. The notion that having well-educated parents is not important at all, meanwhile, is to be disproportionately found even further down the space, close to the position of manual workers and the lowest possible self-ranking. The dominated are indeed, therefore, the most likely to deny the role of inherited cultural capital in social reproduction in 21st century France and to do so, it seems, in considerable numbers. 15
Conclusion: Plus ça change, plus c’est la même chose
The French social space at the beginning of the new millennium appears remarkably similar in its fundamental structure to that posited by Bourdieu 30 years earlier. Capital volume and capital composition can be detected, with a tertiary dimension distinguishing elements of trajectory, and capital composition – despite some of Bourdieu’s comments on possible forces of homogenisation after the 1970s – remains a powerful principle of social differentiation. There certainly have been some mutations in its homologies with socio-economic change, however. The occupational division of labour, for example, though largely corresponding with the social space in the same manner posited by Bourdieu, has produced new homologies to replace the old: managers of small enterprises in place of shopkeepers, business executives floating further right and socio-medical services further left, and so on. More telling, however, has been the apparent merging of capital composition with trajectory effects as time has gone on: as the attainment of higher levels of education and possession of professional/managerial parents has become more common over the years, and as accumulation of personal economic capital takes time, so the balance of capital has become more intimately connected to the distribution of the generations. Perhaps with different indicators of capital possession less directly connected to age – like subject studied at university, institution attended, ownership of stocks and shares, etc. – this melding would be diminished in the model, but that is for further research to tell.
What is clear, however, is that the space as modelled here reveals the multidimensional nature of symbolic power and violence: that perception of one’s place in the whole is structured by capital composition, distinguishing the ‘dominant dominant’ and the ‘dominated dominant’, as well as capital volume, even if the vertical differences in self-perception outstrip the horizontal differences by some margin. Moreover, there is every reason to believe that the myth of meritocracy, as a sociodicy legitimising the misrecognition order, is pervasive. It would be wrong to claim there is no awareness or denunciation of unfair advantage, but faith in individual effort and bold vision far outweigh it, people decrying the role of wealth are few and far between and, ultimately, Bourdieu’s thesis still holds: the dominated are indeed the most likely to deny the importance of parental cultural capital despite its demonstrated importance in structuring positions and trajectories in the social space. Taken together with the findings on self-placement, this can only mean that they see themselves as having lacked these mystical properties and that their lowly place in the social order is, therefore, a product – at least in good part – of their own failings rather than structural tendencies. Such is the essence of symbolic violence.
Footnotes
Appendix
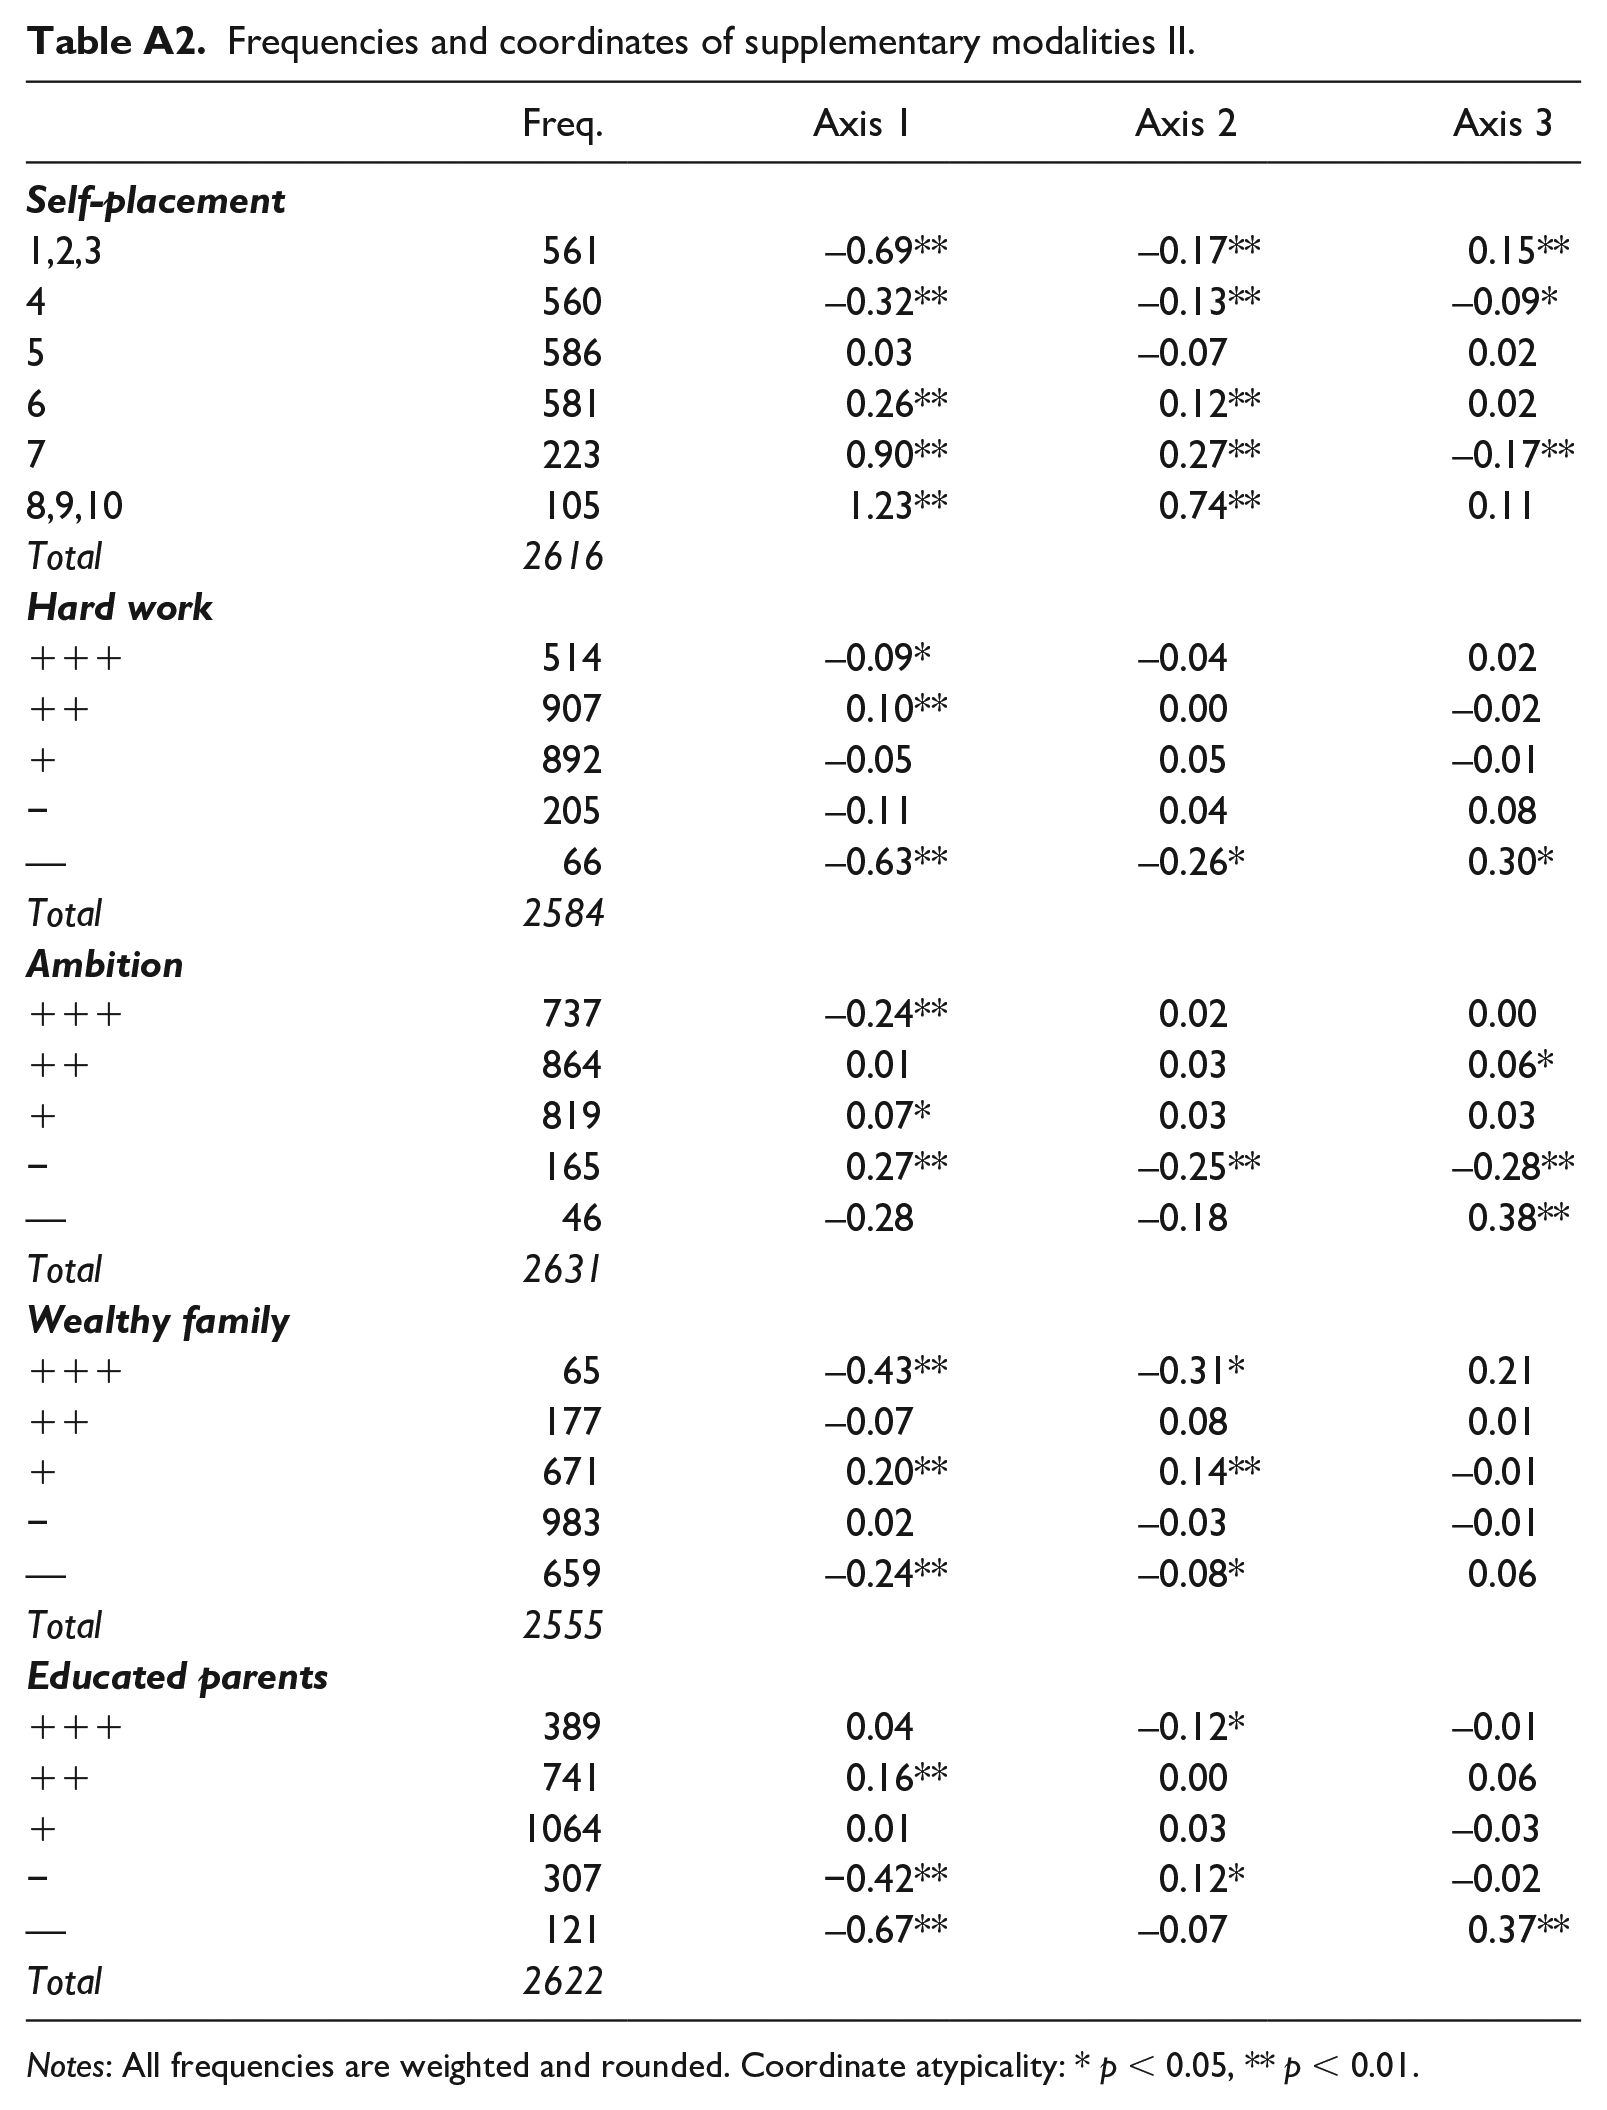
Frequencies and coordinates of supplementary modalities II.
| Freq. | Axis 1 | Axis 2 | Axis 3 | |
|---|---|---|---|---|
|
|
||||
| 1,2,3 | 561 | –0.69** | –0.17** | 0.15** |
| 4 | 560 | –0.32** | –0.13** | –0.09* |
| 5 | 586 | 0.03 | –0.07 | 0.02 |
| 6 | 581 | 0.26** | 0.12** | 0.02 |
| 7 | 223 | 0.90** | 0.27** | –0.17** |
| 8,9,10 | 105 | 1.23** | 0.74** | 0.11 |
| Total | 2616 | |||
|
|
||||
| +++ | 514 | –0.09* | –0.04 | 0.02 |
| ++ | 907 | 0.10** | 0.00 | –0.02 |
| + | 892 | –0.05 | 0.05 | –0.01 |
| − | 205 | –0.11 | 0.04 | 0.08 |
| — | 66 | –0.63** | –0.26* | 0.30* |
| Total | 2584 | |||
|
|
||||
| +++ | 737 | –0.24** | 0.02 | 0.00 |
| ++ | 864 | 0.01 | 0.03 | 0.06* |
| + | 819 | 0.07* | 0.03 | 0.03 |
| − | 165 | 0.27** | –0.25** | –0.28** |
| — | 46 | –0.28 | –0.18 | 0.38** |
| Total | 2631 | |||
|
|
||||
| +++ | 65 | –0.43** | –0.31* | 0.21 |
| ++ | 177 | –0.07 | 0.08 | 0.01 |
| + | 671 | 0.20** | 0.14** | –0.01 |
| − | 983 | 0.02 | –0.03 | –0.01 |
| — | 659 | –0.24** | –0.08* | 0.06 |
| Total | 2555 | |||
|
|
||||
| +++ | 389 | 0.04 | –0.12* | –0.01 |
| ++ | 741 | 0.16** | 0.00 | 0.06 |
| + | 1064 | 0.01 | 0.03 | –0.03 |
| − | 307 | −0.42** | 0.12* | –0.02 |
| — | 121 | –0.67** | –0.07 | 0.37** |
| Total | 2622 | |||
Notes: All frequencies are weighted and rounded. Coordinate atypicality: * p < 0.05, ** p < 0.01.
Funding
The research on which this article is based was funded by the European Research Council (ERC) under the European Union’s Horizon 2020 research and innovation programme (Grant agreement No. 677055).