
Abstract
Cultural consumption and production are both characterised by multiple dimensions of inequality. Research in cultural stratification has highlighted the links between the exclusivity of cultural production, the type of cultural works created, and the audiences and public receptions for culture. We contribute to this agenda by examining a hitherto unexplored area: the cultural values and political identities of workers in the creative industries and cultural sector. Analysis of the British Social Attitudes (2010–2015) surveys and British Election Study Internet Panel (2016–2017) surveys demonstrates that creative and cultural workers have distinct cultural values. They are among the most left-wing, liberal and pro-welfare of any occupations and industries. This sets them apart from the average respondent who is relatively more right-wing, authoritarian and more in favour of welfare control. When examining their non-electoral participation, we also find they are highly civically engaged in terms of contacting elected representatives and government officials, signing petitions, political volunteering, political donations, participating in demonstrations, ethical consumption and boycotts, and industrial action. Moreover, they are more likely to report that they supported Remain in the 2016 EU ‘Brexit’ Referendum, to report unhappiness with the Leave result, and to identify with Remain voters. We conclude that distinct occupational cultures are particularly significant in the case of the cultural and creative sector, given creative workers’ role in representing society and the civic realm via the products of their work. We also argue that occupational cultures constitute an important, under-recognised source of social and cultural division.
Keywords
Introduction
Cultural production is currently the subject of high-profile media and policy discussion, in particular the connection between who produces and who is represented on stage, page and screen. Exclusion from key cultural industries, such as film, television and theatre, indicates a need for change and reform. There are numerous examples: longstanding campaigns such as #OscarsSoWhite drawing attention to the lack of diversity within the Academy of Motion Picture Arts and Sciences (and associated award nominations and winners); focus on how the film industry is structured and who is represented following #MeToo (Banet-Weiser, 2018); recent criticism of arts organisations in the UK, such as the National Theatre and Royal Opera House, for failing to deliver on promises of gender parity in productions; and public policy responses from institutions such as the British Film Institute and the UK’s Department for Digital, Culture, Media and Sport to the dominance of arts and cultural occupations by those from middle class social origins (Department for Business, Energy and Industrial Strategy [BEIS], 2018; Draper, 2018).
Two lines of thought prevail in such debate. On the one hand, there is concern regarding careers ruined and destroyed, or never begun, as a result of biases around who is assumed to be the right ‘type’ to be a director, lead a major theatre production, or work in particular sections of the media. These systemic biases are well-established by a longstanding academic literature (Gill, 2014; Wreyford, 2018). Secondly, there is a broader sense that the characteristics of those who do enter the sector are connected to the representations created, and in turn the demographics of the audience. A different demography of production might create different representations and audiences. This latter point has been well-critiqued from both a political economy of culture perspective (Gray, 2016; Mellinger, 2003), and by critical race theorists of media (Saha, 2018). However, important questions remain around aspects of cultural production in the context over debates on representation and consumption.
This article develops this literature by focusing on the values of those working in the cultural sector, who are thus an important component of artistic, literary and media production. Currently, we have almost no empirical understanding of cultural workers’ values beyond bespoke industry surveys (Creative Industries Federation [CIF], 2016) and high-profile public statements (Harkaway et al., 2019). Sociological research can make a vital intervention here, by clarifying the values and attitudes of cultural workers and how they are patterned (Campbell, O’Brien, & Taylor, 2019). This article contributes to explaining the continued inequalities identified by current sociological research on the creative industries, as well as making an intervention into public debates regarding inequality and cultural production.
We begin by situating our interest in attitudes and values within the literature on the relationship between cultural production, cultural consumption and social inequality (Brook, O’Brien, & Taylor, 2017; O’Brien, Allen, Friedman, & Saha, 2017; Oakley, Laurison, O’Brien, & Friedman, 2017; Oakley & O’Brien, 2016). In doing so we connect, for the first time, research on cultural production and inequality to research on values. Considered together, these literatures indicate the importance of understanding the cultural dimensions of values and value divisions, and the under-researched role of values and attitudes in cultural production.
To understand the values of those occupations producing culture, we move in two stages. First, we use British Social Attitudes (BSA) survey data to examine the values of those producing culture, including those working in the arts and media. We demonstrate a major gulf in values between people producing culture and the nation at large, not simply explained by these cultural producers’ relative youth and high education. We find that cultural sector workers exhibit unusually liberal, pro-welfare and left-wing attitudes.
Secondly, to validate this analysis, we use British Election Study (BES) data to explore basic values alongside measures of political behaviour in the form of reported EU Referendum vote choice and political repertoires, as well as attitudes towards the Referendum result and identification with Leavers and Remainers. We identify important values-related differences between cultural workers and others in both datasets, along with differences in their political participation. These two analytic stages build on existing findings regarding the social closure of occupations associated with cultural production (O’Brien, Laurison, Miles, & Friedman, 2016; Oakley et al., 2017). How different occupations foster different attitudes and values has been important for theories of a ‘creative class’ (Florida, 2002). Until recently, such research tended to celebrate the ‘open’ and meritocratic attitudes of cultural workers, rather than relating these values to questions of inequality, theorised recently by Littler (2018). In demonstrating the cohesiveness of cultural occupations around specific values distant from much of the rest of the population, we identify a further dimension whereby cultural production in the UK is socially closed. This position is mirrored by work on the labour force of the sector in terms of class, gender and ethnicity (O’Brien & Oakley [2015] provide a summary).
This analysis has implications for the literature on cultural production, the primary frame for our article. It also has implications for discussion of contemporary social divisions perceived as ‘cultural’ or values-based. Our analyses indicate that the values of Britain’s cultural workers are relatively distant from the population that they claim, and are expected, to represent. Accordingly, understanding the values of cultural workers is an important public, as well as academic, area of concern.
Cultural production, inequality and the problem of values
Culture is marked by inequality. Here, we focus on culture in terms of arts and media participation and consumption, in turn distinguished from education, religion and everyday cultural practices such as language or food cultures (Miles & Leguina, 2017). Sociological work has identified how the production of culture is characterised by significant inequalities. Numerous authors highlight the exclusion of women, ethnic minorities, and those from working class origins, noting the employment conditions and hiring practices underpinning these problems (Alacovska, 2017; Ashton & Noonan, 2013; Banks, 2017; Conor, Gill, & Taylor, 2015; Hesmondhalgh & Baker, 2011; McRobbie, 2015; Saha, 2018). Of particular interest is the attempt to connect these inequalities in production with those in consumption. For example, recent work on consumption for England suggests that ‘about 8.7% of the English population is highly engaged with state-supported forms of culture . . . this fraction is particularly well-off, well-educated, and white’ (Taylor, 2016, p. 169). This ‘middle class’ domination of cultural consumption (for example theatre, dance, visual arts and even cinema) is matched by middle class social origins’ overrepresentation in the cultural workforce (O’Brien et al., 2016; Oakley et al., 2017).
The overlap between cultural production as a set of occupations dominated by the middle class, and that same middle class dominance of audiences for state-supported cultural forms, has important social implications (Hanquinet, 2017). Knowledge of arts and culture, whether classical or contemporary, has been highlighted as crucial in gaining access to other middle class professions, such as financial services and senior managerial occupations (Friedman & Laurison, 2019; Rivera, 2015). Indeed, Rivera’s conception of ‘hiring as cultural matching’, where leisure pursuits and taste patterns play a role in employment decisions, is a good example of the importance of cultural consumption in reproducing social inequalities (Bourdieu, 1984). In the creative industries, Koppman (2016) has similarly demonstrated that shared tastes and cultural socialisation are crucial to individuals being viewed as the right ‘sort’ of creative worker.
Whilst this literature is extensive, with rich empirical and theoretical contributions, the question of shared values and socio-political priorities, as opposed to shared patterns of cultural tastes, backgrounds, or demographic characteristics, is under-examined. Indeed, values tend to be implicit in discussions of cultural workers’ commitment to long hours and exploitative working conditions (McRobbie, 2015), rather than the subject of formal investigation. Moreover, this empirical question has particular significance given recent theorisation of the connection between cultural production, cultural representation and cultural consumption (Hesmondhalgh, 2018; O’Brien et al., 2017; O’Brien & Oakley, 2015). The values of cultural workers might both account for some of the social closure of cultural occupations, and have wider importance for social division more broadly. Relatedly, social and political division has been discussed recently in terms of values divides (Jennings & Stoker, 2016), in which context the match or otherwise between cultural producers’ values of cultural production and those of the rest of the population raises questions about these occupations given their role in imagining the nation-state (Anderson, 1983; Elgenius, 2011; Hobsbawm & Ranger, 1983). This task has a long history, with contemporary cultural production and consumption central to new identities and the formation of citizens’ values and attitudes (Bennett, 2013).
Understanding culture, understanding values
The role of cultural production in shaping values has particular salience given current social and political divisions. These are most obviously crystallised in the example of the UK’s Referendum on EU membership, whether in the form of media ascriptions of ‘winners and losers’ of social change, or generational and educational contrasts (Livermore & Clarkson, 2017). They have been addressed in recent political science research relating to Brexit (Clarke, Goodwin, & Whiteley, 2017; Farrell & Newman, 2017; Glencross, 2016; Hobolt, 2016), Westminster politics (Allen & Cairney, 2017; Evans & Tilley, 2017), and the emergence of ‘Two Englands’ divided by values as much as economics and class (Jennings & Stoker, 2016, 2017).
Sociology has also responded in the form of a social media series (The Sociological Review, 2016), a recent edited collection (Outhwaite, 2017), a special issue (Dodd, Lamont, & Savage, 2017), as well as monograph treatments (e.g. Seidler, 2018). Whilst much of this literature has referred to ‘cultural’ differences or ‘cultural’ explanations for social divisions (following Alexander, 2003), attention has tended to focus on those exhibiting cultural backlash (Goodhart, 2017; Norris & Inglehart, 2019) rather than those ‘leading’ cultural change (although Jennings & Stoker [2017], from a political science perspective, have explored the values of higher-status professionals). While findings have emerged regarding associations between cultural consumption and Euroscepticism (Chan, Henderson, Sironi, & Kawalerowicz, 2017), there has been no formal assessment of the role of the cultural sector in current social divisions of the type exemplified by ‘Brexit’.
At the individual level, values can be understood as ‘an enduring belief that a specific mode of conduct or end-state of existence is personally or socially preferable’ (Rokeach, 1973, p. 5); as ‘conceptions of the desirable that guide the way social actors (e.g. organisational leaders, policy-makers, individual persons) select actions, evaluate people and events, and explain their actions and evaluations’ (Schwartz, 1999, p. 24); ‘internal criteria for evaluation’ (Hechter, 1993, p. 3); and as higher-order preferences over specific preferences, relating to longer-range goals, ideals, moral values and identities (Frankfurt, 1971; Hirschman, 1982; Sen, 1997). Such meta-preferences are involved in self-construction and vision of the future, and consideration of themes including ‘solidarity, fairness, prudence, and nationalism’ (Fischer, 2014, p. 59).
We know that values are primarily formed and embedded during formative years, with cultures changing due to cohort replacement (Mannheim, 1928/1972; Ryder, 1965). It has been found that those born between 1986 and 1990 have significantly different basic values compared with older cohorts due to their experience of the recession of the late 2000s, with ‘increases in the importance of Security-Conformity values during hard times . . . concentrated among the economically vulnerable and the young’ (Austin, 2015, p. 149).
Values are also thought to be patterned by occupation, with those of public sector workers different from those in financial services, for example. In the following analysis, we first investigate the basic values and attitudes of cultural producers, comparing them with other occupational groups. We use measures of values relating to some of the most polarising political questions: from left to right, liberal to authoritarian, and pro-welfare to anti-welfare. We validate findings using a second dataset including relevant values and attitudinal items, which moreover incorporates measures of political behaviour.
Cultural producers and cultural values: Data and analysis
First, we consider the values of cultural workers, in light of their advantaged social background as established in the previous section (O’Brien et al., 2016; Oakley et al., 2017). There has however been little to date on the social attitudes and values of these workers, particularly from a quantitative perspective (Florida’s [2002] work on America notwithstanding). Variation in basic values by occupation forms a lacuna in the literature on values, with one exception being Broockman, Ferenstein, and Malhotra’s (2019) pioneering study of the values and policy preferences of Silicon Valley’s elite.
We accordingly draw upon the BSA survey, a long-running, high-quality survey fielded annually since 1983 (save the 1987/1992 election years). It involves a multi-stage stratified random sample, with respondents interviewed face-to-face. Each year it asks respondents of their position on basic values, from which are calculated values scales provided with the dataset. Balanced left–right and libertarian–authoritarian values scales were first devised by Heath and Evans with others in the 1990s. In a paper validating these scales, they concluded that: ‘[w]hen measured suitably, these form consistent, stable and consequential elements of British political culture’ (Evans, Heath, & Lalljee, 1996, pp. 108–109).
We analyse three values dimensions: libertarianism–authoritarianism; welfarism; and left–right values, with details of the items making up each scale specified in online appendix Table A2 (see note on access at end of article). To check scale reliability some two decades following their original validation, we calculated Cronbach’s alpha for each values scale, finding 0.74 for libertarianism-authoritarianism, and 0.82 for each of the welfarism and left–right scales (see Table A3 in the online appendix). We then treat each scale measure as the dependent variable, modelling values positions in terms of occupation to assess whether cultural workers are distinctive, first by comparing them with other workers at different levels of occupational status, and then in terms of occupational sector.
For the first, we draw on the National Statistics Socio-Economic Classification (NS-SEC), which categorises occupations across sectors. We use a five-fold categorisation: managerial/professional, intermediate, employers in small organisations, lower supervisory and technical, and routine. Secondly, we use the Standard Industrial Classification (SIC) 2007, which classifies businesses by type of economic activity. Twenty-one sectors are categorised as well as those who have never had a job and those whose work is ‘not classifiable’. ‘Arts, entertainment and recreation’ includes those employed in creative, arts and entertainment activities; in libraries, archives, museums and other cultural activities; those employed in gambling and betting activities; and those employed in sports, amusement and recreation activities (Prosser, 2009). This is a little broad, but other sectors are likewise – for example, the categorisation of health practitioners in SIC 2007 covers surgeons and health care assistants alike. Indeed, any differences we find between cultural workers and other sectors might well be attenuated by the inclusion of those employed in gambling and sports. Using both occupational status and industrial classification allows us to be more certain as to whether any differences are sectoral rather than down to occupational position per se. Ideally, we would distinguish sector and occupational status within a single set of analyses. The key difficulty is that many sectors are relatively concentrated in terms of occupational status, and sample sizes are not sufficient to identify occupational versus sectoral effects. Accordingly, we provide both sets of analyses so that cultural workers can be compared with members of other sectors of equivalent occupational status, followed by an exhaustive set of sectoral comparisons.
Because the percentage of arts, entertainment and recreation workers in each wave of the BSA is very small (between 1.5% and 2%), we boost our sample by combining six waves of the BSA, pooling the 2010–2015 datasets. We make the strong assumption that there are no period effects on values over this timeframe. Descriptive statistics are available in the online appendix (Table A1).
We run an identically specified set of models to examine whether cultural workers are distinctive, taking the same set of additional variables associated with values differences into account. We first treat libertarian–authoritarian values as the outcome of interest (where higher indicates greater authoritarianism); secondly, support for welfare (where higher indicates greater anti-welfarism); and finally, left–right values (where higher indicates more right-wing values). We examine how scores on each scale vary by occupational class (comparing cultural workers with managerial, intermediate and routine workers not based in the arts); and then by industrial code.
In both cases, we restrict the comparison to BSA survey respondents aged between 23 and 65, to exclude student-age respondents and those of retirement age. This yields a sample size for our analyses ranging from 11,313 to 11,936. Despite this relatively large sample size, given the small proportion of respondents who are cultural workers, we do not restrict the analysis to those who are currently employed: those identifying with a particular sector are likely to retain a connection via shared worldview and perhaps intend a return to work. Figure 1 illustrates the distribution of scores on each scale: lower scores represent more left-wing, more liberal and more pro-welfare values respectively.
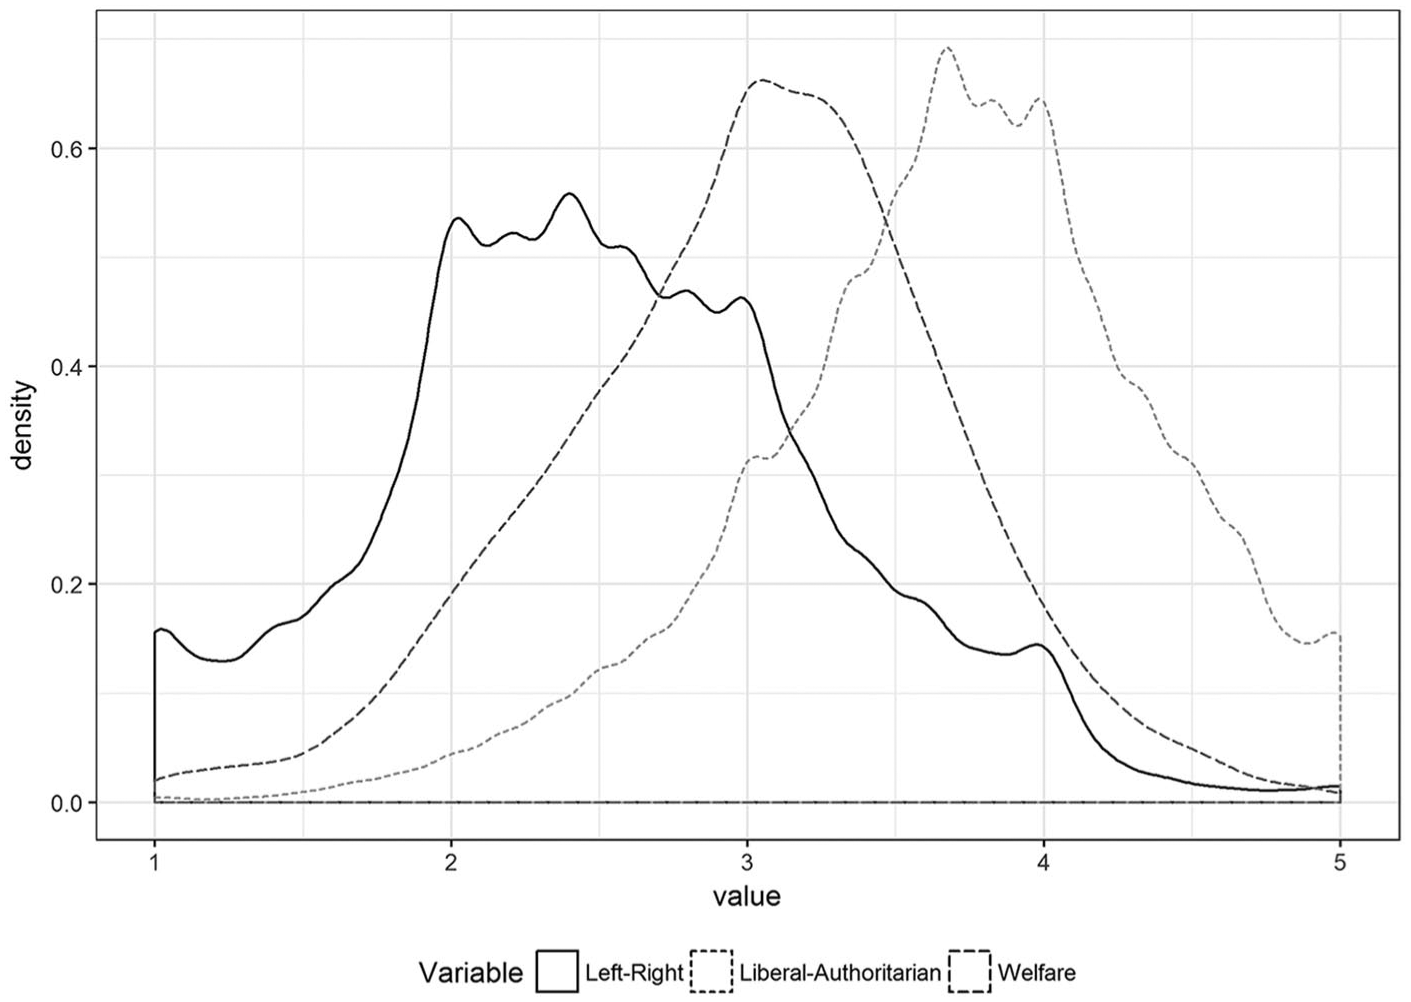
Distribution of scores on Left-Right, Liberal-Authoritarian, and Welfare scales.
Explaining this relationship: Occupational values in the cultural sector
The data show that arts workers are the most liberal on average of all industrial sectors in the BSA. We next examine whether they are more liberal on average than each of the other groups once socio-demographic confounders are taken into account, modelling values as a function first of occupational class, then of sector. In the first case, we categorise managerial/professional and intermediate/working class cultural workers separately, to test whether the cultural sector is distinct when taking account of its heavily professional composition. We could also theorise that those with particular values self-select into different fields, with values further reinforced by the sectoral environment. Given that we are working with cross-sectional survey data, we discuss associations between variables rather than making a strong causal argument.
In models taking account of occupational class summarised in Figures 2, 4 and 6, we set routine workers as the reference category. In each, unadjusted (raw) means and confidence intervals are presented in grey, and adjusted (predicted) means and confidence intervals in black. In our second, sectoral set of models (with results presented in Figures 3, 5 and 7), we include terms for each economic sector, setting arts, entertainment and leisure workers as the reference category, comparing workers in other sectors to our key sector of interest. Because of the importance of education for basic values (Surridge, 2016) we control for differences in educational attainment, distinguishing graduates, those with some higher education, A-level or equivalent, the old O-level or equivalent, CSEs, ‘foreign qualifications’, no qualifications, and don’t know/refused to answer (a relatively large group). We also control for gender, social generation, marital status, ‘home nation’, ethnicity and religion of upbringing (see online appendix Tables A4–A9 for full details).
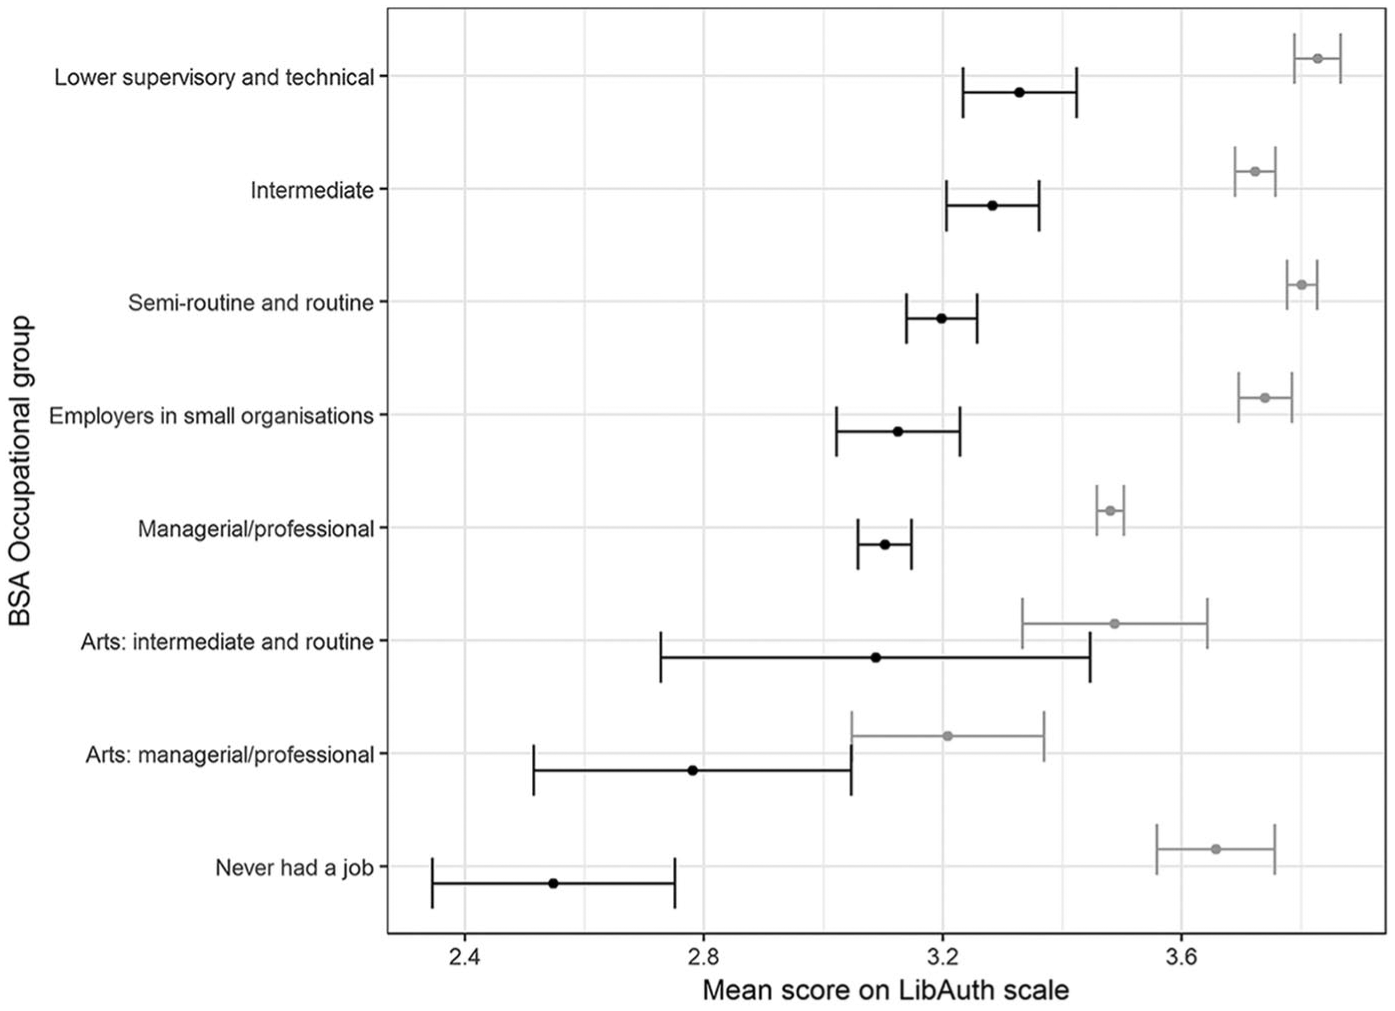
Mean scores on libertarian–authoritarian scale by occupational classification.
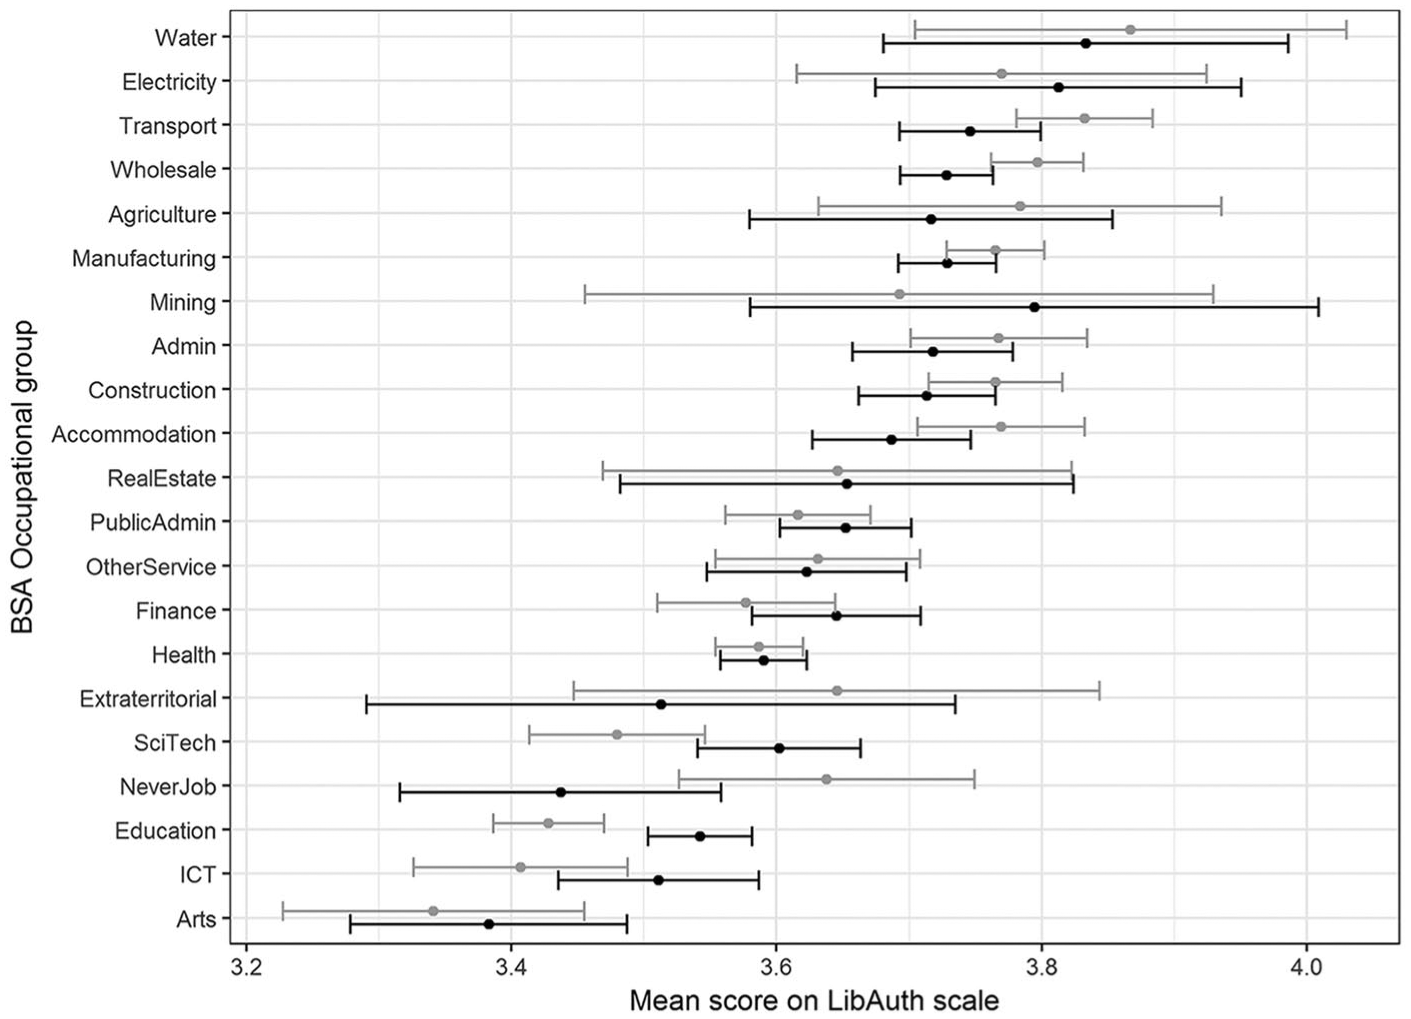
Mean scores on libertarian–authoritarian scale by occupational sector.
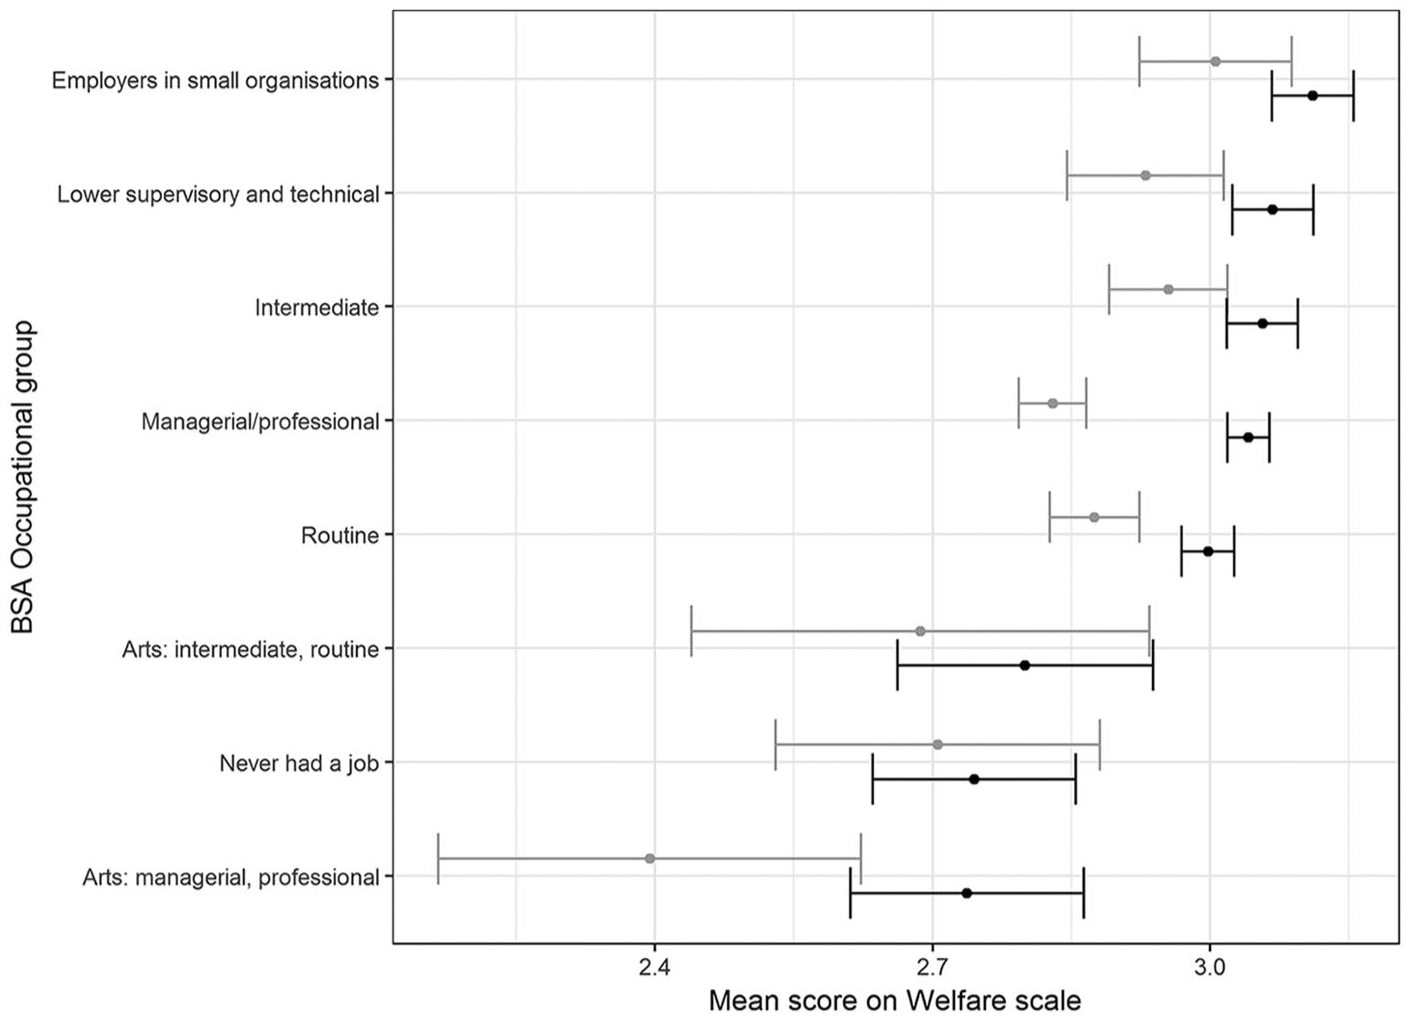
Mean scores on welfare scale by occupational classification.
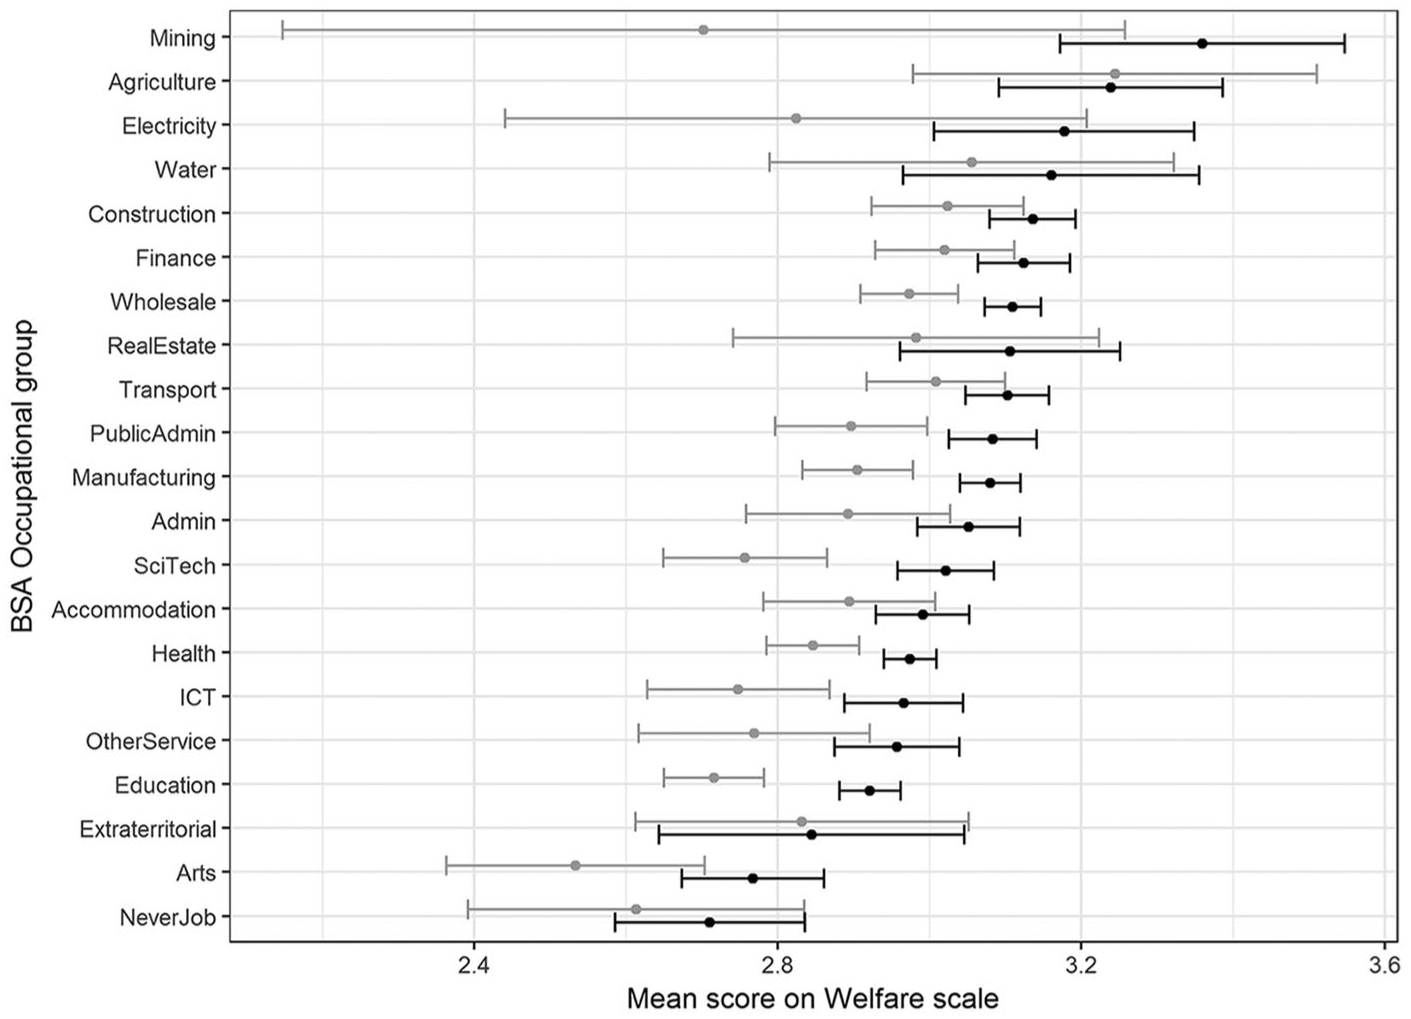
Mean scores on welfare scale by occupational sector.
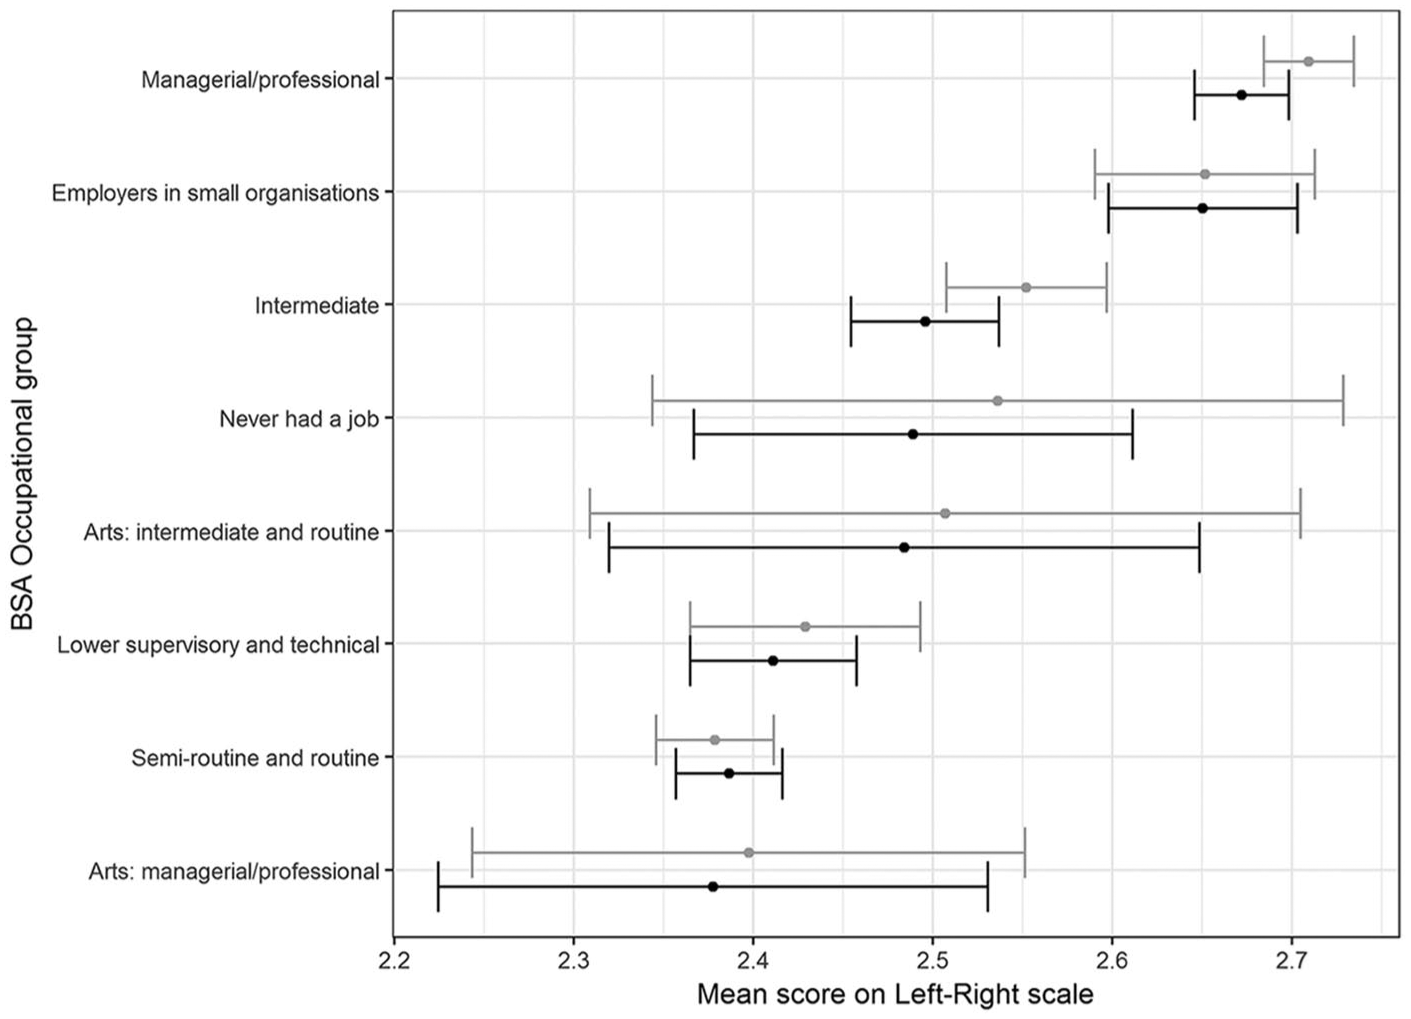
Mean scores on left–right scale by occupational classification.
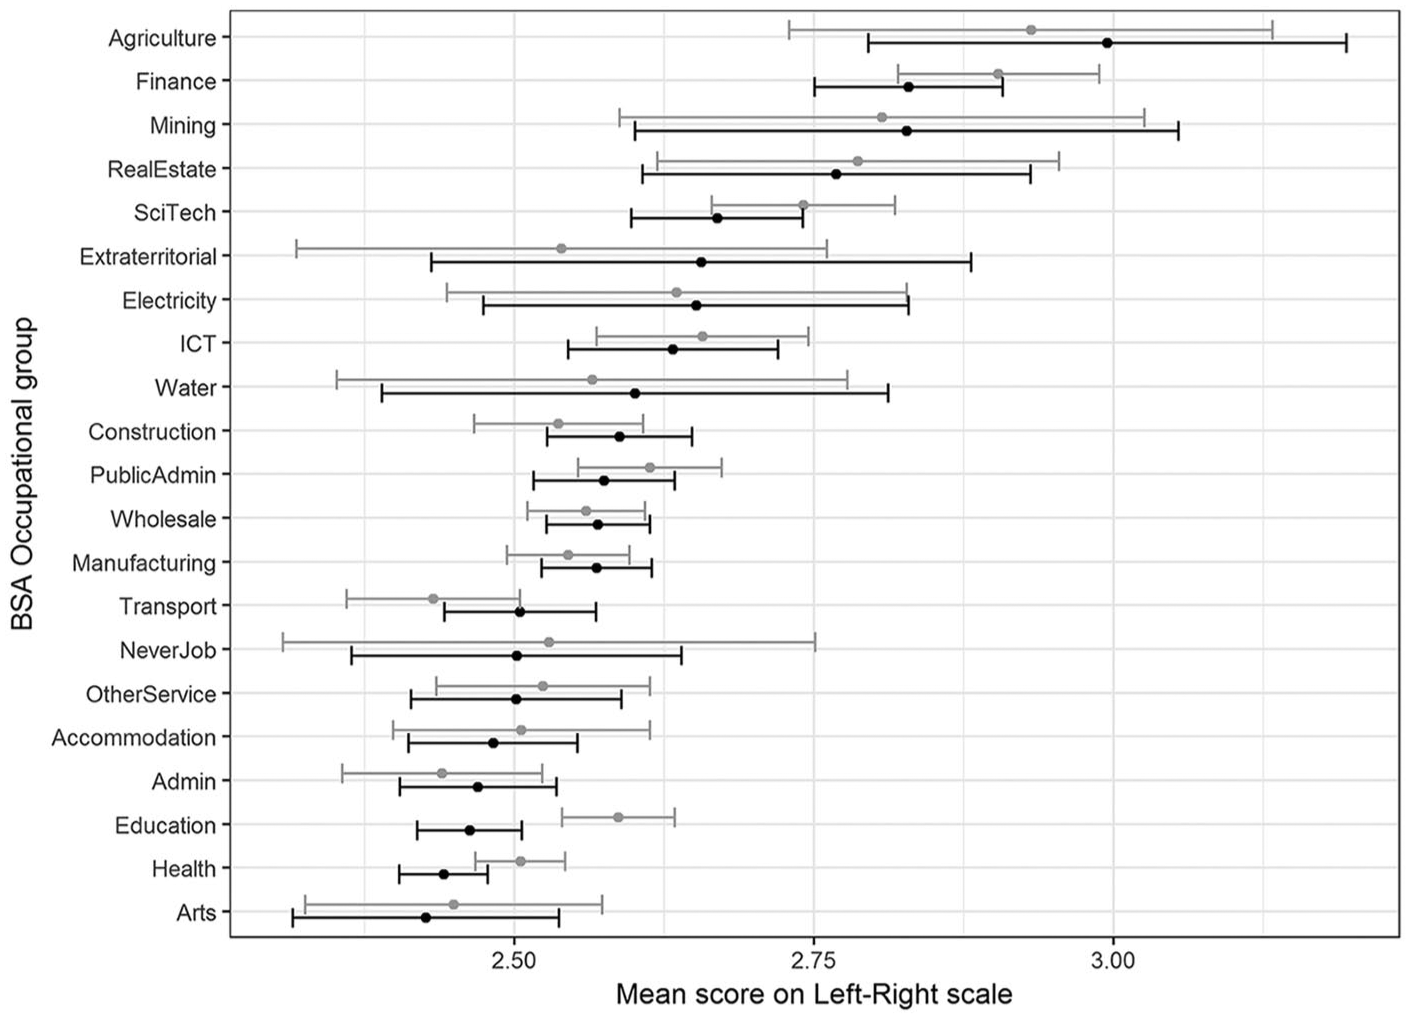
Mean scores on left–right scale by occupational sector.
We find that the effects of socio-demographic control variables on libertarian–authoritarian values are consistent with the established literature (see Tables A4–A5 in the online appendix). With regard to education, every educational group is found to be more liberal than those with no qualifications, except for those providing a ‘don’t know’, refusal or ‘not applicable’ response. The sizes of the effects are as expected, being largest for those with the highest credentials.
Turning to occupational class in Figure 2, comparing each group in turn to routine workers, we find (via the confidence intervals presented in black) that managerial and professional workers are significantly more liberal than routine workers, lower supervisory and technical significantly less so, while there are no statistically significant differences between those in intermediate occupations, small business owners and routine workers. Those who have never worked appear significantly more liberal, perhaps comprising a group of those travelling or still in study. We also find that those in the ‘arts: managerial and professional’ and ‘arts: intermediate and routine’ groups are significantly more liberal than routine workers. Moreover, they are more liberal than members of the managerial and professional group, although the difference is not statistically significant. The difference between the two categories of arts workers is also not significant, suggesting they share a sectoral rather than class-based values profile. Nevertheless, these results imply that the ‘arts worker’ difference holds even after accounting for education, gender, ethnicity and religion of upbringing.
These results can be compared with those from a model including a full set of sectoral terms (Table A5), to investigate whether the arts remain distinctive. All sectors were significantly less liberal than the arts sector at the 1% level, including educators, health workers and public administrators, save for information and communication (where p = 0.052), households as employers, extraterritorial organisational workers (such as diplomats and organisations such as the United Nations), and those who have never worked, where such workers were all predicted to be less liberal but where differences were not significant.
To simplify presentation of the model results, we calculated predicted scores for each sectoral group assuming mean values for each control in Figure 3. To reiterate, arts workers remain the most liberal even when socio-demographic controls have been taken into account, with differences that are statistically significant from all other groups except ICT workers (the second-most liberal group before taking other variables into account), domestic workers, and people who have never had a job or who work in extraterritorial roles (both very small in number). This leaves us confident that there is indeed a sectoral difference in worldview.
Turning to welfarist values, in terms of occupational status, those with managerial or professional status are more anti-welfare than those of routine or semi-routine status; so are intermediate workers, and small business owner-employers, and those of lower supervisory or technical status (Figure 4). By contrast, those who have never had a paid job are clearly more pro-welfare. However, arts managers and professionals are more pro-welfare than even this group, while intermediate arts and entertainment workers are more pro-welfare than routine workers, if a little less than those who have never worked.
We see similar patterns when examining the model with a full set of terms for economic sector (Figure 5). The arts and entertainment sector is the most pro-welfare of all sectors at the 1% level except for, again, domestic workers, people who have never had a job, and those in extraterritorial roles.
Finally, we model left–right values. Considering occupational status (Figure 6), those of managerial or professional status, intermediate status and small business owners were all more right-wing than routine and semi-routine workers once other socio-demographic controls were taken into account (Table A8). Lower supervisory workers and those who had never worked were not significantly different. In this model, cultural workers were predicted to be slightly more right-wing on average in their political values than routine and semi-routine workers. However, differences were not significant, and even with a larger sample unlikely to be very large in size. The final model using BSA data predicts left–right values in terms of industrial sector (see Figure 7). Arts, entertainment and leisure workers are predicted to be the most left-wing of all sectors, but differences are generally smaller than in the earlier models, and in many cases not statistically significant. Specifically, workers in the water, transport, hospitality, administration, education, health, services, domestic service, extraterritorial, never-worked and unclassifiable sectors are not predicted to be significantly more right-wing (Table A9).
Taking the three values measures together, compared with workers of equivalent occupational status, cultural workers are the most liberal on average, and the most pro-welfare (except for the ‘never worked’ sector). Differences in terms of left–right values are less pronounced at a sectoral level, but cultural workers are more left-wing than managerial and professional workers, regardless of their own occupational status. Moreover, it does not appear that the liberal, pro-welfare and left-wing orientation of the arts sector is simply a result of cultural workers being more educated or professionally dominated: differences between arts workers and people working in other sectors increase once other variables are controlled for. These results suggest that cultural producers, tasked with interpreting and representing cultural memory and the cultural present, share a distinctive worldview setting them apart from much of the British public. The differences are admittedly not large given the noise in the data, relating in turn to the small size of the cultural workers group (n = 273) in our sample. 1
Validating the analysis
To further validate the results from the BSA analysis, we incorporate analysis of data from the BES online panel administered by YouGov. The most recent (13th) wave of the BES at the time of our analysis, collected in June 2017, has 31,196 respondents, of whom 26,669 also participated in the previous wave, and of whom 5,832 have participated in all 13 waves from February 2014. Cases are weighted to resemble the national population.
The BES is particularly valuable in offering a combination of attitudinal and behavioural variables: in addition to asking the types of attitudinal questions typical of the BSA, respondents are asked about their behaviour, including voting, and non-electoral behaviours such as signing petitions and taking industrial action. We can therefore identify whether occupational groups’ attitudes are similar in the BES and in the BSA, and how political behaviours vary by occupation. We thereby triangulate between the two sources to counter the problem of the cultural sector being small in terms of workforce, and to take advantage of robust data at the sectoral level where such sources tend to be lacking. While the BSA is noted for its high-quality sample, drawn from the postcode address file, the BES, in having a number of waves available for the post-June 2016 period, allows us to relate the values of cultural and creative workers explicitly to EU Referendum vote choice. Its key drawback is its online panel design meaning responses are likely to suffer from associated biases, for example regarding poor representation of the digitally disadvantaged. Further, the range of values measures available is smaller. Measures of workforce composition also differ. Accordingly, the BSA and BES are best used in combination to compare cultural workers to others. Together, they offer complementary topic coverage as well as the opportunity for model validation across datasets.
We use the following measures for comparison. First, we investigate the left–right and libertarian–authoritarian scales available in the BES to assess whether similar patterns in values exist across the two surveys. Note that these scales run 0–10 rather than 1–5 as in the BSA. We then extend our analysis with two attitudinal variables directly relevant to Brexit, of importance given its relation to cultural divides and as a new source of identification. First, on a 0–10 scale, respondents were asked ‘How happy or how disappointed are you that the UK voted to leave the EU?’, where 0 is ‘Extremely disappointed‘, and 10 is ‘Extremely happy’. Secondly, on a 0–10 scale, they were asked ‘How much do you think you have in common with people who want to remain in the EU?’, where 0 is ‘Nothing’ and 10 ‘A great deal’, with this latter measure drawn from Wave 9. 2 These two attitudinal variables thereby capture two elements of people’s attitudes towards the EU Referendum, both around an affective response to the result, and a measure of how closely people identify with Remain voters.
Finally, we examine two behavioural variables. The first is whether respondents reported having voted to leave the EU, or remain a member. To simplify, we set those who report not having voted aside. The second is a measure of non-electoral political participation. This is an additive scale made up of whether respondents reported having undertaken the following within the last 12 months, drawn from Wave 6:
Contacting a politician, government or local government official
Signing a petition on the internet
Signing an offline petition
Volunteering for a political party or action group
Giving any money to a political party, organisation or cause
Taking part in a public demonstration
Buying – or refusing to buy – any products for political or ethical reasons
Going on strike or taking industrial action.
The Cronbach’s alpha for the eight items is 0.71, indicating reasonable internal consistency. Taken together, these measures capture a broader repertoire of political behaviours and attitudes than available in the BSA, relating directly to the EU Referendum and broader civic engagement. As with the BSA, the fraction of people in cultural occupations in the BES is small. There are further compromises for comparative purposes. Unlike the BSA, there is no variable capturing industrial classification, and fine-grained Standard Occupational Codes are also not available. However, the BES team does include a variable for whether respondents work in occupations classified as the cultural and creative industries (CCI), following the DCMS definition (Department for Digital, Culture, Media and Sport [DCMS], 2016). This group is significantly larger and broader than that in the BSA, at around 5.5%. It comprises advertising and marketing; architecture; crafts; design; film, TV, video, radio and photography; IT and software development; publishing; museums, galleries and libraries; and music, performing and visual arts.
Neither the SIC nor CCI definitions should be viewed as capturing only the subsidised arts sector. However, again, these broader definitions are more likely to reduce rather than enhance any sectoral differences we might identify. The BSA cultural workers sample includes gambling and sports (mostly retail betting staff and gym and recreation centre staff), while the BES CCI sample includes those who might otherwise be categorised as private sector professional services workers. Indeed, 88% of CCI workers in the BES sample are in managerial and professional occupations, meaning that given our sample sizes, the confidence intervals around estimates for intermediate and routine CCI workers are large. This reflects the occupational basis of the DCMS definition, in which the majority of CCI occupations are located in NS-SEC I and II.
Otherwise, our modelling strategy is similar to that for the analysis using BSA data. We use linear regression where the variables are measured on 0–10 and 0–8 scales, and logistic regression for the model of Referendum vote choice (Leave support = 1, Remain = 0). Again, we restrict analysis to those aged 23–65, with identical control variables as for the BSA models, save for religion of upbringing, which is unavailable (using current religious affiliation radically reduces the sample size and so was rejected as an alternative). Again, detailed model results are available in our online appendix (see Tables A11–A16).
Figure 8 displays predicted outcomes for each of the models using the BES, again with (weighted) raw means and confidence intervals in grey, and means and confidence intervals after adjusting for control variables in black. Consistent with Figure 4, those working in CCIs in managerial and professional jobs are found to hold significantly more liberal values than any other group, save for those non-managerial CCI workers (where the confidence interval is very wide, perhaps reflecting the small sample). Unlike in Figure 7, however, those working in CCIs are not here estimated to be significantly more left-wing than the remainder of the population. In this dataset, those in managerial and professional jobs in the CCIs hold similar economic left–right values to those in managerial and professional jobs outside the CCIs. This discrepancy may partly arise due to its being an online panel, with participants particularly well educated and politically engaged, for which sample weights cannot entirely adjust. It further suggests that the left–right differences identified in the BSA sample are likely to be small in the population if they do exist.
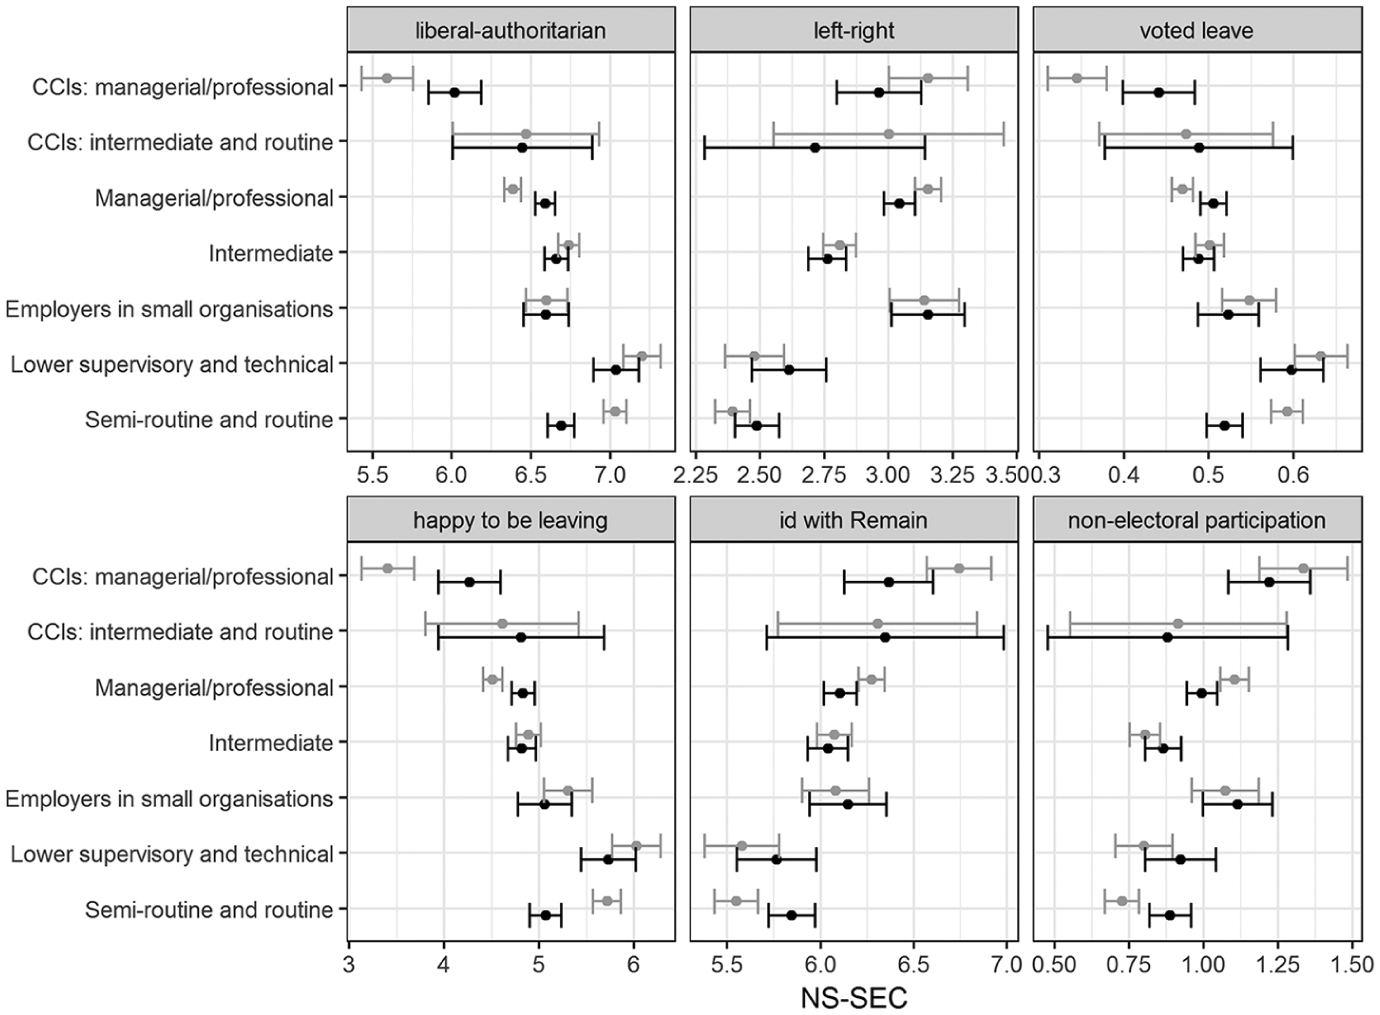
Predicted outcomes for each of the models using the BES.
The results for our other attitudinal variables are, however, largely consistent with the hypothesis that cultural and creative industry workers hold different attitudes from the rest of the population about the decision to leave the EU. This is particularly the case in terms of happiness with the Referendum result. CCI workers in managerial and professional jobs are significantly less enthusiastic about leaving the EU than any other group, although note that intermediate and routine CCI workers have attitudes indistinguishable from their comparators. By contrast, while those working in the CCIs identify more strongly with Remain voters, these differences are not significant when other variables are taken into account – intriguing given the prominent emergence of ‘Leave’ and ‘Remain’ as new political identities (Curtice, 2018).
We also find differences in political behaviour. Behavioural measures are particularly valuable in indicating active commitment to engagement (Pattie, Seyd, & Whiteley, 2003). Those who are highly engaged behaviourally are likely to have greater political agency and efficacy (Sewell, 1992) and symbolic capital (Bourdieu, 2002), even if their political aims are dissensual. Moreover, behavioural choices provide potentially informative contrasts with values-based measures. The former require explicit choices among strategic alternatives, while the latter relate to instinctive reactions to morally infused questions, to capture the culture–action link (Vaisey, 2009, p. 1688). Regarding the Referendum, only 34% of those working in managerial and professional jobs in the CCIs who reported voting said that they supported leaving the EU in the BES, compared with 52% of the total population who voted in the Referendum. Our model shows that even after accounting for socio-demographic variables, a statistically significant difference persists between those working in cultural and creative jobs and people working in other managerial and professional jobs (see Table A13). While a large literature on EU Referendum vote choice now exists, this occupational effect is a novel finding suggesting avenues for further research.
In addition, managers and professionals in the CCIs have significantly higher rates of non-electoral political participation than managers and professionals in non-CCI jobs, likely capturing both greater volume of participation and more diversified participation, even taking into account other relevant variables. This may reflect homology between activism for an arts organisation in sourcing funding and support and citizen activism: they involve similar skills and resources (Verba, Schlozman, & Brady, 1995) in translating effort into political outcomes. Civic engagement also reflects access to civic networks of political activists and others who are politically engaged (Putnam, 2000), as well as having trust in other people and institutions as a basic value (Uslaner, 2000). Our model predicts that compared with otherwise demographically similar managers and professionals, creative workers engage in about a quarter of an activity more on average, a difference approaching half the size of the effect of being a graduate compared with having no qualifications. This is of note since in values-related research the ‘graduate effect’ is generally considered large (see Table A16). Further research would allow us to identify the extent to which this reflects cultural workers’ closer proximity and access to state institutions.
In sum, we find that key political attitudes and values of professional and managerial CCI workers appear quite distinct from other workers of equivalent occupational status: significantly less likely to have voted Leave, significantly unhappier with the Referendum result, and with significantly broader political repertoires indicating an additional dimension of social advantage and status. For intermediate and routine CCI workers, differences with other workers of the same occupational status are less distinct, leaving open the possibility that the intersection of sector and occupational status accounts for value and behavioural divergence, although we remain cautious regarding likely mechanisms due to small sample size.
Conclusion
Cultural production is rightly considered an important area for understanding and explaining contemporary British society. There is extensive evidence that cultural production is marked by significant forms of exclusion, with associated exclusions found in patterns of cultural consumption. The role of values and attitudes in these exclusions has yet to be fully understood. Our research provides a first contribution in demonstrating that cultural production is characterised by distinct values.
We find that cultural workers exhibit values that are unusually liberal, pro-welfare and left-wing by comparison with those of similar occupational status and, in terms of liberalism and welfarism, with cognate sectors. They are also relatively unhappy about leaving the EU, while also reporting having voted Remain to a higher degree than the rest of the population. They also appear to possess greater political efficacy, so that their position in governing the ‘cultural conversation’ is reinforced by their more extensive civic engagement.
This suggests a divergence in worldviews between those tasked with representing the nation to itself, and those who inhabit it. It reflects elements of the ‘Two Englands’ highlighted by Jennings and Stoker (2016) more overtly pronounced in cultural occupations, themselves largely urban-based (Oakley et al., 2017). This divergence has also been noted for Britain, France and the US by Piketty in his (2018) analysis of new cleavages and multidimensional inequalities.
This divergence relates to a more general question on the relationship between values and practices. There is a longstanding research tradition concerned with how media frame particular social issues and thus shape and influence society’s values and attitudes. Recent examples include work on austerity and politics (Wren-Lewis, 2018); perceptions of welfare recipients (Reeves & De Vries, 2016); and factual welfare television (De Benedictis, Allen, & Jensen, 2017). While extremely valuable in describing and problematising representation, our contribution is novel in providing the first large-scale empirical analysis of the values and attitudes of cultural workers – with findings which suggest why particular frames might be chosen, and which indicate avenues for further research. That cultural workers tend to be liberal, pro-welfare and relatively left-wing may not be wholly surprising. The question that follows, then, is the distance between the attitudes and values of the sector’s workers and the academic analysis demonstrating bias in reporting or representation, as seen in theatre (Rogers & Thorpe, 2014), and publishing (Ramdarshan Bold, 2019).
We are hopeful this discussion will prompt new research to help understand this somewhat paradoxical divergence between values and representations. Are cultural workers’ values irrelevant to the type of culture produced, because the political economy of production is more influential? Here the work of Saha (2018, developing Gray, 2016) demonstrates that costs, ownership and funding models are more important than ‘demography and representation’ for explaining poor representation and lack of diversity. If this is so, then we might see liberal attitudes as a key criterion for entry to cultural work (as Friedman & Laurison [2019] have observed regarding television commissioning), while indicating that these same attitudes and values are insufficient for challenging and changing the inequalities underpinning the public concerns increasingly voiced.
Supplemental Material
SOR_871401_Sup_Mat – Supplemental material for The values of culture? Social closure in the political identities, policy preferences, and social attitudes of cultural and creative workers
Supplemental material, SOR_871401_Sup_Mat for The values of culture? Social closure in the political identities, policy preferences, and social attitudes of cultural and creative workers by Siobhan McAndrew, Dave O’Brien and Mark Taylor in The Sociological Review
Footnotes
Acknowledgements
The authors thank Aveek Bhattacharya, Will Jennings, Jonathan Mellon and the British Election Study team, Michael Rushton, participants at the University of Leicester CAMEo Annual Conference 2017 and at the Understanding Everyday Participation colloquium (Manchester, June 2018), Michaela Benson and anonymous reviewers for their insightful comments and assistance. We also gratefully acknowledge our collaboration with Arts Emergency, Create London, and the Barbican Centre via the Panic! 2018 project.
Funding
This work was supported by AHRC grant AH/P013155/1, ‘Who is Missing from the Picture? The Problem of Inequality in the Creative Economy and What We Can Do About It’.
Online supplementary data
Notes
References
Supplementary Material
Please find the following supplemental material available below.
For Open Access articles published under a Creative Commons License, all supplemental material carries the same license as the article it is associated with.
For non-Open Access articles published, all supplemental material carries a non-exclusive license, and permission requests for re-use of supplemental material or any part of supplemental material shall be sent directly to the copyright owner as specified in the copyright notice associated with the article.