
Abstract
Aerodynamic drag is a dominant factor affecting the efficiency and driving range of electric trucks, especially at high speeds. Although previous studies have mainly focused on external drag-reduction devices, internal airflow control strategies such as integrated ducts have received limited attention. This study addresses that gap by analyzing how placing an internal duct in the truck body affects drag and power efficiency. A simplified two-dimensional computational fluid dynamics (CFD) approach was employed using ANSYS Fluent to evaluate and compare a baseline truck model and a modified configuration featuring a central internal duct. The simulations assessed the drag coefficient, drag force, propulsion power, and energy consumption over a wide range of inlet velocities (50–140 km/h). The results show that the ducted configuration consistently outperforms the baseline model, achieving up to a 7.5% reduction in drag force, 7.53% savings in energy consumption per kilometer, and an 8.2% extension in driving range at 140 km/h. These findings confirm the aerodynamic and energy-saving potential of internal ducting as a passive design strategy for heavy-duty electric vehicles.
1. Introduction
Electric trucks experience significant energy losses due to aerodynamic drag, particularly at highway speeds where it becomes the dominant resistive force opposing motion. Among the various factors influencing aerodynamic performance, the drag coefficient (Cd) is a key parameter. Even slight reductions in Cd can lead to substantial improvements in driving range and overall energy efficiency, making it especially critical in the design and operation of heavy-duty electric vehicles. 1 While most prior studies have concentrated on external drag-reduction techniques such as fairings, side skirts, boat tails, and vortex generators to reduce wake and pressure drag, the concept of internal airflow management, including ducting systems embedded within the vehicle structure, has received comparatively little attention, particularly in the context of large electric vehicles (EVs).2,3
Some preliminary computational fluid dynamics (CFD) and numerical studies on concept models (e.g. modified Ahmed bodies) found total drag reductions exceeding 15% when internal ducts were introduced.4–6 This approach can also preserve airflow kinetic energy for potential energy recovery systems.7,8 In addition, patent literature reports channeling systems that redirect the frontal airflow to rear vacuum zones to replace negative pressure zones with positive pressure, thereby reducing drag and even aiding propulsion[9–11].
Recent studies have employed CFD-based approaches to optimize vehicle aerodynamics and reduce drag across a wide range of applications. Guerrero and Castilla 12 conducted an analysis on a Formula 1 car, showing that effective wake control not only reduces drag but also improves overtaking by minimizing the aerodynamic impact on trailing cars. Similarly, Damjanović et al. 13 optimized a concept car’s front and rear profiles using ANSYS Fluent, achieving notable drag reduction and improved stability, demonstrating the effectiveness of CAD-CFD integration. In another study, Kanekar et al. 14 applied CFD to reshape key regions of a model bus, resulting in a 28% drag reduction and a 20% boost in fuel efficiency. Likewise, Blocken and Toparlar 15 revealed that a trailing vehicle significantly reduces drag on cyclists, highlighting the influence of external disturbances. In the context of external devices, Das and Riyad 16 showed that rear spoilers can minimize both drag and lift, improving high-speed performance and handling. Furthermore, Hetawal et al. 17 optimized a Formula SAE race car by refining body components to reduce Cd while increasing downforce, emphasizing the balance between drag and stability. To ensure accuracy, Zakher et al. 18 validated CFD results against wind tunnel data, confirming its reliability in predicting drag and wake behavior. Moreover, Al-Saadi et al. 19 explored base bleed and ditch modifications on an SUV, improving rear flow stability and reducing drag. Focusing on public transport, Jadhav and Chorage 20 used CATIA and Fluent to reduce drag in commercial buses, supporting energy efficiency. In a similar effort, Azmi et al. 21 employed the realizable k-ε turbulence model to analyze an MPV, achieving a Cd of 0.28. Finally, Hammad et al. 22 investigated the effects of crosswinds during overtaking scenarios, showing that aerodynamic forces and drag can increase by up to 43%, stressing the need to consider environmental dynamics in vehicle design.
A wide range of studies have shown that CFD is a reliable tool for assessing aerodynamic forces and optimizing vehicle design. Abo-Serie et al. 23 applied CFD to optimize the shape of a Shell Eco-marathon car, identifying critical regions of flow separation and reducing the drag coefficient from 0.430 to 0.127 through iterative design improvements. Following this, Thabet and Thabit 24 simulated airflow over a 40° Ahmed body, confirming that CFD can accurately predict drag and lift, with results closely matching experimental data. In a combined approach, Wang et al. 25 validated CFD predictions of aerodynamic forces and torque using wind tunnel tests on a racing car, emphasizing the value of experimental calibration. More recently, Hortelano-Capetillo et al. 26 explored the aerodynamic behavior of the Tesla Cybertruck using SolidWorks Flow Simulation and the k-epsilon model. Their results showed how the truck’s angular design affected drag and lift patterns, underlining CFD’s role in optimizing electric vehicle shapes for energy efficiency.
Researchers have investigated the aerodynamic behavior induced by various external appendages, emphasizing their effect on overall vehicle dynamics. Kim et al. 27 performed a parametric CFD analysis on grille designs in passenger cars, showing that variations in grille geometry affect both drag and engine cooling efficiency. Their work highlighted the importance of balancing aerodynamic resistance with thermal management. In a broader context, Kmecová et al. 28 applied CFD to optimize jet fan layouts in underground car parks for emergency smoke extraction, demonstrating how aerodynamic analysis also supports infrastructure safety and ventilation design. Turning to motorsports, Kalinowski and Szczepanik 29 optimized front wing profiles in racing cars using CFD, achieving improved downforce and flow attachment. Similarly, Skudlarek and Piechna 30 examined wing positioning on time attack cars, finding that careful adjustments enhance front-end grip without excessive drag, emphasizing the trade-off between downforce and efficiency. Nath et al. 31 investigated the aerodynamic effects of spoilers, diffusers, and wings in race cars using ANSYS Fluent. Their results confirmed that such components can simultaneously reduce drag and boost downforce, improving stability and handling at high speeds.
Vehicle shape plays a crucial role in aerodynamic performance, as highlighted in several CFD-based investigations. Kesuma et al. 32 analyzed various body shapes for an energy-efficient prototype vehicle, finding that streamlined designs with minimal vortex shedding achieved the lowest drag. Similarly, Ramasamy et al. 33 combined CFD and FEA to study a hybrid electric vehicle, validating drag predictions and emphasizing the effectiveness of coupled simulations in aerodynamic optimization. In a related effort, Ansari 34 used ANSYS Fluent to reduce drag on the Tata Indica by optimizing frontal geometry and confirming CFD accuracy through comparison with experimental data. Meanwhile, Ramya et al. 35 compared a sedan and an SUV under different spoiler conditions, showing that shape and add-ons significantly affect aerodynamic performance, with the sedan consistently outperforming the SUV. In addition, Kamal et al. 36 provided a comprehensive review of CFD studies on car geometry, evaluating trade-offs between detailed and simplified models in terms of accuracy and computational cost. Ha et al. 37 demonstrated that optimizing pressure relief in the engine bay, particularly around the wheelhouse liner, could reduce overall drag by 1.8%, underscoring the impact of local geometry refinements.
Beyond performance, aerodynamics also plays a critical role in addressing environmental challenges related to vehicle emissions and thermal management. Uhrner et al. 38 used CFD to examine how exhaust particles disperse under real driving conditions, showing how turbulence and condensation affect pollutant spread. Altinisik 39 investigated the impact of engine cooling airflow on drag and underbody flow, identifying trade-offs between cooling efficiency and aerodynamic performance for greener vehicle designs (Table 1).
Comparison of recent CFD studies and the present work based on key aerodynamic and energy-related features.
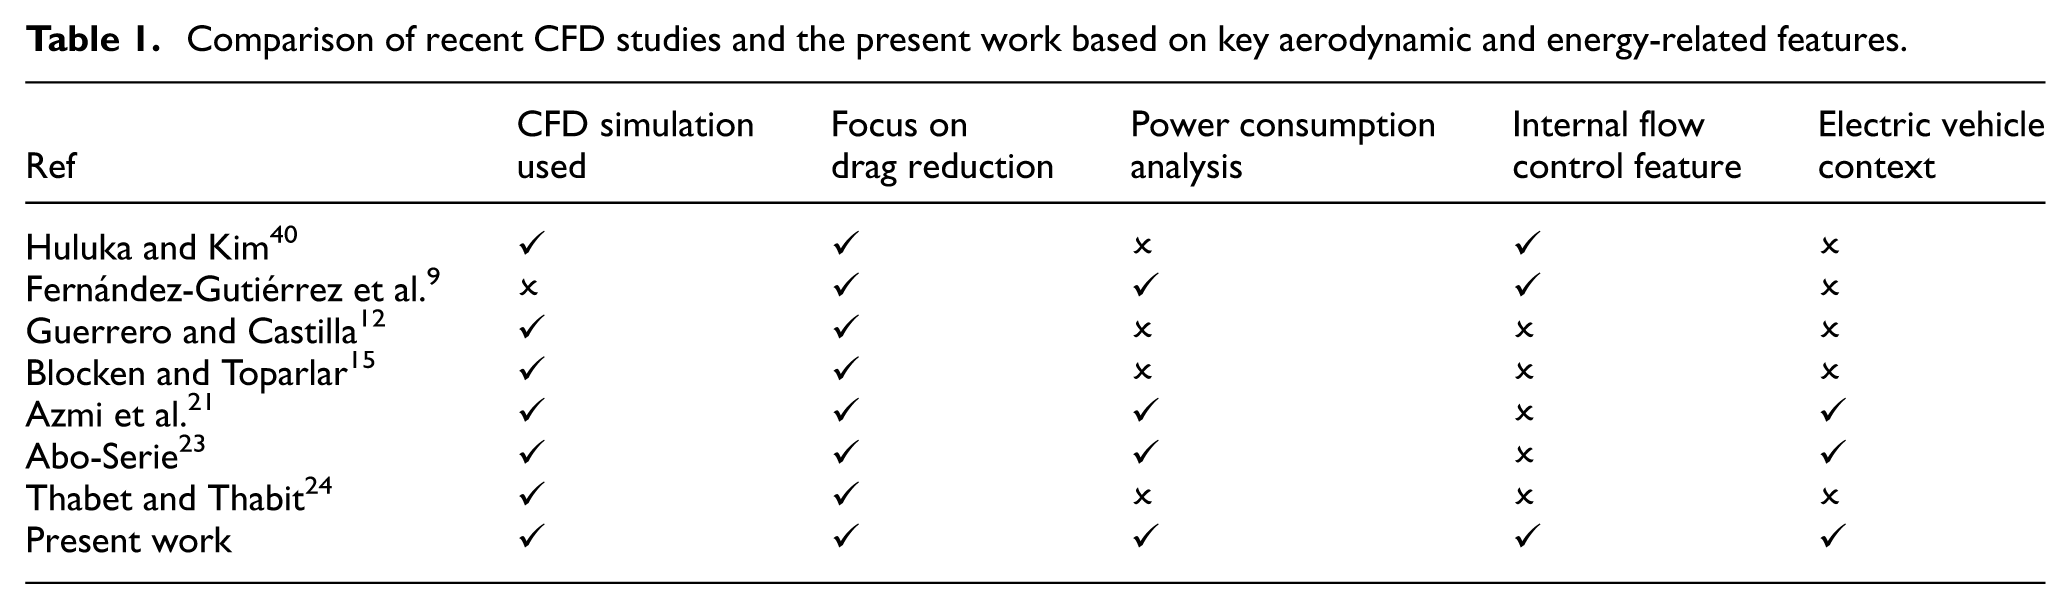
Although Huluka and Kim 40 demonstrated that internal ducting can effectively reduce pressure drag, their study was limited to a simplified Ahmed body and did not extend the analysis to real vehicle geometries or assess power consumption. Similarly, Altair et al. 9 proposed a deflector-based airflow channeling system to reduce aerodynamic resistance and improve fuel efficiency. However, their work relied solely on experimental wind tunnel tests and did not incorporate CFD simulation or specifically target electric vehicle applications. These studies reveal a clear gap in the literature. There is a lack of CFD-based investigations focused on internal flow control strategies specifically for electric truck designs, with direct evaluation of their effects on aerodynamic drag and power consumption. The present work addresses this by employing simplified CFD simulations to examine how an integrated internal duct influences the drag coefficient (Cd) and energy use in an electric truck model.
2. CFD modeling using ANSYS
In this study, a CFD approach was employed to evaluate the aerodynamic performance and energy consumption of an electric truck with and without an internal flow duct. The methodology was carefully structured to include geometry simplification, mesh generation, boundary condition setup, and solution postprocessing. A two-dimensional (2D) model was adopted to reduce computational cost while capturing the essential flow behavior around the truck body and through the duct. The analysis was conducted using ANSYS Workbench 2025 Student Edition with Fluent as the CFD solver. The full simulation process, from geometry design to final evaluation of drag force and power consumption, is illustrated in Figure 1, which presents the schematic representation of the problem-solving methodology adopted in this work.
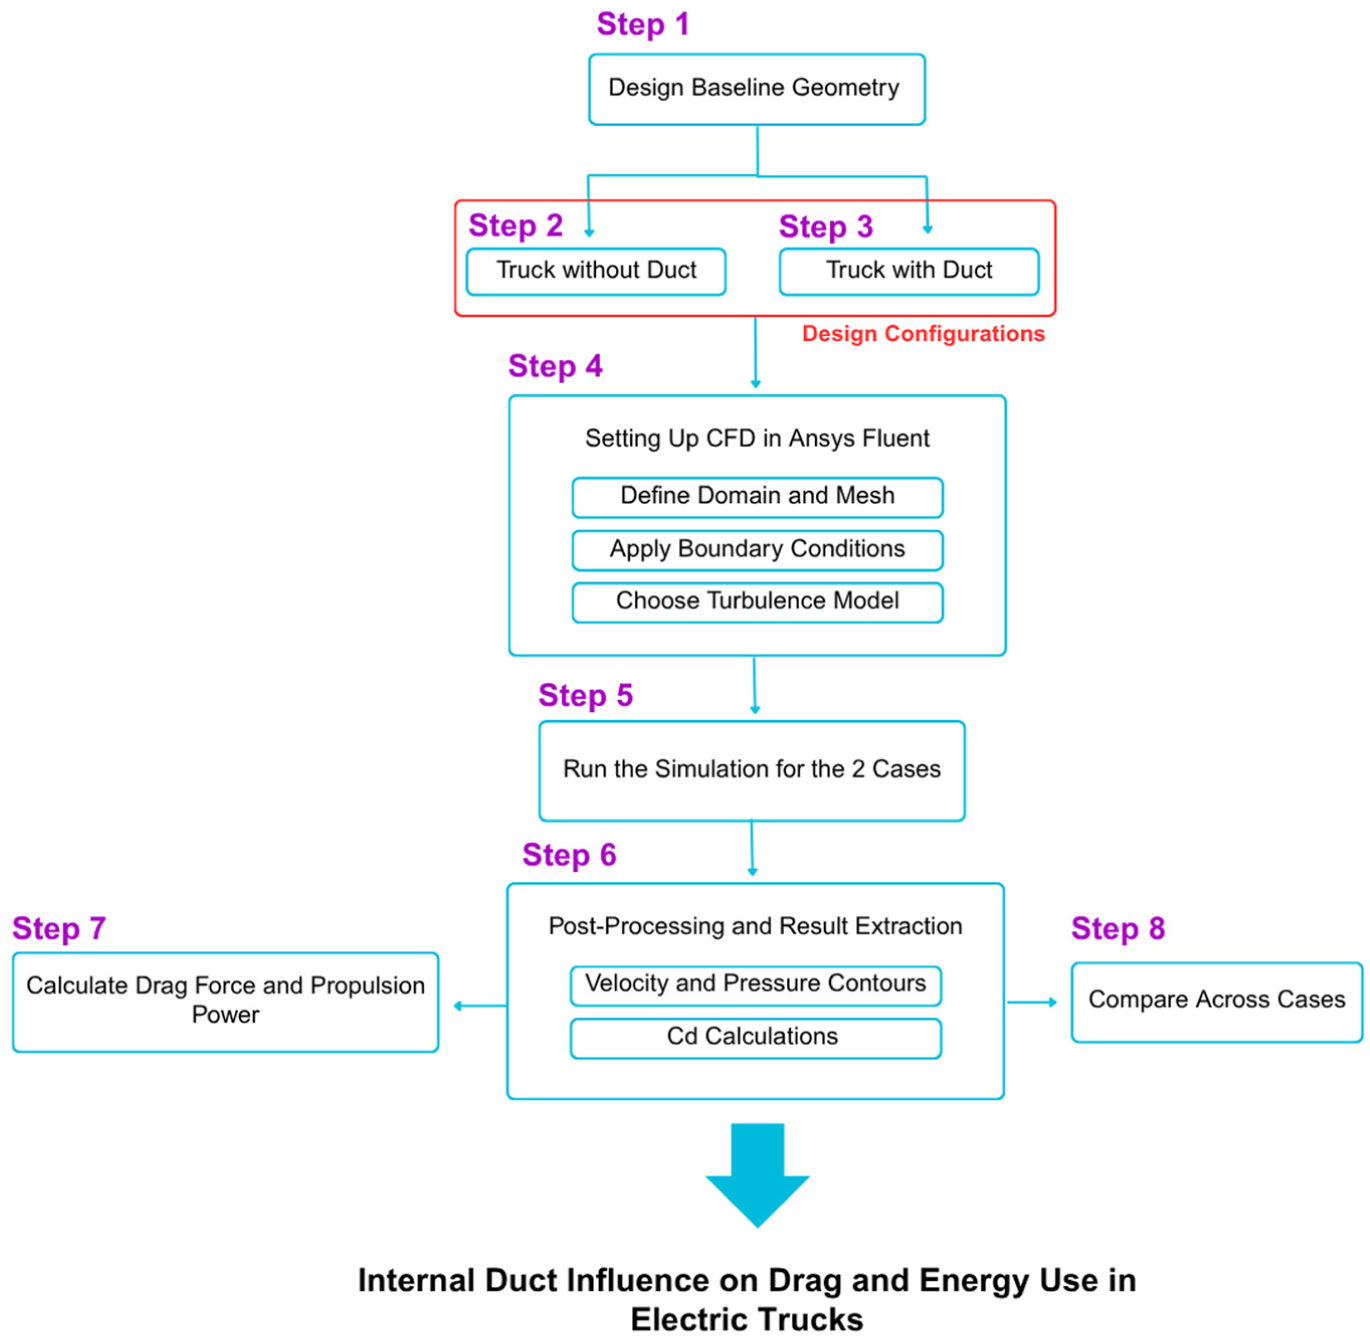
Overview of the CFD simulation methodology, including geometry setup, meshing, boundary conditions, and performance evaluation.
2.1. Geometry and design
A simplified 2D model of an electric truck was developed to investigate the aerodynamic performance with and without the presence of an internal flow duct. The original three-dimensional (3D) geometry of the truck is reduced to a 2D profile by projecting the vehicle’s outline onto a vertical plane, assuming a unit depth in the out-of-plane direction. This simplification significantly reduces computational cost and complexity while maintaining the ability to capture the primary aerodynamic characteristics of the vehicle.
The duct is centrally embedded within the body of the truck and aligned to guide the incoming airflow from the front intake to the rear outlet. This configuration aims to enhance flow distribution and reduce aerodynamic drag. The drag coefficient and the drag force acting on the vehicle change with vehicle speed and rear duct angle; in this work, a rear duct angle of 12 degrees is adopted based on findings reported by Kumar B et al. (2021). 41 The simplified geometries for both configurations baseline without duct and modified with duct are shown in Figure 2.
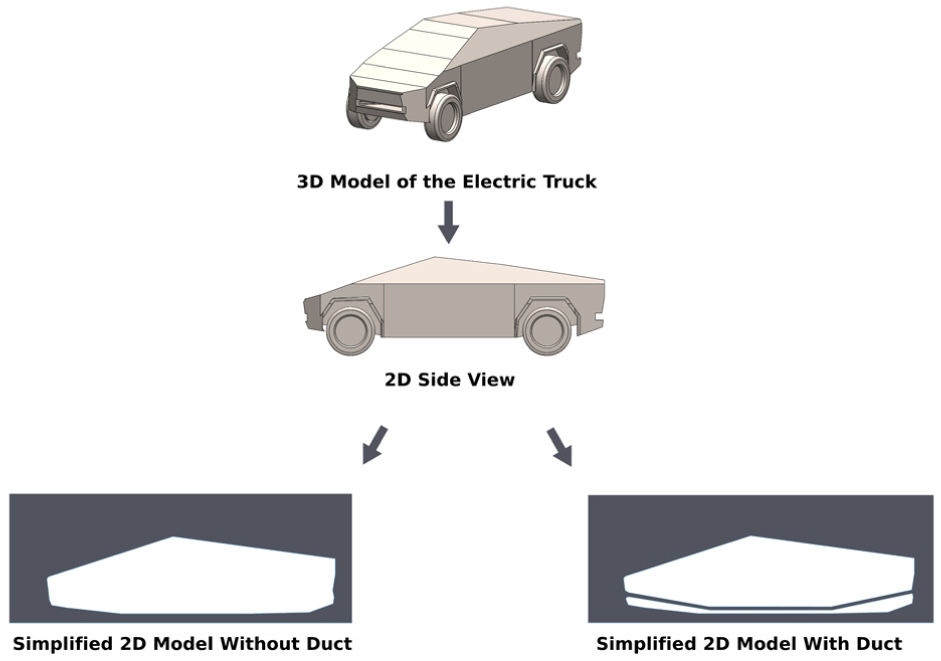
Simplified 2D profiles of the electric truck model showing both the baseline configuration without a duct and the modified configuration with an integrated internal flow duct.
The main geometric dimensions of the truck, including its overall length and height, as well as the duct’s position and size, are provided in Figure 3(a). Figure 3(b) illustrates the simulation domain boundaries and the distances maintained in front of, behind, above, and below the vehicle to reduce the influence of boundary effects. 12 While the 2D modeling approach provides useful insight into aerodynamic trends and relative performance between configurations, it does introduce certain limitations. Notably, it does not capture 3D flow features such as side vortices, flow separation at corners, or detailed underbody effects. Nevertheless, the 2D simplification is considered appropriate for a first-level evaluation of drag-reduction potential and power consumption trends associated with duct integration.
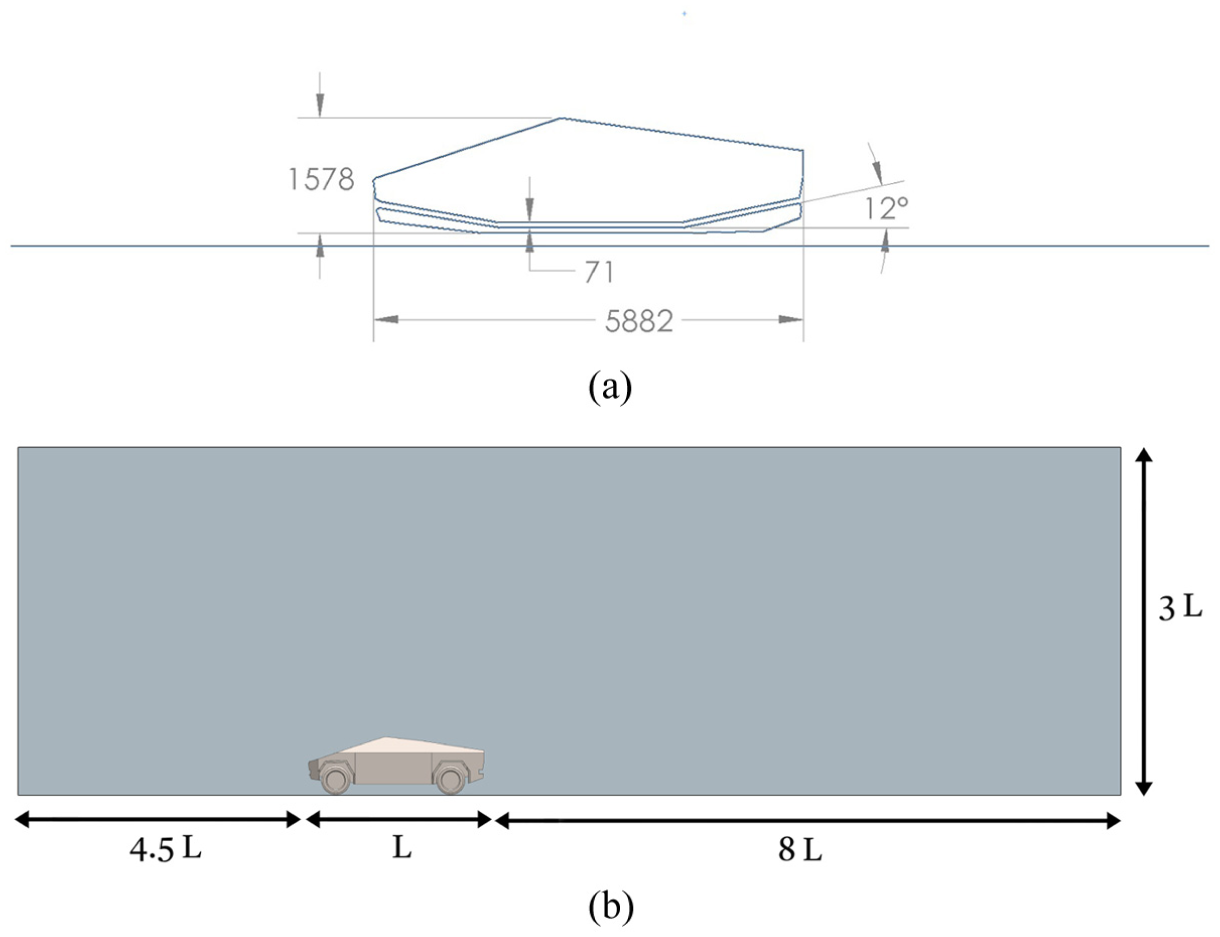
Model setup used for CFD analysis: (a) Geometric dimensions of the electric truck in mm and (b) computational domain and boundary distances.
2.2. Simulation setup
In this work, the analysis aimed to compare aerodynamic behavior between the baseline configuration and a modified one featuring an internal flow duct. The computational domain included inlet, outlet, and wall boundaries. The front boundary was defined as a velocity inlet with varying speeds from 50 to 140 km/h, while the rear boundary was assigned a pressure outlet condition set to 0 Pa. The top and bottom boundaries, along with the vehicle body, were modeled as stationary no-slip walls.
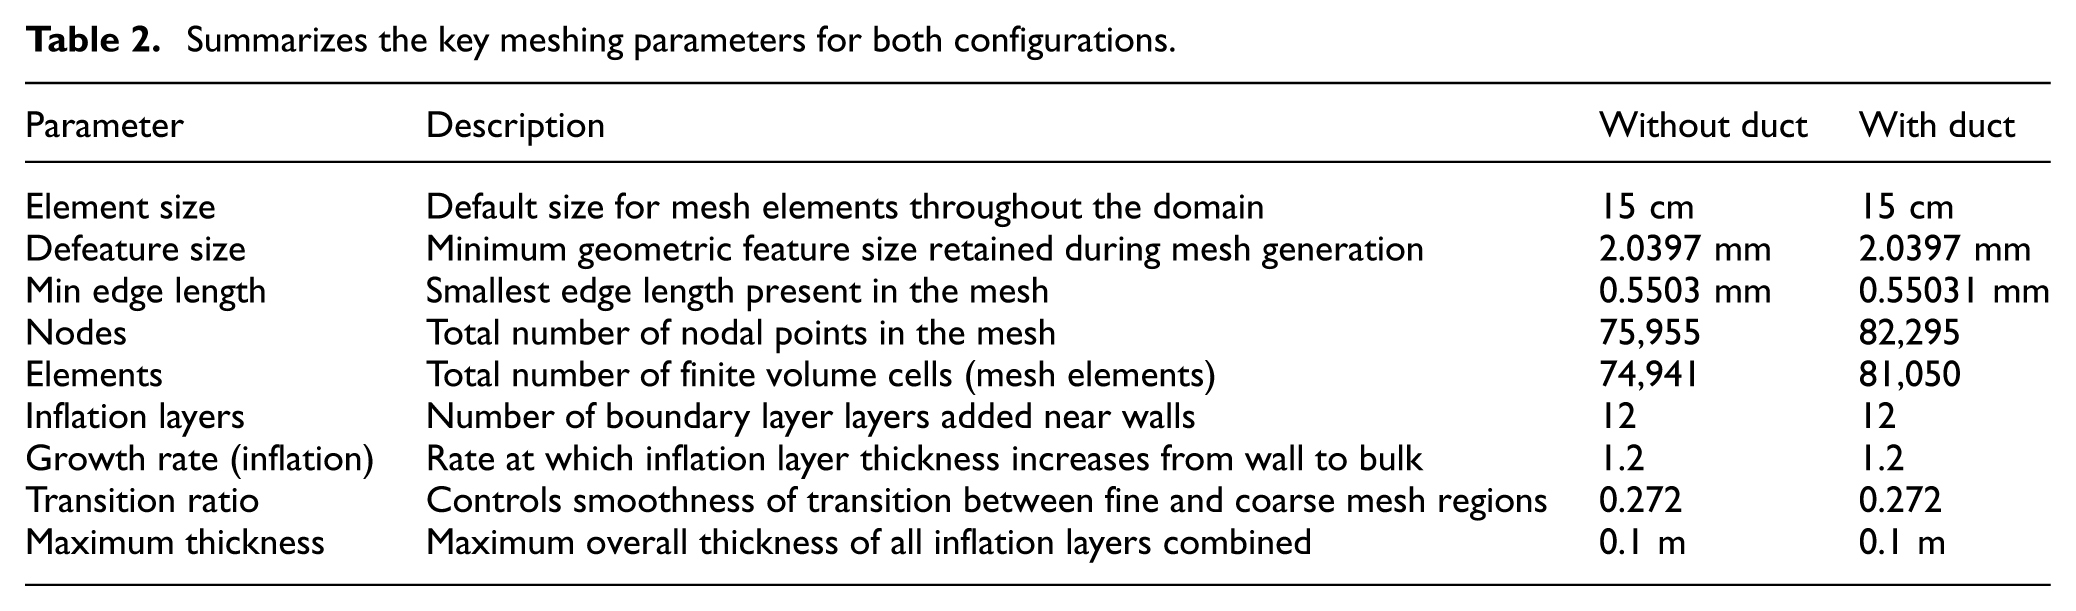
Mesh generation was performed using a structured approach with consistent settings across both models. Inflation layers were added near the walls to enhance accuracy. Figure 4 illustrates the computational domain and mesh configuration for both cases, highlighting the differences in complexity due to the duct integration. Table 2 provides a concise comparison of the meshing parameters for both configurations, highlighting the increased mesh density in the duct-integrated model due to its added geometric complexity. To establish the robustness of the computational results, a grid independence study was carried out, comparing three mesh densities with roughly 62,000, 75,000, and 82,295 elements. The difference in anticipated drag coefficients between the two finest meshes was less than 0.6%, showing that the solution has achieved mesh independence. This threshold is consistent with guidelines in the CFD literature, which characterize a model as grid-independent when consecutive revisions result in changes of less than 1% in global parameters such as the drag coefficient. As a result, the adopted mesh density of 82,295 elements was deemed sufficient to provide convergence, numerical stability, and result credibility while remaining computationally efficient. This approach follows common CFD best practices, where mesh refinement continues until further increases in resolution no longer cause meaningful variations in key aerodynamic quantities such as pressure distribution or drag coefficient. 42
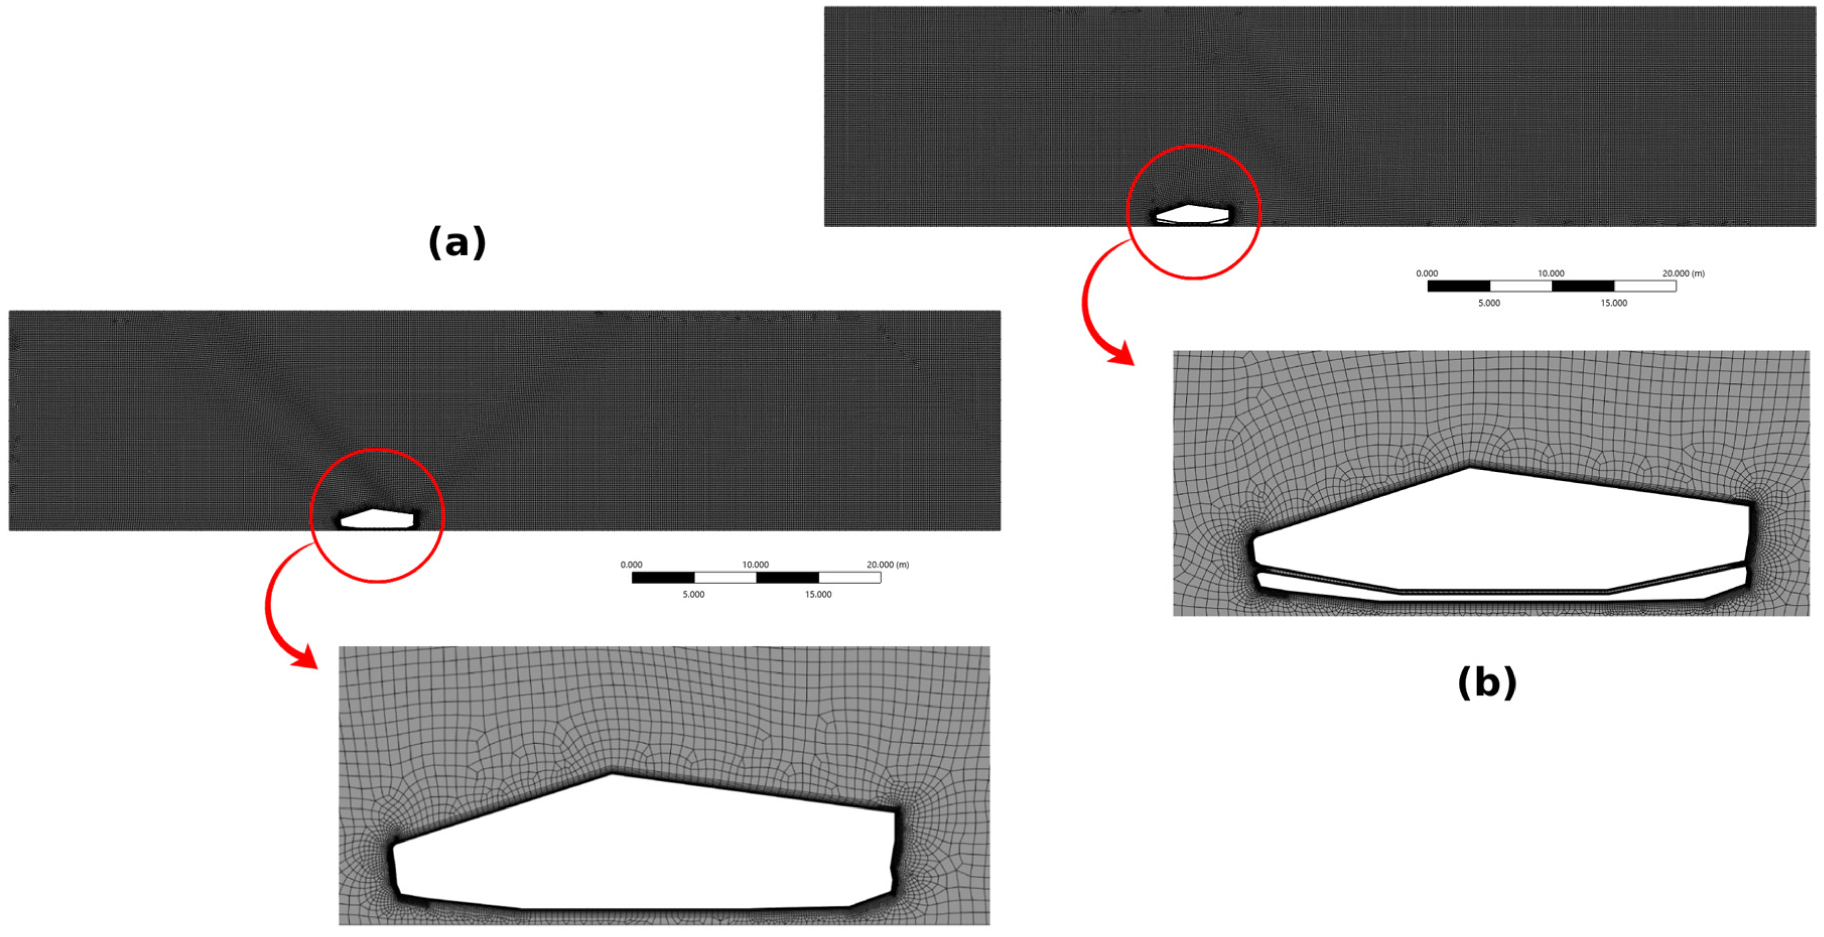
Computational mesh and domain setup for the CFD analysis: (a) baseline model without duct and (b) modified model with internal flow duct.
Summarizes the key meshing parameters for both configurations.
2.3. Assumptions and simplifications
In this study, a 2D planar model was employed to simplify the complex 3D geometry of the electric truck. This approach significantly reduces computational cost and time while capturing the essential aerodynamic behavior along the longitudinal direction. The truck’s geometry was extruded with a unit depth to enable force and power calculations. While this simplification neglects 3D phenomena such as wheel wakes and lateral vortex structures, it remains a common and accepted method for early aerodynamic evaluations and comparative design assessments. 43
A steady-state assumption was adopted, implying that the airflow reaches a static solution for each given inlet velocity. This is typical in external flow simulations where unsteady effects are not the focus. A pressure-based solver with absolute velocity formulation was used, suitable for low-speed, incompressible flows. The turbulence was modeled using the standard k-ε model combined with enhanced wall treatment. This configuration is widely applied in automotive aerodynamics due to its balance between accuracy and stability in predicting flow separation and wall-bounded turbulence. The model uses predefined constants and is effective for flows with mild separation. 44 This study used the standard k-ε turbulence model with enhanced wall treatment. This model is widely employed in external automotive aerodynamics due to its robustness, numerical stability, and computational efficiency. It is well known that the standard k-ε model may overpredict eddy viscosity and the extent of flow separation in cases involving strong wakes behind bluff-body vehicles, which can introduce minor deviations in local pressure or drag estimation. Nevertheless, extensive research has shown that the k-ε model remains sufficiently accurate for comparative aerodynamic assessment, drag-reduction studies, and trend analysis, particularly for simplified vehicle geometries and Reynolds numbers like those used in this work. Therefore, its application here is justified to evaluate the relative aerodynamic improvements introduced by the internal duct arrangement. 45
The air was assumed to be incompressible with constant physical properties at sea-level conditions. A density of 1.225 kg/m3 and a dynamic viscosity of 1.7894×10⁻⁵ kg/(m·s) were used in the simulations, which are standard values for dry air in atmospheric conditions. Second-order upwind schemes were applied for spatial discretization of pressure, momentum, turbulent kinetic energy, and dissipation rate to improve numerical accuracy. Residual convergence criteria were set to 10−3 for 10−6 flow equations and for energy, in line with best practices to ensure stable and accurate CFD results. 46
3. Power consumption estimation
This section quantifies how the internal duct alters the truck’s aerodynamic drag, the propulsion power required to overcome that drag, and the corresponding electric energy consumption per kilometer. All quantities are evaluated for each inlet velocity using the CFD-predicted drag coefficient and the reference frontal area specific to each configuration (with and without duct). As we simplified the problem to a 2D domain, a unit depth was assumed. In the ducted configuration, the area occupied by the internal duct was subtracted from the overall reference area, resulting in a slightly smaller frontal area compared with the baseline (non-ducted) case.
3.1. Aerodynamic drag force calculation
The aerodynamic drag force is computed from the fundamental momentum balance principle, capturing the resistance encountered by the vehicle as it moves through air due to pressure and viscous effects:
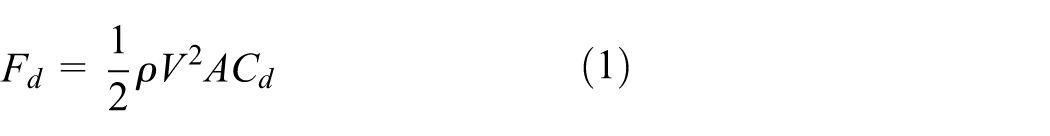
where ρ is the air density, V is the vehicle (free-stream) speed, A is the frontal reference area, and C d is obtained from the CFD simulations. This relation is the standard form used in road-vehicle aerodynamics and heavy-vehicle drag studies. 47
3.2. Estimating propulsion power
The propulsion power needed to overcome aerodynamic drag is calculated by multiplying the drag force by the vehicle speed, representing the energy required to maintain motion against air resistance:
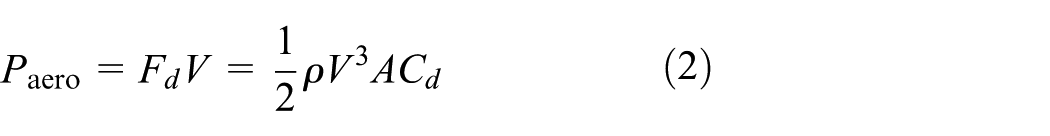
which shows the cubic dependence on speed that dominates highway operation. This formulation is widely used in power budgeting and sizing road vehicles. 7
3.3. Impact on electric energy consumption
To link aerodynamics to on-road electric energy use, the power is normalized by speed to obtain the energy consumed per unit distance:

This metric allows a direct comparison of the baseline and ducted configurations in terms of battery demand and potential range extension. The relative saving is reported as:

where E baseline and E duct denote the aerodynamic energy consumed per kilometer by the baseline (non-ducted) and ducted configurations, respectively. Energy-per-distance formulations of this kind are standard in EV energy consumption modeling and have been validated against experimental data and high-fidelity simulations. 48
4. Results and discussion
This section presents the simulation results and discusses the aerodynamic performance and energy implications of the electric truck with and without the internal flow duct. The analysis begins by evaluating the baseline configuration, followed by the modified ducted design. Key results include drag coefficient values, pressure and velocity contours, and flow visualizations. The impact of these aerodynamic changes on propulsion power and energy consumption is also examined, offering insights into the potential benefits and design considerations of integrating internal ducts in electric trucks.
4.1. Comparison between baseline and ducted configurations
A detailed comparison between the baseline and ducted vehicle designs is conducted at an inlet velocity of 100 km/h. Velocity and pressure contours are examined to highlight key aerodynamic differences in flow behavior, pressure distribution, and wake formation between the two configurations. Previous studies have highlighted the effectiveness of ducted modifications in enhancing vehicle aerodynamics through flow redirection and wake control. An optimized rear duct with a 12° angle was found to significantly reduce the drag coefficient from 0.3454 to 0.2322 and minimize wake formation behind the vehicle. 41 These findings support the use of duct geometry, such as in this study’s design, for delaying flow separation and stabilizing the wake region.
The velocity contours in Figure 5 highlight clear aerodynamic differences between the ducted and baseline vehicle models. In the ducted design, a 12° angled duct redirects airflow more effectively, reducing the front stagnation zone and delaying flow separation. This leads to a smaller and more organized wake region, characterized by less turbulence and lower pressure drag. The streamlined flow remains attached longer along the vehicle’s body, resulting in smoother airflow and improved aerodynamic efficiency. In addition, the underbody flow is more uniform, minimizing local eddies and enhancing high-speed stability. In contrast, the baseline model exhibits earlier flow separation, a larger and more chaotic wake region, and increased aerodynamic resistance due to the disturbed flow behind the vehicle.
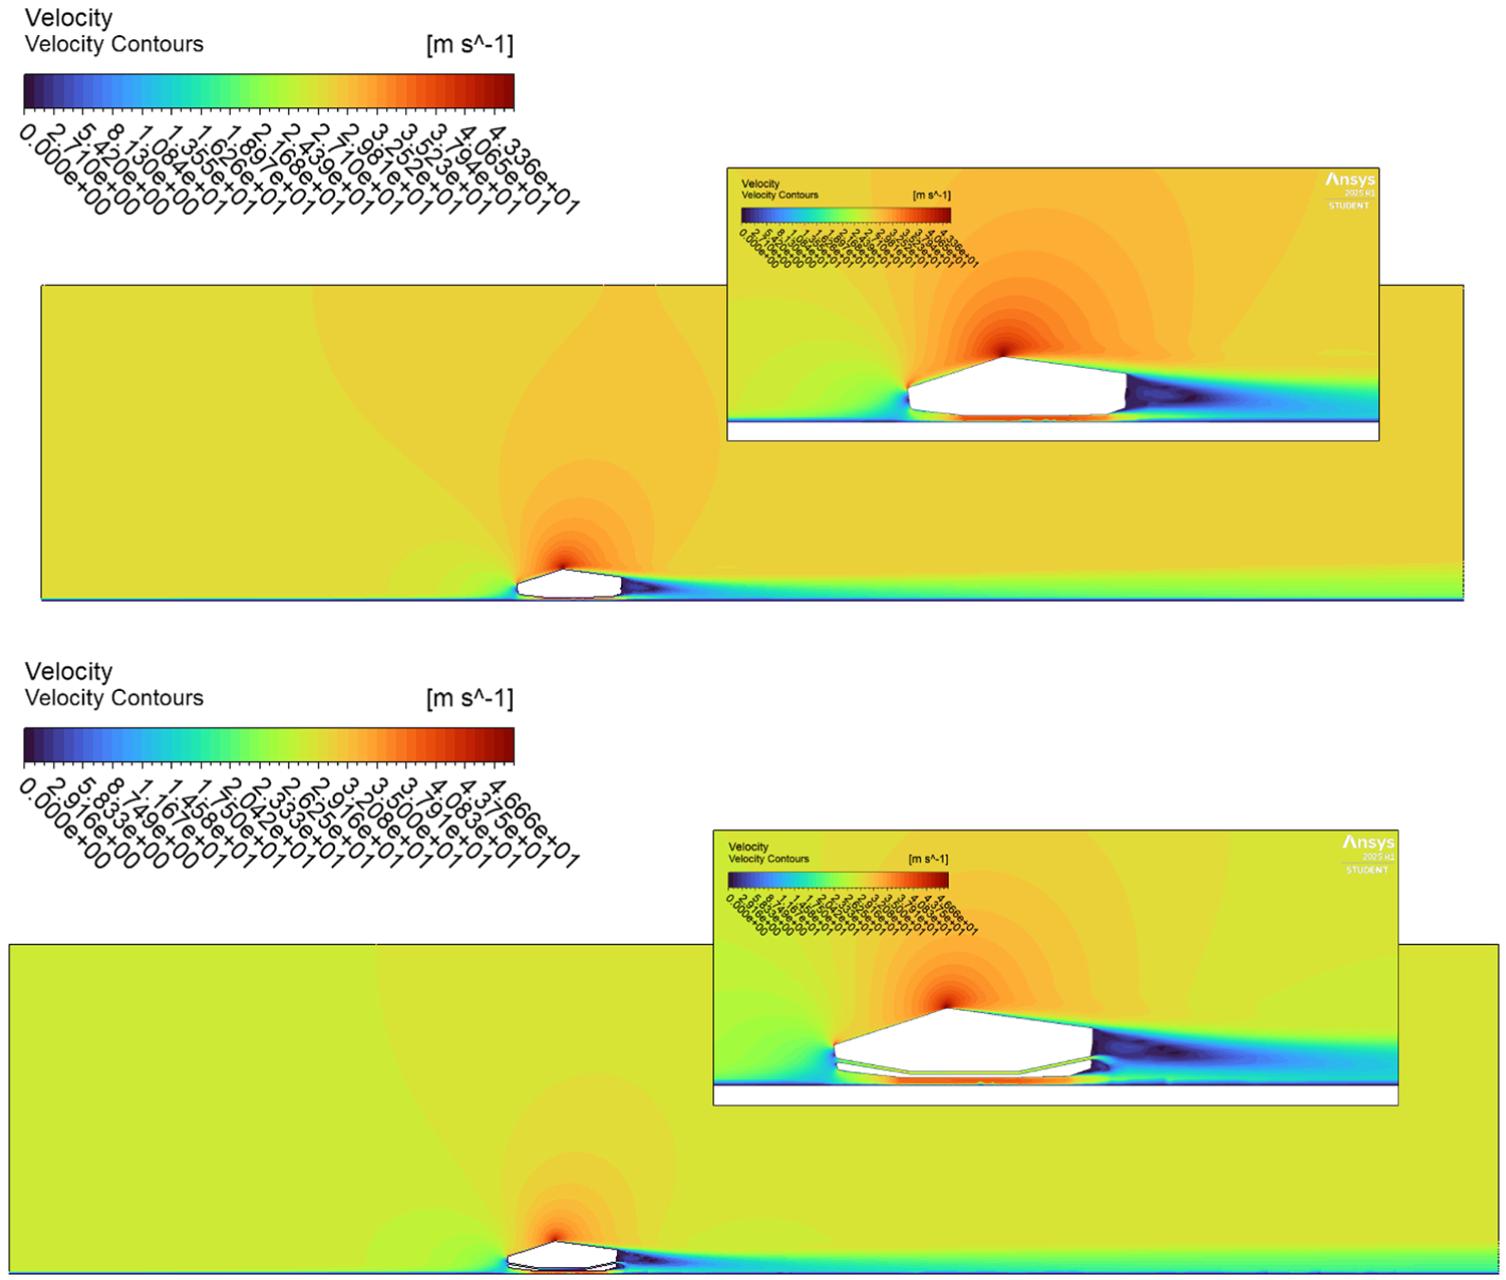
Velocity contour comparison between ducted and non-ducted vehicle models, illustrating improved flow behavior, reduced wake region, and enhanced aerodynamic performance with the duct. The front (inlet) of the vehicle is located on the left side of the figure, and the rear (outlet) is on the right.
Following the improved velocity patterns observed in Figure 5, the pressure contours in Figure 6 reveal the enhanced aerodynamic behavior of the ducted configuration. The duct reduces the front stagnation pressure and promotes a smoother pressure transition along the body. The ducted model reaches a maximum pressure of 413.1 Pa and a minimum of −1268 Pa, showing better pressure recovery and flow stability. In comparison, the baseline model shows a maximum of 402.8 Pa and a minimum of −1254 Pa, reflecting less efficient pressure distribution and a more unstable wake region.
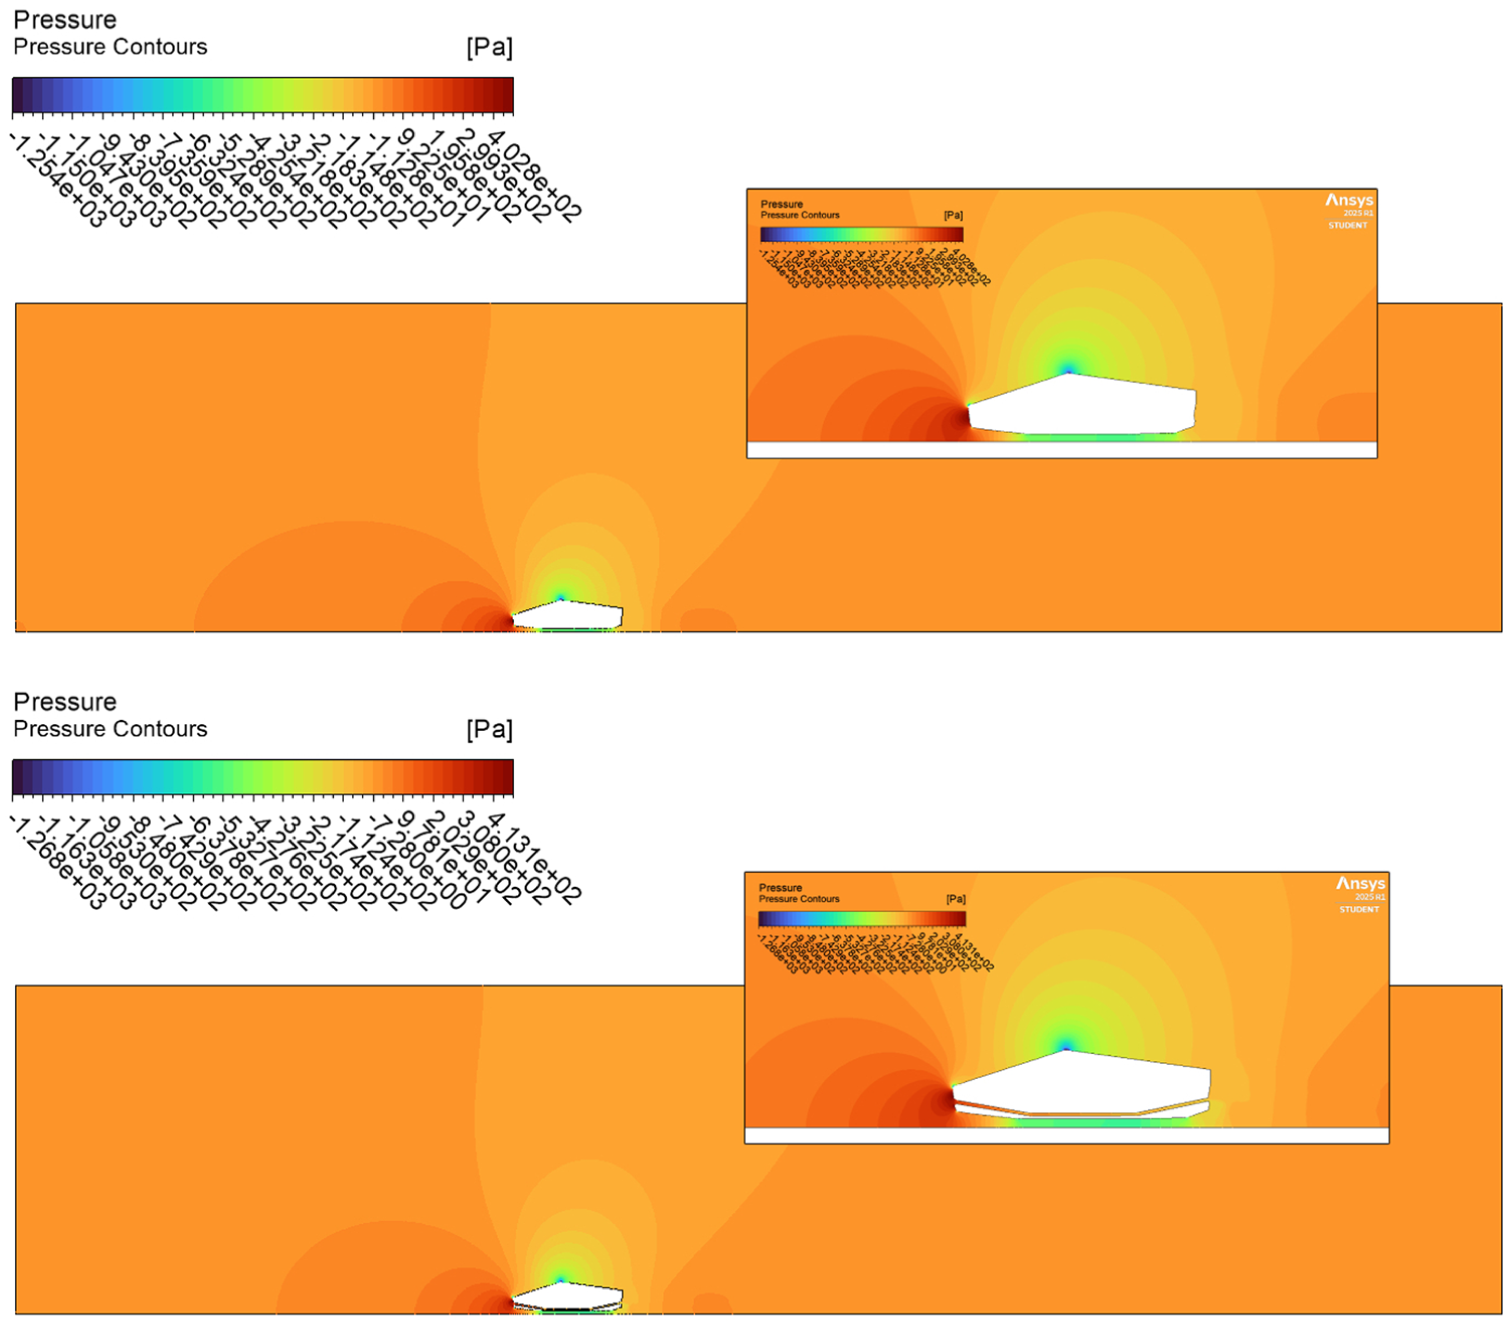
Pressure contour comparison between ducted and non-ducted vehicle models, highlighting improved pressure recovery, reduced front stagnation, and a more stable wake region in the ducted configuration. The front (inlet) of the vehicle is located on the left side of the figure, and the rear (outlet) is on the right.
The eddy viscosity contours shown in Figure 7 provide further insight into the turbulence characteristics behind each vehicle configuration. In the ducted model, the maximum eddy viscosity reaches 0.39 Pa·s, which is noticeably lower than the 0.474 Pa·s observed in the baseline case. This reduction indicates a significant decrease in turbulence intensity due to the presence of the aerodynamic duct.
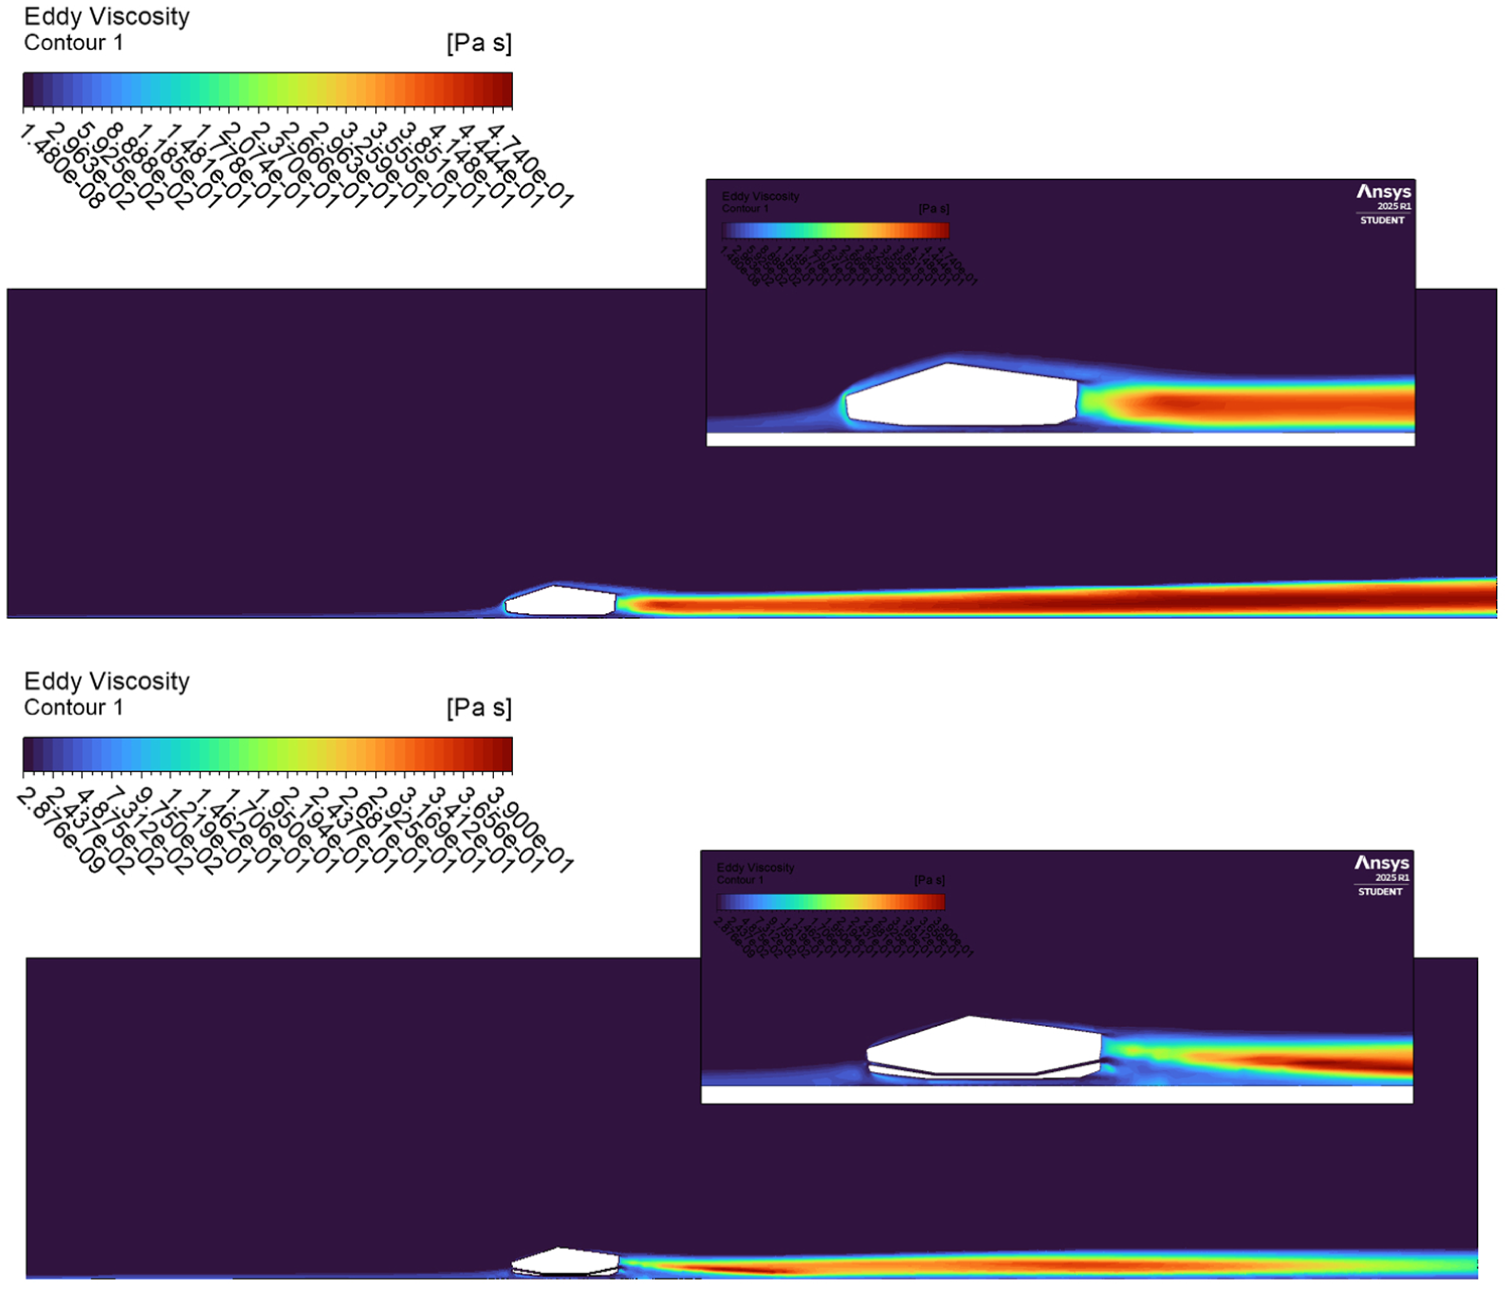
Eddy viscosity contour comparison between ducted and non-ducted vehicle models, highlighting reduced turbulence intensity, delayed flow separation, and a more stable wake region in the ducted configuration. The front (inlet) of the vehicle is located on the left side of the figure, and the rear (outlet) is on the right.
The lower eddy viscosity in the ducted design reflects smoother and more controlled airflow, with delayed flow separation and reduced formation of large-scale vortices in the wake region. This results in a more stable field of flow, which contributes to improved aerodynamic efficiency. In contrast, the higher eddy viscosity in the baseline model suggests increased turbulence and earlier flow separation, leading to a larger and less stable wake. These findings are consistent with the observed improvements in velocity and pressure distribution in the ducted configuration.
4.2. Results at varying inlet velocities
This section presents the aerodynamic results of the truck configurations with and without the duct, evaluated across different inlet velocities to assess their impact on drag, pressure, and velocity characteristics. The impact of ducts across a range of velocities has been well documented. Studies show that internal ducts can maintain consistent aerodynamic benefits, including reduced drag and improved pressure distribution, from 10 to 50 m/s. 41 Notably, optimized elliptical and circular diffuser geometries were effective in lowering lift and drag when diffuser angles remained below 8°, achieving drag coefficients around 0.247–0.251. 45 These findings emphasize how aerodynamic devices maintain performance across varied speeds and flow conditions.
The C d consistently decreases with increasing velocity for both truck configurations. The ducted design maintains a clear aerodynamic advantage. At lower speeds, such as 50 km/h, the C d difference is subtle, but as the speed increases to 140 km/h, the gap widens noticeably, with the ducted configuration achieving a lower minimum value. This improvement reflects the duct’s ability to reduce flow separation and pressure drag by guiding airflow more efficiently around the vehicle. The trend is illustrated in Figure 8(a), which shows the variation in C d over the full range of inlet velocities. The aerodynamic drag force follows a nonlinear growth pattern with velocity due to its quadratic dependence on speed. While both configurations show increased drag force at higher velocities, the truck equipped with the duct consistently experiences lower resistance. The difference is minor at 50 km/h, with values around 65.57 N (with duct) and 70.67 N (without duct). At 140 km/h, the truck without the duct experiences a drag force of about 531.10 N, compared to 495.91 N for the ducted configuration, indicating a reduction of approximately 6.6%–7.5%. These values are depicted in Figure 8(b), which presents the drag force variation with inlet velocity for both cases. The reduced drag force aligns with the lower drag coefficient values and confirms the role of the duct in minimizing aerodynamic resistance under high-speed driving conditions. Although the difference in drag coefficient (Cd) between the ducted and baseline configurations appears relatively small in Figure 8(a), this behavior is expected because Cd is a non-dimensional parameter that naturally compresses variations at higher Reynolds numbers. The practical impact becomes clearer when examining the corresponding drag force in Figure 8(b), where even small differences in Cd translate into a noticeably larger reduction in total aerodynamic drag at higher speeds due to the quadratic dependence on velocity. Therefore, while the Cd curves remain close, the absolute drag force reveals the meaningful performance advantage of the ducted design at 140 km/h.
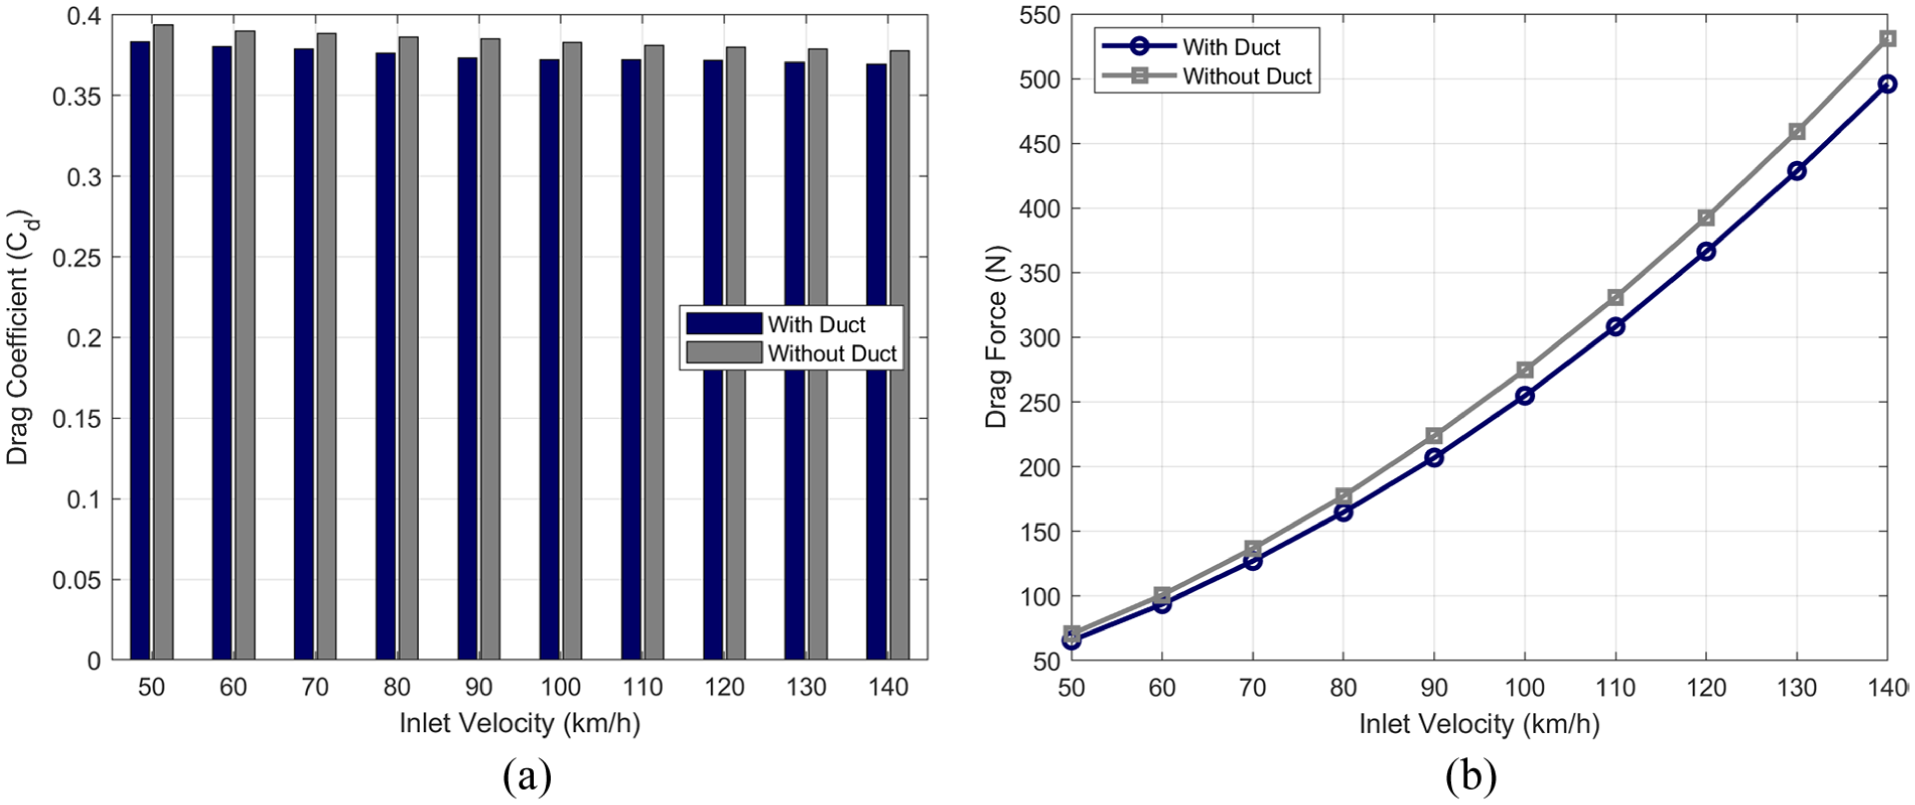
Variation of (a) drag coefficient and (b) aerodynamic drag force with inlet velocity for the truck with and without the internal duct.
To further investigate the aerodynamic effects of the duct, the maximum velocity (Vmax) and the pressure difference across the duct region (ΔP = Pmax − Pmin) were analyzed. The percentage improvement in Vmax and the corresponding change in pressure drop were calculated relative to the baseline case without the duct. The results, shown in Figure 9, indicate a noticeable improvement in both metrics due to the duct’s influence. Across the entire velocity range, Vmax increases by approximately 7%–9%, reflecting improved flow acceleration through the duct region. Similarly, the pressure difference (ΔP) shows an average increase of around 2%–4%, suggesting enhanced local pressure recovery. These improvements demonstrate how the duct not only reduces drag but also promotes favorable internal flow characteristics that contribute to overall aerodynamic efficiency.
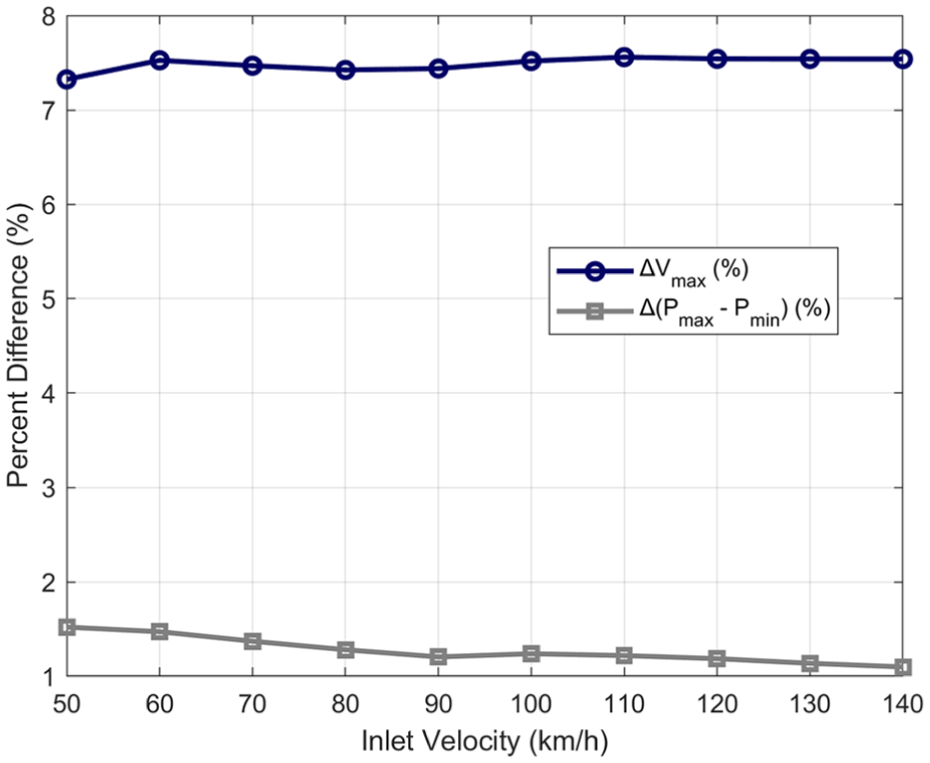
Percentage difference in maximum velocity and pressure drop between ducted and non-ducted configurations across different inlet velocities.
4.3. Power and energy consumption
The following analysis presents the propulsion power and energy consumption results for truck configurations with and without the aerodynamic duct. The analysis highlights how both quantities change with speed and compares the performance of each case. Aerodynamic ducting systems have demonstrated substantial improvements in energy efficiency by managing airflow to reduce drag and stabilize pressure zones. One study showed that redirecting flow from the front to the rear of a vehicle eliminated vacuum regions and increased positive pressure in 100% of test points, leading to improved propulsion efficiency. 9 These insights support the idea that aerodynamic ducts can contribute not only to drag reduction but also to energy savings in real driving conditions.
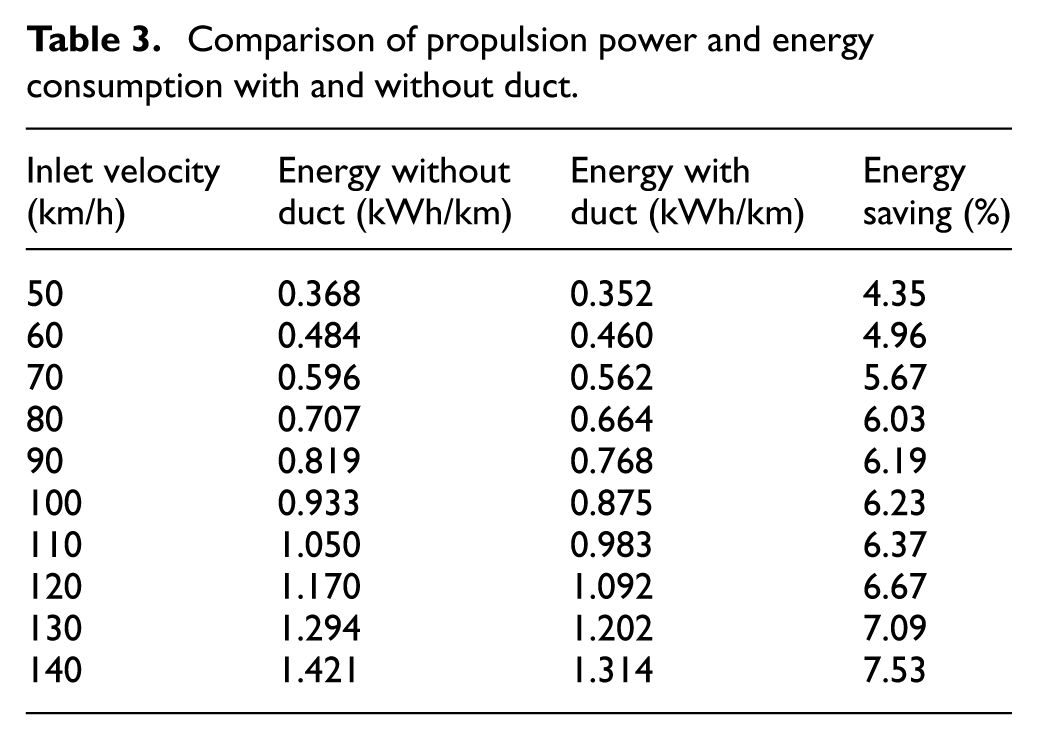
As speed increases from 50 to 140 km/h, both propulsion power and energy consumption rise for the truck configurations. However, the ducted truck consistently shows better performance. Across all speeds, it requires less propulsion power than the non-ducted case, with the difference becoming more significant at higher velocities. At 140 km/h, the power required without the duct is 77.89 kW, compared to 72.04 kW with the duct, highlighting improved aerodynamic efficiency. This trend is clearly shown in Figure 10. Energy consumption follows a similar pattern. At 50 km/h, the ducted truck consumes 0.352 kWh/km, while the non-ducted version uses 0.368 kWh/km, a saving of 4.35%. At 140 km/h, energy use drops from 1.421 kWh/km (without duct) to 1.314 kWh/km (with duct), resulting in a 7.53% reduction. These consistent improvements are supported by the numerical values listed in Table 3, confirming the duct’s role in reducing both power demand and energy consumption at all tested velocities.
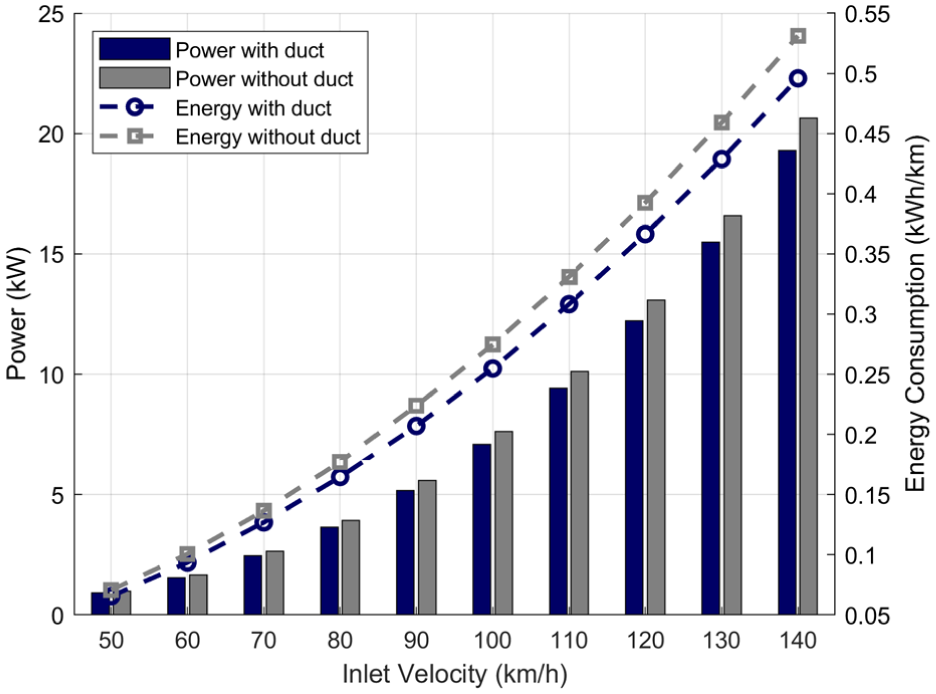
Propulsion power and energy consumption versus inlet velocity for truck configurations with and without the internal duct.
Comparison of propulsion power and energy consumption with and without duct.
Altogether, the graphical and numerical results highlight the aerodynamic duct as a practical and efficient solution for improving vehicle performance. The reductions in power demand and energy usage, especially at higher velocities, point to meaningful benefits in fuel economy and environmental impact. These findings support the integration of passive aerodynamic devices in vehicle design to optimize energy efficiency in real-world operating conditions.
4.4. Estimated battery range extension
To evaluate the practical benefits of the reduced energy consumption due to the internal duct, the corresponding improvement in driving range was estimated. Based on the calculated reduction in energy consumption per kilometer (up to 7.53% at 140 km/h), and assuming a typical electric truck battery capacity of 400 kWh, 49 the range extension can be approximated.
In the scenario where the baseline energy consumption is 1.421 kWh/km at 140 km/h without the duct, it decreases to 1.314 kWh/km with the duct. Using a 400-kWh battery and the measured energy consumption at 140 km/h, the baseline truck achieves an estimated range of 281.4 km, while the ducted configuration reaches 304.4 km.
This yields a range increase of approximately 23 km, or 8.2%, under high-speed conditions. The result highlights the potential of aerodynamic optimization strategies, such as internal ducting, to significantly enhance the operational efficiency and driving range of electric trucks, especially in highway applications.
5. Design implications and challenges
The outcomes of this study highlight the practical benefits of incorporating internal flow ducts into electric truck designs. The duct effectively enhances aerodynamic performance by streamlining airflow, reducing drag, and improving energy efficiency. 50 These improvements are particularly relevant for long-haul electric trucks operating at highway speeds, where aerodynamic resistance becomes the dominant factor affecting range and power consumption. 51 By optimizing internal airflow, the design offers a passive and practical solution that can contribute to more sustainable and energy-efficient transportation.
However, several practical challenges must be addressed before such a design can be adopted in real-world applications. One of the main concerns is space utilization. Internal ducts occupy valuable internal volume, which may interfere with critical vehicle components such as battery modules, cargo space, or structural reinforcements. This spatial competition requires careful optimization to maintain functional performance while achieving aerodynamic gains. 52 Manufacturability is another important consideration. Integrating internal ducts into the truck’s chassis or body would likely necessitate a redesign of existing structural components. This could increase production complexity, material requirements, and assembly time, thereby affecting the overall economic viability of the design. In addition, from a safety perspective, modifying the internal flow paths may alter the structural behavior of the vehicle during crash events. Since energy absorption characteristics are crucial in meeting crashworthiness standards, any proposed duct geometry must undergo rigorous structural and safety assessments to ensure regulatory compliance. 53 Moreover, maintenance and durability concerns arise from the duct’s exposure to external airflow. Openings that allow air to pass through the vehicle may also introduce dust, debris, or moisture into internal spaces. Without proper protective features such as filters, drainage systems, or inspection access points, these ducts could become blocked or damaged over time, leading to reduced aerodynamic performance or operational issues. In addition to these integration challenges, the study itself is based on a 2D simplification of the truck geometry. As a result, complex 3D flow behaviors such as wheel wake effects, mirror-induced turbulence, and side flow separation are not captured. The simplified duct model does not reflect realistic structural, thermal, or manufacturing constraints, and external factors such as crosswinds, yaw angles, and transient maneuvers like overtaking or acceleration were not considered. Furthermore, the potential interaction between ducted airflow and the vehicle’s thermal management system remains unexplored.
These limitations indicate that while the current findings offer valuable insights for early-stage aerodynamic evaluation, further studies using 3D CFD, detailed structural integration, and multi-disciplinary design approaches are essential to ensure the feasibility and effectiveness of internal duct systems in practical electric truck designs.
6. Conclusion
This study investigated the influence of an internal flow duct on the aerodynamic performance and energy consumption of a heavy-duty electric truck using a simplified 2D CFD approach. While most prior research has concentrated on external drag-reduction devices, this work addresses a notable gap by evaluating internal airflow control strategies tailored to electric truck applications. Despite the geometric simplification, the results provide meaningful insight into the aerodynamic and energy-saving potential of duct integration. The key findings are summarized as follows:
(1) The internal flow duct significantly improved flow behavior around the truck body, enhancing flow uniformity, reducing the size and intensity of the wake region, and delaying flow separation. These improvements contribute to smoother external flow, reduced turbulence, and lower pressure drag, which are essential for aerodynamic efficiency at highway speeds.
(2) The ducted configuration consistently achieved lower drag coefficients across all tested velocities, ranging from 50 to 140 km/h. The observed reduction in drag coefficient, from 0.3454 to 0.2322 at 100 km/h, highlights the duct’s effectiveness in reducing aerodynamic resistance through improved pressure recovery and streamlined airflow paths.
(3) A notable reduction in aerodynamic drag force was observed, with maximum reductions between 6.6% and 7.5% at higher speeds. This corresponds to a measurable decrease in the resistive force acting against vehicle motion, which is particularly beneficial for long-haul electric trucks that operate predominantly at highway velocities.
(4) Propulsion power demand and energy consumption per kilometer were both reduced across the entire velocity range, with energy savings reaching up to 7.53% at 140 km/h. These aerodynamic improvements translated into practical benefits, including an estimated 8.2% extension in battery driving range at high speeds for a vehicle with a 400 kWh battery capacity.
Future research should expand on this study by employing 3D CFD models that incorporate realistic vehicle geometries and boundary conditions. Including additional features such as wheels, underbody details, and external components will provide a more complete picture of aerodynamic behavior. Exploring different duct geometries, placements, and integration strategies can also help optimize performance further. In addition, coupling aerodynamic improvements with energy recovery systems or thermal management solutions may enhance the overall efficiency and functionality of electric truck designs.
Footnotes
Funding
The authors received no financial support for the research, authorship, and/or publication of this article.
Declaration of conflicting interests
The authors declared no potential conflicts of interest with respect to the research, authorship, and/or publication of this article.