
Abstract
This paper investigates the general problem of comparing multidimensional simulation output with a given data set (e.g., real-world historical data). This problem frequently arises in verification, validation, and calibration of simulation models with spatial output statistics as in weather/climate, epidemic, swarm/crowd, social systems, communication networks, and many other applications where the simulation output is distributed across various locations or geographical regions. In the case of univariate simulation output, two-sample statistical hypothesis tests such as the t-test are commonly used. For simulation models with multidimensional and spatial output statistics, the Hotelling’s two-sample test is widely used as the benchmark method in the simulation literature. However, the Hotelling’s test assumes that the two samples come from multivariate Gaussian distributions with equal covariance matrices, which may not be the case in many applications. To address this gap, this paper proposes a double-bootstrap method based on the Wasserstein distance for comparing two multidimensional samples. Unlike the Hotelling’s test and other parametric approaches, the proposed method does not require restrictive distributional assumptions, enabling a wider range of applications and contributing to verification, validation, and calibration of simulation models with multidimensional output. Computational experiments are performed to assess the test power, and the results indicate that the proposed method outperforms the Hotelling’s test and various other approaches. The proposed method’s applicability is illustrated through two examples related to random walk of swarm particles on a two-dimensional space and a realistic engineering application involving simulation of unmanned aerial vehicle (UAV) communication systems.
Keywords
1. Introduction
Stochastic simulation is a common analysis tool for modeling a wide range of man-made and natural systems, namely manufacturing, 1 healthcare, 2 supply chains, 3 marketing, 4 military, 5 education, 6 and weather/climate. 7 Regardless of the application area, the need to compare the simulation output against a given set of data arises in different steps of the simulation modeling and analysis process. 8 For instance, model validation requires comparing the simulation output against historical data from the real-world system under study, simulation models of queueing systems are verified by comparing the simulation output against an expected distribution such as analytical results obtained from queueing theory, and calibrating simulation models involves finding a parameter configuration whose outputs closely align with historical data and expected behavior of the system being modeled. This paper deals with the general problem of comparing multidimensional simulation output with a given data set (hereafter referred to as the target data). The multidimensional case is common in simulations with spatial output statistics such as temperature distribution or infection spread across geographical regions in weather and epidemic simulations as exemplified in Figure 1.
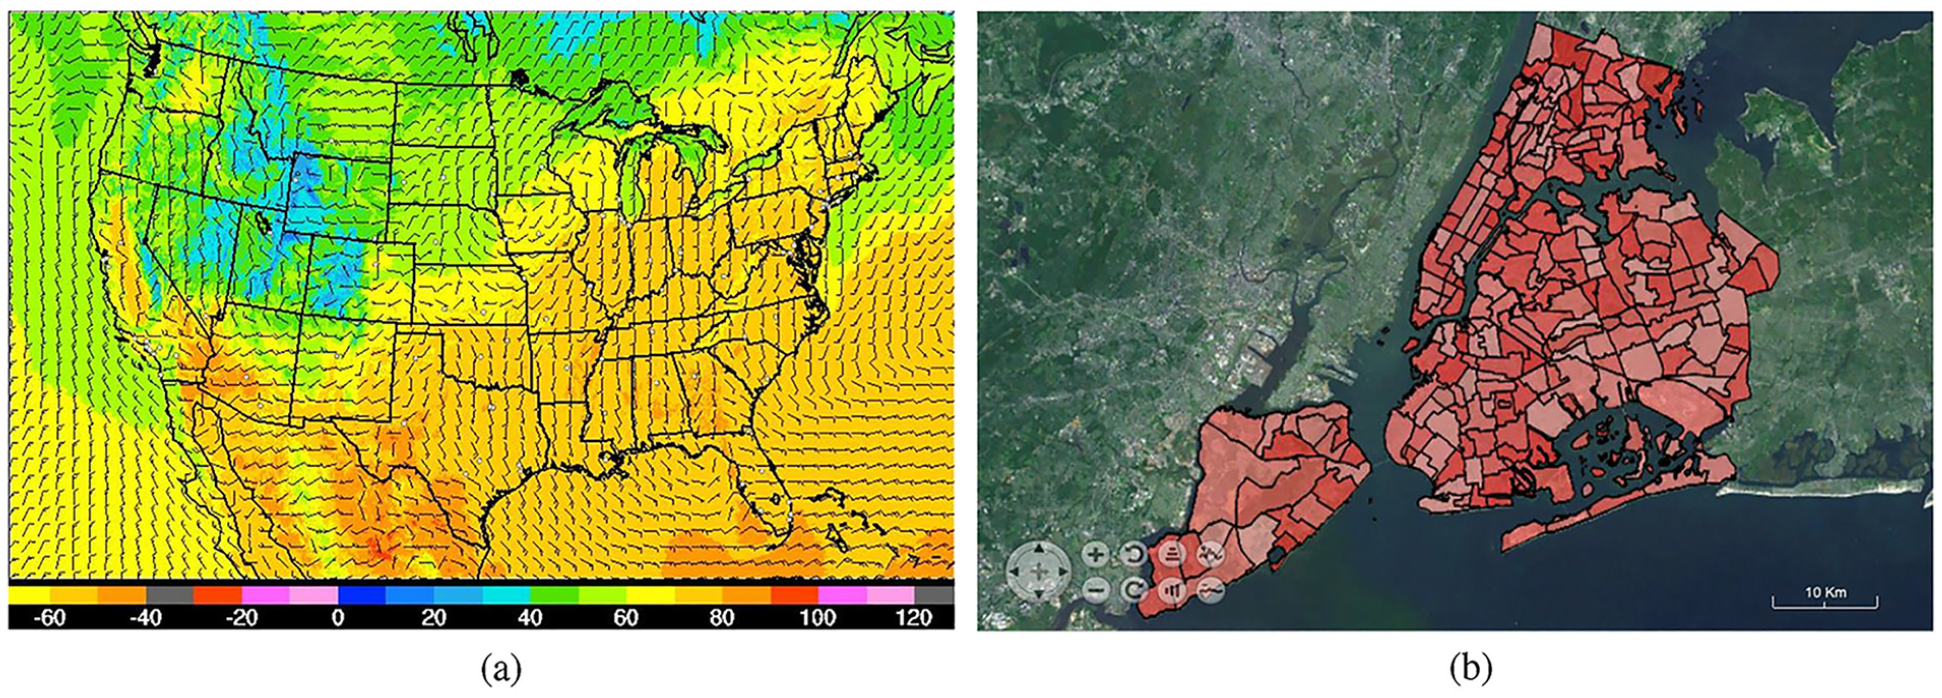
Examples of spatial simulation output: (a) Temperature distribution predictions across the United States by the National Weather Service’s High-Resolution Rapid Refresh (NWS HRRR) simulation model. (b) Infections across neighborhood tabulation areas in an agent-based simulation of Covid-19 spread in New York City. 9
In the field of simulation, two-sample statistical hypothesis testing is predominantly used for performing such comparisons to determine whether the simulation output differ from the target data.
8
For the case of univariate simulation output (e.g., time in queue or number in system), parametric and nonparametric tests such as the two-sample t, paired-t, F-test, Wilcoxon signed-rank or rank sum test, and the Mann–Whitney U test are commonly used. The choice of the test depends on the type of statistics being compared (e.g., equality of the means or medians) and whether the two samples meet the test’s underlying assumptions such as normality, equality of variances, and sample size requirements.
8
For multivariate and multidimensional simulation output, the Hotelling’s two-sample
This paper introduces a double-bootstrap procedure for comparing two multidimensional samples, which enables statistical comparison of spatial simulation output versus target data in situations where the Hotelling’s test is not applicable due to violation of its underlying assumptions (i.e., normality and equality of variances). More specifically, the proposed method employes the Wasserstein distance as a probability metric to quantify the distance between two probability distributions, and two levels of bootstrapping are performed to estimate the variance of the distance measure (first bootstrap) and the cut-off point for the test statistic (second bootstrap). The contributions and advantages of the proposed method are:
The proposed method outperforms existing methods in detecting scale differences (i.e., difference in spatial variance) between two multidimensional samples. This is an important contribution because many existing tests, such as the Hotelling’s test, are more sensitive to location differences (i.e., difference in spatial average) but have low or no power for scale differences.
The proposed method does not require restrictive distributional assumptions such as normality, equality of the covariance matrix, or other distributional assumptions of existing parametric methods including the Hotelling’s test. This is an important advantage as it expands practical applications.
The proposed method addresses the general paucity of Wasserstein distance-based bootstrap tests as reported in a literature survey. 14
While the implementation presented in this paper considers the classical Wasserstein distance where the metric space is
The main limitation of the proposed method lies in its high computational time as bootstrapping and Wasserstein distance calculation are both computationally intensive. This limitation is further investigated in the computational experiments presented in this paper and implications for real-world applications are discussed.
The remainder of this paper is organized as follows. The following section reviews the related literature. The proposed Wasserstein distance-based double-bootstrap procedure is then presented. Computational experiments are then performed to compare the power of the proposed method with the Hotelling’s test and several other multidimensional two-sample tests. In addition, two simulation applications with spatial output statistics are provided to show the efficacy of the proposed method and its advantage over the benchmark Hotelling’s test. Finally, conclusions and future extensions are discussed.
2. Literature review
The Hotelling’s two-sample
Besides the field of simulation, the need to test whether two d-dimensional independent samples have the same underlying distribution is a common problem that arises in many other research areas and applications, namely astronomy, 20 psychology, 21 biology,22,23 medical, 24 and educational research. 25 The literature on multidimensional two-sample testing contains numerous parametric and nonparametric approaches that are less common in simulation research and practice. The review here provides examples of some of the main classes of approaches bearing in mind that it is impossible to cover the breadth of this massive body of work in a short note like this. Table 1 provides a summary comparison of the approaches reviewed here that are also included in the computational experiments in the following section.
Positioning of the proposed method and a summary comparison with selected existing approaches.
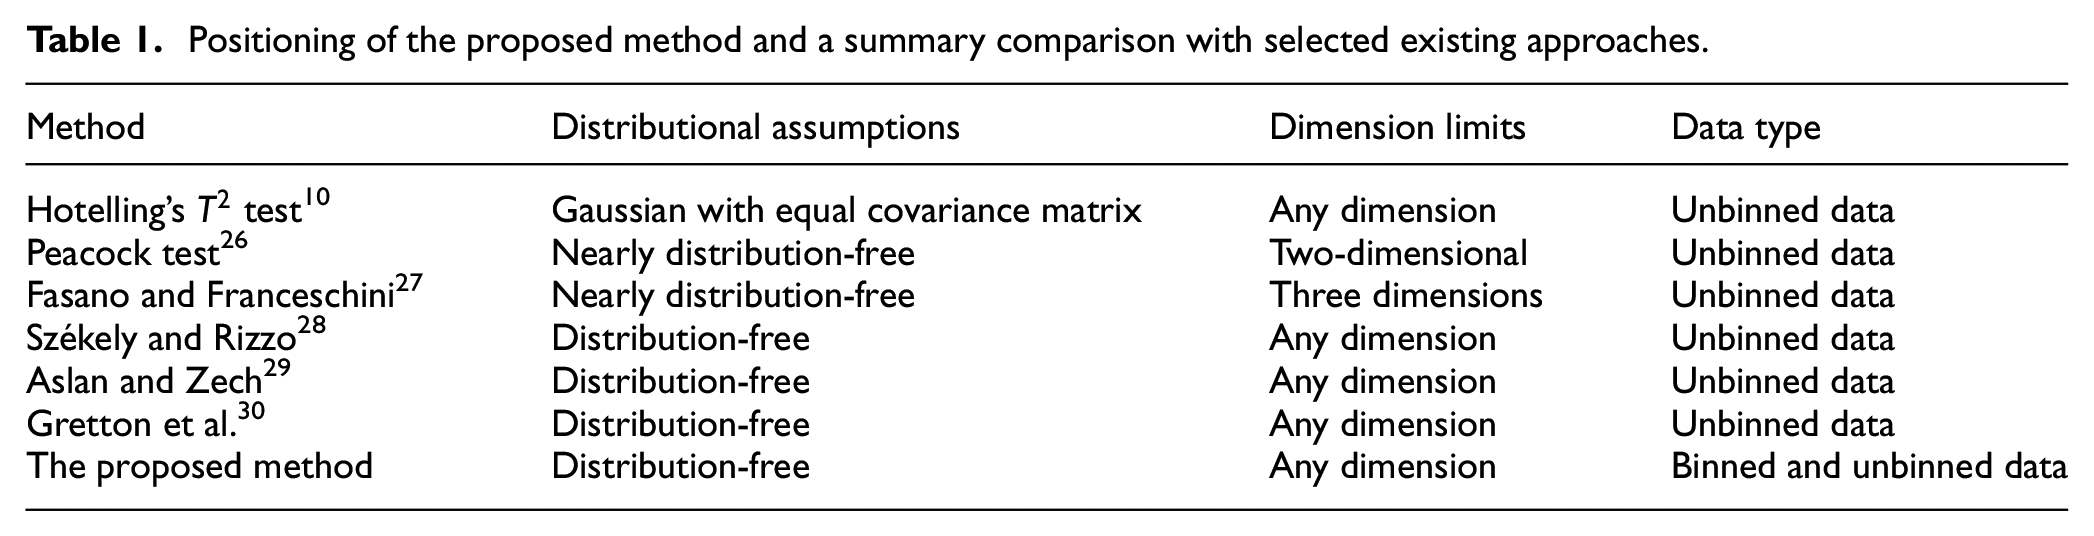
Some of the univariate tests have been extended to multivariate settings. For example, the two-sample Kolmogorov–Smirnov test is generalized to two dimensions by Peacock, 26 and later to the three-dimensional case by Fasano and Franceschini, 27 which are summarized in Table 1. Multivariate two-sample tests analogue to the Wald–Wolfowitz runs test have been introduced.31,32 There are also multivariate rank-based tests.33–35 Several multivariate nonparametric methods have been proposed that can be used for high-dimension, small-sample-size settings.32,36,37 Distribution-free tests based on the idea of optimal non-bipartite matching 38 and shortest Hamiltonian path 39 are also proposed.
More recently, three other families of tests have emerged and gained popularity. These include kernel-based tests, such as the one proposed by Gretton et al. 30 Another interesting class of tests based on energy statistics, 28 i.e., functions of interpoint distances, which have thorough theoretical foundations but the results are often only asymptotic. While these two classes of tests seem fairly different on the first look, it has been shown that there is a close relationship between the energy distance and kernels. 40 Two energy tests by Székely and Rizzo 28 and Aslan and Zech 29 as well as the kernel-based test by Gretton et al. 30 are summarized in Table 1 and included in the test power comparison experiments presented later in this paper. The other family of tests involve Wasserstein two-sample testing. In a survey of these tests, 14 their connection to multivariate methods involving energy statistics and kernel-based tests as well as univariate methods like the Kolmogorov–Smirnov test are discussed. The survey paper also points out the lack of attention in the current literature to Monte Carlo techniques like bootstrap tests, which is another gap addressed by the proposed method in this paper besides its contributions to the simulation field as highlighted in the previous section.
3. The proposed method
The proposed method uses the Wasserstein distance to measure the distance between two multidimensional samples and employs a double-bootstrap method to estimate the critical value for the test. This section first provides a brief introduction to Wasserstein distance and then describes the proposed double-bootstrap procedure.
3.1. Wasserstein distance
Wasserstein distances frequently appear in mathematics, optimization, and probability and statistics, and originate from the inquiry into how to optimally transport a pile of earth into a hole of equal volume but different shape
41
and a later formulation by Kantorovich
42
that allows splitting among multiple destination holes. Wasserstein distances are used in statistics in several ways as categorized in a review paper.
43
In particular, the Wasserstein distance is commonly used as a probability metric to quantify the distance between probability distributions.
15
In simple words, when comparing two distributions, one can be seen as a mass of earth and the other as a collection of holes, where the Wasserstein distance measures the least amount of work needed to fill the holes with earth, in other words, the minimum effort required to reconfigure the probability mass of one distribution to reconstruct the other distribution. The following definition involves the classical case where the metric space is
Given an exponent
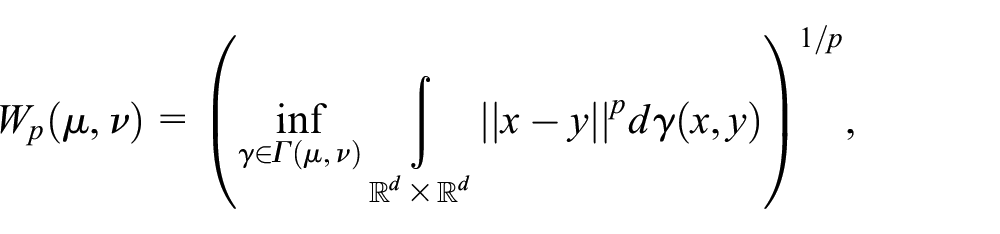
where
Let
where
3.2. The double-bootstrap procedure
Bootstrapping is a simulation procedure based on resampling of the data. There are several reference books that the interested reader can refer to for more information about such techniques. 44 Bootstrapping methods have also been used in the field of stochastic simulation for input modeling, parameter estimation, and output analysis45–47 when comparing ordinal statistics of two samples such as percentiles for which no standard parametric test exists.
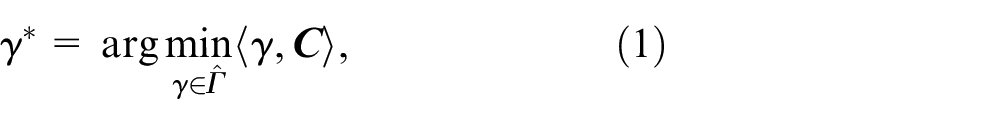
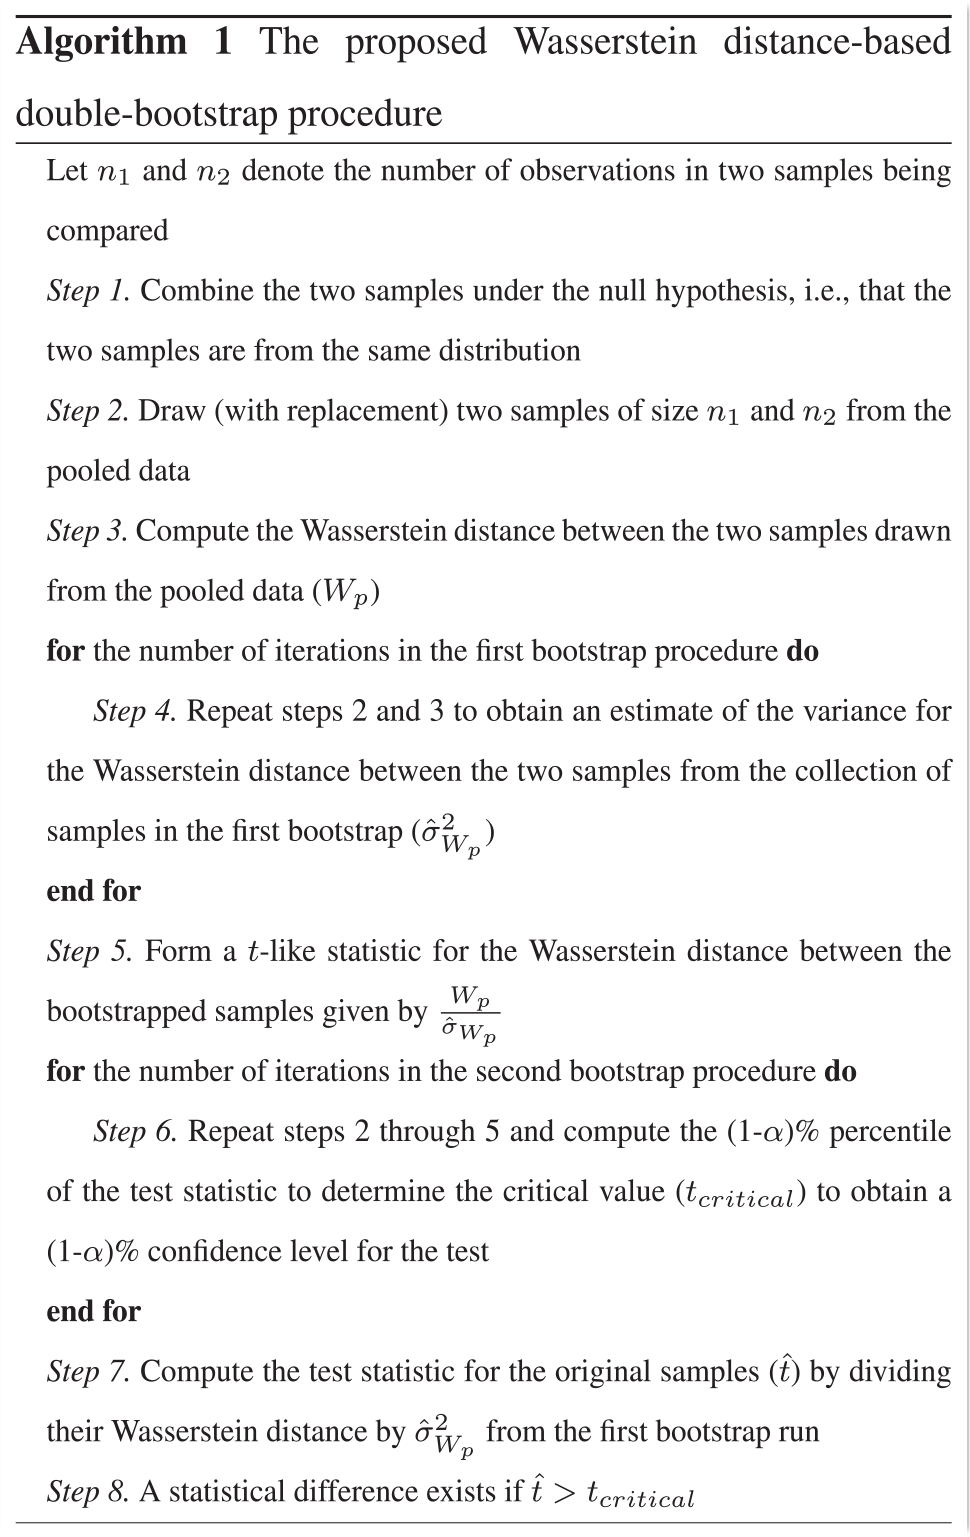
Algorithm (1) presents the proposed double-bootstrap method which can be summarized as follows. The two samples are first combined under the null hypothesis that they come from the same underlying multivariate distribution. Pooling the samples is also expected to produce tighter confidence intervals than if the data were not pooled. Then, two bootstrap procedures are performed. Each iteration of the first bootstrap procedure involves drawing (with replacement) two samples from the pooled data and calculating the Wasserstein distance between them. At the end of the first bootstrap runs, a
4. Computational experiments
In statistics, hypothesis tests are assessed based on two metrics: power and validity. The test power refers to the probability of correctly rejecting the null hypothesis when the two samples are from different distributions (i.e., 1 – type II error). The test validity (which is related to type I error) represents the probability of incorrectly rejecting the null hypothesis when the two samples are from the same distribution. When these probabilities cannot be derived analytically, as is the case in this paper due to the complexity of the Wasserstein distance and relaxing distributional assumptions, the test power and validity are assessed asymptotically via computational experiments. This section presents the results of three sets of experiments. In the first set of experiments, the proposed method’s power is assessed by repeating the test many times on samples taken from different distributions to compute the probability of rejection. The proposed method’s power is compared with several existing two-sample tests, namely the Hotelling’s
4.1. Statistical power comparisons
The methods are assessed under scale (spatial variance) difference scenarios, where two bivariate Normal distributions are compared: one with independent standard normal margins and the other with independent margins with a mean of zero (i.e., same location parameters for the two samples) but a different scale (variance) for one of the margins. The reason behind considering two-dimensional Gaussian distribution scenarios is threefold: (1) this enables a baseline for comparison, by comparing with the Hotelling’s
Comparison results for a sequence of increasing differences in scale are presented in Figure 2. In line with the common approach in the literature, the proportion of times a test rejected the null hypothesis is used as an estimate of its power. The rejection percentages reported are based on 200 experiments (i.e., 200 tests) under each respective parameter setting at a 5% level of significance (similar results were obtained at other significance levels). In all experiments, a sample size of 5000 is considered. Such sample sizes are common in many applications such as biology (e.g., comparison of cell distributions which often involves thousands of cells), astronomy (i.e., comparison of mass or light density in large object clusters), social sciences (e.g., multivariate comparisons based on census data collected from a large population), as well as many comparisons that arise in the field of stochastic simulation where the simulationist has full control over the sample size through the number of simulation replications hence large sample sizes are often used to reduce sampling error. In addition, this ensures a sufficient sample size under discretization of the space which is utilized for calculation of the Wasserstein distance in the implementation used in these experiments via the discrete optimization problem in Equation (1) considering the Euclidean distance to compute the cost matrix
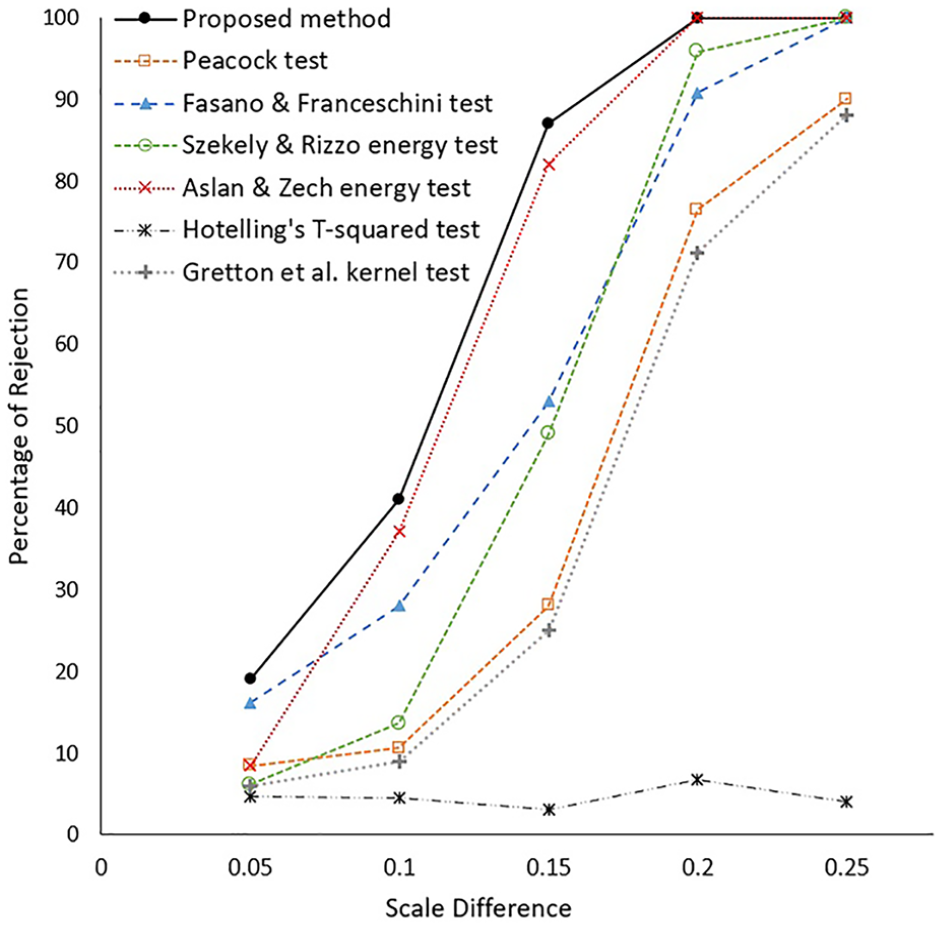
The results of test power comparisons. The horizontal axis is the difference between an entry in the covariance matrix for the two bivariate normal distributions being compared.
As shown in Figure 2, the proposed method reports the highest probability of rejection under all scenarios and shows higher power in detecting small differences in scale as compared to existing methods. For instance, the proposed method’s probability of rejection is more than twice as that of four of the methods at the smallest scale difference of 0.05 considered in these experiments. In addition, the proposed method converges to a 100% rejection probability faster at a scale difference of 0.2, while all other methods except Aslan and Zech energy test report a lower rejection probability. It is worth clarifying that the poor performance of the Hotelling’s
4.2. Type I error and validity of the proposed method
The validity of the proposed double-bootstrap procedure under the above parameter configurations is empirically investigated. To assess the type I error, 300 independent cases are simulated under the null hypothesis. As in previous experiments, a sample size of 5000 is used. For each case, the test statistic was calculated and compared to the bootstrapped critical value under different
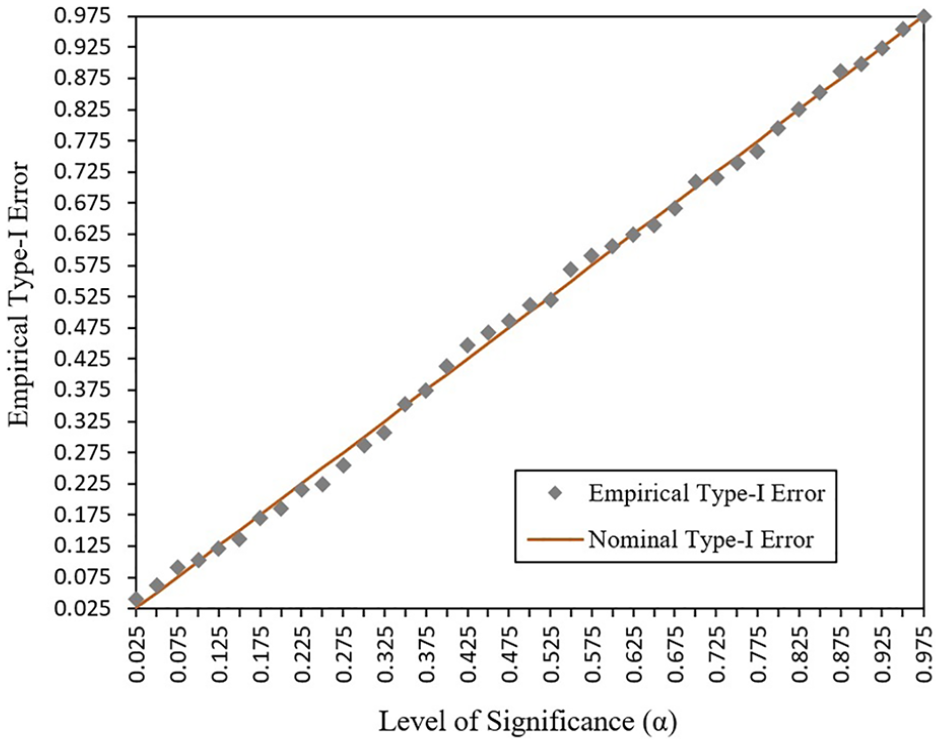
Comparison of the empirical and nominal type I error as the level of significance (
4.3. Computational time comparisons and practical implications
Figure 4 shows the computational time as the sample size changes. The average execution times are based on 200 experiments under a scale difference of 0.05 from Figure 2. All experiments are implemented in MATLAB and are run on a typical computer with 1.60 GHz Core i5 CPU and 32GB of RAM. The proposed method has the highest execution time for sample sizes 500, 1000, and 5000. This is expected as bootstrapping and Wasserstein distance calculation are computationally costly even though the fast method proposed by Pele and Werman 50 is used in these experiments for the calculation of the Wasserstein distance. However, as the sample size increases, the execution time of the other methods grows exponentially while it remains fairly flat for the proposed method. This is an advantage of the proposed method and is primarily due to the gridding (or binning) approach used, which transforms each sample into a multidimensional histogram. This effectively makes the Wasserstein distance calculation independent of the sample size. Note that calculating the Wasserstein distance between two given multidimensional histograms takes the same amount of time regardless of the sample size used to generate the two histograms in the first place. The slight increase in the proposed method’s execution time for higher sample sizes is due to the additional computation needed to perform resampling and gridding in each iteration of the bootstrapping. As shown in Figure 4, the proposed method has a shorter execution time than the method by Aslan and Zech 29 for sample sizes greater than 10,000, and shorter execution time than the tests by Gretton et al. 30 and Székely and Rizzo 28 for sample sizes greater than 20,000.
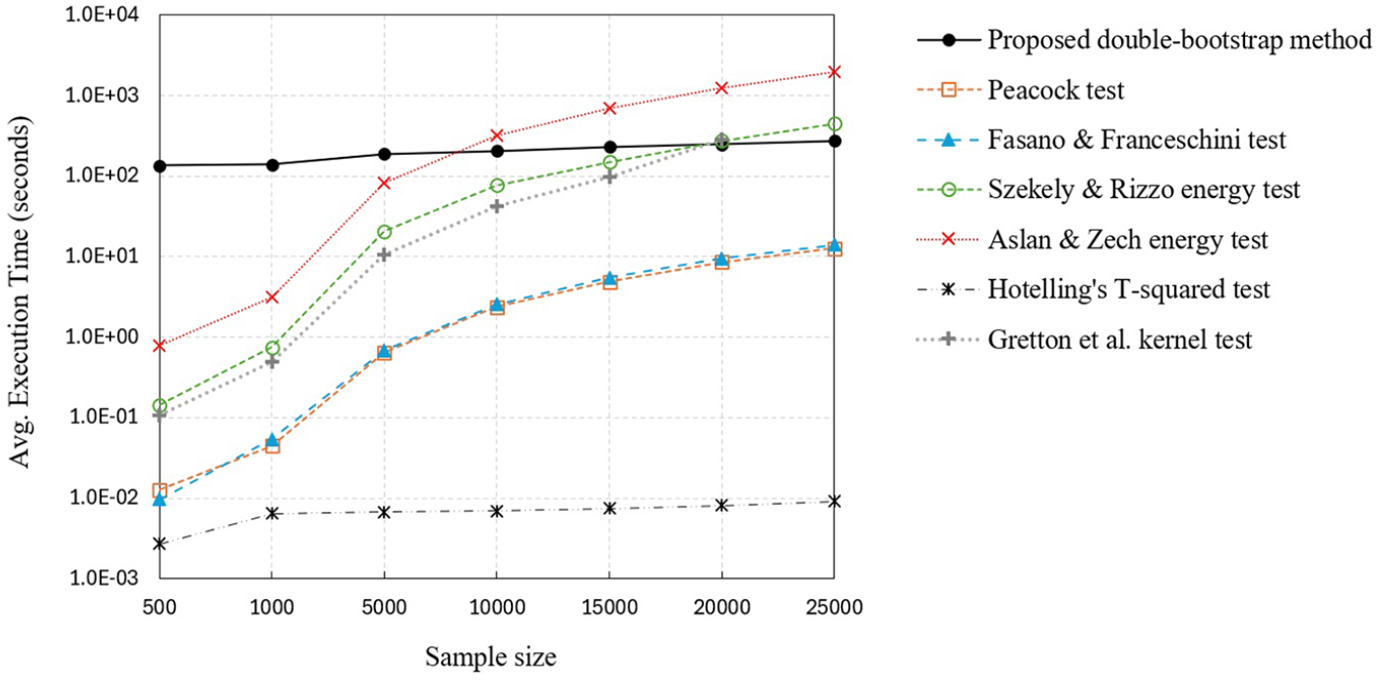
Computational time (log scale) as a function of the sample size.
4.3.1. Implications for practice
The statistical power and computational time comparisons in Figures 2 and 4 highlight the advantages and limitations of the proposed method and provide important insights for practical applications. Due to its high computational cost, the proposed method is not suitable for applications involving real-time decision-making (e.g., when comparing the simulation output generated by a digital twin with real-world data from the corresponding physical system). However, for applications involving offline decision-making where computational time becomes less relevant, the proposed method is recommended due to its high statistical power. In addition, for applications involving large sample sizes (e.g., large-scale agent-based simulation of swarms or human populations), the proposed method becomes attractive as its computational cost is less sensitive to increases in sample size. In special cases, additional information may be available on the two samples being compared. For example, if the two samples are known to be from two multivariate Gaussian distributions with equal variances, then the Hotelling’s
5. Sample applications with spatial simulation output
This section illustrates the applicability of the proposed method under two simulation applications with spatial output, namely simulation of swarms and unmanned aerial vehicle (UAV) communication systems. Unlike the previous section that focused on performance comparisons where many instances of each problem setting are generated to compute probabilities of rejection, this section aims to mimic how the proposed method will actually be used by simulationists in reality, and thus each problem setting is solved only once as is done in real-world applications. For example, when assessing the validity of a particular model, the simulationist would perform a statistical test to compare the simulation output with real-world data.
In addition, the only other method included in the results presented in this section is the Hotelling’s test. The focus on the Hotelling’s test is driven by two reasons: (1) it is the benchmark method in the field of simulation for comparing multidimensional simulation output, and (2) it has the fastest computational time based on the results from the previous section. Therefore, it is important to show how the Hotelling’s test performs in general applications where the simulation output may not follow any theoretical distribution. If the Hotelling’s test performs well in such applications despite potential deviations from its underlying assumptions, then the use of the proposed method is not justified due to its high computational cost. However, the sample applications in this section show that the Hotelling’s test can lead to incorrect decisions. Since the two examples represent offline decision-making problems where computational time is not a binding constraint for the decision-maker, the proposed method becomes the preferred choice because of its high statistical power. Note that the other five methods are excluded from the results in this section because they reported a lower statistical power than the proposed double-bootstrap method and a higher computational time than the Hotelling’s test, hence they would clearly represent suboptimal choices when the computational time is not a deciding factor.
Finally, it is worth noting that there is an extensive stream of research in the statistics literature on how quickly an empirical distribution
5.1. Comparing random walk models in swarm simulations
The experiments in this section represent a situation where a sample of observations from a multidimensional random walk process is available and the goal is to identify which parameter configuration for the underlying random walk model the observed data might have come from. This is done by experimenting with different parameter configurations for the random walk model, where a sample is generated under each candidate parameter setting and a multidimensional two-sample test is performed to detect whether there is a statistical difference between the observed and simulated samples. A statistical difference would then indicate that the parameter setting under consideration does not provide an appropriate model for the observed data. Such comparisons are commonly needed when validating simulation models based on real-world data, for example, when determining an appropriate model for swarming behavior of animals or migration of cancer cells into surrounding tissue.
This example considers a random walk where particles start at the origin with coordinates
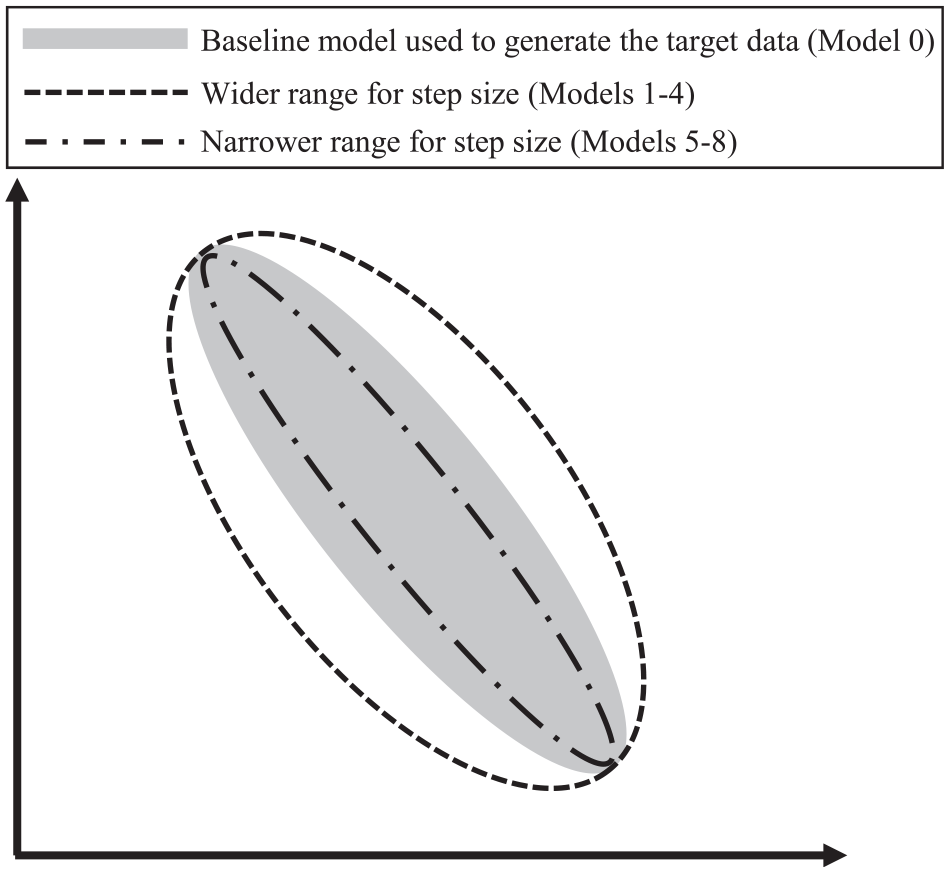
A schematic illustration of the spatial output for the random walk models. The highlighted region represents the distribution of the target data to be tested against.
Statistical comparisons for the random walk example.
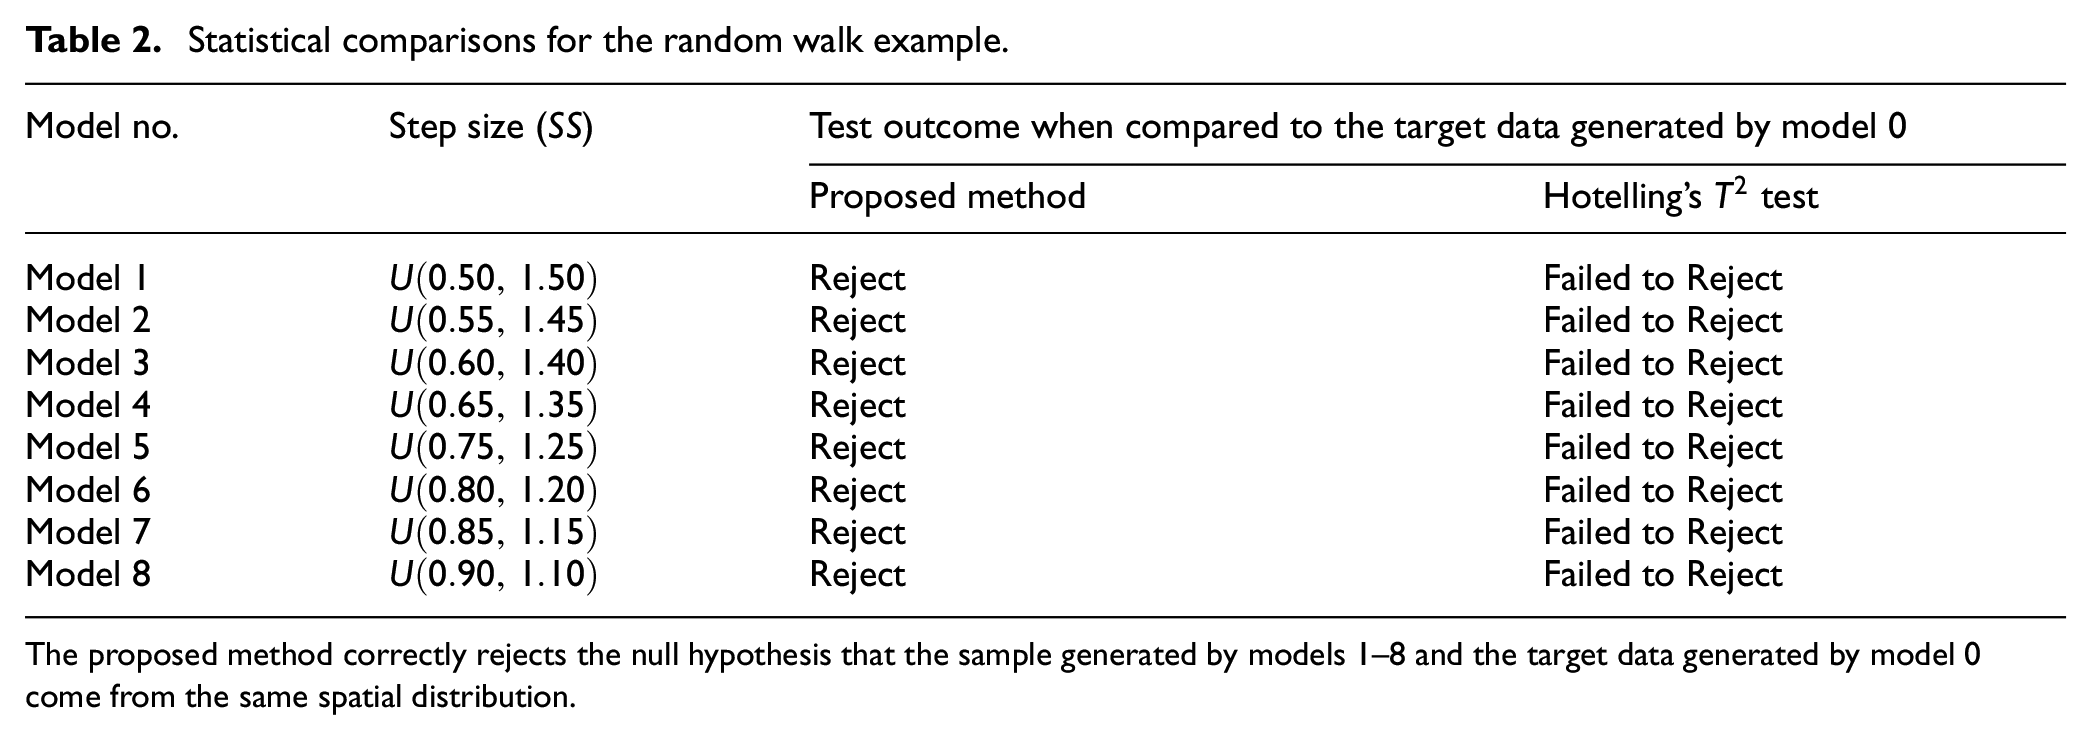
The proposed method correctly rejects the null hypothesis that the sample generated by models 1–8 and the target data generated by model 0 come from the same spatial distribution.
As shown in Table 2, the proposed method correctly rejects the null hypothesis that the samples generated by models 1–8 and the target data generated by model 0 come from the same distribution, while the Hotelling’s
5.2. Comparing spatial output in a simulation of UAV communication systems
This example is adapted from a realistic engineering application
53
involving the simulation of UAV-to-UAV communications in an urban landscape. As schematically shown in Figure 6, the problem setting involves a set of UAVs that operate within a height range specified by
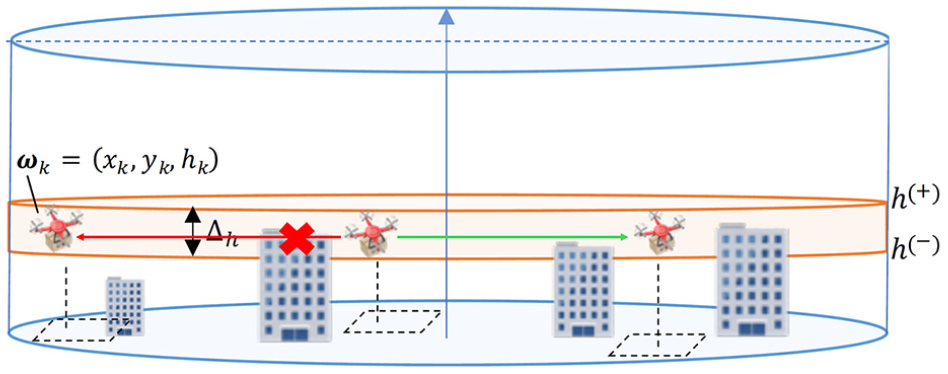
A schematic illustration of the UAV-to-UAV communication system. Each UAV operates in its designated sub-region. The red arrow indicates signal obstruction by buildings while the green arrow indicates Line of Sight (LoS) between two UAVs.
The urban area where the UAVs operate is a 2.4 km
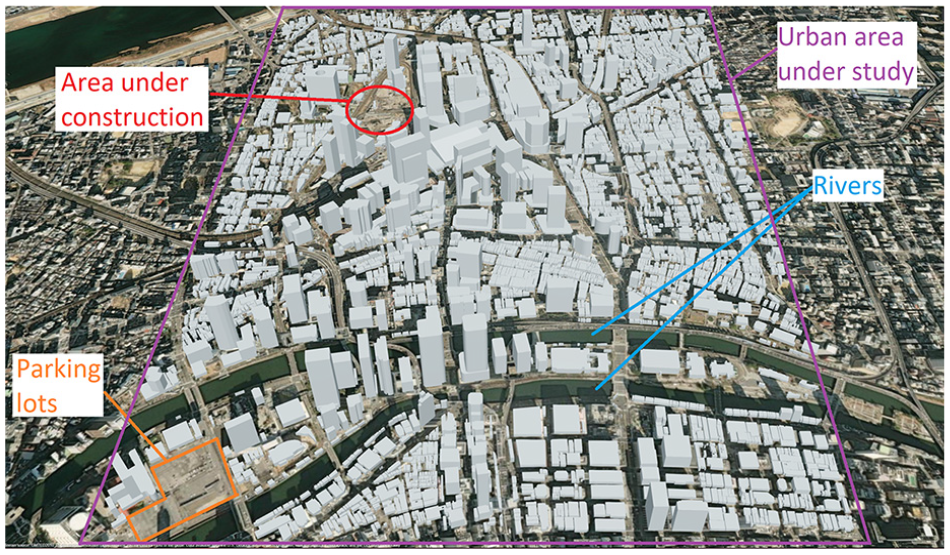
The urban area in Osaka, Japan. The 3D buildings are generated using OpenStreetMap data.
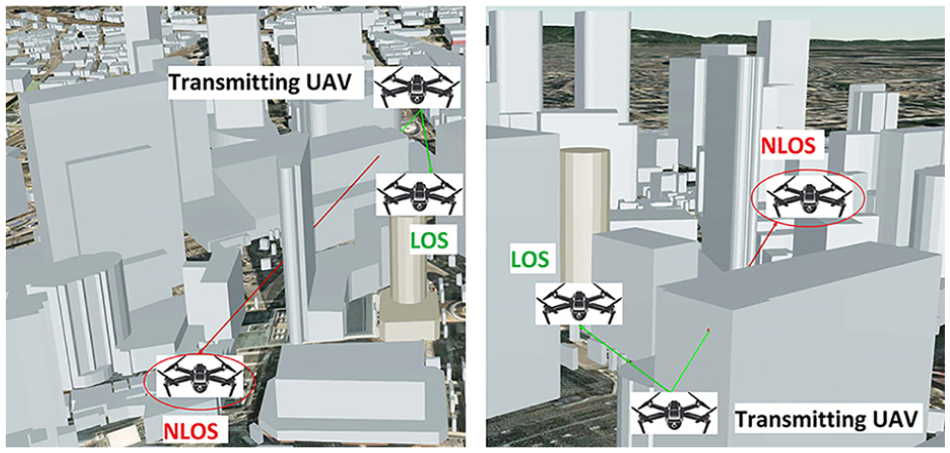
Signal obstruction by buildings. The same scenario is shown from two different angles, where a green arrow indicates Line of Sight (LOS) and a red arrow indicates Non-Line of Sight (NLOS) due to obstruction by buildings.
The simulation model is implemented in MATLAB and can be summarized as follows. In each simulation replication, the UAVs are generated (one UAV per sub-region) by randomly sampling their latitude and longitude within the respective sub-region. UAV heights are randomly generated within the given height range
For the statistical comparisons performed in this example, the target data set is generated by setting the height range to
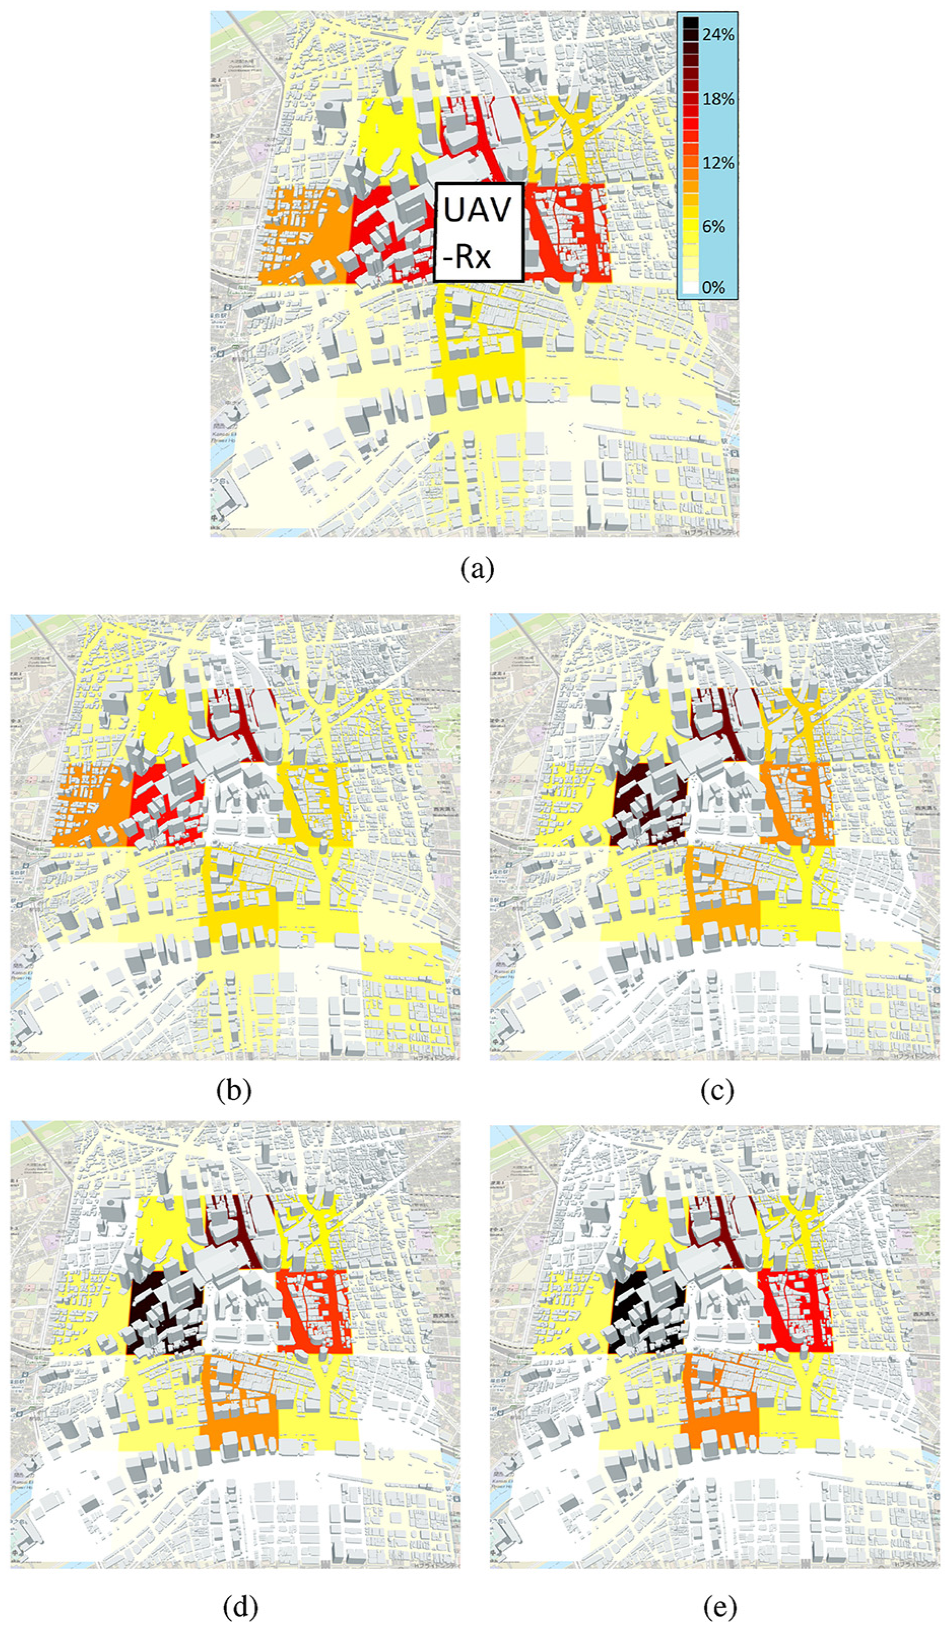
Target data and spatial simulation output distributions. The height range parameter for the models are: (a)
Statistical comparisons for the UAV-to-UAV communication example.
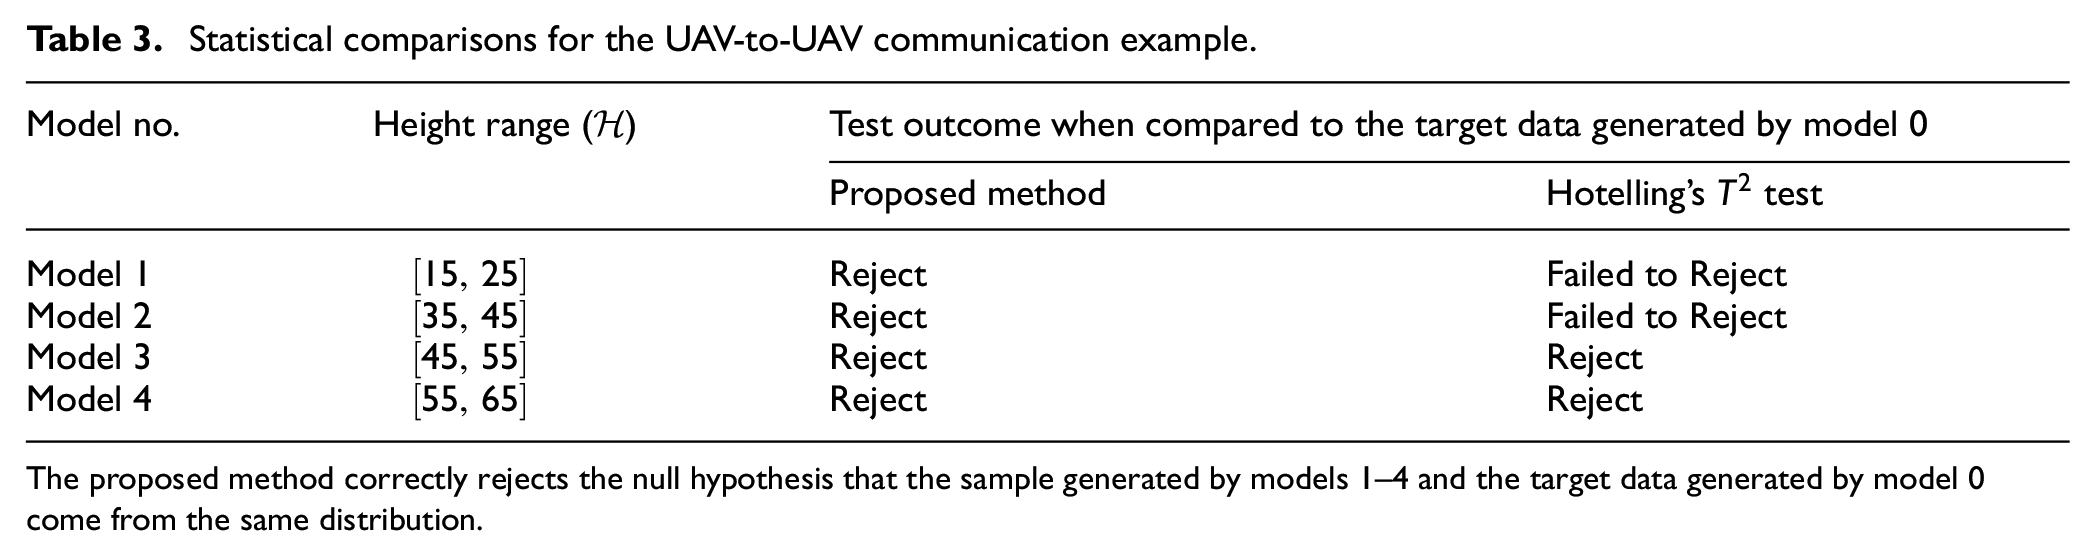
The proposed method correctly rejects the null hypothesis that the sample generated by models 1–4 and the target data generated by model 0 come from the same distribution.
6. Conclusion
In this paper, a novel method for comparing two multidimensional samples was proposed to enable validation, verification, and calibration of simulation models with spatial output in situations where the benchmark Hotelling’s two-sample
The work presented here reveals the potential of bootstrap methods based on the Wasserstein distance. Bootstrapping methods, such as the one proposed here, can offer key advantages that extend their applicability beyond existing methods. For example, they do not require assumptions about equal sample sizes or variances, the underlying distributions being compared, or the form of the cost function used for calculating the Wasserstein distance. The latter also enables generalizations to other definitions and probability measures. In addition, while the discussions in this paper focused on the two-sample problem, the proposed method can also be used to perform goodness-of-fit tests, given a sample
There are several possibilities for extensions and future research. For example, while it is possible to extend the proposed method to more than two populations by the Bonferroni multiple comparisons method, development of Wasserstein distance-based bootstrapping tests for comparing more than two samples without the need for Bonferroni correction would be an interesting area for future research. This is because performing multiple tests would reduce the overall test power due to the Bonferroni adjustments, especially when the number of candidate samples to be compared is large.
54
From an experimental point of view, other forms of Wasserstein distance and metrics can be defined on the space of probability measures and incorporated into the general double-bootstrap procedure proposed in this paper. For instance, simulation experiments can be performed to evaluate the effect of varying the exponent
It is hoped that this paper and its future extensions along the above lines will enhance validation, verification, and calibration of simulation models with spatial output, and draw more attention to Wasserstein distance-based bootstrapping methods.
Footnotes
Acknowledgements
The author is indebted to the Bio-Inspired Networking Lab at the Graduate School of Information Science and Technology at Osaka University (Japan) for hosting him during his sabbatical leave when this research took place. The author is thankful to Dr Takeshi Hirai, whose research on UAV communication systems inspired the example presented in this paper.
Funding
This research received no specific grant from any funding agency in the public, commercial, or not-for-profit sectors.
Author biography
![]() .
.