
Abstract
Increased usage and non-efficient management of limited resources has created the risk of water resource scarcity. Due to climate change, urbanization, and lack of effective water resource management, countries like Pakistan are facing difficulties coping with the increasing water demand. Rapid urbanization and non-resilient infrastructures are the key barriers in sustainable urban water resource management. Therefore, there is an urgent need to address the challenges of urban water management through effective means. We propose a workflow for the modeling and simulation of sustainable urban water resource management and develop an integrated framework for the evaluation and planning of water resources in a typical urban setting. The proposed framework uses the Water Evaluation and Planning system to evaluate current and future water demand and the supply gap. Our simulation scenarios demonstrate that the demand–supply gap can effectively be dealt with by dynamic resource allocation, in the presence of assumptions, for example, those related to population and demand variation with the change of weather, and thus work as a tool for informed decisions for supply management. In the first scenario, 23% yearly water demand is reduced, while in the second scenario, no unmet demand is observed due to the 21% increase in supply delivered. Similarly, the overall demand is fulfilled through 23% decrease in water demand using water conservation. Demand-side management not only reduces the water usage in demand sites but also helps to save money, and preserve the environment. Our framework coupled with a visualization dashboard deployed in the water resource management department of a metropolitan area can assist in water planning and effective governance.
Keywords
1. Introduction
Sustainable water resource management relates to harvesting, managing, and preserving natural resources in an adequate manner in order to sustain life and the ecosystem.1,2 About 71% of the surface of the Earth is water, out of which 96.5% is oceans and only 3.5% is freshwater. 3 Groundwater, one of the valuable fresh water resources, provides half of all drinking water worldwide 4 and is extracted from aquifers by drilling wells. 5 The total volume of groundwater in the upper 2 km of the Earth’s continental crust is approximately 22.6 million km3, with a recharge of 1.0–5.0 million km3/50 years. 6 The withdrawal rates of the groundwater are currently in estimated at around 982 km3/year around the globe. 7 This continued groundwater pumping causes groundwater depletion and is a key cause of water scarcity in many regions of the world.
Around 2 billion people, worldwide, face water scarcity, and around 4 billion people experience severe scarcity during at least a month in a year. 8 Global baseline water stress, shown in Figure 1, highlights the South Asian and African region having extremely high (>80%) stress levels. 9
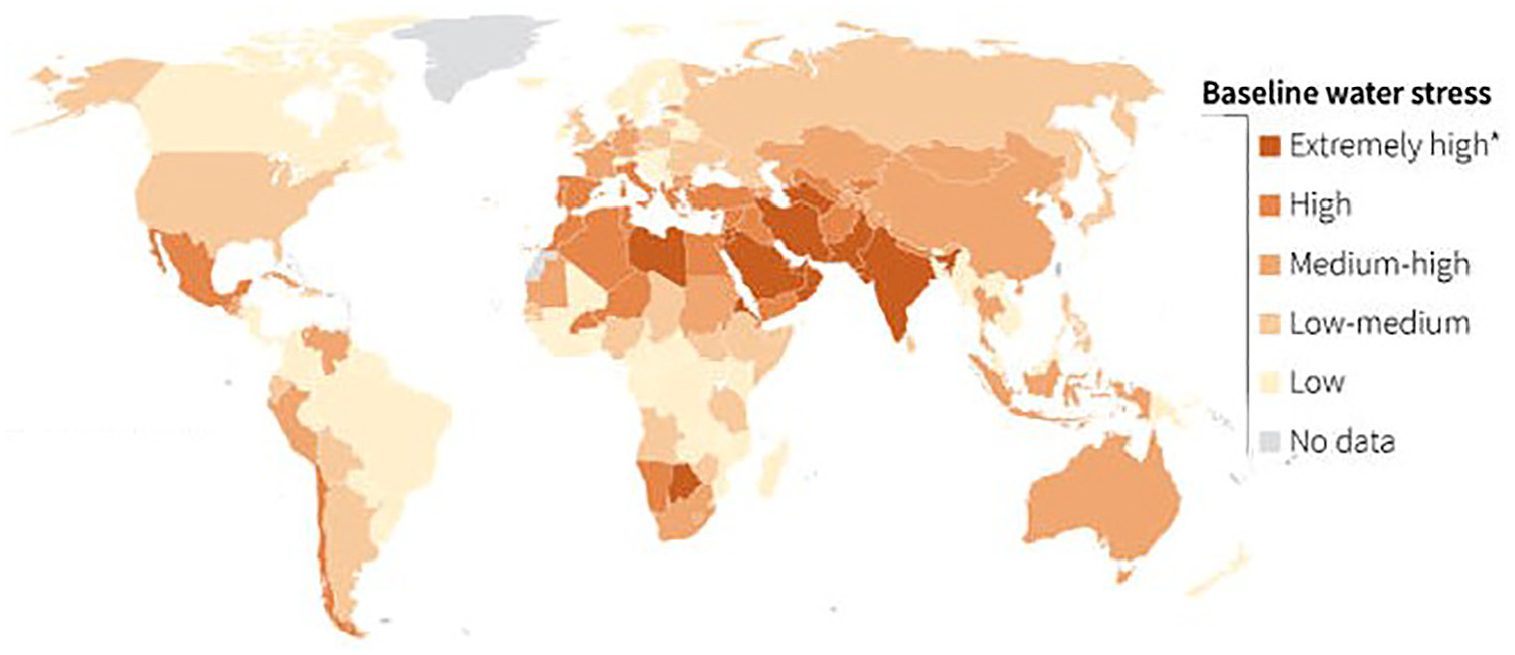
Baseline water stress. 9
Factors such as population increase, socioeconomic development, and climate change affect water consumption patterns, with an observed increase in worldwide consumption by about 1% per year. At this rate, by 2050, global water demand is expected to rise by about 20–30% of current use. 8 Pakistan is among the most water stressed countries and is susceptible to both physical and economic water scarcity. The exponential increase in the population, from 20–40% in 2018 to 40–60% by 2030, 10 rapid urbanization, lack of sustainable infrastructures, unplanned industrialization, and lack of proper water resource governance are the major contributing factors in the country’s water crisis.11–13 Hence, the annual water availability (per capita) has decreased to 82% since independence, in 1947. 14 Pakistan extracts 74.3% of its groundwater annually, which raises major sustainability concerns. 15
This ignites the impetus to develop a framework to model and analyze the current system: identify the demand–supply gap; estimate the unmet future demand and water shortages; and build a decision support system (DSS) to administer the efficient and regulated water supply using mixed strategies. Different scenarios, consistent with local policies, addressing the water supply and demand challenges need to be evaluated in order to draft effective strategies in reducing the demand and supply gap with effective measures.
Modeling of water resource management systems with consumer demand, supply sources and the dynamics of distribution pathways, and the simulation of demand–supply processes, serve as the basis for making informed strategic decisions. 16 It helps in the evaluation of the demand and supply dynamics of a water resource management system under varying conditions, with consumers and producers having complex heterogeneous behavior, to investigate different scenarios and strategies, for example, water conservation through waste water treatment and rainwater enhancement; sustainable use through responsible consumption and avoiding wastage; and upgrading infrastructure for alternative supply sources.
In this paper, we propose a framework for the modeling, simulation, and analysis of sustainable urban water resource management. The proposed framework uses the Water Evaluation and Planning (WEAP) system 17 and a scenario-based approach to evaluate current and future water demand and supply gaps. The salient features of our proposed framework are briefly discussed here:
i. a systematic modeling, simulation, and analysis workflow to guide practitioners with the steps of a simulation study in water resource management;
ii. adaptability and flexibility in design to cover a large variety of applications in water resource management;
iii. ease of generalization to easily reuse the framework in any region or at any scale;
iv. the elasticity of resolution and scale to conceptualize a real system at various granularity levels and with any population size or spatial scale, that is, colony, town, city, district, province, or country;
v. workflow to define different evaluation scenarios to analyze a variety of what-if questions concerning the alternatives in water resource management using the underlying WEAP framework.
Our framework relies on the inherent features of WEAP to compose the different evaluation scenarios featured to analyze a variety of what-if questions concerning the alternatives in water resource management. Table 1 presents a list of the evaluation scenarios presented in this paper, along with their intended purpose.
Scenarios in our proposed framework.
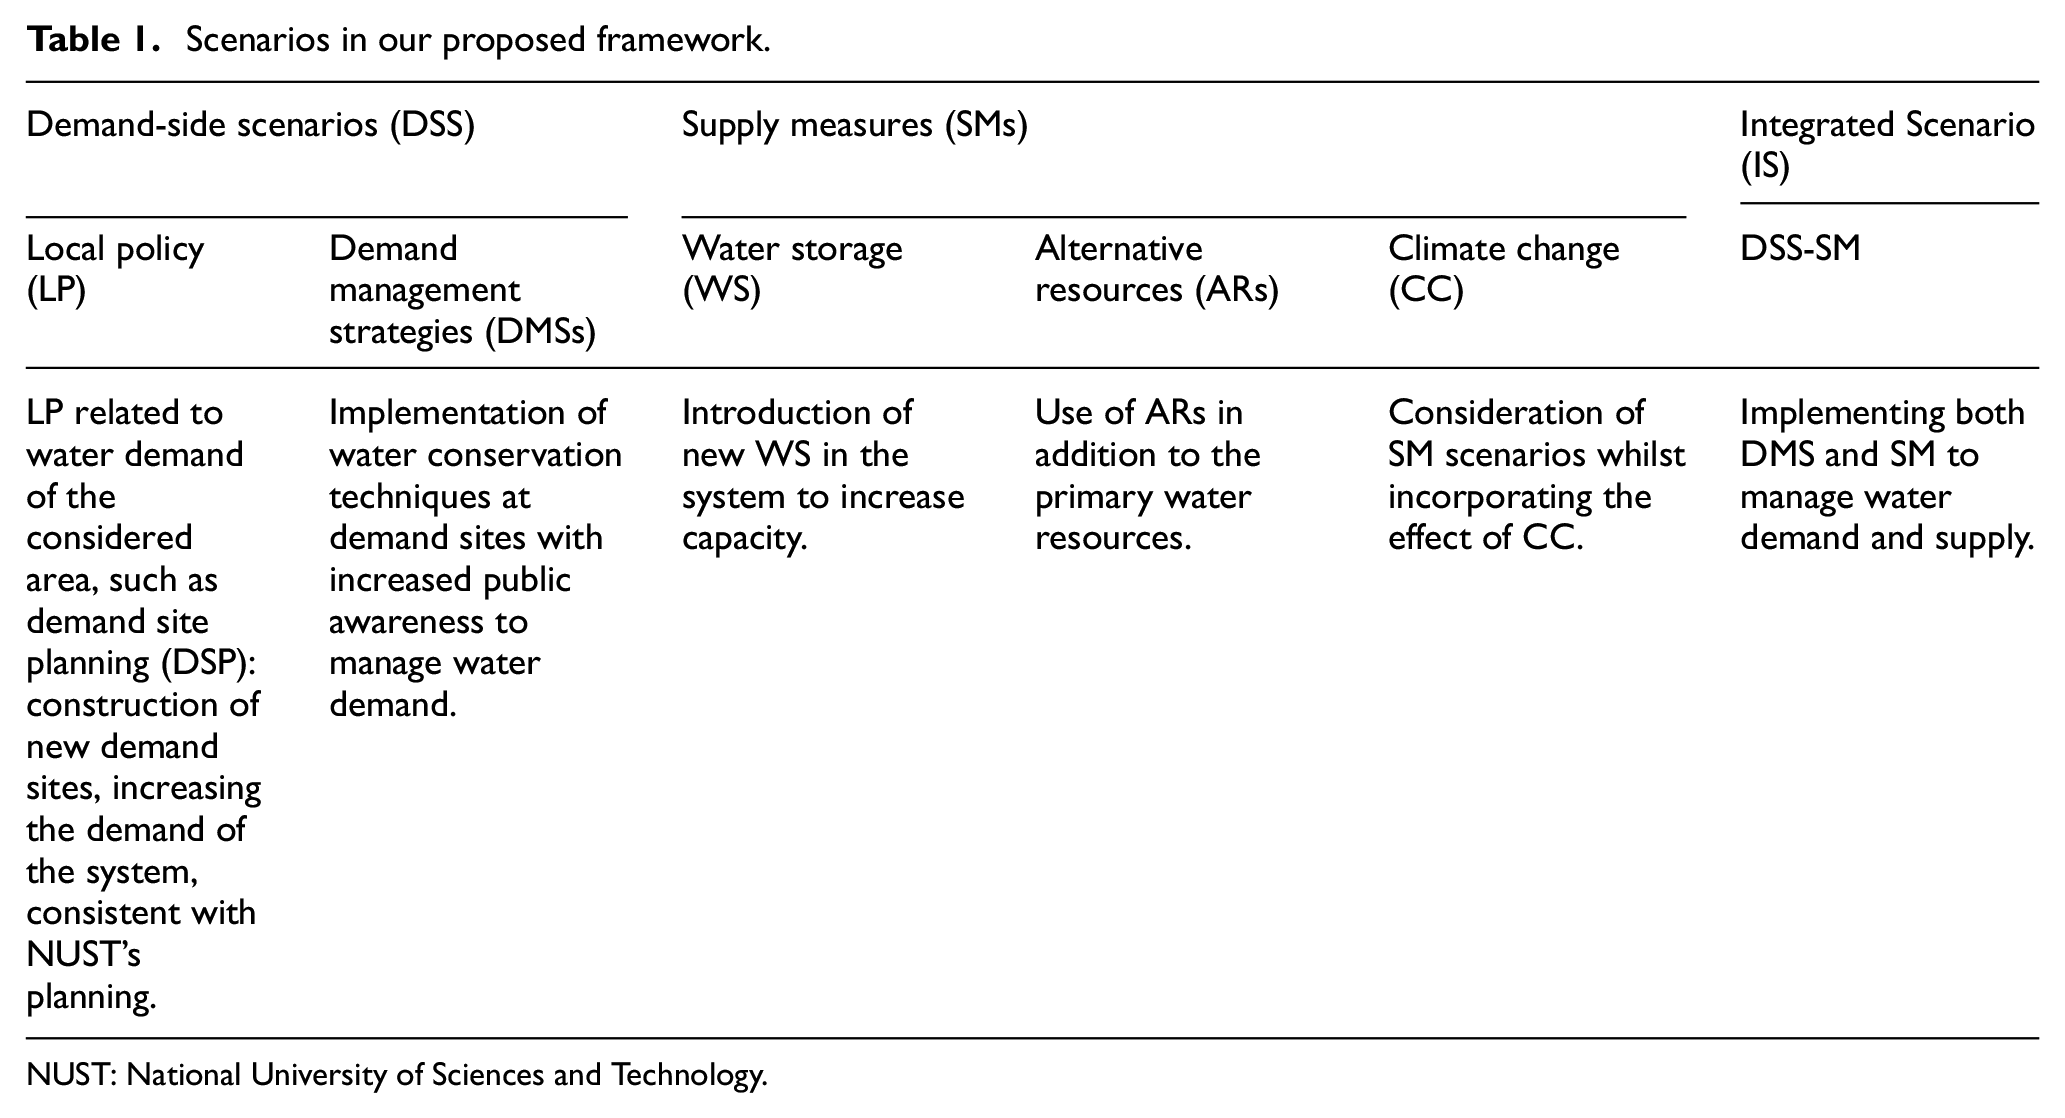
NUST: National University of Sciences and Technology.
We studied the demand and supply processes of the National University of Sciences and Technology (NUST), Islamabad, Pakistan. NUST is selected as a pilot study because it provides a prototypical urban setting, having demand and supply patterns similar to a denser metropolitan area of major cities in Pakistan, that greatly relies on groundwater resources, instead of a municipal water supply system. Our study considers the characteristics of a typical urban area at a microscopic abstraction, having an independent ecosystem with its own water supply sources and demand sites, with available data and access to daily life observational patterns. This provides us with a complete on-the-ground experimental framework to model and analyze a comprehensive microgrid.
The rest of the paper is organized as follows: Section 2 reviews the literature in detail. Section 3 discusses our methodology and the details of our proposed approach. Section 4 provides a discussion. Finally, Section 5 provides conclusions and future work.
2. Literature review
In this section we discuss and compare different applications of water resource management using existing tools and frameworks.
2.1. Water resource management tools
The use of different water resource management tools to analyze water demand and supply has been previously discussed in the literature by different researchers. These tools include SWAT (Soil & Water Assessment Tool), MODSIM, System Dynamics (SD), RIBASIM (River Basin Simulation Model), Urban Volume Quality (UVQ), DUWSiM, and AnyLogic. SWAT is used in small watersheds to large river basin models. MODSIM helps in (long-term) planning, (medium-term) management, and (short-term) operations. SD helps in simulating water demand and supply systems with non-linear behaviors using stocks and flows. RIBASIM supports river basin simulations. UVQ is focused on urban water and contaminant balance. DUWSiM allows long-term urban water analysis. AnyLogic is used for microsimulations using an agent-based modeling (ABM) approach.
Jayakrishnan et al. 18 discussed the use of SWAT tool to analyze the impact of different qualitative and quantitative management scenarios in the small watershed to river basin-scale model. Labadie 19 discussed MODSIM as a decision support tool used for the management of river basins, which helps in their long-term planning, medium-term management, and short-term operations. Xi and Poha 20 presented the sustainable water management model based on SD. Similarly, Mavrommati et al. 21 used a SD model to analyze urban coastal socioeconomic and ecological systems. Omar 22 used RIBASIM to analyze water supply and demand management based on scenario evaluation. Peña-Guzmán et al. 23 discussed the use of the UVQ model for urban water management in two catchments in Bogotá, Colombia. Willuweit and O’Sullivan 24 used DUWSiM with a focus on long-term urban water demand and supply analysis based on different scenarios. The analysis is based on urban water balance using the land use model and the climate model. Alvi et al. 25 developed an AnyLogic model to forecast the short-term and long-term household water consumption of urban areas in different climates.
2.2. Water Evaluation and Planning models
WEAP is used to evaluate, analyze, plan, and manage water demand and supply of an area of interest, particularly for urban, agricultural, sub-basins, complex rivers, and groundwater systems. It offers an integrated approach for deploying a water balance database and a scenario generation tool to evaluate water management policies and stakeholder processes.
Brown et al. 26 estimated the water shortages in watersheds of the USA using the WEAP framework and discussed the susceptibility of water resources under climate change and population growth and analyzed the monthly water demand and renewable water supply. The authors also analyzed possible adaptions to overcome future demand shortages, such as enhancements in reservoir storage, reducing water demand, and withdrawal efficiency improvements. Kou et al. 27 used WEAP to model the urban water supply and demand trends of Xiamen city and assessed the finer-scale water balance of each district in the city. The research focused on analyzing water shortages, saving potential, and supply alternatives. Metobwa et al. 28 analyzed the water supply and demand of Mara River, Kenya, using the WEAP model. The research addressed the increased water demand affecting the Mara River and focused on scenario-based future demand evaluation where different strategies were accessed to mitigate overuse practices and to analyze monthly and annual unmet demands. Salomón-Sirolesi and Farinós-Dasí 29 proposed the water supply and demand governance model for the Mendoza River basin using WEAP. The model applied to administrative management units of the basin. Multiple scenarios were considered based on water availability and water rights. The results show that it will be possible to accommodate future demand better than at present using the proposed model, even under climate change impacts. Ahmed et al. 30 modeled crop evapotranspiration using WEAP. The model was used to estimate the difference between potential and actual crop evapotranspiration for cotton and wheat. Amin et al. 31 analyzed management strategies to achieve water security and sustainability in the Upper Indus Basin, Pakistan, using WEAP. The study considers multiple socioeconomic and climate change scenarios, where domestic water-saving techniques were applied. This decreased the per-capita water demand, along with the modeled percentage decrease in losses. Asghar et al. 32 assessed the water demand and supply of the Central Indus Basin under climate change and socioeconomic scenarios using WEAP. Sieber 33 discussed how WEAP is globally used, especially where conventional tools fail to adequately manage the water resources due to their supply-oriented structure. The tool provides an integrated approach that strategically integrates the water supply and projects it in the context of demand-side management issues while preserving water quality and ecosystem. It allows the planning and management of water systems by policy analysis.
2.3. Water resource management applications
McCartney and Arranz 34 from the International Water Management Institute (IWMI) evaluate historic, current, and future water demand in South Africa. Alamanos et al. 35 assess urban water demand for sustainable water resources management, under climate and socioeconomic changes. Alemayehu et al. 36 discuss the water resource implications of planned development in Ethiopia. Moglia et al. 37 review the water conservation efforts for sustainable water use. The review is focused on developing understanding of factors influencing the public to conserve water. Generally, the solutions to potable water deficits include water conservation, alternative resources, and augmenting existing supplies. Research highlighted that policymakers are in a dilemma to ensure water sustainability with increased water demand under population increase and climate change. Shabbir and Ahmad 38 analyzed the susceptibility status of water resources in the Rawalpindi and Islamabad area, the third-largest metropolitan area of Pakistan. The study used the Analytic Hierarchy Process (AHP), a multicriteria decision-making process that is used for evaluation and analysis to support decisions with competing and multiple objectives. The research listed 12 indices for vulnerability evaluation of the study area, which are subdivided based on vulnerability forming factors, described as natural, artificial, and bearing vulnerability. The results described the water system of Islamabad and Rawalpindi as relatively vulnerable due to the impact observed from both factors: climatic and non-climatic. These factors are barriers to sustainable water systems. Kanwal et al. 39 review the groundwater susceptibility of Lahore, the provincial capital of Punjab, Pakistan. With no strict law or regulation to limit the exploitation, the study shows that the supply to the country’s urban areas is not only based on groundwater but also over-exploitation of groundwater, which leads to scarcity. The paper reviews Lahore’s groundwater depletion and how its levels are affected due to the long history of over-extraction of groundwater and reduced aquifer recharge. Pakistan faced an energy crisis with limited availability of electricity (load shedding), and with exhausted aquifers of declining water trend, the crisis for the coming years may also be in terms of water-shedding. Table 2 summarizes the above contributions with their modeling objectives, tool used, and study area.
Literature review.
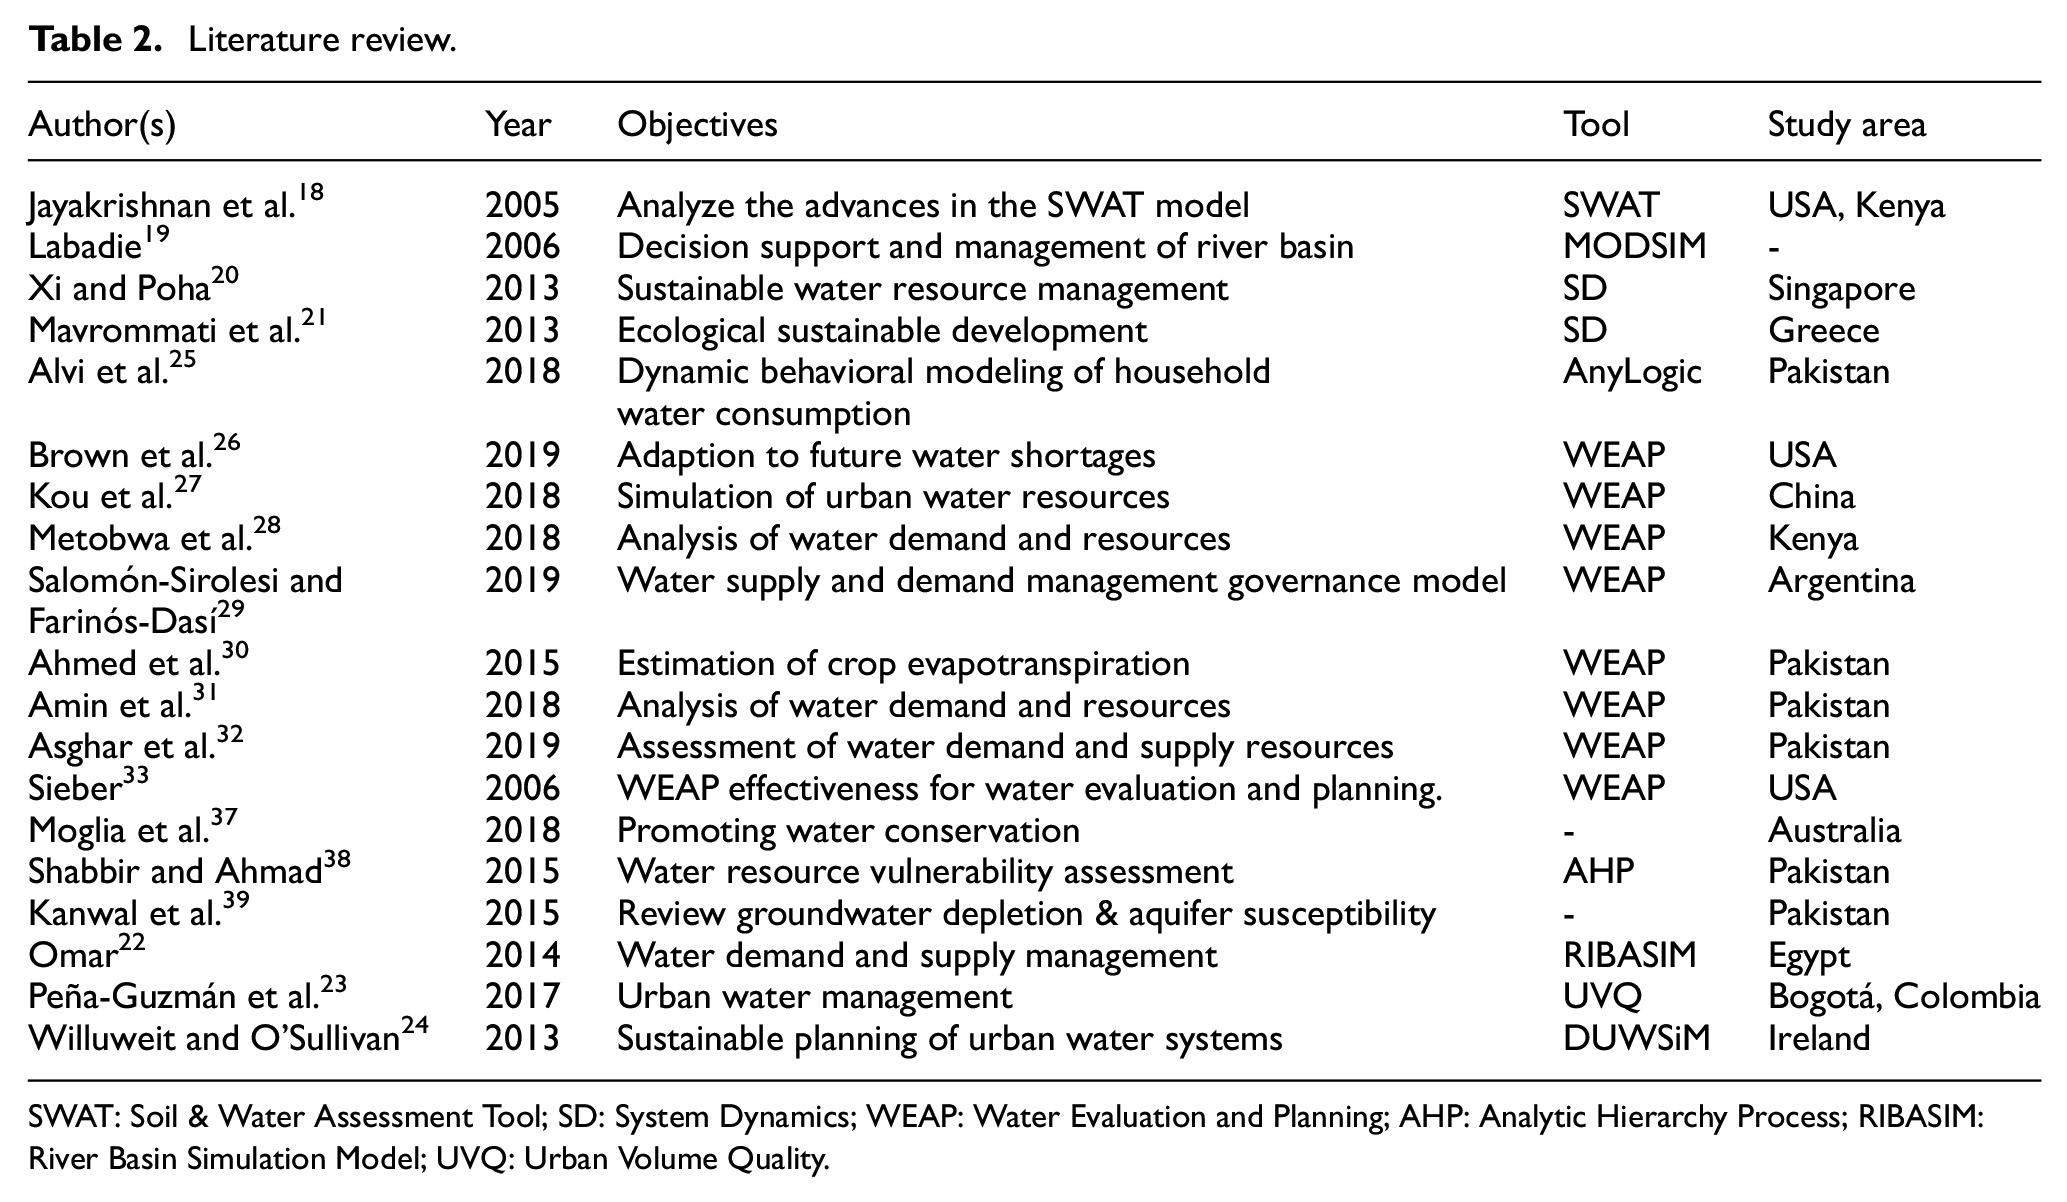
SWAT: Soil & Water Assessment Tool; SD: System Dynamics; WEAP: Water Evaluation and Planning; AHP: Analytic Hierarchy Process; RIBASIM: River Basin Simulation Model; UVQ: Urban Volume Quality.
2.4. Discussion
It is evident that to cope with the increasing water demand, planning and strategies for the improvement of the vulnerability status of urban water resources are required. Therefore, an efficient, integrated approach is needed for sustainable water use, which is the focus of our research. The existing work has helped to choose the effective water supply and demand management model. WEAP proved to provide an adequate, integrated, and potent approach to manage urban water resources in the context of demand-side issues. The policy-based analysis is adopted in our proposed research to implement different policies under different scenarios. It was observed that most research is focused on simulating water-bodies, such analyzing river basins, while none of the reviewed literature considered groundwater as the primary source of water. To the best of the authors’ knowledge, no integrated approach for groundwater management of urban areas under different climate changes, increased urbanization scenarios, alternative resources, and demand management is currently available. The proposed model also integrates demand-side management along with supply management and alternative measures under increased urbanization and climate change scenarios. Further, this work considers groundwater as the primary resource and will focus on its analysis, as it is the need of the hour. Further, the novelty of the proposed work is highlighted using Table 3, which shows a comparison of our proposed framework with the previously proposed models, in terms of the various scenarios. Our framework provides a rich composition of a scenario-driven analysis and integrated framework for water resource management.
Feature comparison with literature.
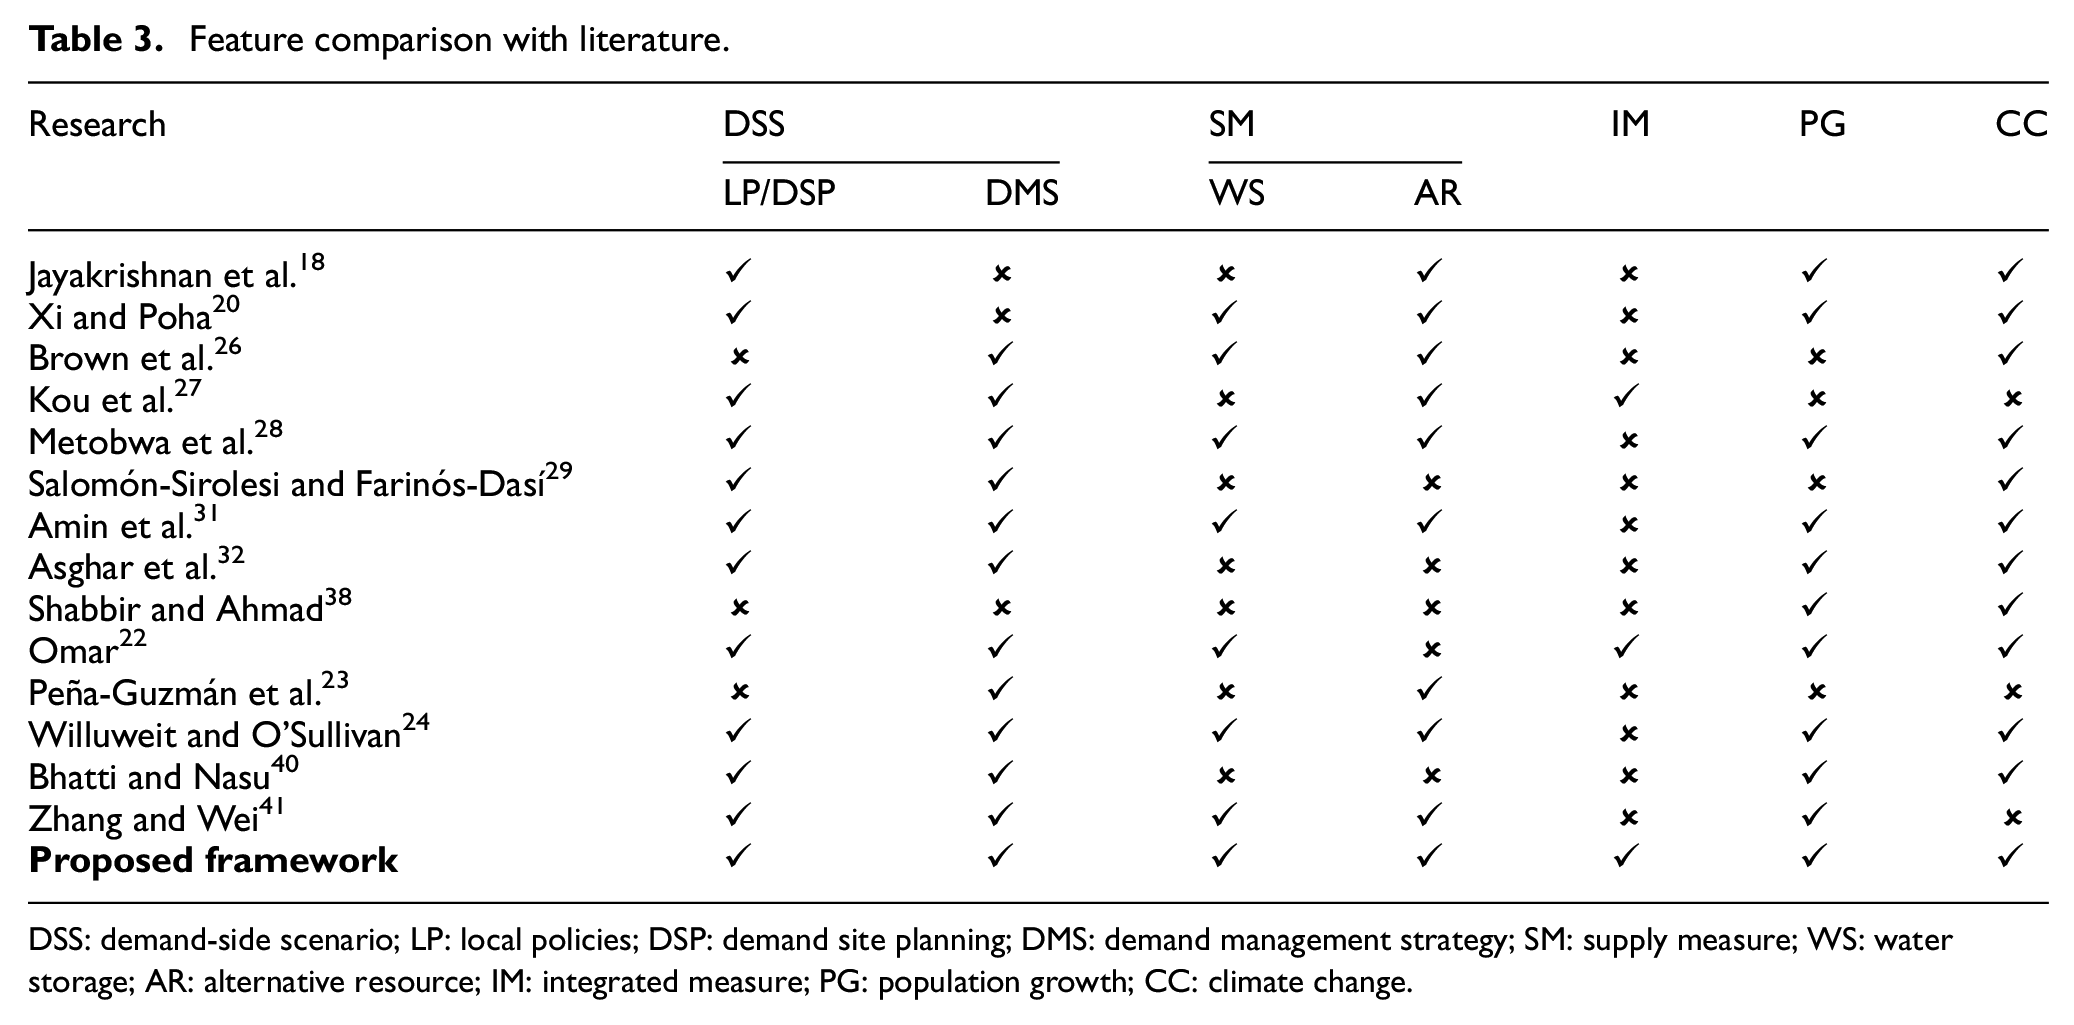
DSS: demand-side scenario; LP: local policies; DSP: demand site planning; DMS: demand management strategy; SM: supply measure; WS: water storage; AR: alternative resource; IM: integrated measure; PG: population growth; CC: climate change.
3. Methodology
This section discusses the methodology of our proposed approach and the developed framework. It presents the proposed workflow with the processes and artifacts produced in each step of the workflow, and the mapping of these artifacts in to the WEAP executable model, illustrated in Figure 2. Figure 3 overviews a block diagram of our proposed urban water resource management framework showing entities, elements, structures, and their hierarchal relationships.
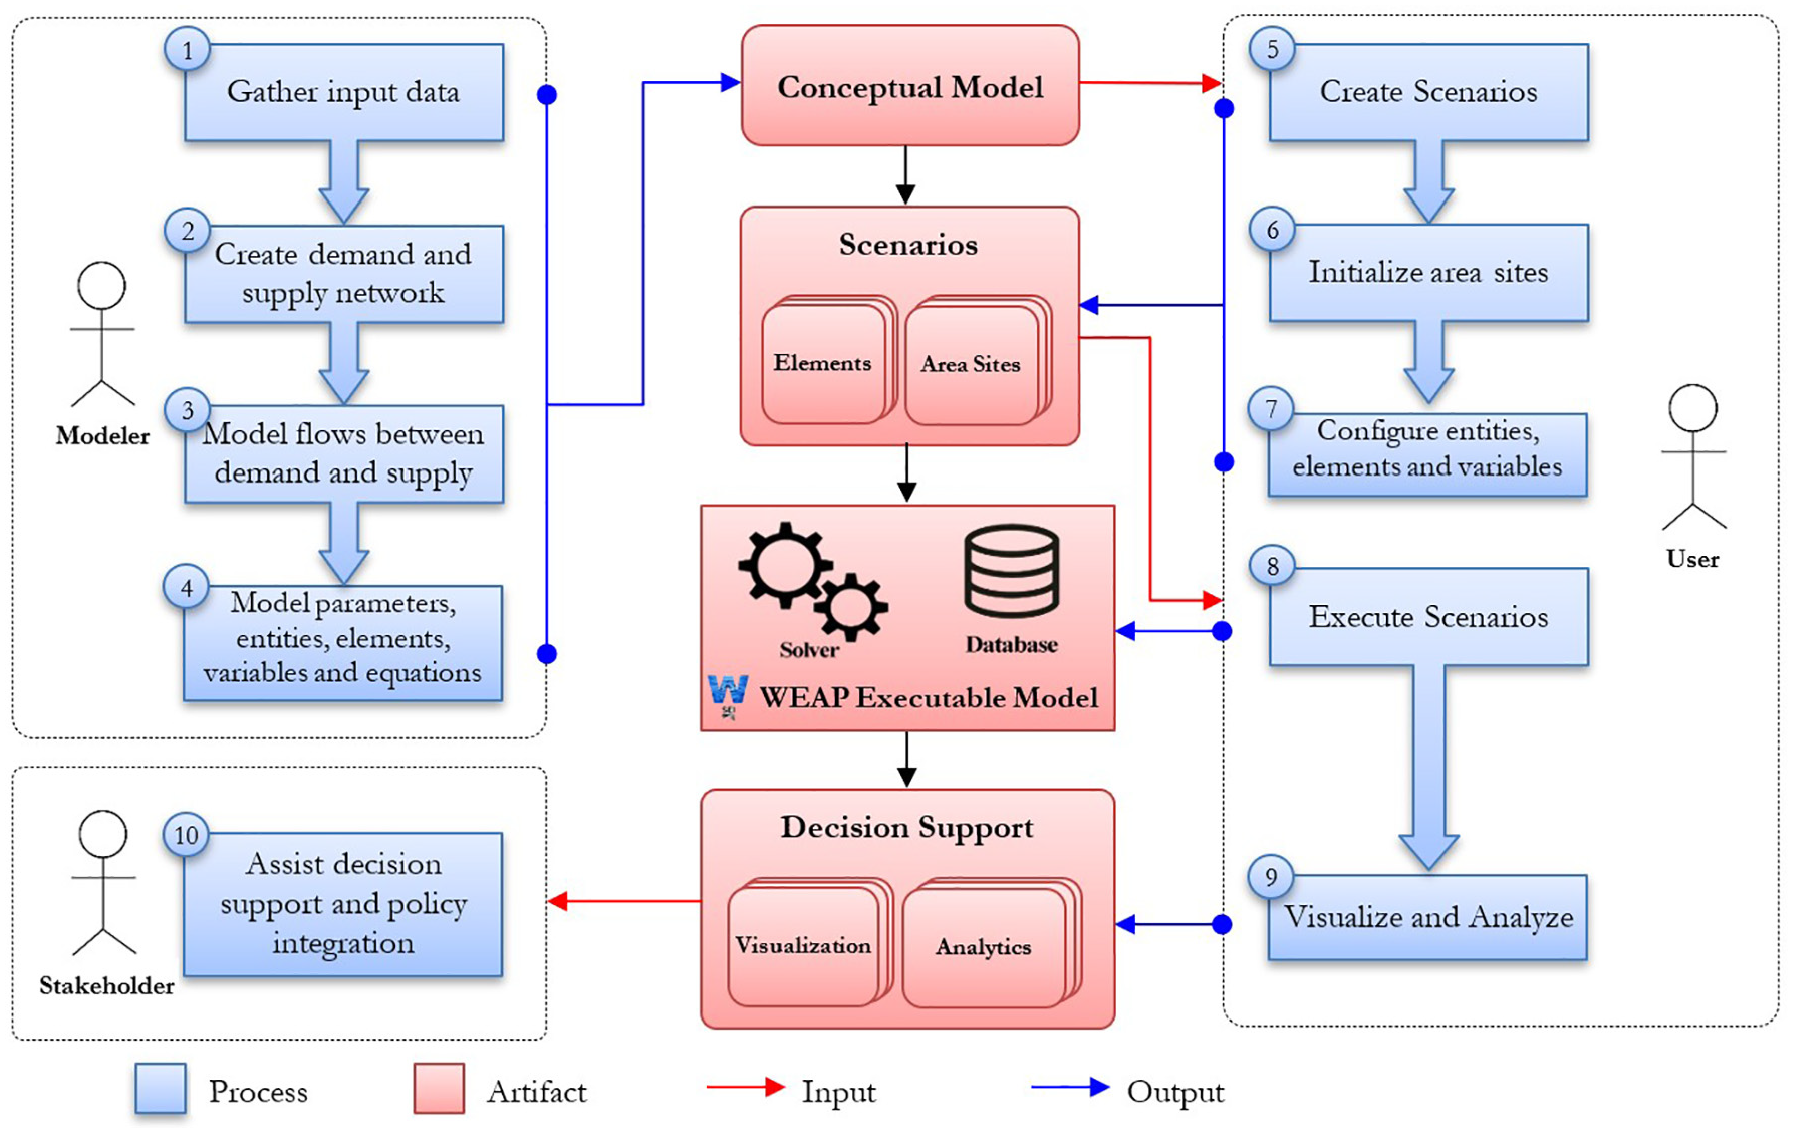
Urban water resource management workflow. WEAP: Water Evaluation and Planning.
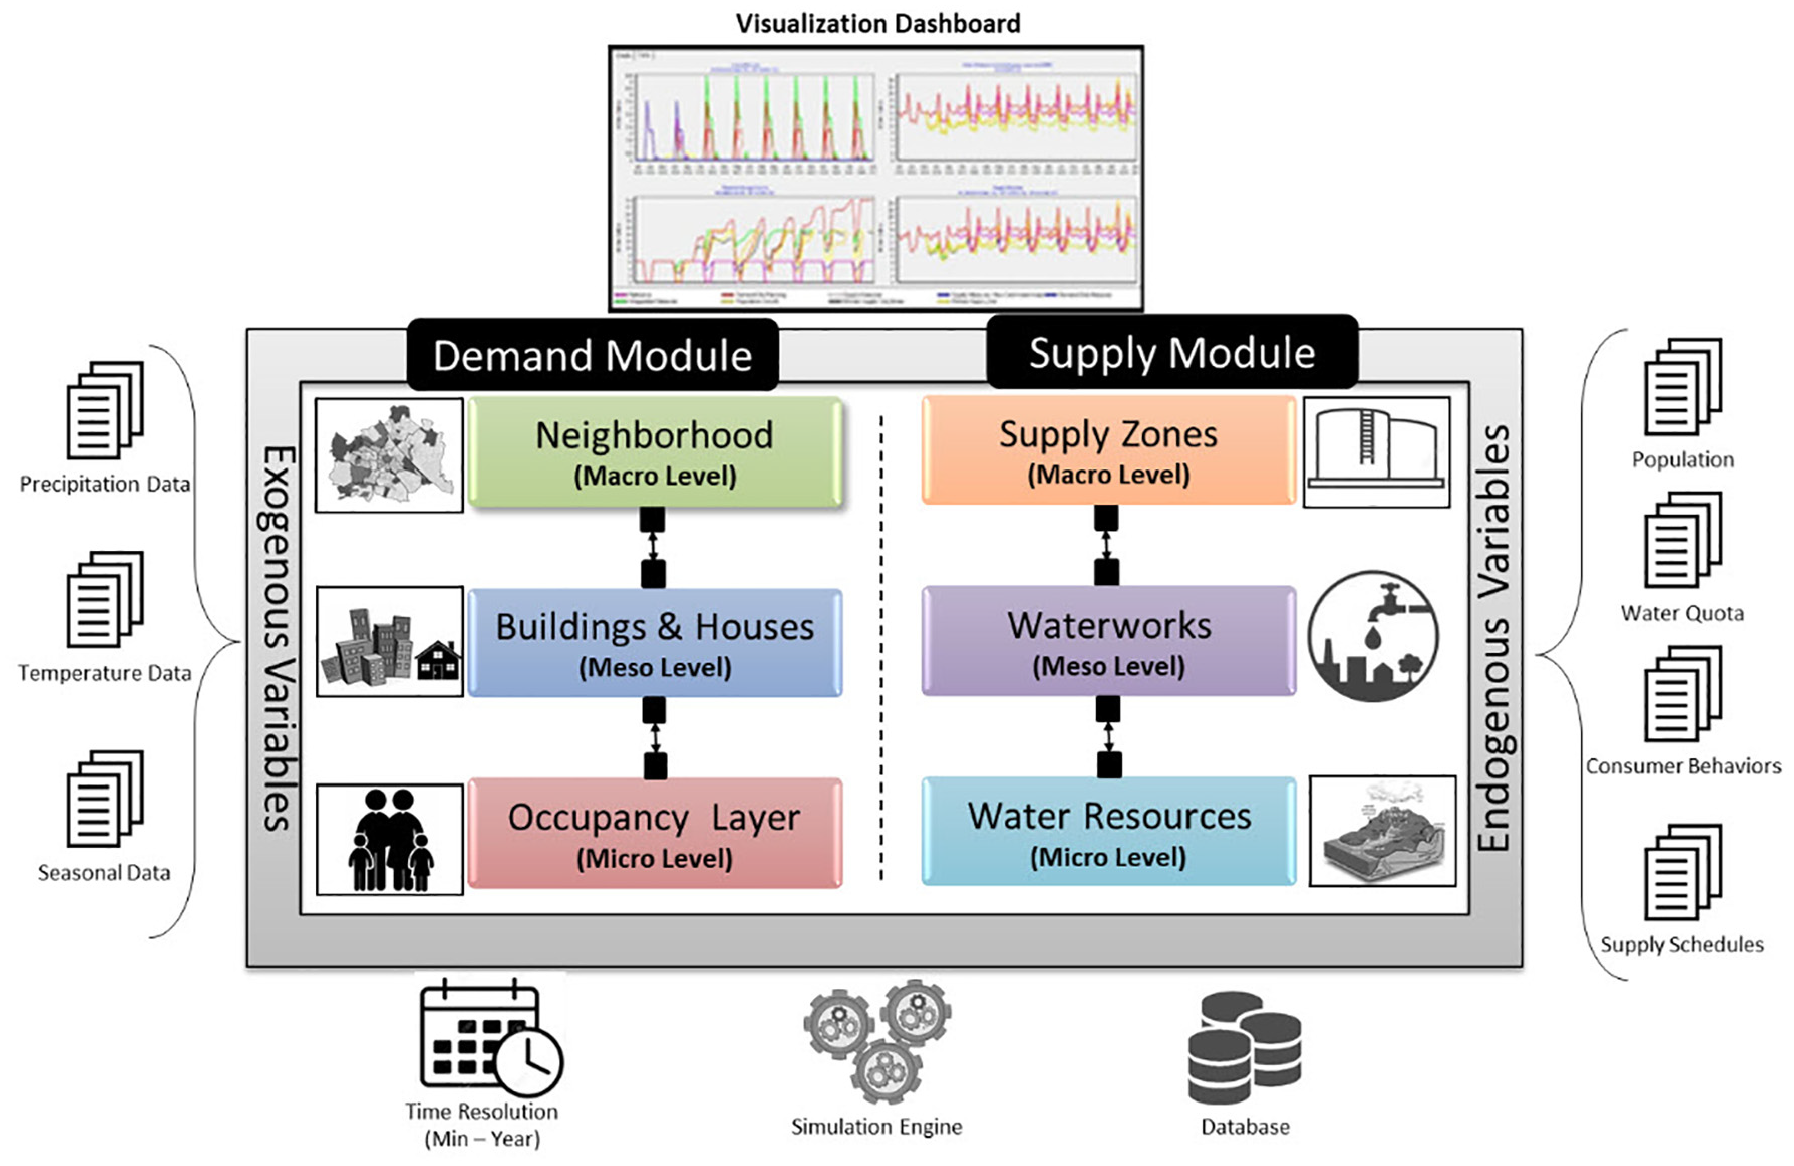
Urban water resource management framework.
The following sections provide details of each step in the proposed workflow, divided into three main phases:
3.1. Phase I: conceptual modeling
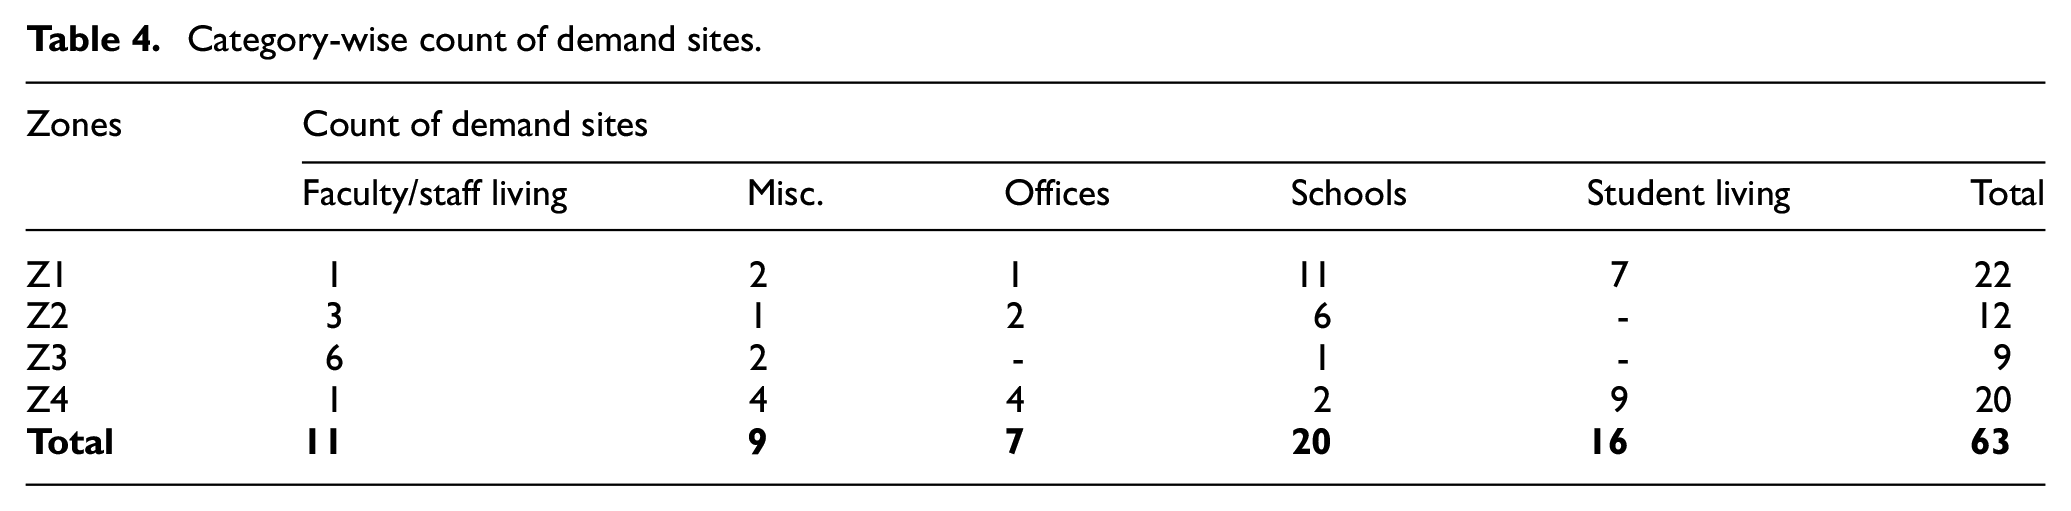
In modeling and simulation, a conceptual model is an abstract representation of a system, made of the composition of elements, entities, variables, concepts, assumptions, formulas, equations, functions, structures, and behavior, all represented in a formal way, to help understand, implement, and simulate a subject model. 42 In phase I, a conceptual model is constructed by the modeler, through steps 1–4. In step 1, the input data is gathered. For this step we use the NUST main campus as our study area and obtained data from the Project Management Office (PMO), NUST. It is located in Sector H-12, Islamabad, Pakistan, at 33°38′10.7′′N 72°59′27.5′′E. It covers an estimated area of 707 acres (2.86 km2). It roughly has a population of 15,000. It is composed of 63 buildings, 32% of which are schools, 43% are residential areas, and 25% are general purpose, each of which are divided into four geographical zones (see Table 4).
Category-wise count of demand sites.
This include the number of demand sites (categorized as schools, offices, miscellaneous, and residential houses), groundwater resources, and water quota. It was used to list the primary water resources, and to devise the water supply structure. The simplified schematic of our study area is shown in Figure 4. It shows the spatial zones, demand, and supply sites. The map shows 73 demand sites (63 current and 10 future sites), eight tube wells, and four reservoirs. NUST underground water resources cater only to the domestic demand, that is, water used for indoor household purposes: drinking, preparing food, washing clothes/dishes, bathing, etc. 43 The industrial demand is catered for using external or temporary sources (providing water for fabrication, processing, diluting, washing, cooling, incorporating water into a product, or the sanitation needs of a manufacturing facility). 43 The ecological demand, such as greenbelt showering, plantation, and sprinkling roads, 27 is fulfilled by NUST’s recycled water tankers using treated wastewater from the wastewater treatment plant, which has the capacity to produce 75,000 gallons of recycled water per day for NUST’s horticulture. 44 NUST is considerate of its environment and sets a trend to reuse water for its ecological needs. NUST uses groundwater resources to cater for its domestic demand, by means of water pumped from the aquifer using wells and stored in overhead/underground tanks, although due to a change in the water table some wells have become dry. The waterworks network supplies water to the different demand areas. This information was used to design the demand and supply network in step 2 and the flows between these sites in step 3.
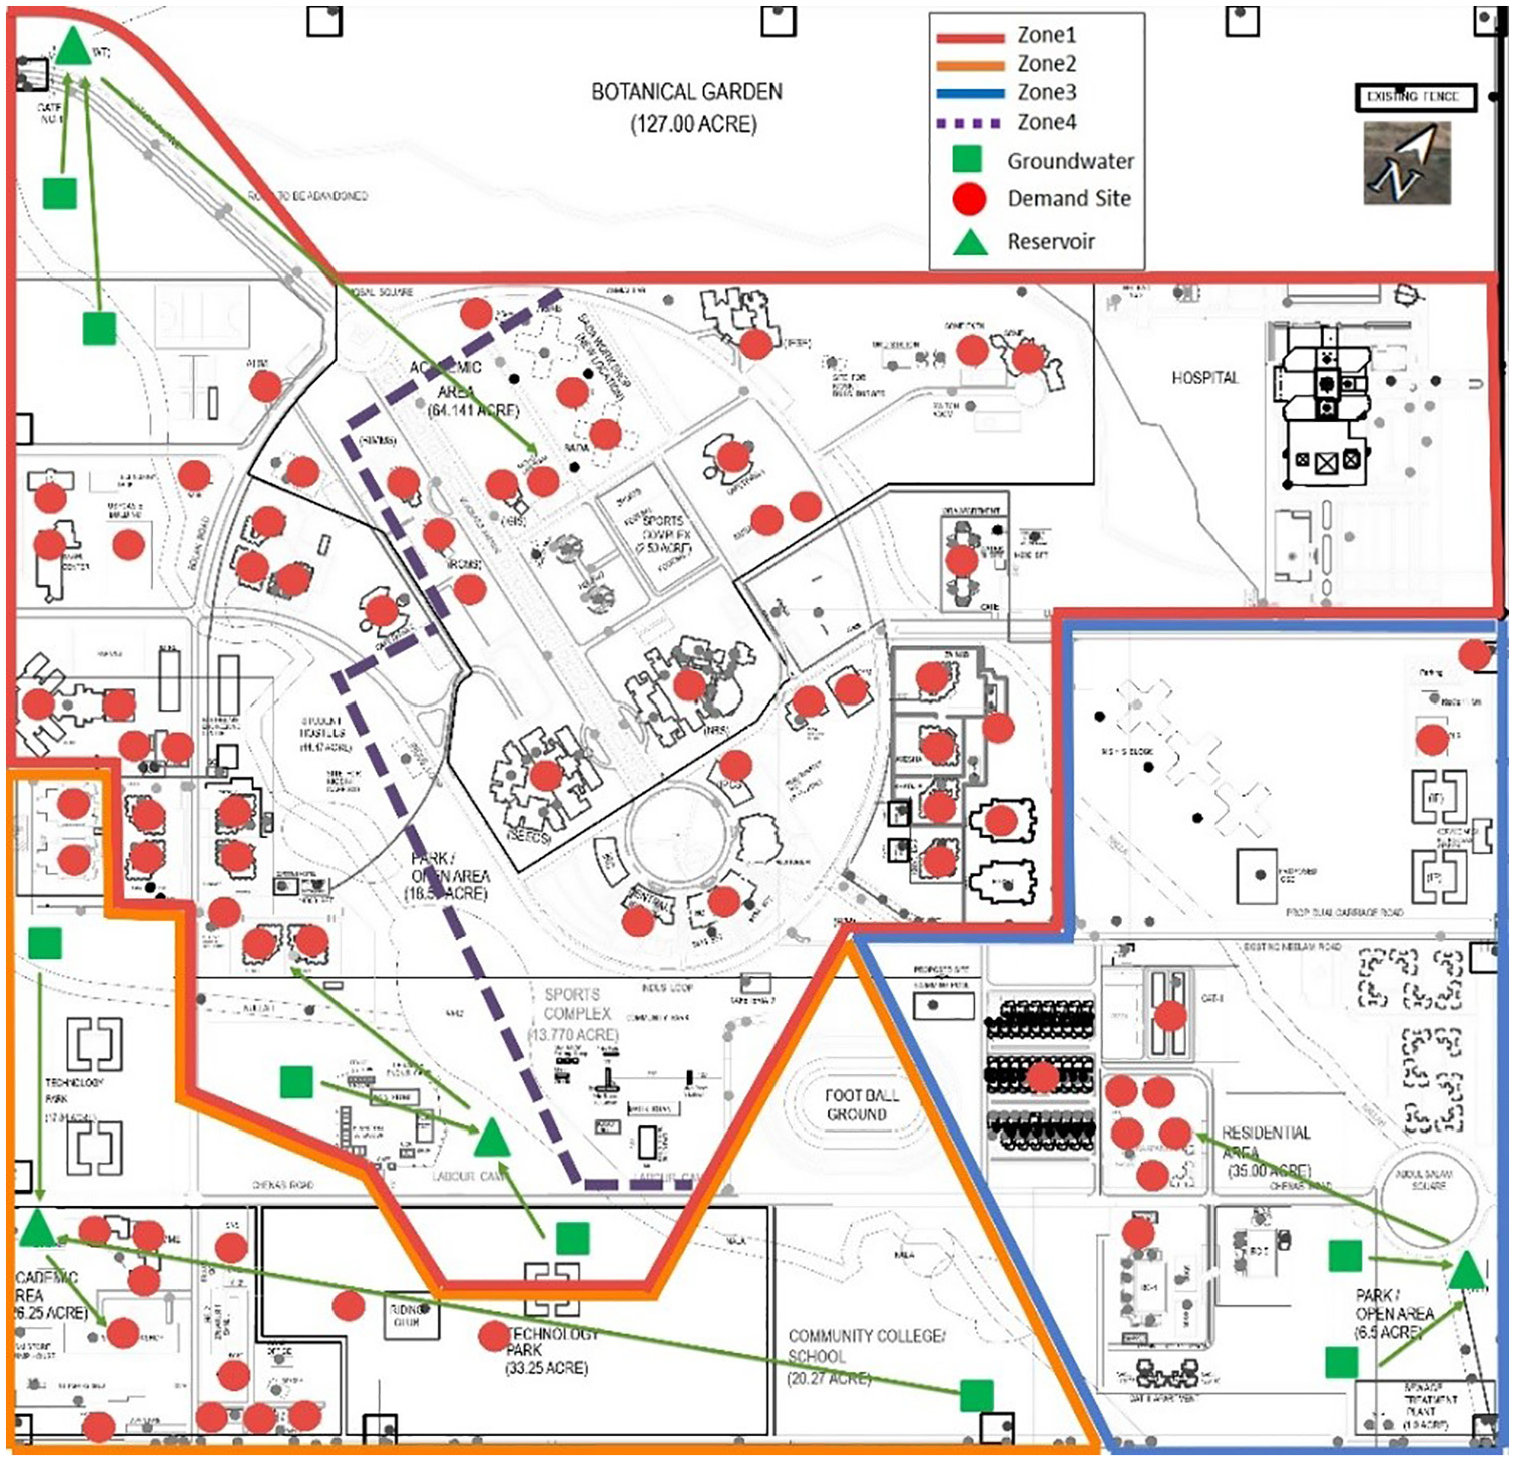
Map of our study area.
In step 4, the modeler defines the variables, entities, modeling elements, and equations.
3.1.1. Endogenous and exogenous variables
The endogenous variables are used to model the details corresponding to demand and supply sites, that is, population, permissible quotas, catchment area, and motor pump capacities of different underground reservoirs and tube wells. Weather and seasonal data are defined as the exogenous variables. The weather data is acquired from the Pakistan Metrological Department (PMD). 45 The analysis of this data shows that the majority of the years between 2010 and 2050 will be very hot and very dry (Figure 5). Therefore, conservation of water resources is of utmost important for sustainable use of water.
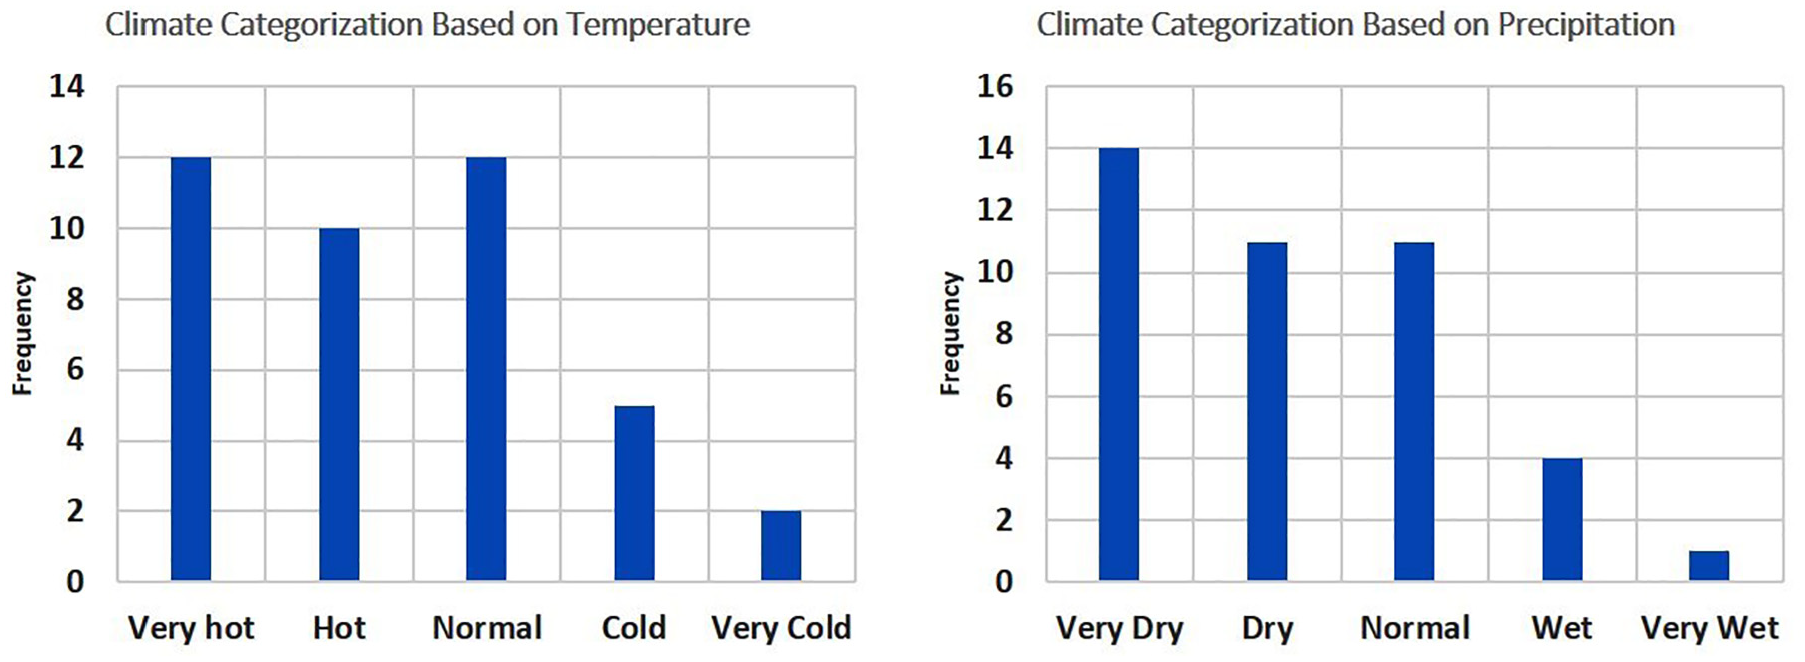
Histograms showing the climate of years 2010–2050. Data source: Pakistan Metrological Department. 45
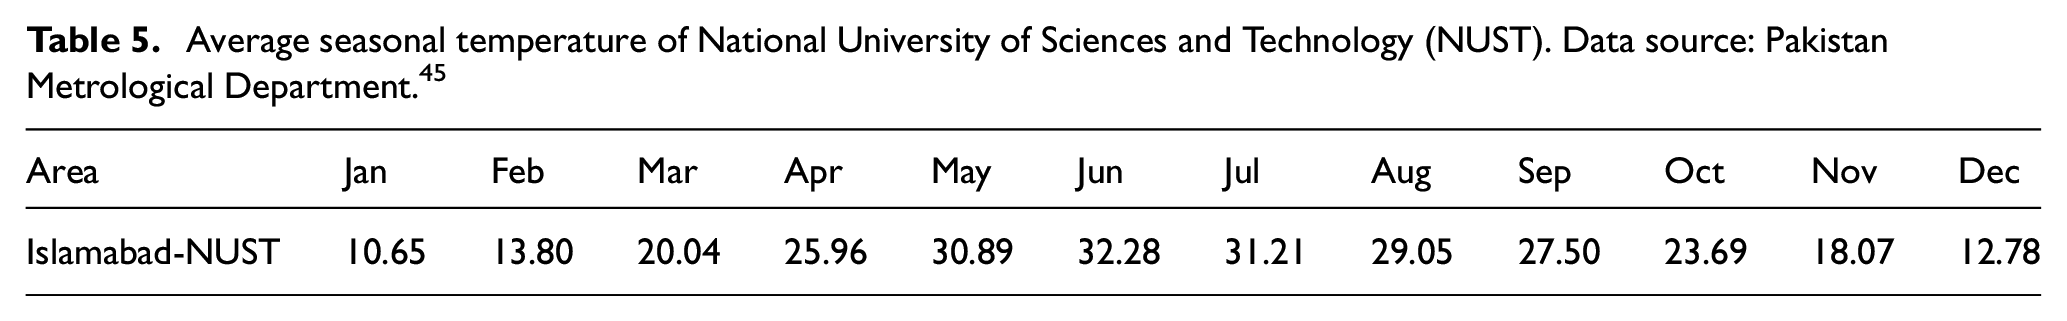
NUST inherits the climate of Islamabad that has a continental climate with hot summers, cold winters, and moderate spring and fall, with maximum temperature ranging from ‒4°C (January) to 46°C (June). 46 The average temperature (2018–2025) is shown in Table 5. The seasonal data is used in the framework to calculate the change in water demand due to the change in temperature.
Average seasonal temperature of National University of Sciences and Technology (NUST). Data source: Pakistan Metrological Department. 45
3.1.2. Entities and elements
The model is based on the three basic entities listed below.
(i) Demand sites: water consumers.
(ii) Supply sites: tube wells/groundwater; the primary water source.
(iii) Reservoirs: water storage tanks.
Based on this, demand categories are defined as follows.
Schools: NUST’s educational institutions.
Student living: hostels to facilitate on-campus student living.
Faculty/staff living: housing to facilitate on-campus faculty and staff living.
Offices: NUST’s management offices.
Miscellaneous: Mosques, parks, cafes, etc.
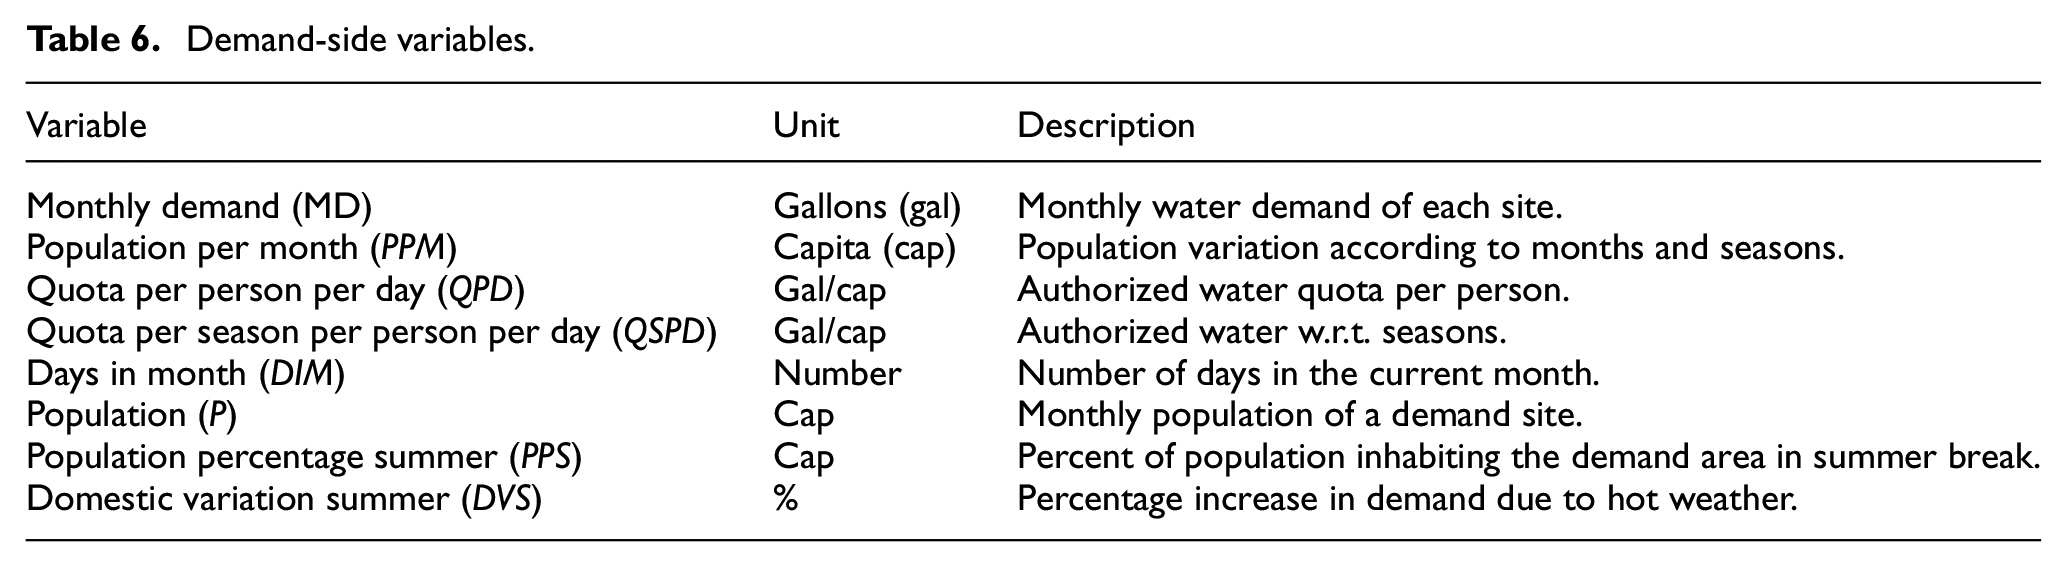
The consumption patterns differ for each category, for example, living would require more water as compared to schools, as living includes showers, laundry, and other daily routine activities. Modeling equations of demand sites are given below (Equations (2)–(4)). The variables and symbols used in these equations are described in Table 6.
Demand-side variables.
The domestic demand is given as follows:

where
Monthly demand is given as follows:

where population per month (PPM) is given as follows:

and quota per season per person per day (QSPD) is defined as follows:

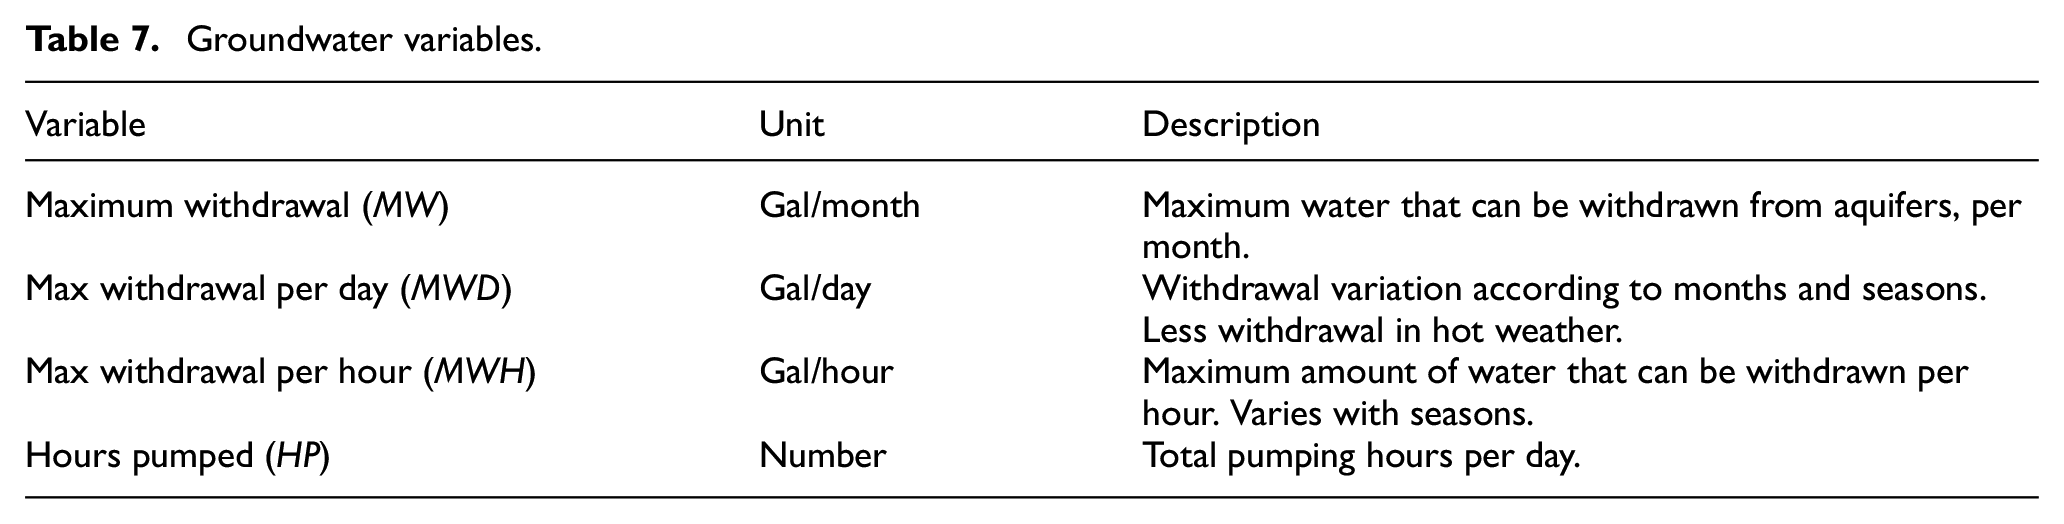
Tube wells are modeled as groundwater aquifers by specifying groundwater to surface water flows. In our model, each supply node can be linked to multiple demand sites. In the modeled scenario, each zone has two groundwater sources, which are linked to their respective reservoirs, that in turn supply the water to demand sites. Groundwater aquifers are modeled using Equation (5) and (6). The variables and symbols used in these equations are described in Table 7.
Groundwater variables.
The maximum withdrawal (MW) is given as follows:

where maximum withdrawal per day (MWD) is given as follows:

Total pumping hours are taken as constant =20, based on data collected from the PMO.
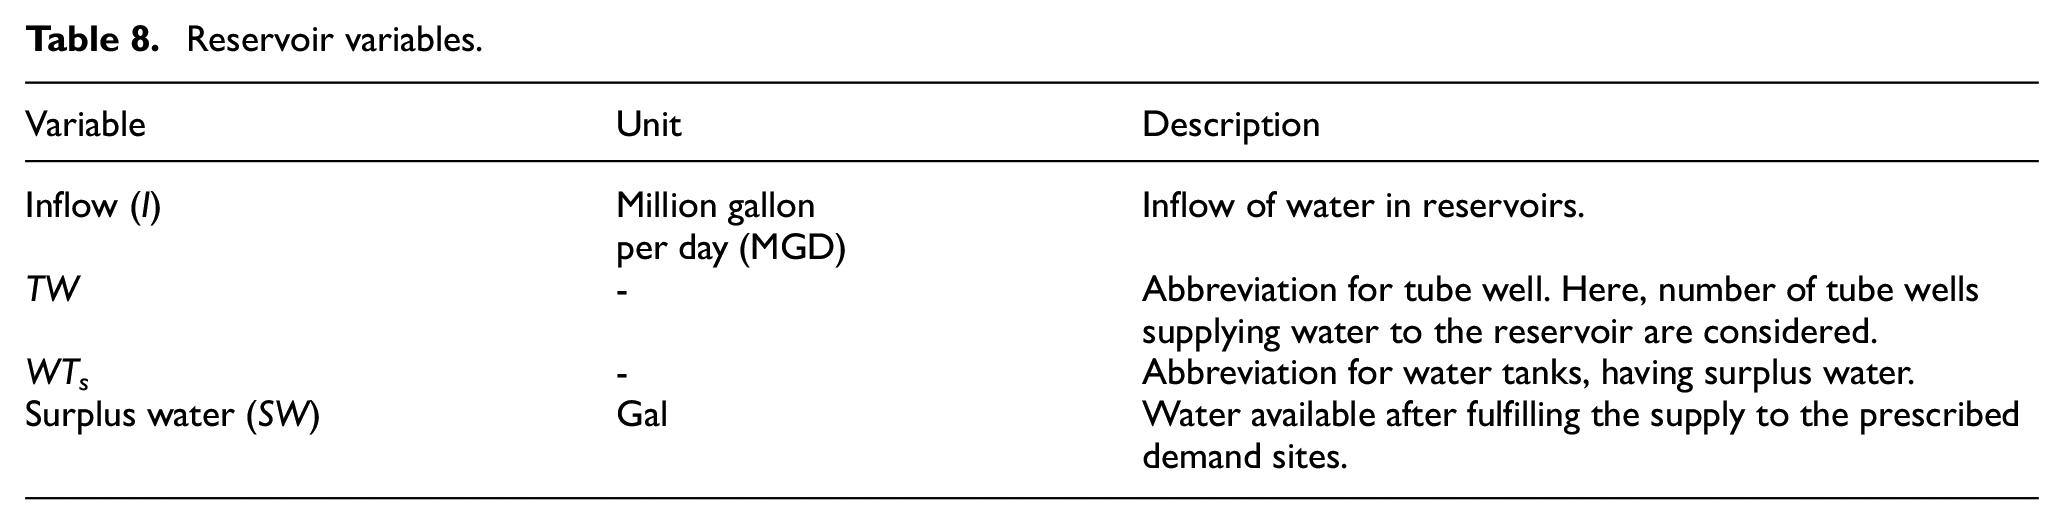
Reservoir: to model water tanks, local reservoirs are used. The inflow of a local reservoir depends upon the water withdrawn from the water aquifers. The inflow is modeled using the following equation, and Table 8 describes the reservoir variables:
Reservoir variables.
3.1.3. Key assumptions and model uncertainties
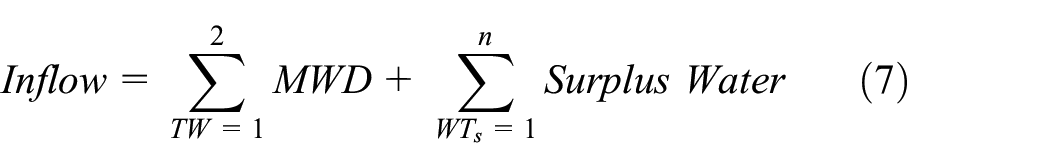
The campus population decreases during the summer break in general; however, unfortunately there is no exact measure of how much this drop happens in percentage, as no such data recording is made by the administration. However, to accommodate the important concept of population percentage summer (PPS) in our framework, we consulted with the administration and built a list of component-wise descriptions of the percentage drop in the population during the summers. This is solely based on the experience of the administration team. Table 9 reports the key assumptions made in this regard, and we used these assumptions to model the related variable, PPS, in Equation (3). It is of note that the assumptions do not impact the construction of the framework. They are user inputs and the framework can accommodate any user-specified input in this regard. With the development of further awareness, the administration is expected to keep a track of the exact population variation during the summer break and then they can further benefit from the proposed framework for efficient water management on the campus.
Key assumptions.
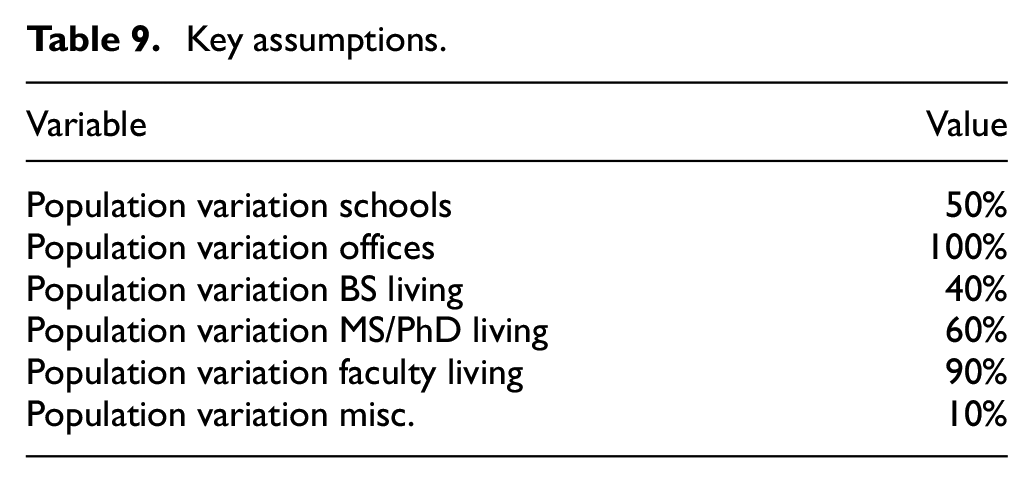
Another assumption is the domestic variation summers (DVS), which specifies the increase of water demand in hot weather due to the increased rate of consumption and usage. 47 Demand versus temperature shows the positive correlation between the water demand and temperature, as illustrated in Figure 6.
Water demand and temperature correlation. Data source: Pakistan Metrological Department. 45
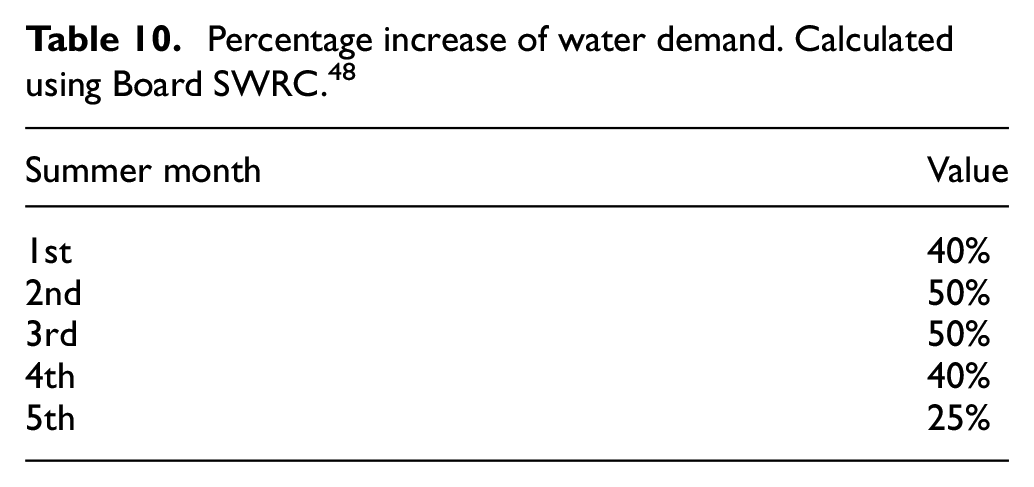
We used this correlation to calculate the percentage increase in water quota for the summer months as compared to the demand for the rest of the year. The percentage increase in demand (for summer) as compared to the average demand (for the rest of the year) is calculated using the following equation:

where PI corresponds to percentage increase while TCM,AVG and TROY,AVG correspond to the average temperature of the current month and the average temperature of the rest of the year, respectively. Based on the percentage increase in demand, the variable domestic variation summers is modeled as given in Table 10.
Percentage increase of water demand. Calculated using Board SWRC. 48
When all the steps in phase I are complete a conceptual model is formulated, as shown in Figure 2.
3.2. Phase II: scenario development, execution, and analysis
In phase II, different scenarios are designed by the framework users, through steps 5–7. In this phase the conceptual model is taken as input to define all the elements in the current accounts (see Sieber 33 for details on current accounts), using modeling equations and initializing them based on exogenous and endogenous variables, and key assumptions. The elements are then linked together using transmission links. Based on the current accounts, multiple scenarios are designed for future demand and supply. We used a set of “current accounts” to model details of demand and supply sites, where each site lies in a specific zone, has its own population (cap) and water quota (gal/cap/day), and is categorized based on the type of demand site. In addition, the supply site is dependent upon the maximum withdrawal of the tube wells, which decreases in summer due to the change in underground water levels. The wells become dry and the aquifer table lowers. The normal withdrawal values are modeled for months January–April and August–December. The dry values are modeled for the months May–July, as these months are the hottest in terms of temperature with low groundwater recharge.
3.2.1. Model uncertainties
Model uncertainty is uncertainty due to imperfections and idealizations made in the model formulations due to the lack of complete real-world data, as well as the choices of estimation methods or probability distributions for the representation of uncertainties. 49 The following quantities of interest present the uncertainties used in our model.
(i). Population percentage summer (PPS): estimated using expert opinion (NUST administration) of the percentage decrease in the population observed during the summer.
(ii). Population per month (PPM): estimated based on PPS to incorporate summer population variation.
(iii). Domestic variation summers (DVS): estimated based on correlation between temperature of the area and water demand.
(iv). Quota per season per person per day (QSPD): estimated based on DVS to incorporate summer water demand variation.
(v). Monthly demand (MD): estimated using PPM and QSPD.
(vi). Temperature and precipitation data: using PMD forecasted data.
(vii). Leakage (L), efficient flushing (EF), and efficient brush and shower (EBS): using water-saving statistics of non-profit international organizations.
3.2.2. Scenario design for future water demand and supply
The implementation of our proposed scenarios (as listed in Table 1) is discussed in the following sections.
3.2.2.1. Demand-side planning scenario
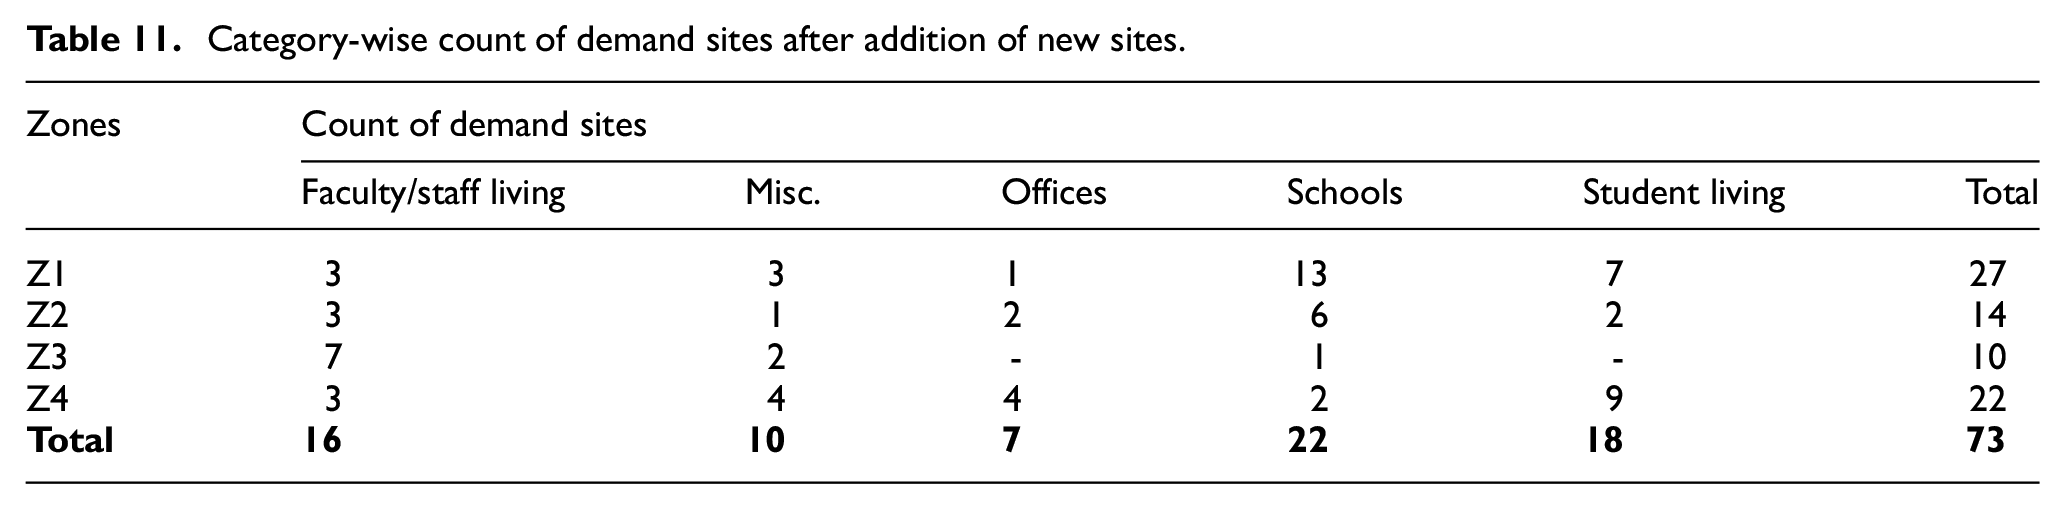
According to the PMO NUST, 10 new sites are under construction and will become the part of the system in coming years. Newly constructed buildings (see Table 11) will house new water consumers. Therefore, these buildings will become the new demand sites and will add to the current water demand of the system. To forecast the water demand and to evaluate the effect of inclusion of the new sites, a demand-side planning (DSP) scenario is developed. For the rest of the scenarios, the DSP scenario is taken as the reference as it depicts the forecasted demand for the coming years, compliant with the local policies.
Category-wise count of demand sites after addition of new sites.
3.2.2.2. Demand management strategy scenario
Demand management strategies (DMSs) are used to conserve water at demand sites by using technologically advance water outlets, efficient water systems, and promoting practices that can help save water and mitigate over-usage. The water-saving statistics are gathered from non-profit international organizations, such as The Waterwise Project, 50 Eartheasy, 51 and EdenProject, 52 working to save water by sustainable use. In Equations (9) and (10), the factors of leakage and efficient flushing, brushing, and showering are added to reduce the overall monthly demand of a site. These variables are described in Table 12.
Demand reduction due to demand management strategies.
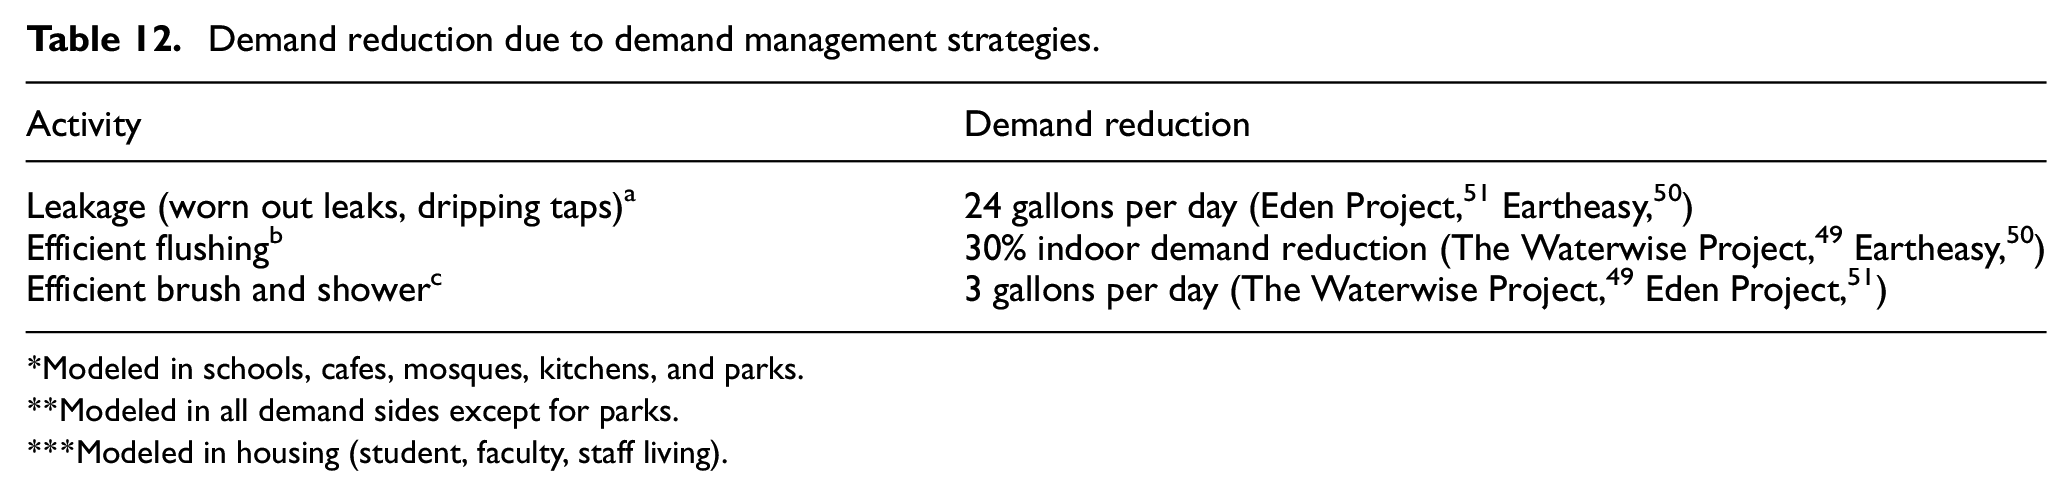
Modeled in schools, cafes, mosques, kitchens, and parks.
Modeled in all demand sides except for parks.
Modeled in housing (student, faculty, staff living).
Using Equation (2) as a reference, the demand-side savings are modeled using the following equation:

Here, MD corresponds to the monthly demand, subscript “s” is used to represent the monthly demand and quota per season per person per day in water-saving mode, and L is the leakage factor. The QSPDs is modeled using the following equation:

3.2.2.3. Supply measure scenario
This section discusses the use of renewable water resources to cater to the increased demand of future years. Alternative water resources for sustainable water include harvested rainwater, stormwater, reclaimed wastewater, and gray water. 53 Harvesting rainwater means storing rainwater from rooftops for later use. It is commonly categorized as non-drinking quality. It can be treated to make it safe for drinking. Rainwater harvesting is also beneficial to combat heavy rainfall problems by converting it into a supply resource. A rainwater harvesting system can be incorporated rather easily in a demand site. The underlying considerations include regular operations and maintenance, adequate tank size, a first flush diverter to reduce the amount of debris, components to prevent mosquito breeding, and weatherproofing. Reclaimed wastewater refers to the discharged water from buildings and is also categorized as non-potable. The harvested rainwater is less contaminated and may be used for washing dishes, clothes, bathing, and flushing, and can easily supply a whole demand site with potable water. 54 The supply measure (SM) proposes use of rainwater harvesting as an alternative domestic water resource. The basic components of rainwater harvesting include the following. 55
Catchment area: the water collection surface, which receives direct water from rainfall.
Conduit: pipes responsible for water transportation from the catchment area to the harvesting system.
Storage tanks/recharge facility: storage tanks are used to store harvested rainwater. The tanks can be overhead or underground. The recharge facility can be made along with water tanks to help with the faster recharge of groundwater.
Filtration: filters to keep debris out of the system and to remove pollutants.
Distribution system: to supply filtered water back to the demand site.
Underground storage facilities are preferred because they are less prone to contamination. They have no/little evaporation and take up no surface area above ground.
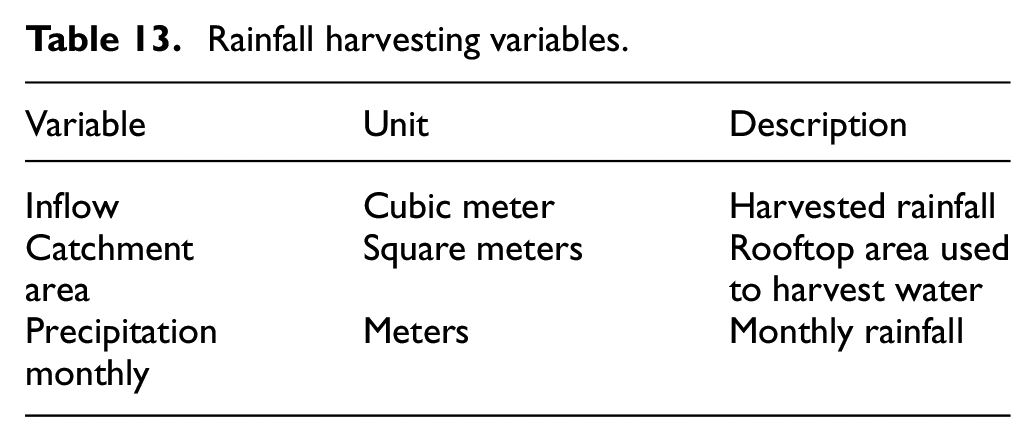
The inflow to the rainfall collector is modeled using the following equation:

Table 13 describes the inflow of harvested rainwater in cubic meters per month.
Rainfall harvesting variables.
Average monthly precipitation, based on PMD data, 45 is shown in Figure 7, where maximum precipitation is predicted for year 2025 and minimum for year 2021. For modeling the rainwater harvester, NUST’s rooftop area is approximated as 77,000 square meters. The storage capacity is selected as 9 million gallons, the size at which the current underground water tanks are constructed in NUST.
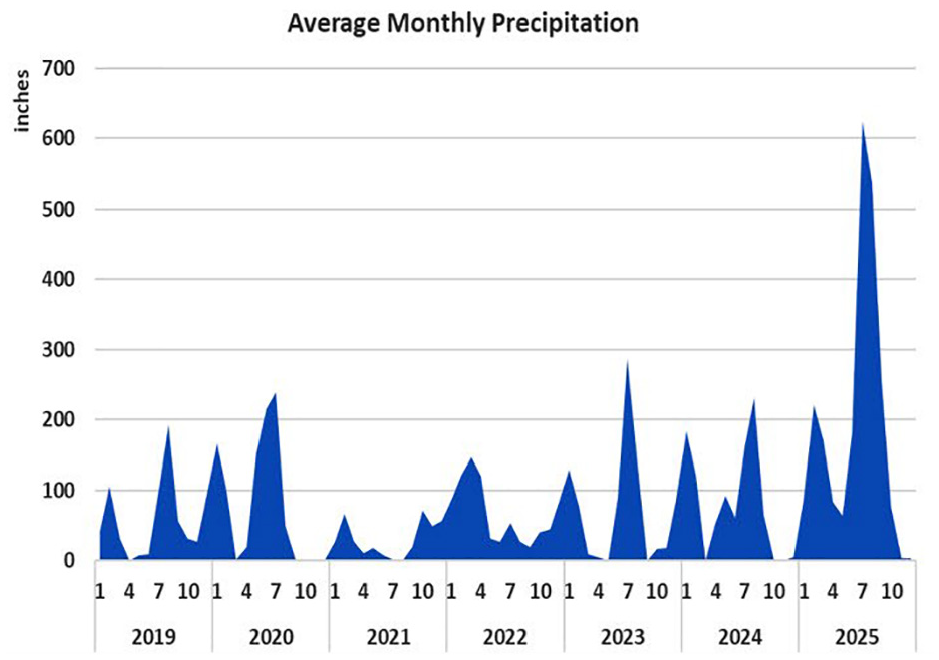
Average monthly precipitation. Data source: Pakistan Metrological Department. 45
3.2.2.4. Integrated measure scenario
In integrated measures (IMs), DMSs are modeled in parallel with the SMs to analyze the collective effect. With this integrated approach, supply resources will be increased by the induction of secondary supply resources (rainwater harvesting) in the system and water demand will decrease due to the inclusion of demand-side management strategies.
3.2.3. WEAP execution, visualization, and analysis
In order to proceed with step 8, the framework users take scenarios as input and execute the WEAP executable model. The WEAP framework solves the model using linear programming and updates the database with the output data of the demand and supply sites. In step 9 the execution results are visualized and analyzed.
3.3. Phase III: decision support
A DSS provides assistive support to the decision makers with output data analytics and suggests course of actions for effective planning. Stakeholders and industrialists rely on decision support in drafting policies where cognitive capabilities are strained. The same is the case with complex decisions involving urban water resource management. In step 10, the stakeholders gain descriptive and perspective views of the system, for making complex decisions, thus assisting in the sustainable urban water resource management.
4. Simulation results and discussion
This section discusses the simulation and visualization results and discussion for the basic water resource management system of NUST and the modeled scenarios of the water demand and supply system. The model was simulated on a Desktop Computer (Intel Core i5, 8th Generation processor 8 GB RAM), Windows 10 Educational Edition using WEAP (2019.1.0.0) Academic Edition, with approximately 12 seconds of execution time. Figure 8 illustrates the basic water resource management system of NUST, showing the monthly demand, supply, demand–supply gap, and the contributions of consumer types, within the three zones.
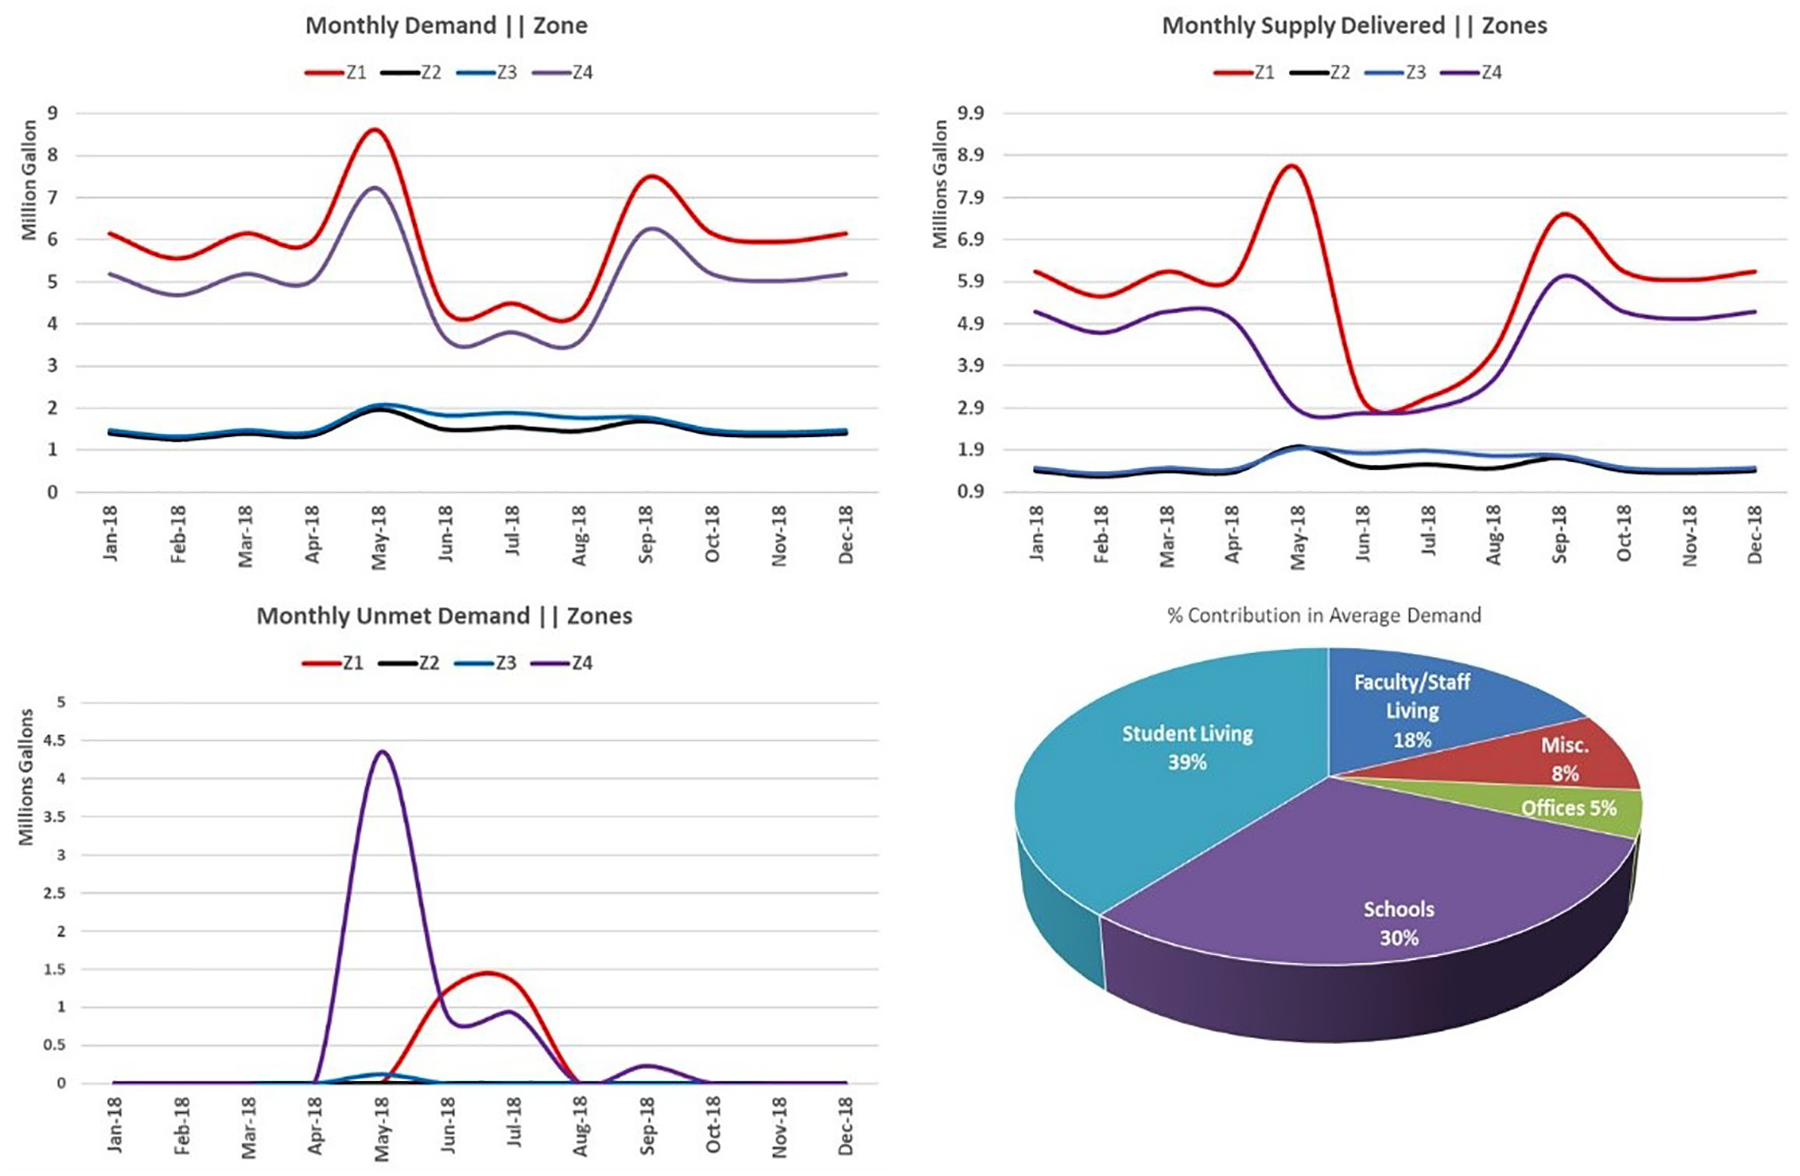
Monthly zone-wise water demand, supply, and category-based demand contributions.
Figure 8 shows that student living and schools are the major consumer blocks of water in the system. Student living is the biggest consumer of water for the analyzed area, while schools come second in terms of water usage, the reason being that more water is utilized in living areas due to activities such as showers/brushing/laundry. 56 Although water utilization (water quota) at schools is lower than that of living areas, schools are consuming more water as compared to faculty/staff living due to a greater number of demand sites. The faculty/staff living, offices, and misc. use less water compared to the other two categories. The increase in the water demand of all zones is observed in the month of May due to the rise in temperature. In June, July, and August, a dip in the water demand of Zones 1 and 4 is observed due to the summer break, as most of the sites in Zones 1 and 4 comprise of student living and schools. However, no such dip is observed in the demand of Zones 2 and 3, which comprise of offices and faculty living, mostly. Figure 9 shows the groundwater potential versus water demand for each zone. Zone 1 has more demand as compared to its potential groundwater. Therefore, surplus water from Zones 2–4 is supplied to Zone 1 in the months where surplus water is available, to cater for water demand of Zone 1. Except for Zone 2, the water potential, for each zone, is less than that of the required water in the summer months, due to which an unmet demand is observed in Figure 8.
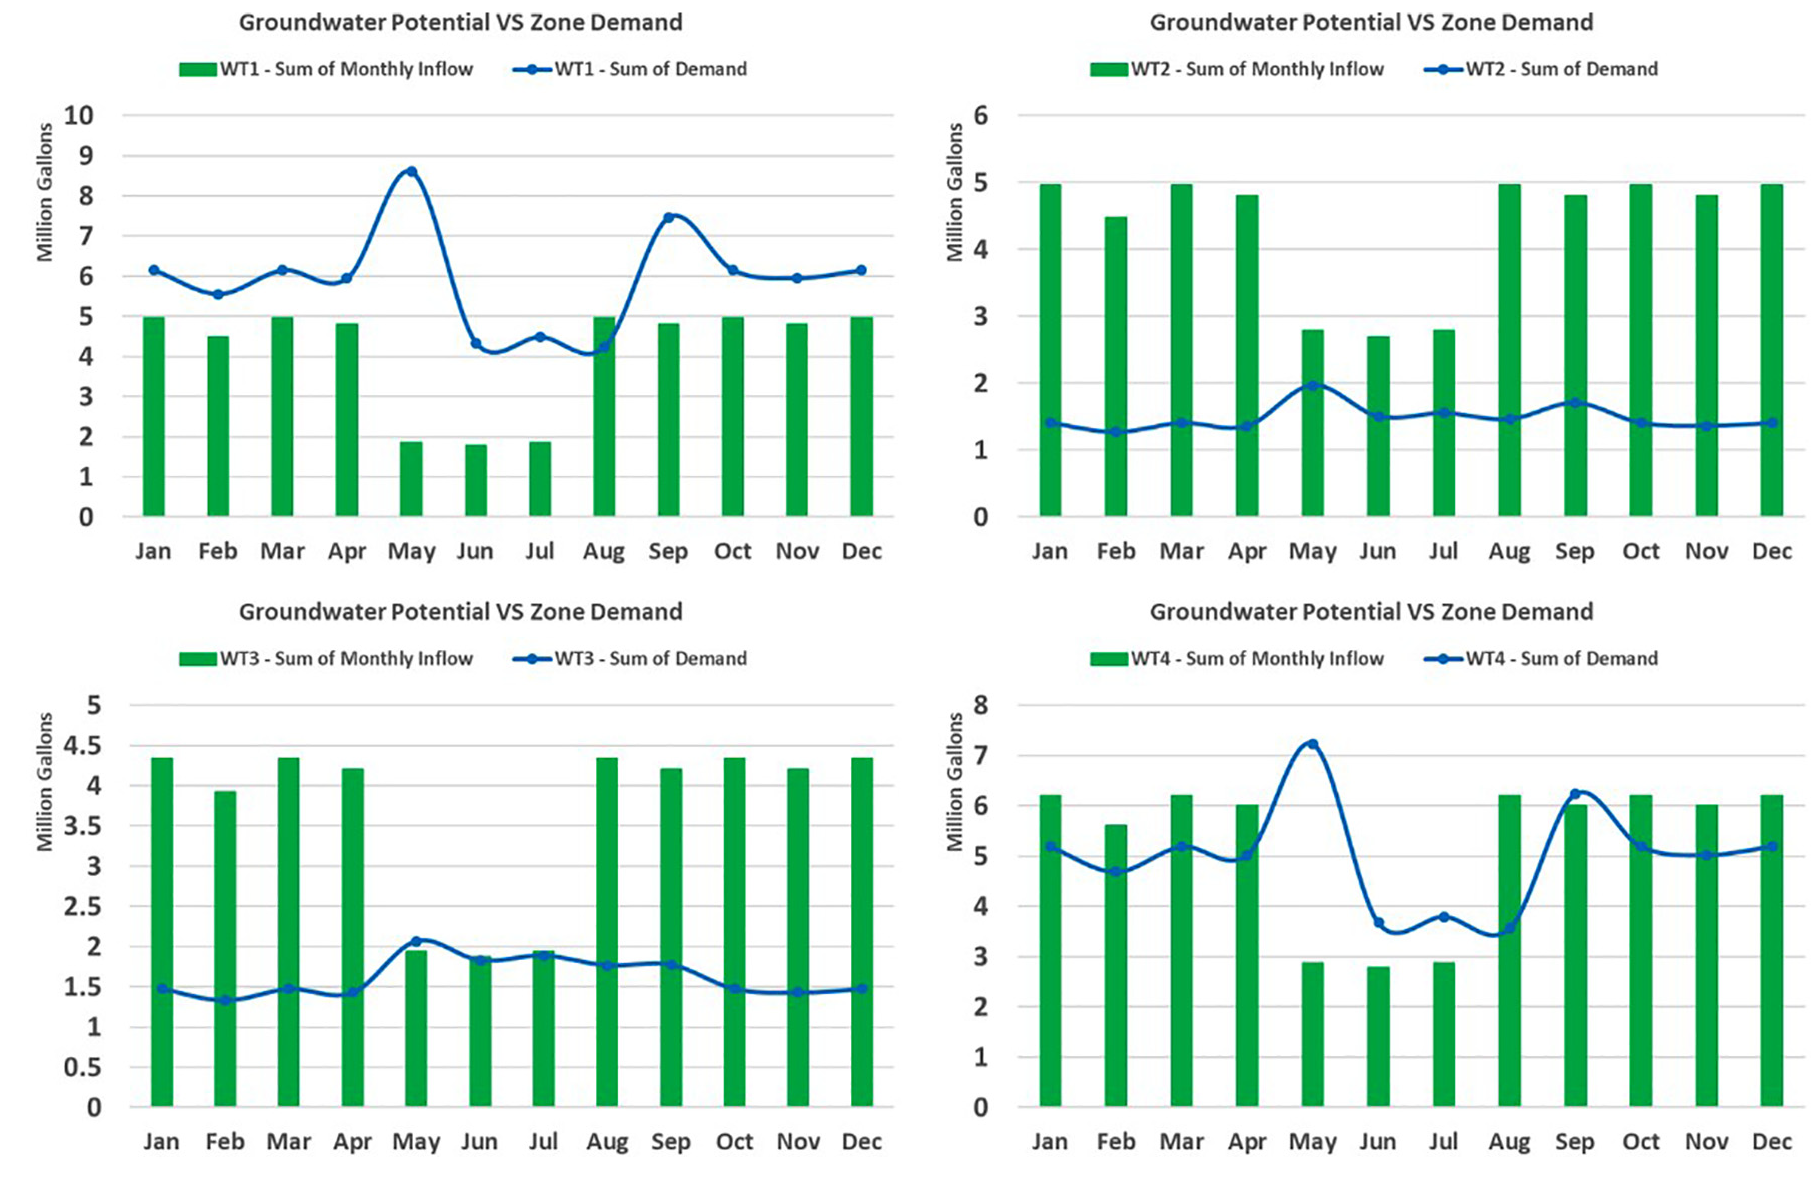
National University of Sciences and Technology zone-wise groundwater potential and water demand.
Figure 10 shows that the water demand is dependent upon the temperature and the population. Water demand increases with the increase in temperature, but in the summer months, the overall decrease in the demand is observed as the population decreases for NUST due to the summer break. Water wells become partially dry in the summer season, and the demand is increased due to the rise in temperature. Hence, the unmet demand is observed from May to June and then again in September. However, in August due to the monsoon season more water can be extracted after underground water recharge, and hence unmet demand is minimized. In September, although normal water extraction is done, the unmet demand is observed once again, due to the increased water quota in summer and maximum population being present on the premises.
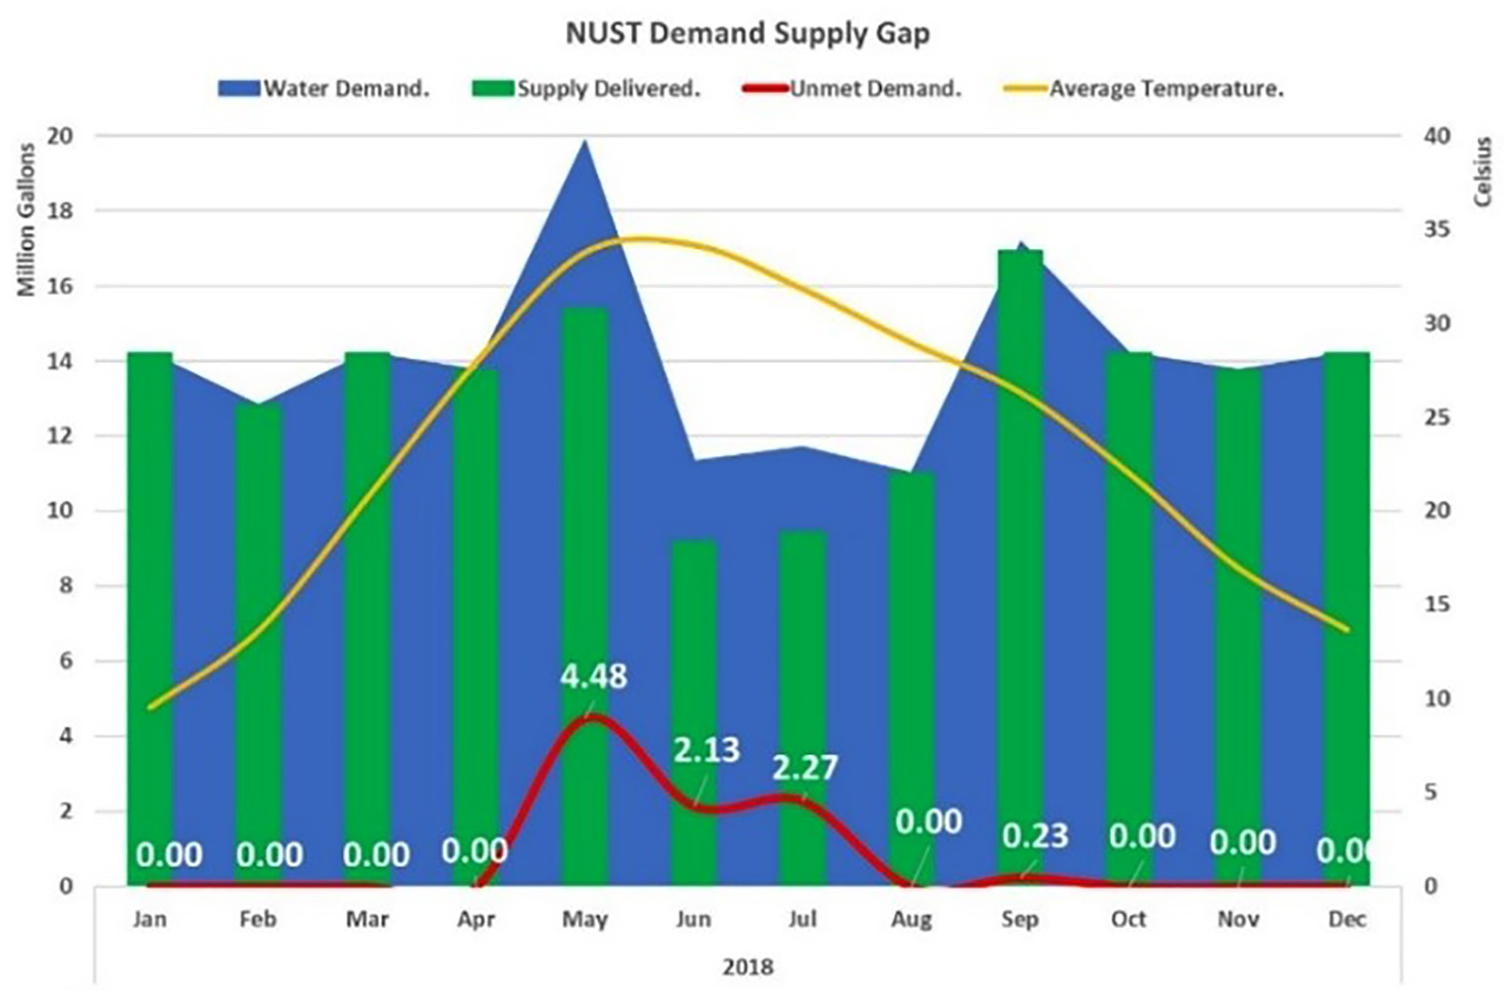
National University of Sciences and Technology (NUST) overall demand and supply gap.
4.1.1. Demand site planning scenario
New demand sites are added in the system as per the future construction plan. The effect of these additional demand sites on the system is shown in Figure 11. As shown in Figure 11, the water demand increases in year 2020, where most of the new demand sites are added to the system. The peak demand, observed in May, increases from 19.89 to 22.69 million gallons, with an observed increase of 2.8 million gallons. This increases the unmet demand of the system, which rises from 4.48 to 6.42 million gallons, that is, a 1.94 million gallon increase in unmet demand.
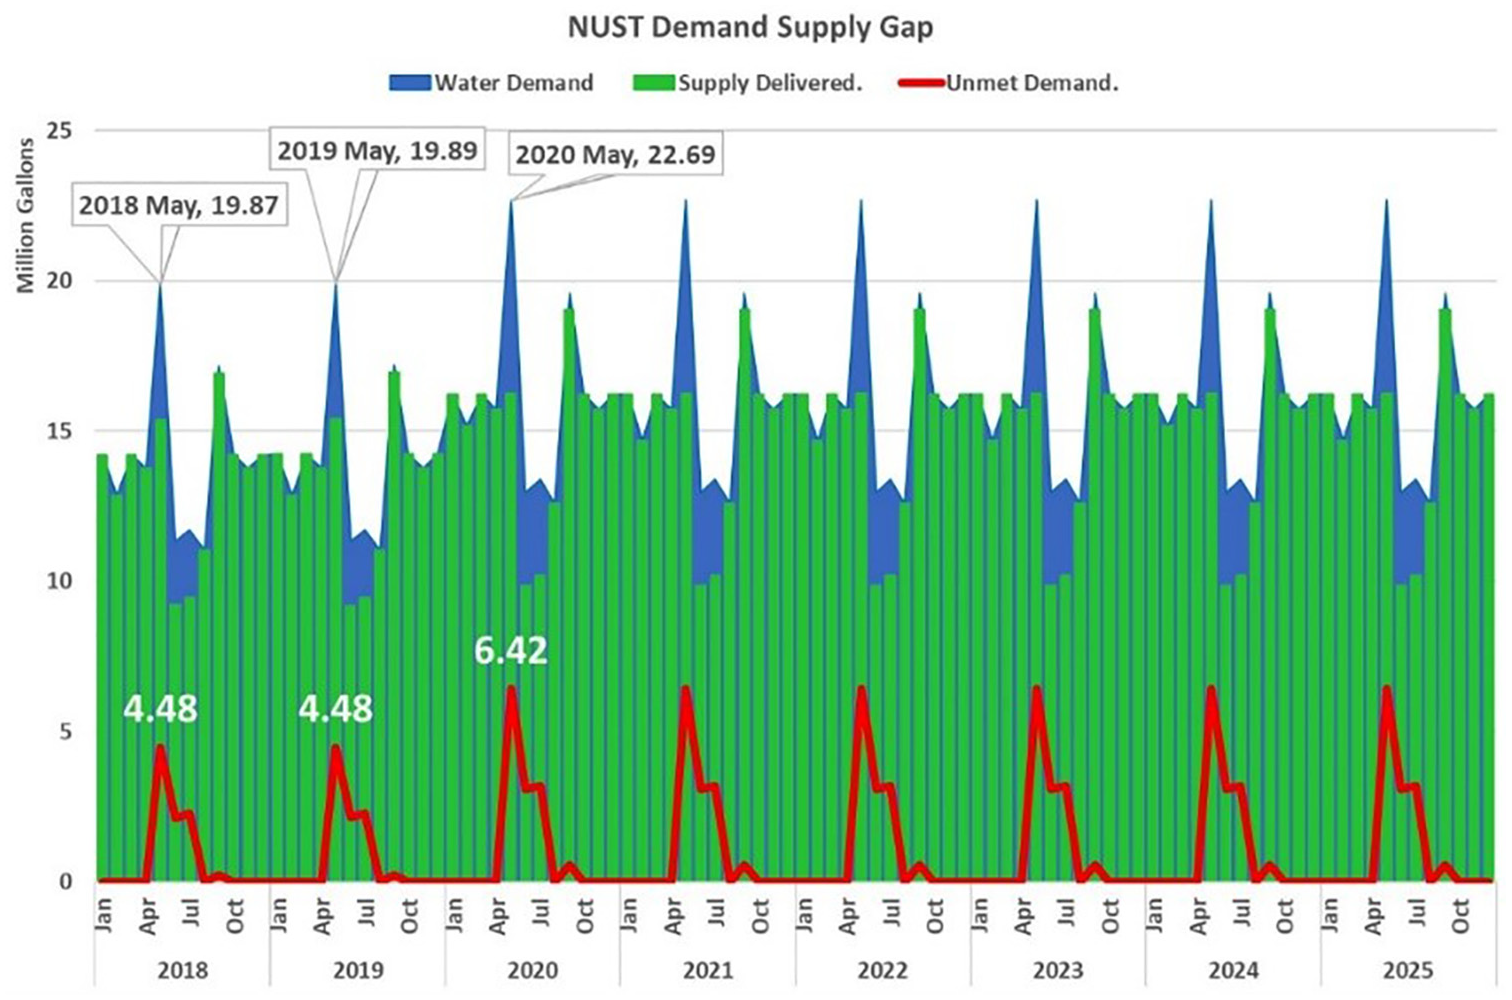
National University of Sciences and Technology (NUST) demand and supply gap for the demand site planning scenario.
4.1.2. Demand management strategy scenario
This scenario is based on the DSP scenario with DMSs introduced in the system, to cater for the unmet demand. The effect of these strategies on the system is shown in Figure 12. The water demand is significantly reduced with the reduced unmet demand due to the conscious use of water and efficient water outlets.
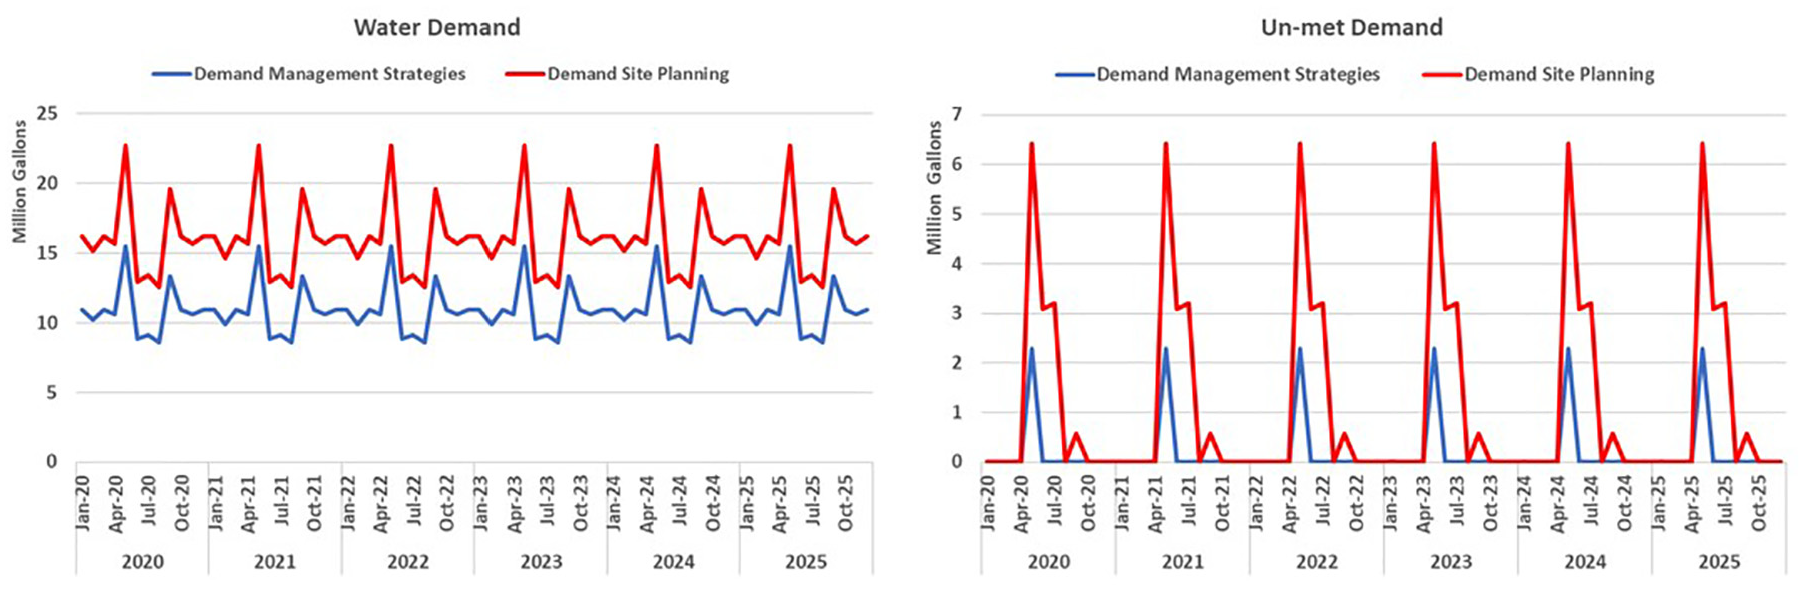
Water demand and unmet demand under the demand management strategy scenario.
4.1.3. Supply measure scenario
The SM scenario is also based on the DSP scenario, with SMs such as harvesting rainwater adopted in the system, to cater to the unmet demand and for sustainable water use. The effect SMs is shown in Figures 13 and 14. Figure 13 shows no effect on the water demand of the SM scenario as compared to the DSP scenario, but a significant decrease is observed in the unmet demand as compared to the DSP and DMS scenarios. The supply delivered and the reservoir storage volume, as shown in Figure 14, increase in this scenario because of the harvested rainwater. Therefore, the unmet demand is significantly reduced. However, in this scenario, the unmet demand is still observed in years 2021 and 2022, as rainwater harvesting is introduced to the system in year 2020 and not enough water is harvested in the two years to cater for the unmet demand in 2021 and 2022. Also, it is observed from Figure 7 that the year 2021 is a dry year. Over this time period, more rainwater is harvested as compared to the required demand, due to which the reservoir volume never drops to zero and it starts capping at 15 million gallons.
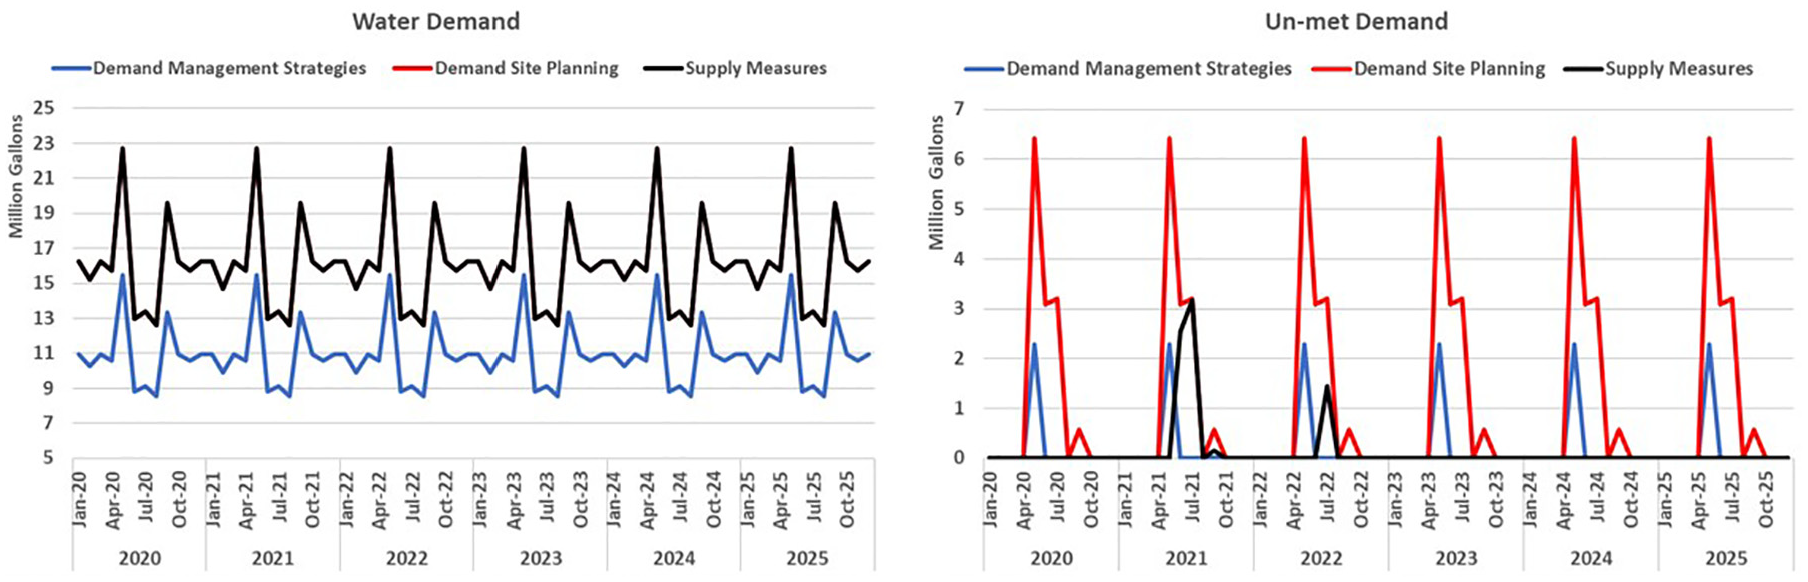
Water demand and unmet demand under the supply measure scenario.
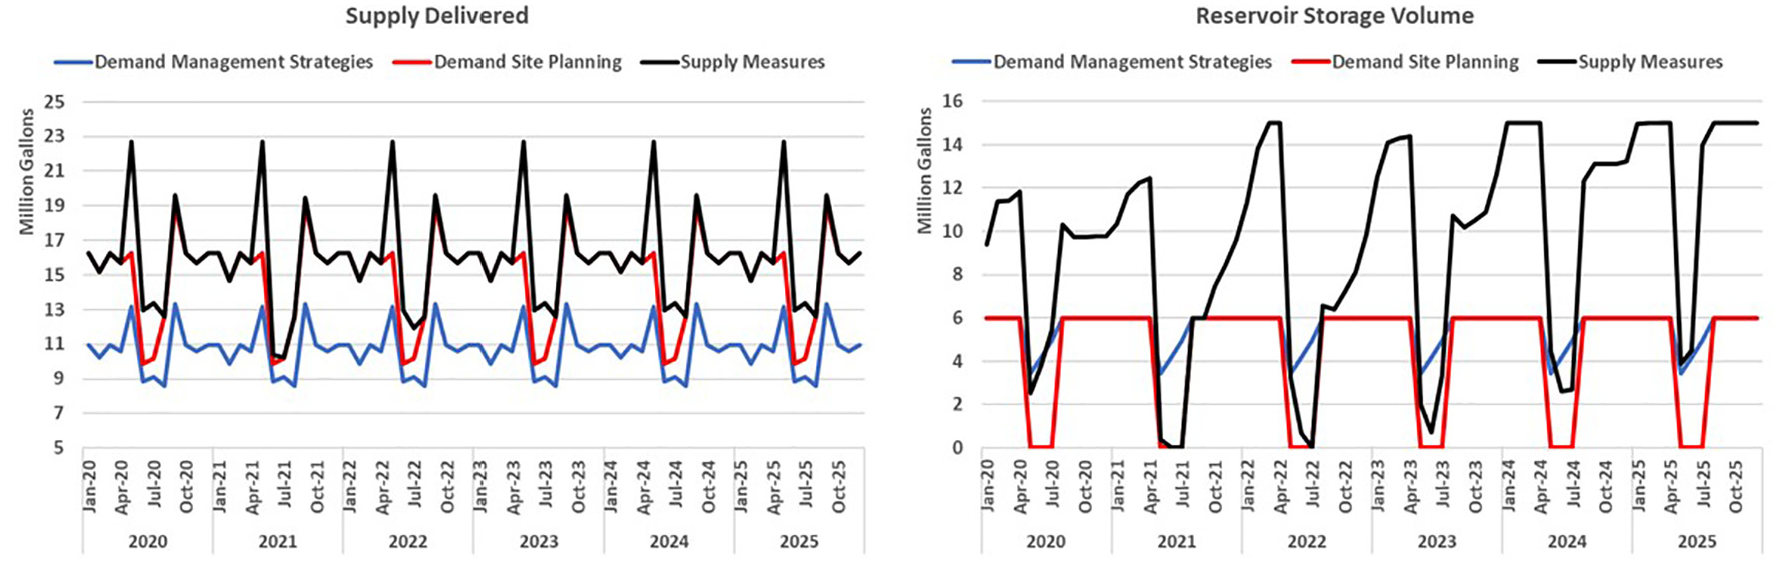
Supply delivered and reservoir storage volume in the supply measure scenario.
4.1.4. Integrated measure scenario
The DMS and SM scenarios have proven abounding for sustainable water supply and demand system. The IMs combine both DMS and SM. The results are shown in Figure 15. In the IM scenario, the water demand is reduced, as is seen in the DMS scenario. An increase in the reservoir storage volume is observed, due to the rainwater harvesting and reduced demand, and hence no unmet demand is observed in this scenario. Using the IM scenario, the primary supply can be reduced to an overall 35%. This will save a great amount of underground water resources.
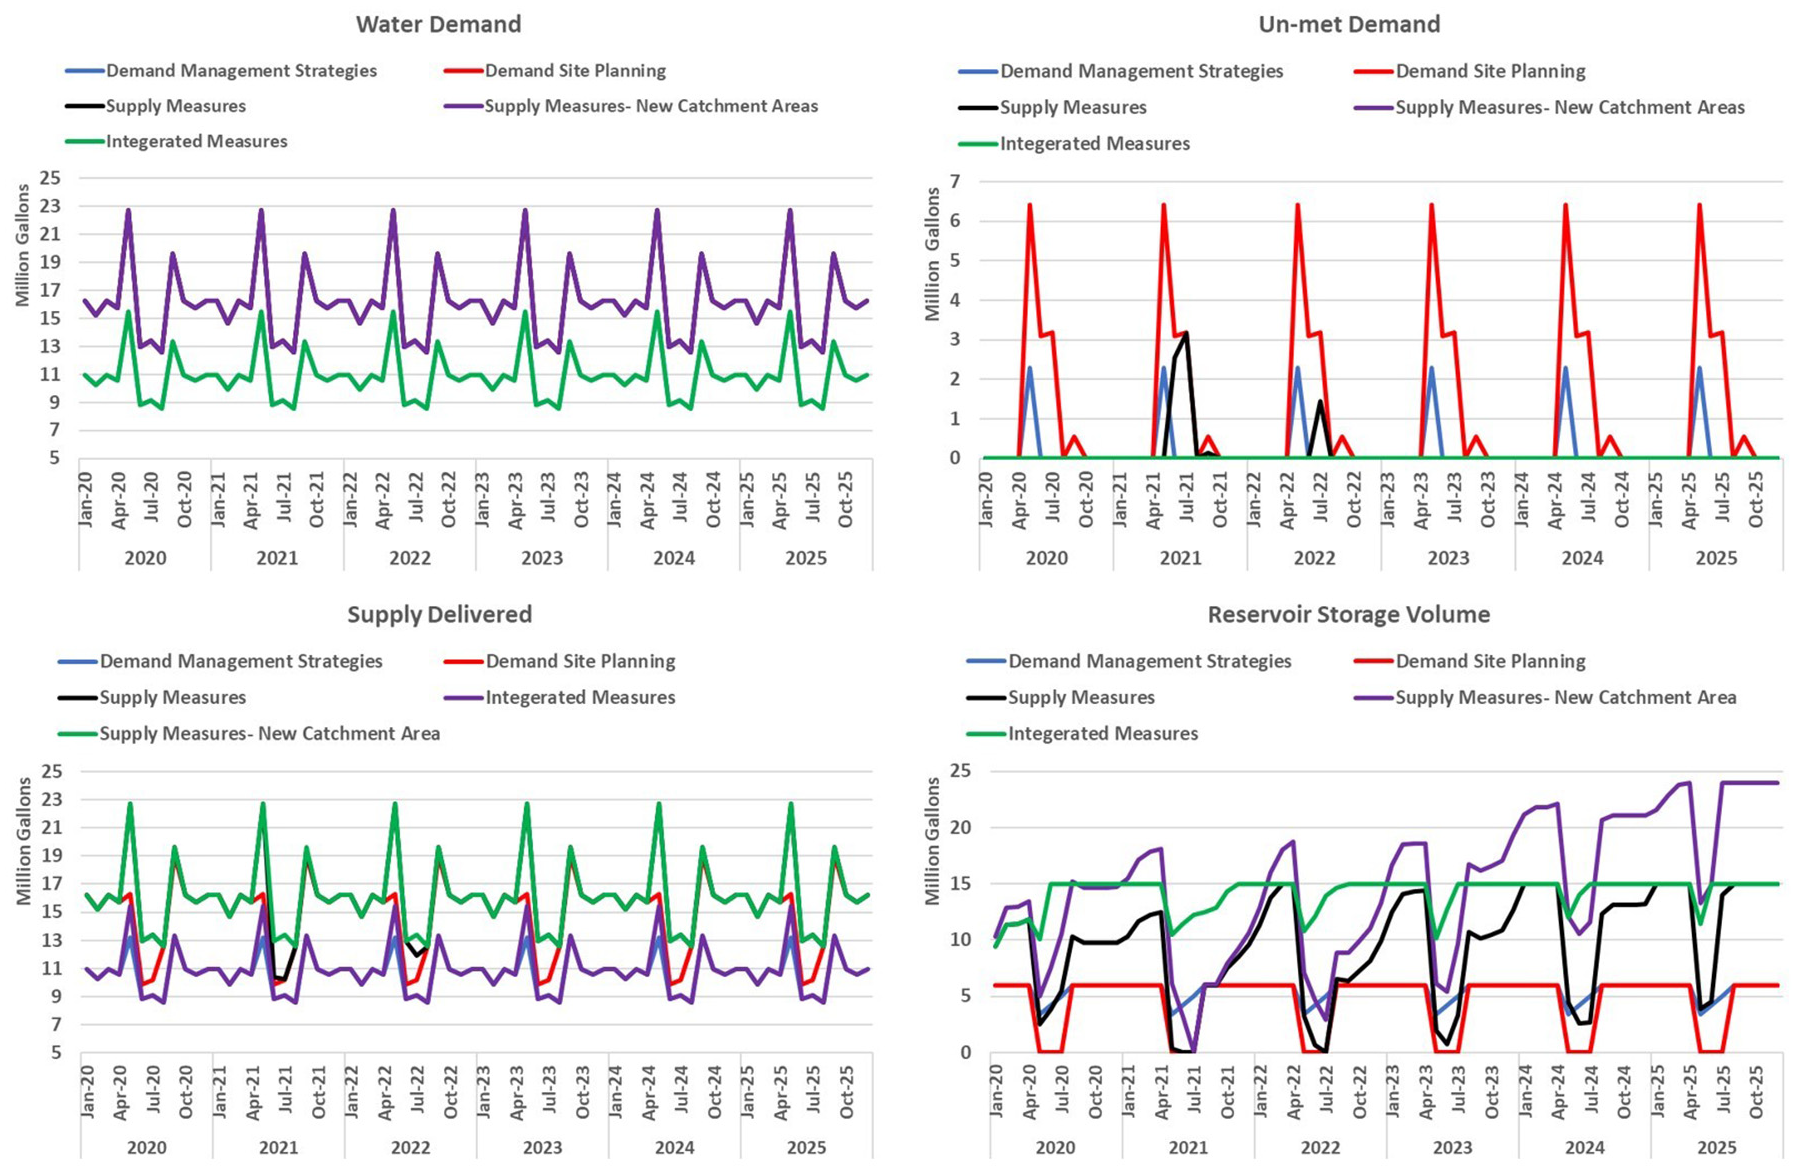
Simulation results for the integrated measures scenario.
4.2. Model verification and validation
Model verification is done by the domain experts, using the “inspection testing” method. Experts from the PMO verified the data, model, simulation, and results by inspecting and comparing them with expert knowledge and the real system. The model and results were verified using cause–effect graphing to evaluate the correctness of the model. Cause–effect graphing was performed by identifying causes and effects in the model and checking if they are reflected accurately in the specification. Sensitivity analysis was done by changing the values of model input variables and parameters to observe the effect on model behavior. This helped in identifying the unexpected effects and errors, which were removed to tune the model.
Model validation is done by comparing the actual water consumption and supply trends of the Defense Housing Authority (DHA), Islamabad/Rawalpindi (ISB/RWP), with the trends of the considered study area, that is, NUST. Due to the lack of proper water metering system in NUST, data for validation were acquired from the DHA as it is demographically and sociologically similar to the study area. The DHA is a public benefit corporation, providing housing and municipal services in different areas of Pakistan. Data of 5157 houses were acquired from the DHA ISB/RWP to validate the study. The per-capita water demand comparison is shown in Figure 16, while per-house water demand is shown in Figure 17. Validation is carried out for 2018, the baseline year. The curves are nearly aligned because of the sociological behavior of the two compared areas, as both NUST and the DHA share the same urban anthropology and sociology, with a high literacy rate and the same sentience toward environment conservation and similar consciousness for the use of water consumption. The per-house water demand is shown in Figure 17.
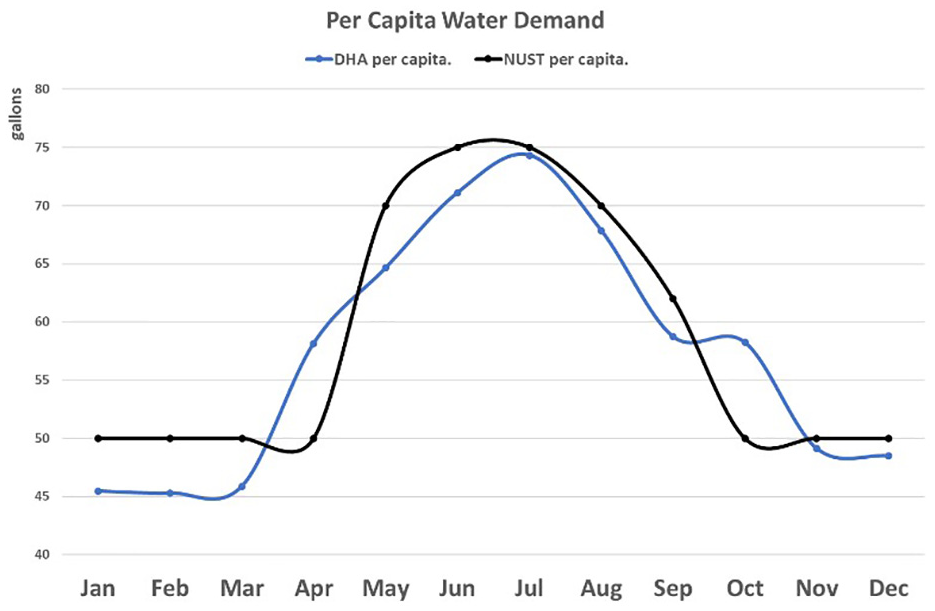
Per-capita water demand comparison. DHA: Defense Housing Authority; NUST: National University of Sciences and Technology.
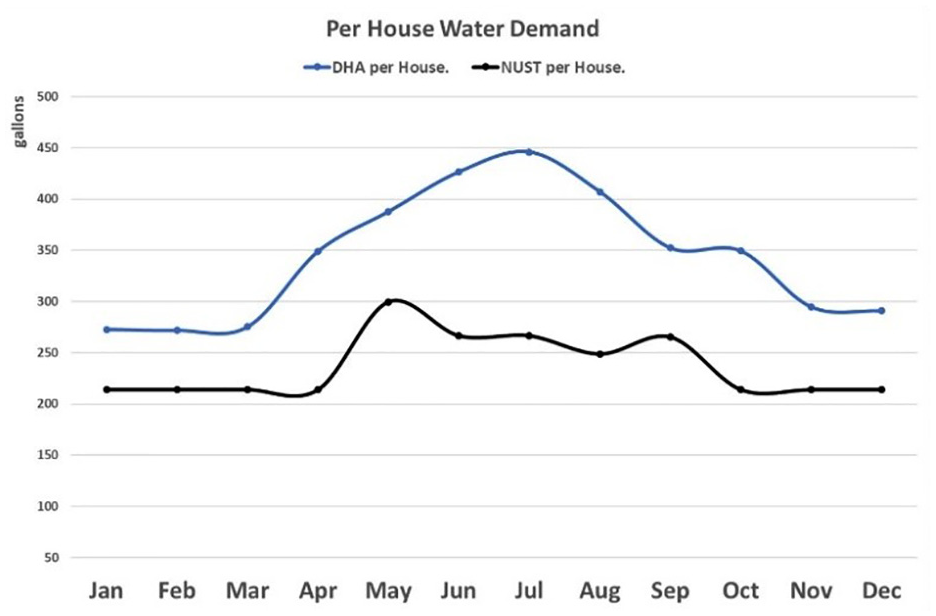
Per-house water demand comparison. DHA: Defense Housing Authority; NUST: National University of Sciences and Technology.
The quantitative statistics for model analysis, done using Equations (12)–(14), are summarized in Table 14:
Quantitative statistics for model validation.
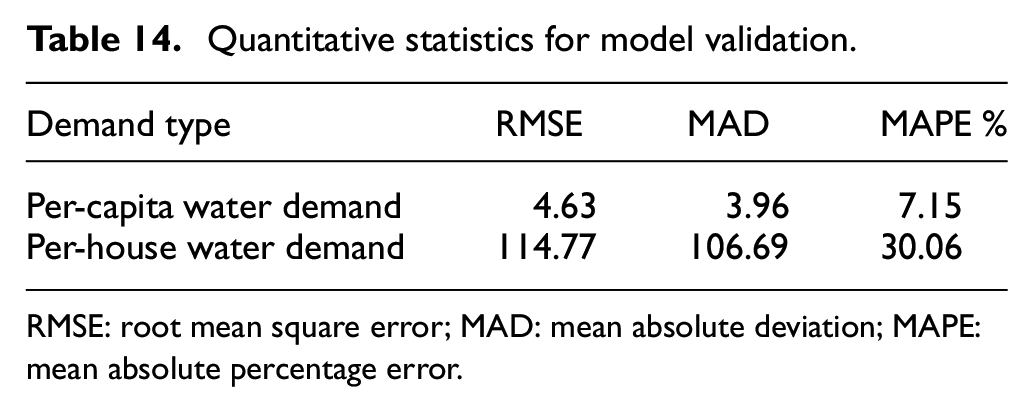
RMSE: root mean square error; MAD: mean absolute deviation; MAPE: mean absolute percentage error.
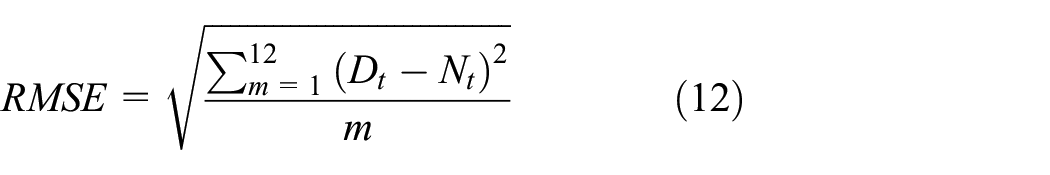


Here, m is the total number of observations, that is, total months,
A difference between the two curves can be seen due to the fact NUST occupancy averages between four and five people, while DHA occupancy averages between five and six people. However, the trend is similar except for the summer months (June–August), where demand is lesser in NUST because of the 10% decrease in the NUST housing population during the summer break. The supply delivered is shown in Table 15. As discussed, the DHA has five to six people living per household, while NUST has four to five, due to which a difference in supply delivered is observed. The per-capita supply range is calculated based on the population range per house for NUST and the DHA.
Comparison of supply delivered in the National University of Sciences and Technology (NUST) and Defense Housing Authority (DHA) (base year).
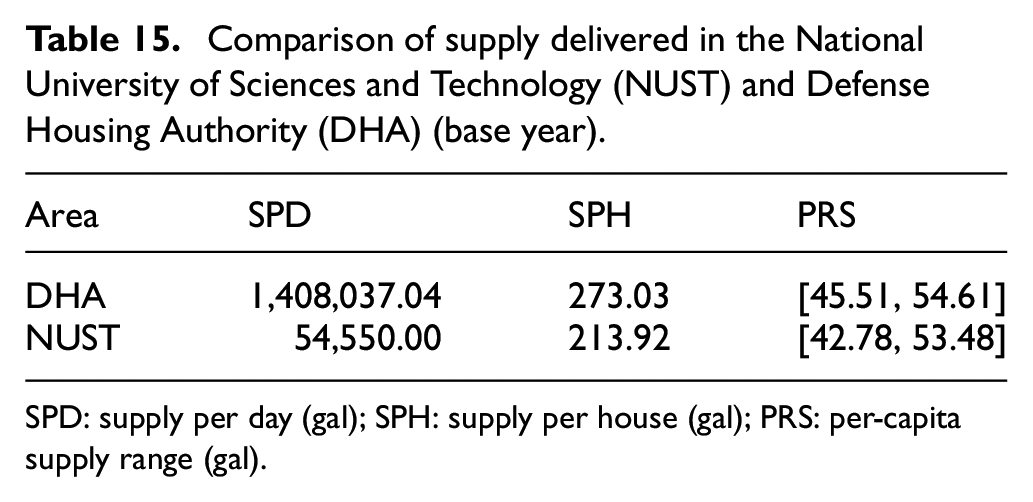
SPD: supply per day (gal); SPH: supply per house (gal); PRS: per-capita supply range (gal).
4.3. Discussion
The study provides the relative efficacy of the considered policies and strategies for urban water resource management. Initially we generated a basic demand and supply profile for one year to use as a reference. Then we introduced multiple scenarios to study their effects and improvements in the current water resource management system of NUST. In the DMS scenario, 23% yearly water demand is reduced, while in the SM scenario, no unmet demand is observed due to the 21% increase in supply delivered, except for the years 2021 and 2022, which observed 17% and 19% increases, respectively. For the IMs, the overall demand is fulfilled while conserving water resources, as a 23% decrease in water demand is observed, and there is an 18% decrease in the delivered supply. DMS not only reduces the water usage in demand sites but also helps to save money, and preserve the environment. The SM scenario also helps to reduce the groundwater extraction by supplying alternative water resources. Overall, the IM scenario outperforms all the other scenarios as it needs the least amount of water to fulfill the demand and it stores more water for future years, which helps to recharge and regulate the extraction of groundwater resources.
For future years (2019–2020), due to the increased urbanization and the addition of new demand sites, a 14% increase in NUST’s water demand is observed. Consequently, NUST’s unmet demand increases from 9.1 to 13.3 million gallons per year, that is, a 46% increase. Multiple scenarios are simulated to cater for the unmet demand and to provide a more sustainable water supply system. The study concludes that NUST will face water shortages under all scenarios if new water supply sites are not incorporated. It was also observed that since water consumption decreases in colder months, there is a need to revise the water quota for colder months. Our research promotes demand-side measures through the use of efficient water outlets, conscious water consumption, alternative supply resources, such as rainwater harvesting, and applying water conservation methods to ensure sustainable and resilient water resource management.
In a nutshell, predicting the reaction of a system to external manipulation, for example, a policy decision, is often a difficult task. However, based on the developed framework and the aforementioned research agenda, a DSS can be effectively built as a computerized program that will provide support to the decisions and it will suggest a course of action for effective planning. Furthermore, stakeholders and industrialists generally rely on decision support in drafting policies where cognitive capabilities are strained. Our proposed framework provides a conceptual modeling platform to translate real-world urban water resource management systems into an executable model, and it helps to provide a descriptive and perspective view of the system, for making complex decisions, thus assisting in sustainable urban water resource management.
4.4. Research impact and industrial application
This research is motivated by the problem of increased water scarcity in urban areas, especially in developing countries, and the need for sustainable water use through effective urban water resource management. The targeted industries of this research are as follows: (i) governmental entities, particularly water management utilities; (ii) water supply corporations in private housing colonies; and (iii) town planning departments interested in innovative solutions for smart cities. This paper sets up a foundation for an integrated dashboard-based management system for different stakeholders and entities involved in urban water resource management. The proposed framework can support the water management services industry by providing several benefits: (i) regulate the demand and supply gap through water conservation and adaption of alternative resources; (ii) use the framework as a principal check to see the impact of different strategies before implementing different policies in the water demand and supply system; and (iii) increase efficiency by analyzing the efficacy of policies, strategies, and different “what-if” questions. The learned experiences of actual practitioners of water resource management at NUST can be used in dense populations with macro-level abstractions.
5. Summary, conclusion, and future work
In this paper we discussed the need for sustainable water resource management in urban areas to cater to the increased water demand and deal with water scarcity. We propose a workflow for the modeling and simulation of sustainable urban water resource management and develop an integrated framework for the evaluation and planning of water resources in a typical urban setting. The proposed framework uses the WEAP system and a scenario-based approach to evaluate current and future water demand and the supply gap. Our framework coupled with a visualization dashboard deployed in the water resource management department of a metropolitan area can assist in water planning and effective governance. We validated our simulation results using actual data obtained from local sources.
Our study shows that urban areas with groundwater as the primary resource are highly susceptible to water scarcity and would require effective water resource management for sustainable water use. As the groundwater recharge is slow, the delivered supply is affected, creating an unmet demand in the system. Based on the results of our proposed integrated approach, this dependency can be lifted if the alternative resources are effectively managed. Urban water resource managers and stakeholders can take the NUST study as a model for urban water resource management and for effective strategy formulation. The learned experiences of actual practitioners of water resource management, in NUST, can be used in dense populations with macro-level abstractions. The research encourages decision makers to evaluate and adopt suitable strategies for sustainable water use.
Given the generalized capability of the framework with the convenience of expansion, we have the following research agenda that will strengthen this study and form the basis of a DSS to assist policymakers.
The implementation of the model can be conveniently extended on a large scale, for example, an extension to the regional level can be made, where water demands can be further categorized and prioritized. We are currently looking at this extension, and in this regard, the categories of domestic, industrial, agricultural, and ecological demands are under consideration.
To facilitate the model extension and its applicability, one possible research direction includes the integration of the WEAP model with MODFLOW. This integration can truly enhance the analytical capabilities of the proposed framework on a regional or country scale. With the aid of simulating the flow of groundwater through aquifers using MODFLOW, we can directly project optimal locations, for example, to drill tube wells, in the future extensions and evaluate the impact of those resources in terms of future demand fulfillment. This will play a huge role in helping policymakers and relevant stakeholders in decision making.
We further aim to automate the transformation process from the conceptual model to the WEAP model using the model-driven approach, which will enhance productivity in terms of code reuse and rapid prototyping. In this way, the proposed framework will have a higher intuitive appeal and policymakers can then be easily trained to explore and analyze their prospective policies by themselves.
We further aim to enhance the visualization tool of the model, with improved presentation of the results and with the capability of business analysts/stakeholders to conveniently make and execute decisions.
We also aim to model a regional setup where scenarios such as surface-water transportation and surface-water/groundwater interaction will be executed to analyze the irrigation demand in detail, which is generally the largest demand in agricultural countries like Pakistan.
Supplemental Material
sj-rar-1-sim-10.1177_0037549720984250 – Supplemental material for A Water Evaluation and Planning-based framework for the long-term prediction of urban water demand and supply
Supplemental material, sj-rar-1-sim-10.1177_0037549720984250 for A Water Evaluation and Planning-based framework for the long-term prediction of urban water demand and supply by Arfa Saleem, Imran Mahmood, Hessam Sarjoughian, Hasan Arshad Nasir and Asad Waqar Malik in SIMULATION
Footnotes
Funding
Hessam Sarjoughian was supported under a National Science Foundation Grant (#CNS-1639227), “INFEWS/T2: Flexible Model Compositions and Visual Representations for Planning and Policy Decisions at the Sub-regional level of food-energy-water nexus.” We also acknowledge the support from the Stockholm Environment Institute (SEI) for waiving the license fee and providing free access to the use the WEAP system for this research.
Supplemental material
Supplemental material for this article is available online.
Author biographies
References
Supplementary Material
Please find the following supplemental material available below.
For Open Access articles published under a Creative Commons License, all supplemental material carries the same license as the article it is associated with.
For non-Open Access articles published, all supplemental material carries a non-exclusive license, and permission requests for re-use of supplemental material or any part of supplemental material shall be sent directly to the copyright owner as specified in the copyright notice associated with the article.