
Abstract
WiFi fingerprinting remains a cornerstone of indoor localization, yet conventional KNN-based approaches suffer from high-dimensional noise and suboptimal parameter selection. While metaheuristic algorithms like GSA have been applied to optimize access point (AP) selection and K values, they often face high computational complexity in large-scale environments. This paper proposes SA-RLS-GSA-KNN, a novel two-stage optimization framework that integrates sparse-aware recursive least squares (SA-RLS) with the gravitational search algorithm (GSA) to optimize the parameters of KNN. First, SA-RLS with L1 regularization pre-screens critical APs by modeling RSS-position relationships, significantly reducing the search space. Second, GSA fine-tunes the final AP subset and optimal K value within this reduced space using a multi-objective fitness function balancing positioning error, feature count, and computational cost. The evaluation was conducted on 15 public datasets such as UJIIndoorLoc. The average positioning error achieved by SA-RLS-GSA was more than 20% lower than that of the baseline KNN algorithm.
Keywords
Introduction
With the increasing prevalence of smartphones and their support for indoor positioning technologies such as WiFi and Bluetooth, indoor positioning has gained growing popularity in both daily life and industrial applications. Indoor positioning refers to the process of determining the target position indoors. 1 It has a wide range of applications, including navigation in common low - visibility environments, targeted location-based advertising, locating the elderly and disabled, and positioning in industrial production. 2 GPS performs well in outdoor positioning but is not applicable indoors due to signal blockage, multipath effects, and attenuation caused by obstacles. 3
Consequently, common indoor positioning technologies include Bluetooth, 4 WiFi, 5 ultra-wideband (UWB),6,7 radio-frequency identification (RFID), 8 visible light communication (VLC), 9 5G, 10 inertial measurement unit (IMU), 11 as well as acoustic and ultrasonic methods. 12 Among these, WiFi-based indoor positioning systems have emerged as a prominent research focus, 13 owing to the widespread deployment of WiFi infrastructure, which enables sub-m-level accuracy with minimal installation and maintenance costs. 14
The WiFi fingerprint-based positioning process is divided into two phases: the offline phase and the online phase. 15 The workflow diagram of WiFi fingerprint-based positioning is illustrated in Figure 1. During the offline phase (also known as the offline data collection phase), a substantial amount of data is collected to construct a location fingerprint database. In the online phase (or real-time location matching phase), the user's position is estimated in real time through a fingerprint matching algorithm.

Workflow diagram of WiFi fingerprint-based positioning.
In the offline phase, receivers are deployed as received signal strength (RSS) reference points based on the layout of the indoor environment, and the positional coordinates of all reference points are recorded. Subsequently, raw RSS data is collected at each reference point and preprocessed. The preprocessed RSS values, along with their corresponding reference point coordinates, are stored to form a WiFi fingerprint database. 16 During the online phase, the RSS data from the test device's current location is acquired. The reference point with the highest matching degree with the online RSS is matched in the fingerprint database through the positioning algorithm. The coordinates of these matched reference points are converted into the test device's estimated location, ultimately deriving its positional coordinates. 17
This paper focuses on the research of WiFi fingerprint-based positioning algorithms. The main contributions of this paper are as follows: (1) A three-level optimization framework of SA-RLS-GSA was proposed. This framework combines the sparse sensing RLS sparse filtering and GSA joint optimization to effectively optimize the value of K. (2) SA-RLS combined with GSA optimizes the selection of effective access points through a new fitness function. And it eliminates the components contaminated by non-line-of-sight and other noises based on the high-dimensional sparse characteristics of WiFi data. (3) The feasibility and robustness of the algorithm were comprehensively verified based on the inherent features of 15 public datasets (without additional data).
Related works
In the literature, numerous studies have been conducted from various perspectives to achieve indoor positioning. Directions for researching indoor positioning systems include studies on assisting industrial production, 18 supporting living environments, 19 enhancing real-time location tracking in vehicular networks, 20 positioning mobile robots, 21 predicting activities, 22 etc. However, in this paper, we focus on exploring indoor positioning systems based on fingerprint databases. Therefore, this section provides a literature overview of fingerprint-based indoor localization, classifying existing methods into three categories: clustering-based fingerprint positioning, metaheuristic algorithm-optimized positioning, and deep learning-based fingerprint construction, and analyzes their limitations.
Pinto et al. 23 proposed a novel indoor positioning system named KLIP, which uses K-means clustering algorithm to partition the environment into distinct log-distance propagation model sets for better indoor environment characterization, and further employs Bayesian inference to improve location estimation. The paper states that the proposed method can handle the diversity of signal propagation. By incorporating the positional information of training points as clustering attributes, KLIP achieves improved positioning accuracy compared to traditional Bayesian estimation and KNN methods, demonstrating significant enhancements in localization precision. However, this method only optimizes the propagation model and does not address the high-dimensional redundancy of AP data, leading to high computational complexity in large-scale environments. Moreover, it ignores the multi-scene and temporal characteristics of the dataset, and the clustering results cannot adapt to the dynamic changes of the indoor environment. Achroufene et al. 24 introduced a hybrid centroid KNN positioning method based on RSSI. The method can be applied to various environments and devices without requiring additional hardware devices to measure RSSI parameters. It significantly reduces positioning errors in multiple test environments, outperforming traditional geometric positioning methods. However, collecting field samples for self-calibration during the training phase may increase initial deployment complexity and time costs.
Pu et al. 25 proposed an indoor positioning system based on bluetooth low energy (BLE) positioning fingerprints. The method estimates the target node's location by matching online measurements with the closest prior positioning fingerprints. Although this method has low computational cost and high accuracy, it will continuously increase the complexity of equipment deployment and maintenance. Guo et al. 26 studied an indoor positioning system based on particle swarm optimization (PSO) algorithm. The PSO algorithm fits the signal attenuation curve by removing poor experimental data, achieving a good fit between the output model and the signal attenuation curve. However, PSO only optimizes the K value of KNN and does not consider the selection of effective APs, which is prone to local optima in high-dimensional data. In addition, it adopts a unified optimization strategy for different datasets, failing to adapt to the differences in AP density and scene types among datasets. In addition, parameters of the logarithmic path loss model are difficult to determine under different experimental conditions and are significantly affected by environmental factors. The system relies on the Texas Instruments CC2530 chip, and its hardware configuration may limit scalability and flexibility. Improvement space remains in environmental dependence and hardware limitations. Wei et al. 27 proposed a novel indoor positioning system based on UWB technology. The indoor positioning system demonstrated excellent performance in precision and anti-interference capability, and addressed challenges such as interference and poor accuracy in indoor positioning systems. However, the experiments did not consider the algorithm's generalization ability and robustness, and the high hardware cost limits its large-scale application.
Chin et al. 28 explored intelligent indoor positioning technology based on artificial neural networks. Their approach incorporated known communication link channel characteristics (CSI) with neural networks to achieve accurate indoor positioning. However, processing large volumes of CSI data requires significant computational power and storage resources, increasing system complexity and computational burden. Li et al. 29 put forward a novel approach named amplitude feature-deep convolutional generative adversarial network (AF-DCGAN) for constructing fingerprints in indoor positioning systems. By leveraging the AF-DCGAN model to create fingerprint databases, the human effort and time needed for collecting a large amount of data in the offline phase are cut down. Experimental outcomes show that the fingerprint databases generated by AF-DCGAN can notably enhance the accuracy of indoor positioning systems. It still faces certain difficulties in terms of data reliance, computational complexity, and environmental adaptability.
Guidara et al. 30 introduced a distributed training architecture. Field samples were collected to train the deep learning-based RSSI indoor ranging model, which enabled effective self-calibration, reducing the need for manual calibration and minimizing the impact of interference factors such as temperature, humidity, and noise while improving system efficiency and automation. However, training deep learning models requires a large amount of computational resources, especially in a distributed architecture where each anchor point needs to be trained independently. It may increase the complexity and cost of the system. Wang et al. 31 proposed a hybrid algorithm combining simulated annealing (SA) and genetic algorithm (GA) to optimize neural networks for improving ZigBee indoor positioning accuracy. This algorithm holds high application value in wireless indoor positioning, providing a solid foundation for 3D positioning and enabling gradual realization of efficient 3D localization. However, while combining SA and GA improves positioning accuracy, the SAGA-BP algorithm increases computational complexity and potentially affecting real-time performance.
Azaddel et al. 32 proposed a flexible and scalable collaborative architecture for BLE and WiFi is presented, which effectively reduces interference between WiFi and BLE signals through optimized signal management. This architecture enhances accuracy, robustness, and practicality in SPOTTER's indoor fusion positioning algorithm. However, not all off-the-shelf APs support sniffing mode for scanning signals emitted by mobile devices, limiting widespread adoption of WiFi-I-IPS. FEI et al. 33 proposed an improved backpropagation neural network (BPNN) method based on probabilistic density for indoor positioning. Relying on WiFi fingerprint technology, this approach offers advantages of low cost, simple positioning method, and easy scalability, making it suitable for diverse indoor positioning scenarios. Although the improved BPNN model improves accuracy, its model complexity may be relatively high, especially for large-scale datasets, which can lead to increased training time and increased requirements for computing resources.
Wan et al. 34 studied Bluetooth direction-finding technology combined with an improved signal subtraction subspace (ISSS) algorithm to achieve precise indoor positioning. Compared to traditional AOA positioning algorithms, the proposed ISSS algorithm exhibits better computational and precision advantages in complex indoor scenarios. However, the current algorithm can only handle short-term occlusion interference caused by human walking, while long-term obstacles like indoor furniture or nonline-of-sight interference sources require further research. The paper indicates future work will investigate the antenna quantity's impact on positioning accuracy. Lutakamale et al. 35 proposed a convolutional neural network (CNN) with squeeze-and-excitation (SE) blocks to perform node positioning in LoRaWAN networks. When evaluated using a public LoRaWAN dataset, the proposed method exhibits strong robustness. LoRaWAN devices themselves have a relatively low cost. However, deploying and configuring these devices still demands a certain amount of hardware investment, particularly in large-scale applications.
The positioning system of the aforementioned research is quite mature, and it has particularly excellent advantages. However, we will optimize it in terms of running time, running efficiency, and generalization. Due to the complex nature of indoor environments, indoor positioning systems should not only possess high positioning accuracy but also have low computational complexity and short positioning time. At the same time, they should achieve submeter accuracy economically with minimal installation and maintenance costs. The high complexity of the system, the high dimensionality of data, and the reliance on hardware, among other conditions, lead to longer running times of the positioning system, reduced operational efficiency, and issues with the generalization of algorithms. Existing metaheuristic algorithms (PSO, GA) mostly adopt a serial optimization mode of “first dimension reduction then parameter tuning,” which cannot balance the two objectives of “reducing computational complexity” and “improving positioning accuracy.” Furthermore, these algorithms ignore the multi-scene, multi-temporal, and sub-scene heterogeneous characteristics of 15 WiFi datasets, resulting in poor adaptability to different datasets and low optimization efficiency. Based on this, this paper proposes an indoor positioning system based on SA-RLS-GSA, which adaptively optimizes KNN parameters for WiFi fingerprints.
Proposed methodology
Sparse-aware RLS pre-screening
Given an input matrix

Where
During the nth iteration, the estimation/prior error

The cost function of the sparsity-aware RLS algorithm can be expressed as:
Where
The weight vector can be expressed as:

Where
GSA algorithm
Inspired by Newton's law of universal gravitation, Esmat Rashedi et al. proposed the GSA algorithm 36 to solve optimization problems, especially nonlinear problems. It adheres to the principles of Newton's law of universal gravitation. In the GSA algorithm, particles are regarded as objects, and their performance is estimated when taking into account the mass of the particle. The search agents are a set of masses that interact with each other based on Newton's laws of gravitation and motion. All agents can exchange information with each other according to the attractive force between their masses (calculated based on the values of the objective function) and the distances between them. Agents are treated as objects, and their adaptability is measured by their mass. Generally speaking, all these objects are attracted to each other by gravity, and this force causes the global movement of all objects to move closer to objects with larger mass. Therefore, the masses interact with each other through the direct connection in the form of gravitational force.37,38
The formula for the gravitational force between particles is as follows:

Where G(t) is the gravitational constant,
By taking into account the random characteristics, the force that object i experiences in dimension d is randomly weighted.

Here,
According to Newton's second law, the acceleration of object i is given by:
Subsequently, the new position and velocity of the object can be expressed as:


The mass of each object is evaluated using the fitness function to determine the new gravitational mass in each iteration:

Normalize

In Equation (10), the

Among them,
The fitness values
The selection of the number of access points is to choose the particles whose fitness is less than the worst fitness. When the fitness of a particle is less than the worst fitness, it indicates that the objective function value of each particle is less than the objective function value of the worst individual in the data, and the performance exceeds the “bottom line” of the current population, and does not belong to the lagging individual. The K value is the effective number of access points where the fitness of a single particle is greater than the optimal fitness and less than the worst fitness.
Data capture and preprocessing
In the offline phase, a dataset is collected. The WiFi signal strengths of all APs are collected at different locations, resulting in a dataset as shown in Equation (13). After collecting the signal strengths at all locations, a dataset as described by the formula can be formed. This dataset is the fingerprint database, which serves as the dataset for training the model. The standardized processing of data adopts the z-score standardization method. This method is not affected by the original magnitude of the data, and the standardized data still maintains the distribution shape of the original data. At the same time, it can improve the generalization ability of the model.

SA-RLS-GSA optimization KNN
In the KNN algorithm, three key factors influence the model's usability: choice of K value, and classification decision rule. We can consider the signal as dynamic particles. The movement of these particles is influenced by the resultant force of gravitational attraction. This thereby affects the value of K and the number of access points. By treating each signal strength in the dataset as a particle and applying the SA-RLS-GSA to calculate an optimal K value and distance metric weight, this approach enhances algorithm accuracy and suppresses NLOS interference.
In indoor WiFi fingerprint positioning scenarios, non-line-of-sight (NLOS) propagation can cause severe distortion, deviation, and abnormal fluctuations in the RSS signals of some APs. These AP components contaminated by NLOS can significantly increase positioning errors and manifest as invalid, redundant, and noise-dominated feature components in high-dimensional AP features. The sparse-aware RLS algorithm embeds L1 regular sparse constraints into the recursive least squares framework to achieve automatic identification and suppression of NLOS-contaminated APs.
The core function of the L1 norm is to impose a penalty on non-zero weights, forcing the weights
Effective APs are identified using Formula 4. The dimensions where contaminated APs are located will generate significant fitting residuals, enabling the algorithm to detect abnormal components. The core of effective AP suppressing NLOS lies in the zero-attracting term. A toward zero is applied to components with smaller weight amplitudes (NLOS-contaminated APs, redundant APs), making them converge to zero quickly. Only weak constraints are imposed on reliable components with larger weight amplitudes (LOS-dominant APs) to retain effective features. As a result, the weights irrelevant to the system will gradually approach 0 (achieving sparsity), while the weights relevant to the system will stabilize at certain non-zero values (maintaining model performance).
We iteratively calculate the K value using the GSA algorithm and map the K value to position


To ensure the effectiveness of the search space, we have designed boundary processing. When
In the KNN algorithm, three key factors influence the model's usability: distance metric, choice of K value, and classification decision rule. During training, if K nearest particles are matched in the dataset, these particles are classified into a category. Thus, the selection of K significantly impacts KNN results. A smaller K value reduces approximation error but increases estimation error, making the output highly sensitive to neighboring data and prone to overfitting. Conversely, a larger K value minimizes estimation error but increases approximation error, creating tolerance to neighboring data that may lead to incorrect outputs. By treating each signal strength in the dataset as a particle and applying the GSA to calculate an optimal K value, this approach enhances algorithm accuracy.
Use Equation (13) as the training dataset and substitute it into the GSA algorithm. As shown in Figure 2, it is the flowchart of the SA-RLS-GSA algorithm for optimizing the K value, effective AP set. The SA-RLS-GSA-KNN algorithm is overall divided into two stages: offline training and online positioning. In the offline stage, first, the original WiFi RSS data undergoes preprocessing including invalid value replacement, outlier removal, and z-score standardization. Then, Sparsity-aware RLS sparse filtering embedded with L1 regularization constraints is used to suppress non-line-of-sight (NLOS) contaminated AP components and perform initial screening of effective APs. In the online stage, first, the real-time collected RSS signals undergo the same preprocessing and Sparsity-aware RLS sparse filtering as in the offline stage. Then, the fitness of the RSS of the test dataset is calculated using the SA-RLS-GSA-KNN algorithm. Thus, the effective access points (AP) and the optimized distance weights are selected, and weighted KNN neighbor matching is performed to complete the estimation of the positioning coordinates, and the final result is output.

The flowchart of KNN algorithm optimized by SA-RLS-GSA.
Experimental tests and discussion
Dataset collection
We use different open-source datasets to test the algorithm. In this paper, the Ujiindoorloc dataset serves as dataset 1—a WiFi fingerprint database released in 2014. 39 It consists of 19,937 training data points and 1111 validation data points, containing WiFi fingerprints, coordinates where fingerprints were collected, device IDs, and other information. Each WiFi fingerprint is represented by detected wireless access points (WAPs) and their corresponding received signal strength indicator (RSSI) values. The WiFi fingerprint comprises 520 strength values, expressed as negative integers ranging from −104 to 0 dBm. A positive value of 100 indicates an undetected WAP.
Fingerprint coordinates include longitude, latitude, and altitude. The first two buildings have four floors, and the third building has five floors. Figure 3 shows a data sample from Dataset 1.
Data sample figure of dataset 1.
The dataset collected by Barnwal et al. 40 was gathered between January and August 2017 in a four-floor university building in Tampere, Finland. The data from Dataset serves as Dataset 2. It includes 687 training fingerprints and 3951 test or estimation fingerprints. This dataset contains coordinate files, RSS files, date files, and device files. The coordinate files provide latitude, longitude, altitude, and building floor information (totaling four floors). The RSS files are divided into test and training datasets, each consisting of 992 strength values. The date files indicate the collection dates of RSS for training and test sets, while the device files show the equipment used to measure RSS. Figure 4 shows a data sample from Dataset 2.

Data sample figure of dataset 2.
Mendoza-Silva et al. 41 was gathered over a 15-month period using an Android smartphone on two floors of the Universitat Jaume I library building in Spain. This dataset holds 63,504 WiFi fingerprints, which are grouped into datasets. Every sub-folder contains the measurements of each dataset from a specific collection month. Each dataset is made up of four files: an RSS file, a time file, a coordinate file, and an identifier file. In each file, the i-th row stores the corresponding information of the i-th fingerprint in the dataset.
In the RSS file, each column stands for the strength measurement (in dBm) of a particular WAP. When a WAP is not detected in a fingerprint, the strength value for that fingerprint is set to 100. Figure 5 shows a data sample from Dataset 3.

Data sample figure of dataset 3.
In Reference Bi et al., 42 the measured data was divided into three groups to create a supplementary open dataset for wifi indoor localization (SODIndoorLoc). This dataset can be seen as a complement to the UJIIndoorLoc dataset. It covers multiple floors in three buildings, including corridors, offices, and meeting rooms. With a total area of around 8000 m2, it has 1802 distinct location points. Among them, there are 1630 reference points (RP) and 272 test points (TP). A total of 23,925 samples were recorded, with 21,205 samples used for training/learning and 2720 samples for testing/validation.
This dataset consists of three scenarios: offices, meeting rooms, and corridors. Since lobbies and corridors are integrated within these buildings, no distinction is made between these two scenarios. In the three buildings, 105 single- and dual-band APs were pre-installed. The locations of these pre-installed APs and CAD drawings are provided.
Considering the differences in the number of samples and MAC addresses in the training data, the dataset contains nine training tables and five corresponding test tables. In two of the buildings, the sampling distance between adjacent points is approximately 1.2 m, while in the third building, it is about 0.5 m. The data is divided into three datasets based on the three buildings. Figure 6, Figure 7, Figure 8 show the data sample figures for the three datasets.

Data sample figure of dataset 4.

Data sample figure of dataset 5.

Data sample figure of dataset 6.
Databases collected at GEOTEC Lab present a dataset measured by Joaquín Torres-Sospedra at the Universitat Jaume I. Institute of New Imaging Technologies, specifically on the 5th floor. According to available information, this dataset serves as an extension of the dataset in Reference 39. It contains 680 training datasets and 460 test datasets. Figure 9 shows a data sample from Dataset 7.

Data sample figure of dataset 7.
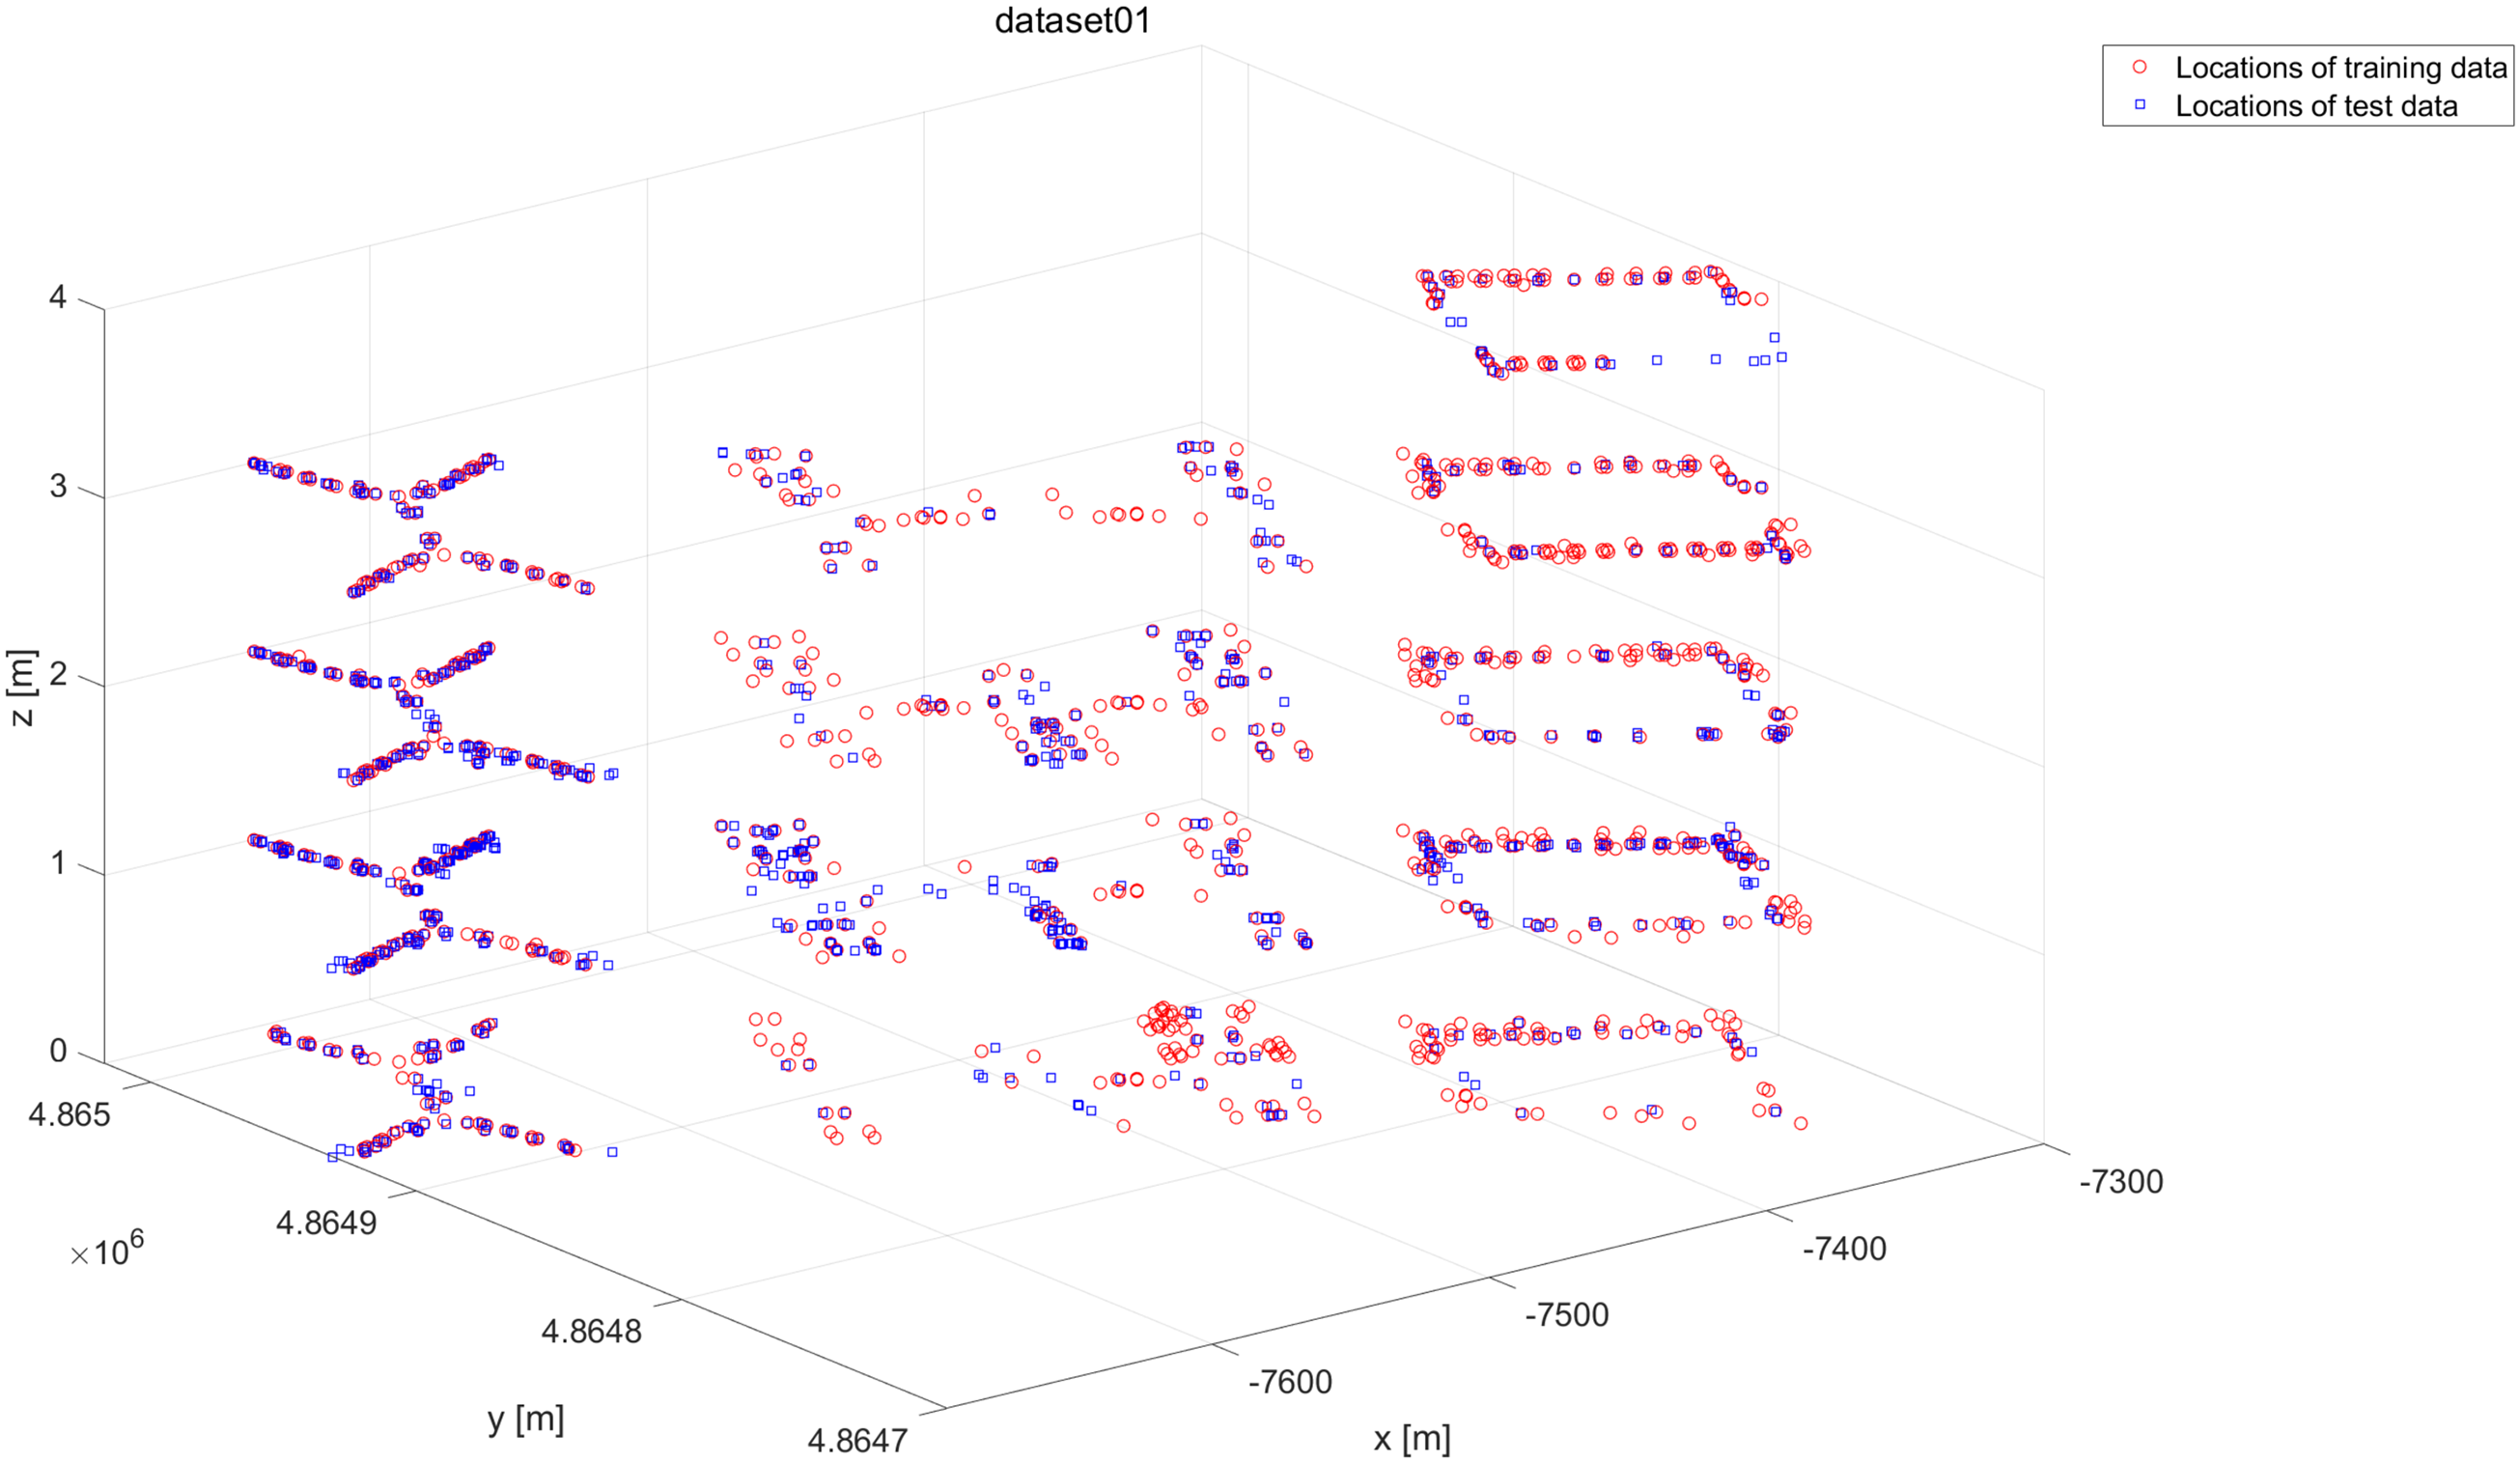
UTMInDualSymFi database contains a comprehensive source of dual-frequency Wi-Fi RSSI data. 43 Wi-Fi RSSI data for fingerprint localization was collected from a total of 4 residential buildings. Building 1 on the Universiti Teknologi Malaysia (UTM) campus includes original training data, test data, and radio maps. Building 2 includes original training data, test data, and radio maps. Building 3 contains only test data, and Building 4 contains only test data. Due to the availability of both training and test data in Buildings 1 and 2, their datasets are used as the experimental datasets. When collecting data, the authors separately recorded RSS at 2.4 and 5 GHz, creating distinct experimental datasets for different frequencies. Figure 10, Figure 11, Figure 12, Figure 13, Figure 14, Figure 15, Figure 16, Figure 17 show data samples of the experimental datasets.

Data sample figure of dataset 8.
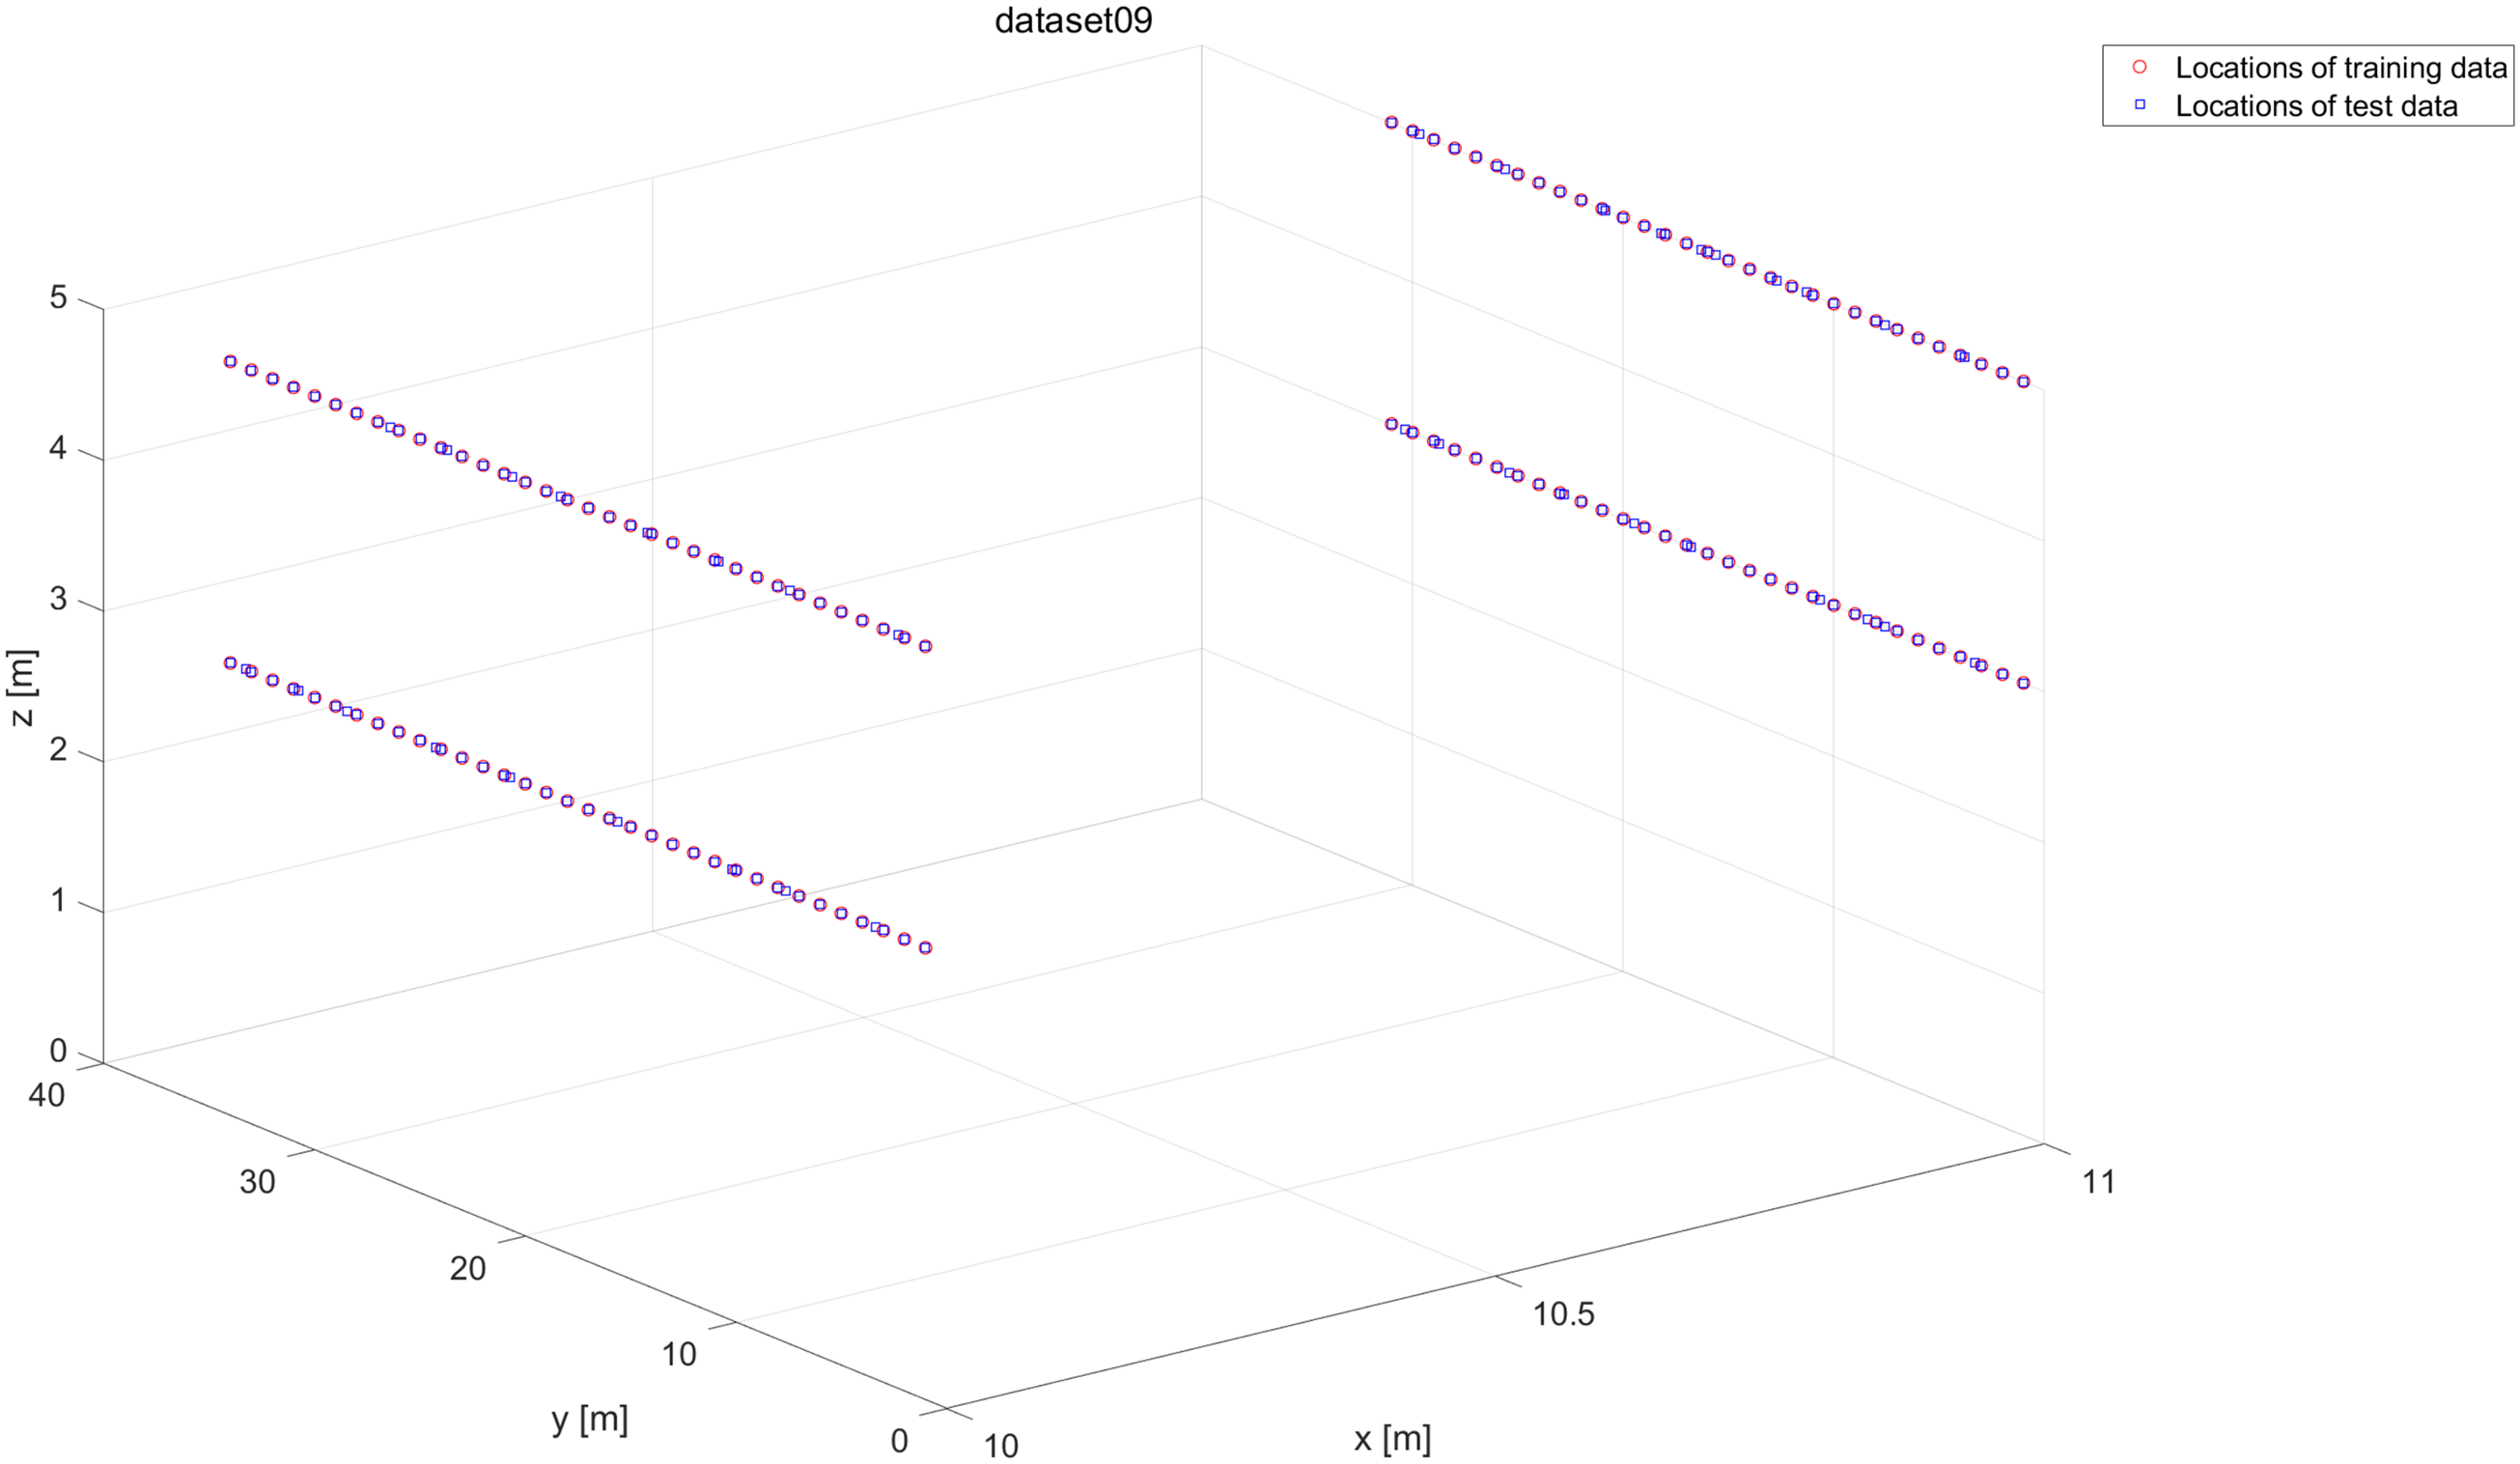
Data sample figure of dataset 9.
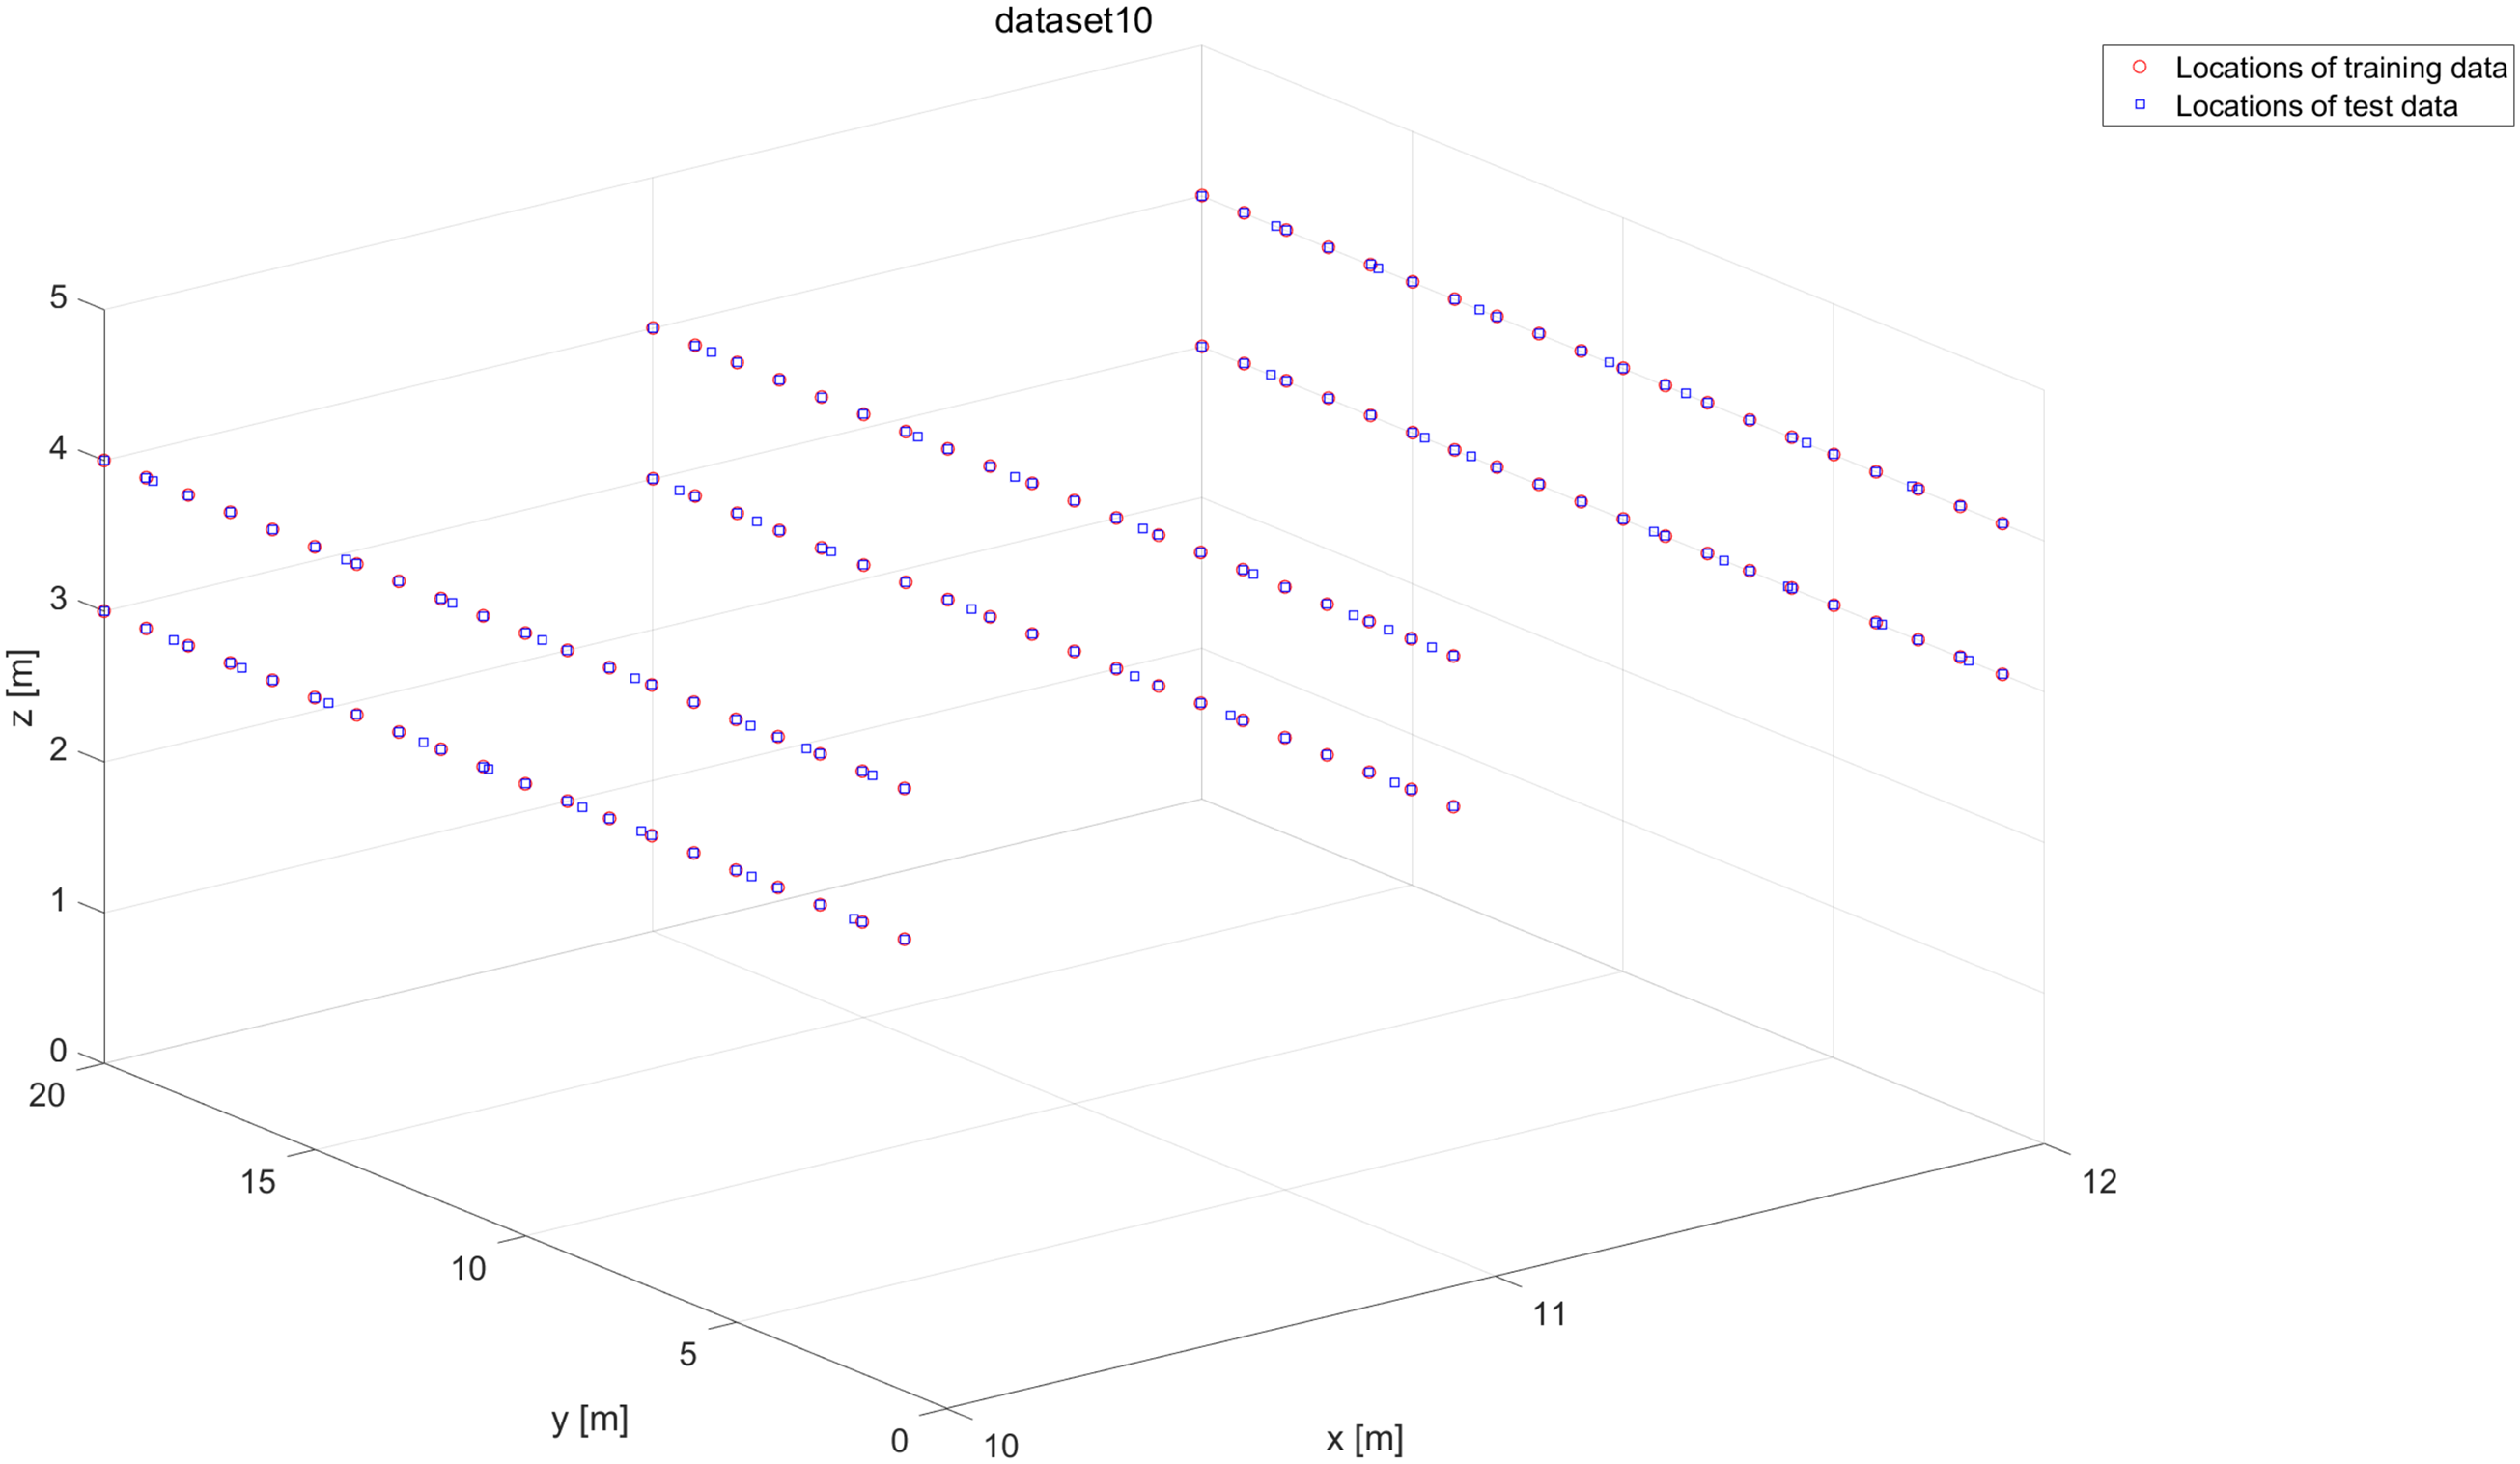
Data sample figure of dataset 10.
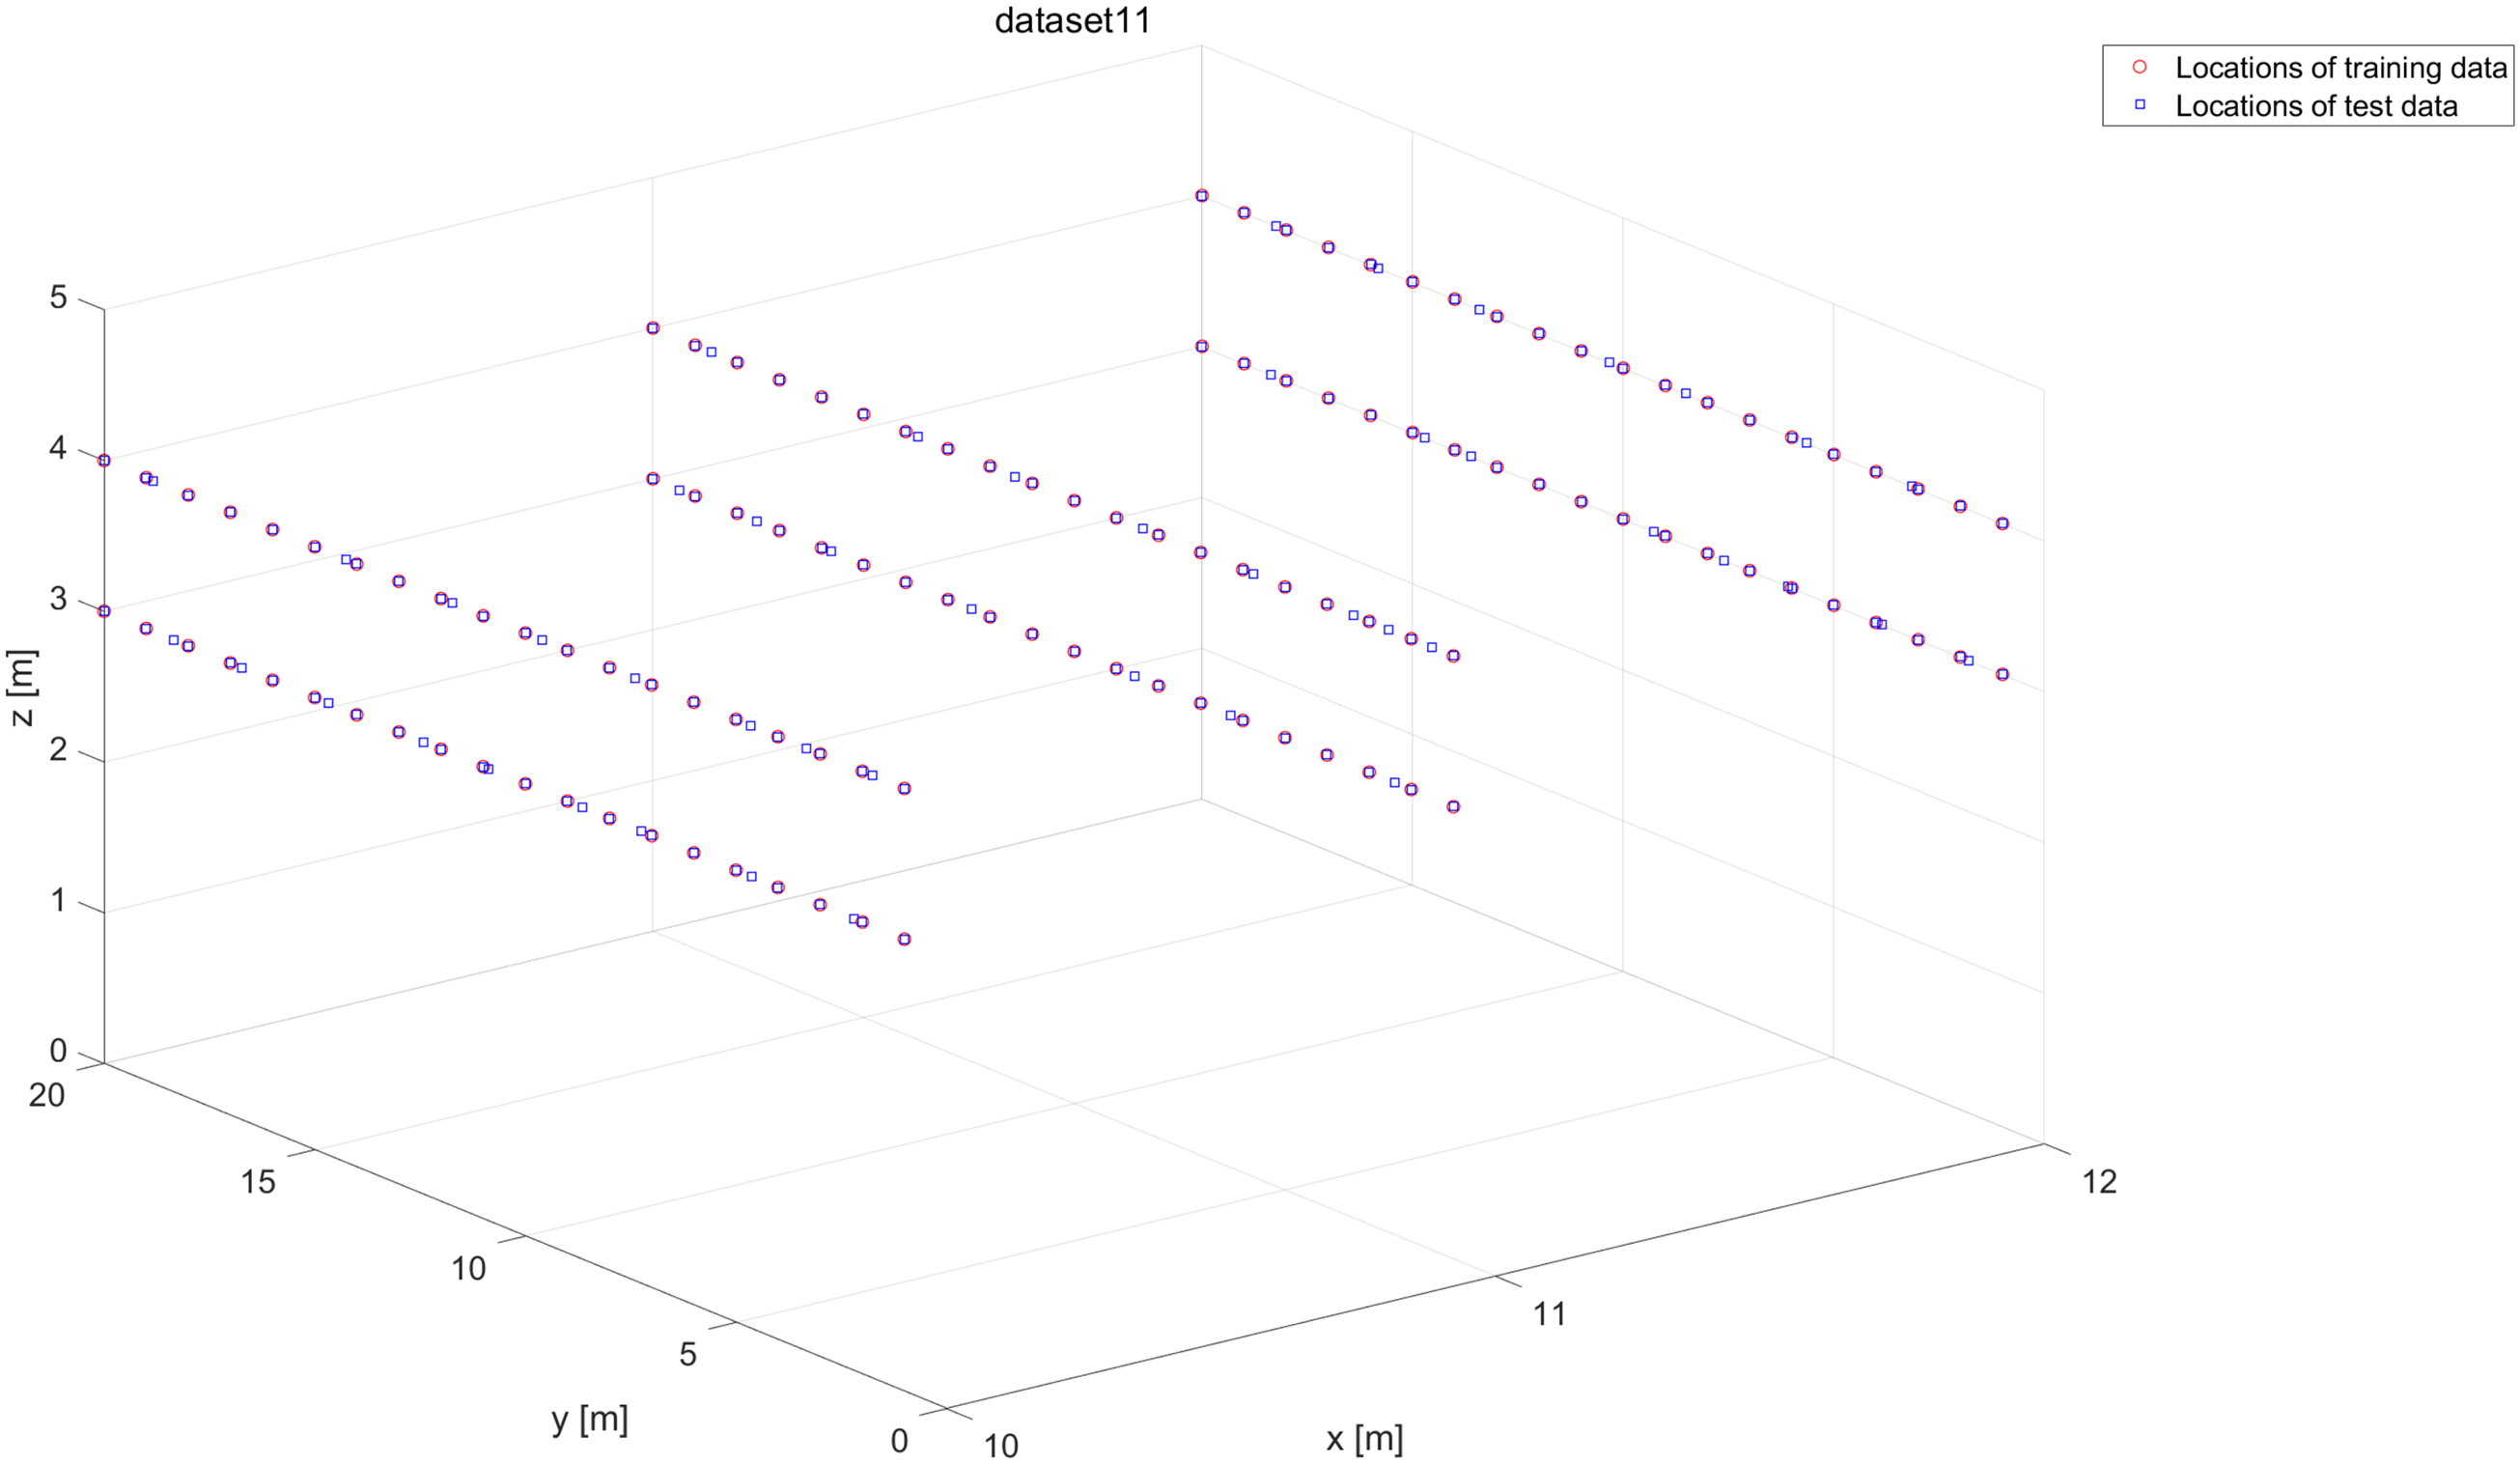
Data sample figure of dataset 11.

Data sample figure of dataset 12.

Data sample figure of dataset 13.

Data sample figure of dataset 14.

Data sample figure of dataset 15.
In UTMInDualSymFi database, reference points (RP) represent locations with known coordinates or distances. Training data is collected at RPs to obtain relevant data at known positions. For this database, RPs in each wing (corridor) are treated as distances from a specific “zero-distance location.” The zero-distance point for each floor wing is selected such that all RPs face only one side of the zero-distance point.
Data collection activities ensured social distancing while minimizing interference in public areas like lobbies, seating arrangements, balconies, corridors, and residential entrances. Consequently, certain unsuitable areas were excluded. RPs were marked every 1 m (i.e. RP spacing = 1 m).
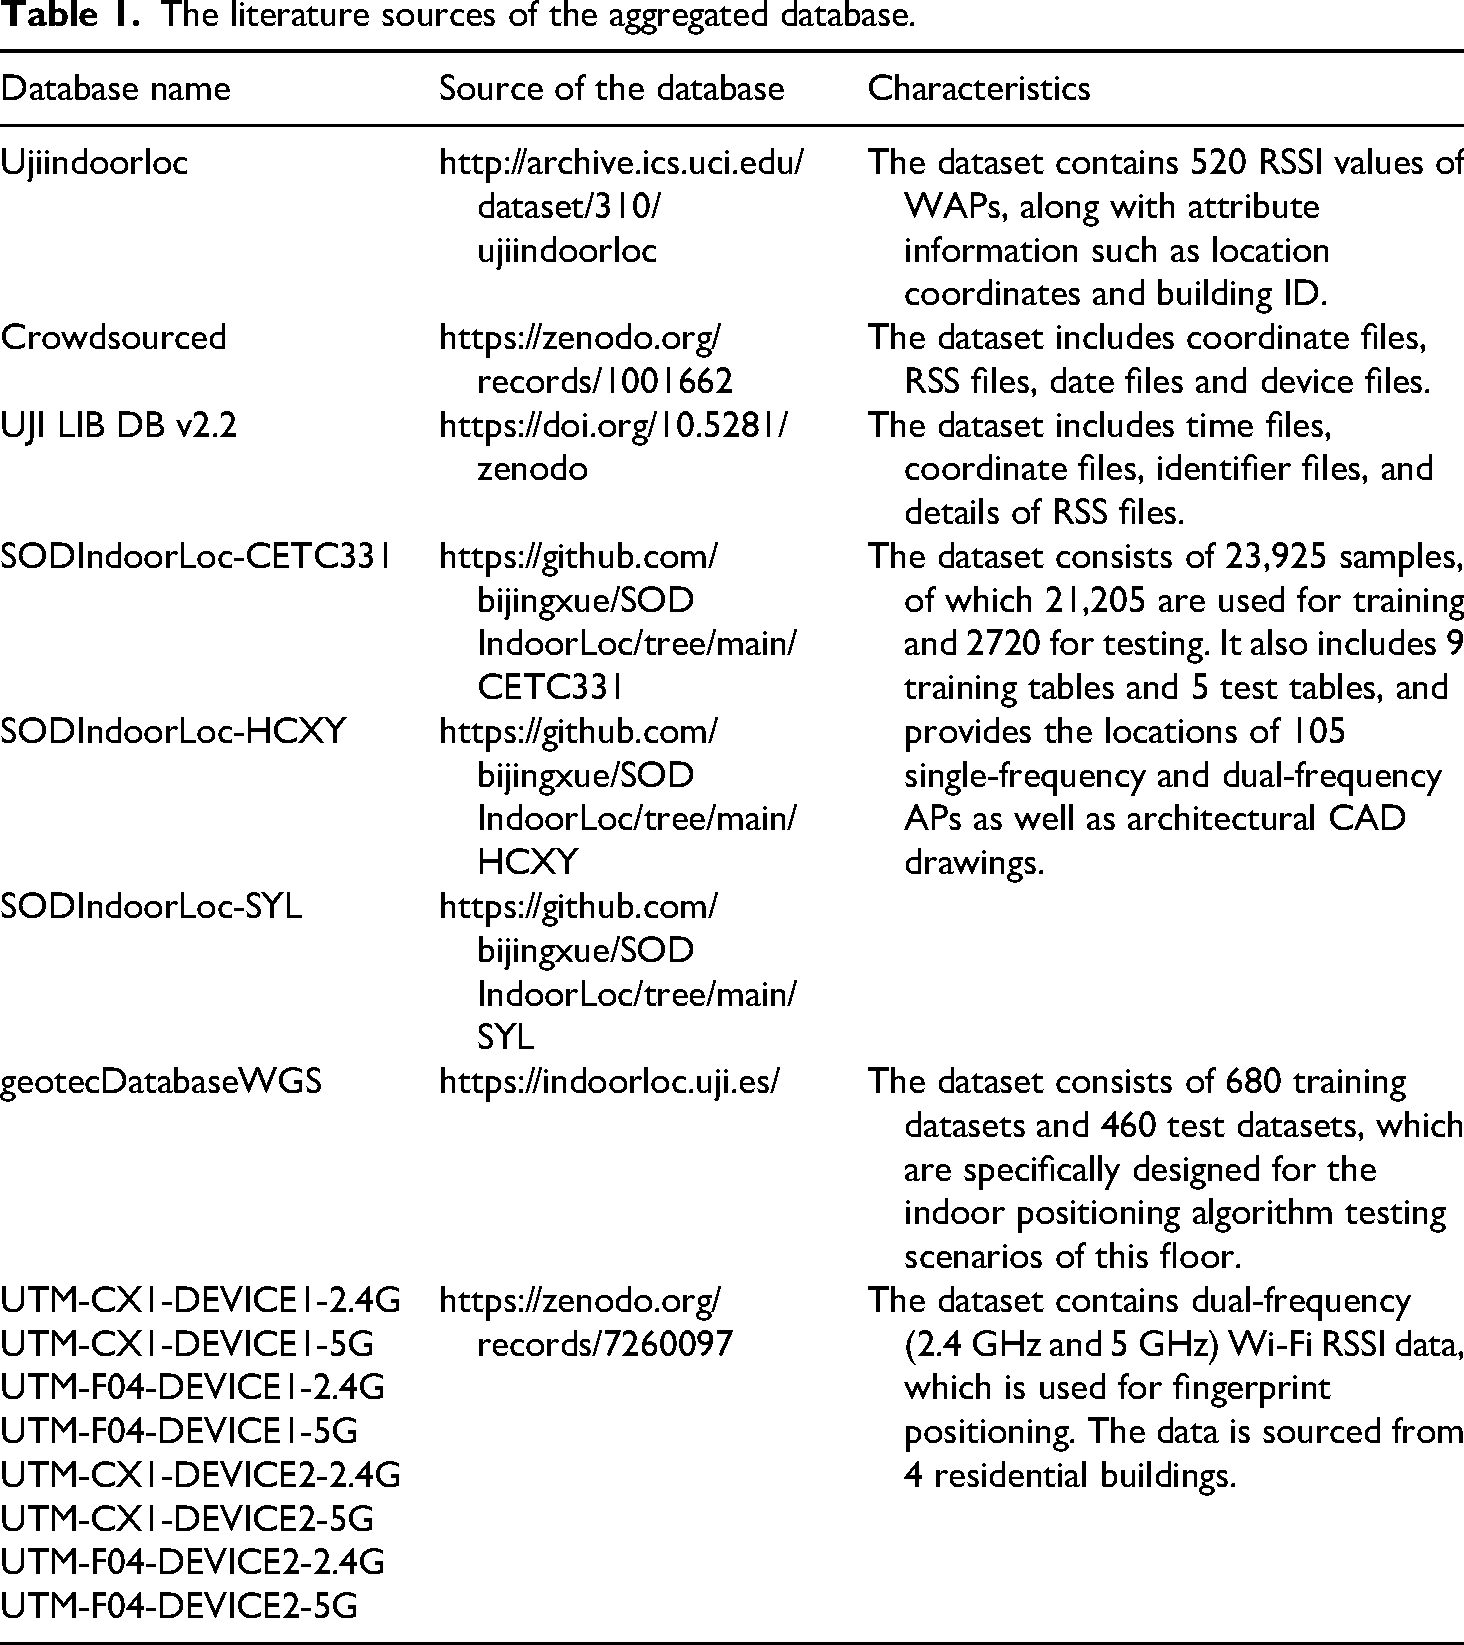
We will use these 15 datasets as training and test samples. The number of training and test samples for each dataset is shown in Figure 18. In Table 1, list the names, literature sources and characteristics of each database.
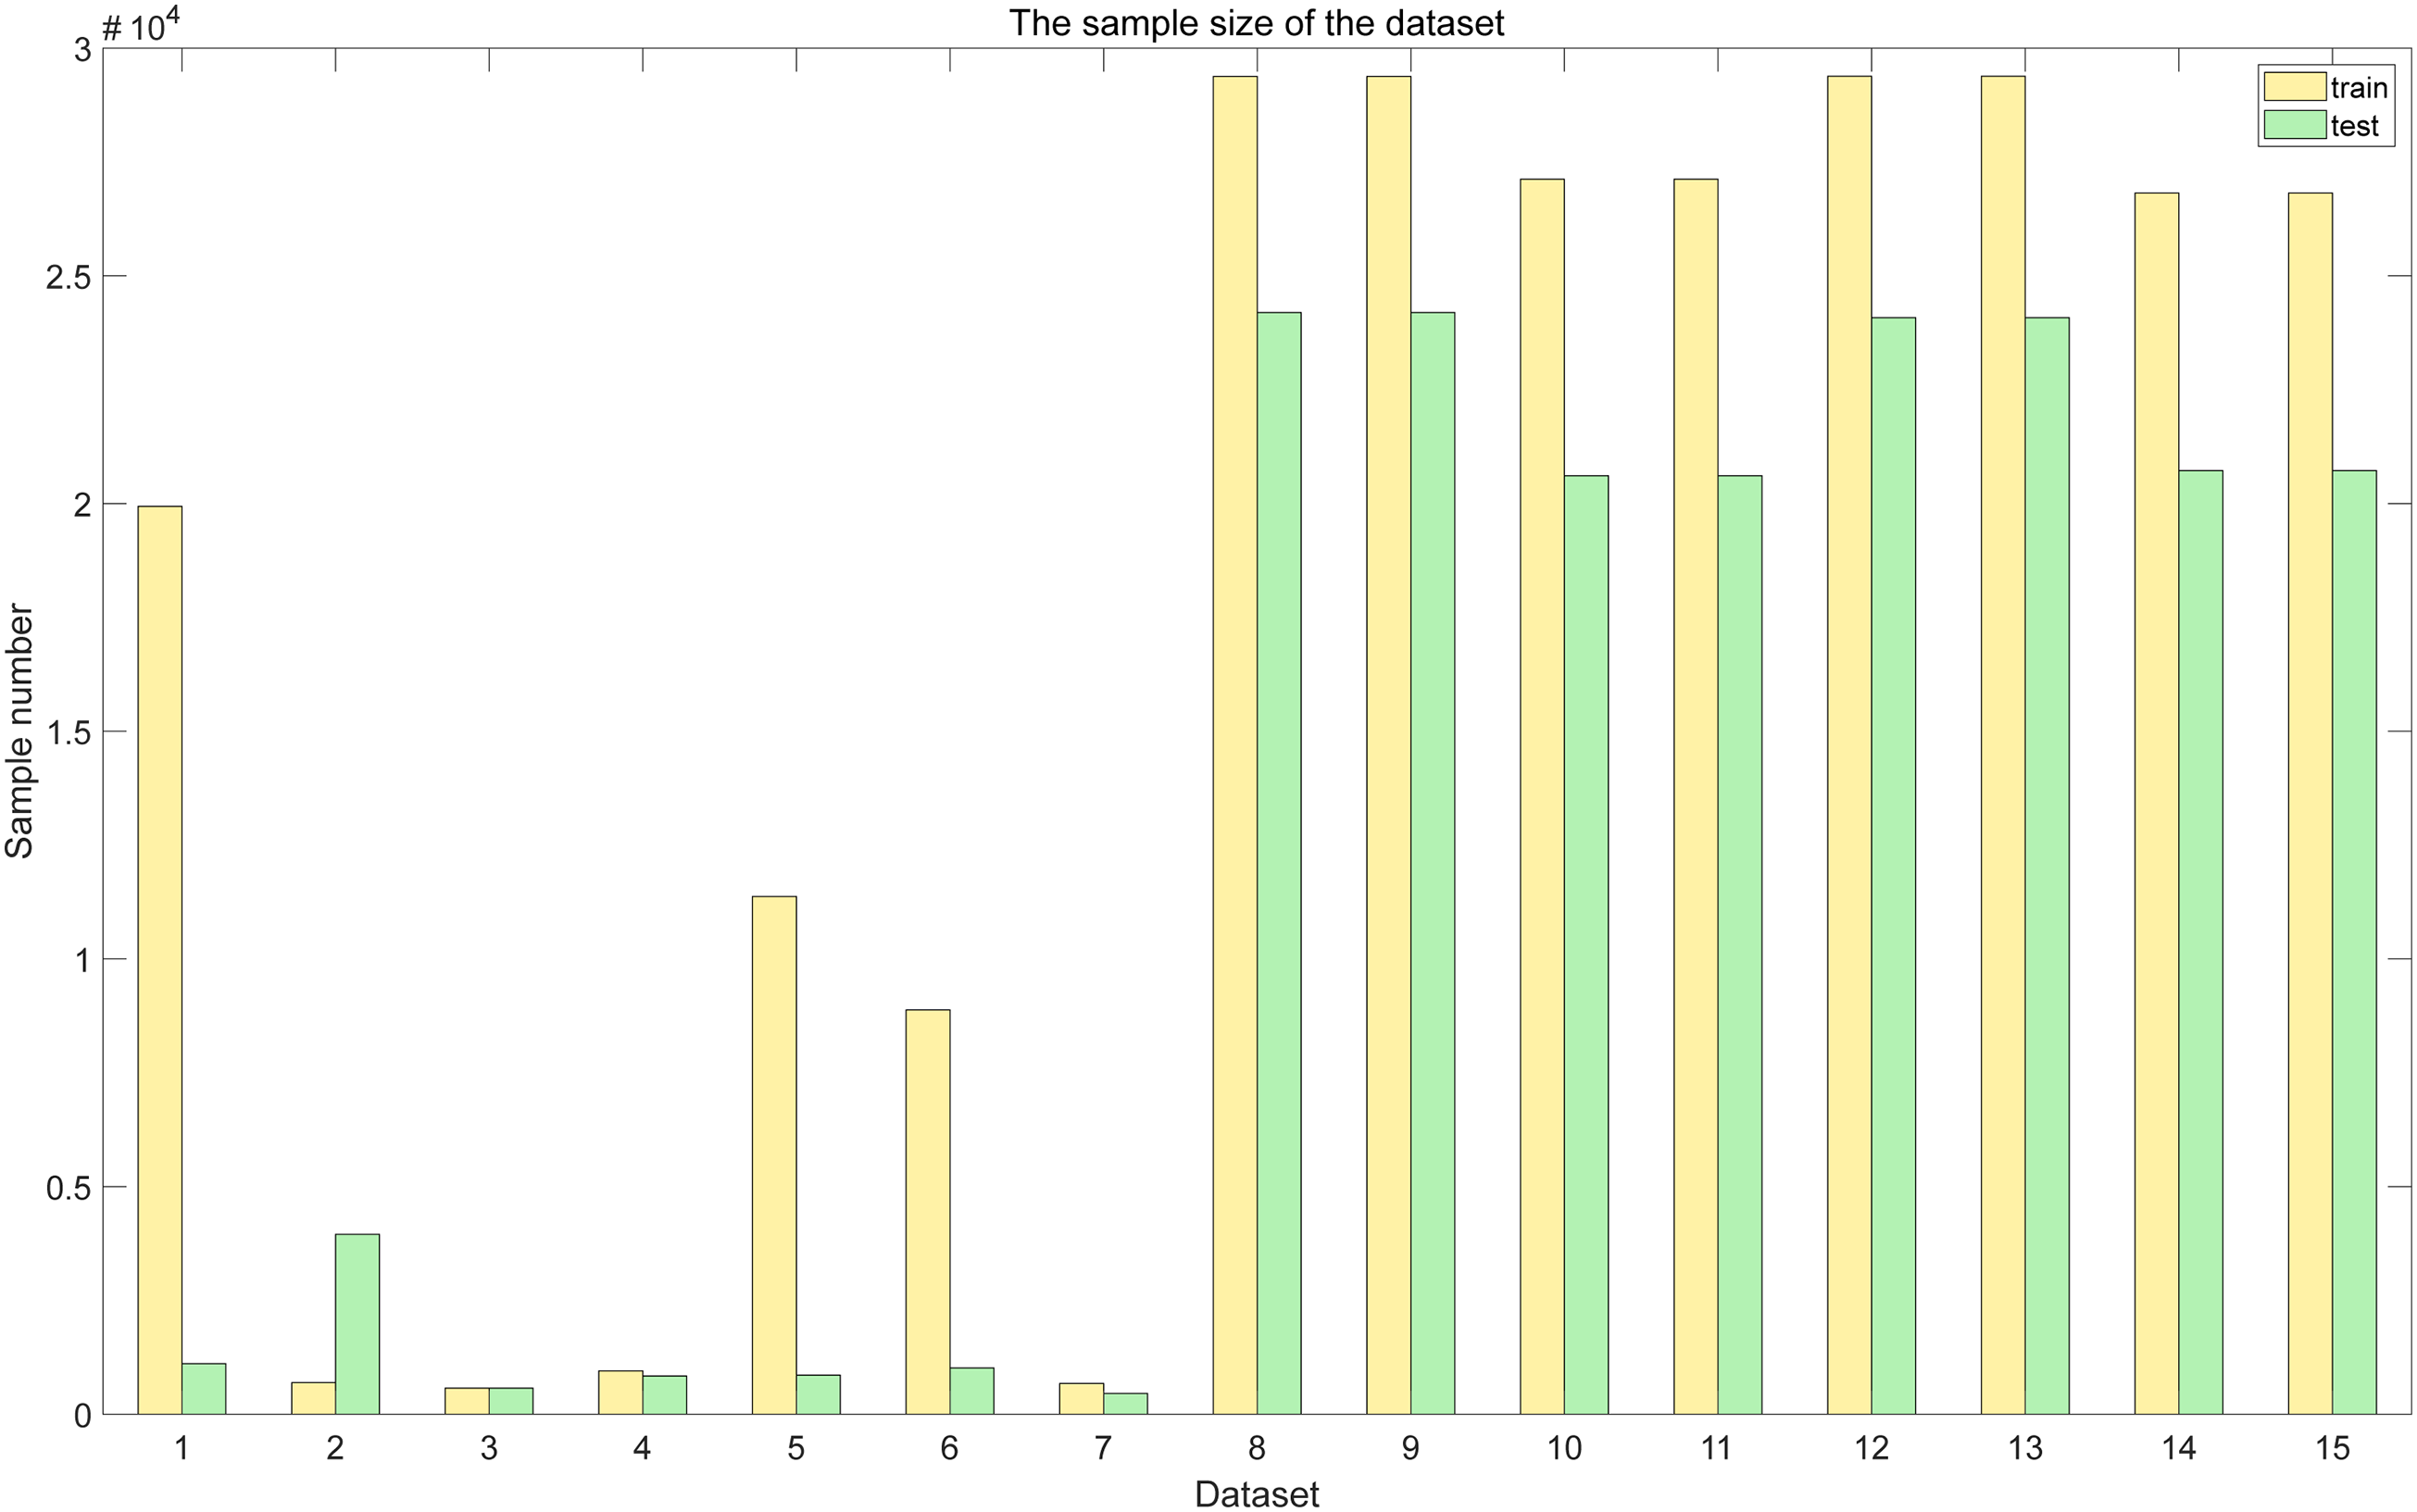
The number of training and test samples for the dataset.
The literature sources of the aggregated database.
Experimental analysis
In this section, we compared 15 public datasets with the proposed algorithm and the KNN algorithm, the GS-KNN algorithm, the PSO-KNN algorithm, the GA-KNN algorithm, and the traditional GSA-KNN algorithm, and obtained the experimental results. The experimental equipment uses a Dell Inspiron 7560 series notebook. The processor is an Intel i5-7200U. The memory is 16G. The operating system is Windows 22H2 version. Pycharm software is used to train and test the data. Table 2 shows the parameters of the computer used for the test data. For the benchmark algorithm, the K value is set to 9. Based on the analysis of all the datasets, the K value setting of the benchmark algorithm is slightly larger, that is, setting K = 9, can reduce the estimation error of learning, be more inclusive of neighboring data, and make the output results of all datasets less prone to overfitting. Table 3 shows the number of APs before and after dataset optimization and k value optimized.
The parameters of the computer used for the test data.

The number of APs before and after dataset optimization and k value optimized.

We standardized the RSSI data of the dataset using the z-score normalization method. This method is not affected by the original magnitude of the data, and the standardized data still maintains the distribution pattern of the original data. At the same time, it can enhance the generalization ability of the model.
After optimizing the number of access points using the SA-RLS-GSA-KNN algorithm, Table 3 shows the number of access points and the K value before and after the optimization. The “APs” in the table represent the number of original access points. “After” indicates the number of access points after the algorithm optimization. “k” represents the optimized k value of the proposed algorithm. It can be seen that the number of access points after optimization is less than 50% of the number in the original dataset.
We used 15 public datasets and compared our proposed algorithm with the basic KNN algorithm, PSO-KNN algorithm, GA-KNN algorithm, GridSearch KNN algorithm (GS-KNN), and traditional GSA-KNN algorithm. Among all the algorithms, we set the initial value of
The running times of 15 datasets.

For the prediction accuracy, we compare the MAE of these algorithms. Figure 19 shows the MAE comparison plot of the 15 datasets. The 1–15 numbers on the horizontal axis represent 15 different datasets. The MAE of all methods in dataset 1 is extremely high. This indicates that the dataset is “hard” for all types of KNN methods. The prediction error may be generally large due to factors such as large data noise and complex features. The MAE of the basic KNN in dataset 5 is as high as 62, while the MAE of the optimization methods (GridSearch, PSO, GA, GSA) is mostly between 45 and 50. This means that the basic KNN is invalid for this dataset, but the optimization method can alleviate the error (although the error is still higher than the other datasets).

The MAE comparison plot of the 15 datasets.
The base KNN algorithm performs the worst on “difficult” datasets such as dataset 5 and dataset 1. This indicates that traditional KNN is sensitive to data characteristics and has weak generalization ability. Compared with basic KNN, optimized KNN methods (GridSearch, PSO, GA, and GSA) have a decrease in MAE on most datasets (such as datasets 5 and 1). However, the amount of improvement is highly dependent on the dataset (for example, the MAE of dataset 1 is still close to 190 after optimization). SA-RLS-GSA is our proposed method, which has lower MAE than other methods on most data sets.
In dataset 1, MAE is much lower than the other methods and is the only method that significantly reduces the error on “hard” dataset 1. In dataset 7, MAE is the lowest among all methods. The MAE in datasets 8–15 is stable between 5 and 15, which is lower than other methods as a whole. Therefore, it can be concluded that SA-RLS-GSA can alleviate the error more than the traditional optimized KNN on the “difficult” data set. On the “friendly” dataset, SA-RLS-GSA can still maintain the lowest error. On most data sets, the MAE curve of SA-RLS-GSA is lower than that of other methods, indicating that its optimization strategy can adapt to different data characteristics more efficiently and improve the prediction accuracy.
Figure 20 shows the MSE comparison plot of the 15 datasets. Figure 21 shows the RMSE comparison plot of the 15 datasets. The 1–15 numbers on the horizontal axis represent 15 different datasets. In KNN, GridSearch KNN, PSO-KNN, GA-KNN, and GSA-KNN, the first seven datasets perform poorly. On datasets 1 and 5, there is a clear “peak” in RMSE. It indicates that the fitting ability of partial data sets is weak. The last eight data sets are close to the proposed method, but the overall is slightly higher, the curve fluctuates slightly, and the stability is slightly weaker. The SA-RLS-GSA-KNN algorithm has significantly lower RMSE than the other five methods in the first seven datasets. In the last eight datasets, RMSE is stable around 10 to 20 with small fluctuations, indicating good adaptation to different datasets. By comparing Figures 20 and 21, the superiority of the proposed method SA-RLS-GSA in terms of prediction accuracy and stability is verified. On “difficult” datasets, the proposed method can greatly reduce the error, and has significant advantages over traditional methods. On the “friendly” datasets, the proposed method can also maintain better performance than the traditional method, and the curve is smoother and has strong robustness.

The MSE comparison plot of the 15 datasets.

The RMSE comparison plot of the 15 datasets.
Figure 22 shows the median error comparison plot of the 15 datasets. The Proposed method (SA-RLS-GSA-KNN) achieves the lowest error and the highest stability on all datasets. The optimization effectiveness of the proposed method for KNN model is verified. Traditional KNN and KNN optimized by grid search have weak generalization ability on some data sets. PSO, GA and other optimization algorithms have poor adaptability in the initial data set and lack of subsequent stability. GSA-KNN performs well, but the proposed method combined with SA-RLS further improves the upper bound of performance.

The median error comparison plot of the 15 datasets.
At the same time, we compare the CDF of the proposed method and the above KNN variant algorithms on 15 data sets. Figures 23–37 show the CDF comparison of the six algorithms on 15 datasets. The horizontal axis represents the range of error values, and the ranges vary for different charts. The vertical axis represents the cumulative proportion of error values that are less than or equal to the values on the horizontal axis. In the “friendly” dataset—the one with a smaller error range, the error distribution of all algorithms is relatively concentrated. In the “difficult” dataset—the one with a larger error range, the advantages of SA-RLS-GSA are more obvious. The error distribution of other algorithms has shifted significantly to the right, indicating that in complex datasets, the performance improvement brought by optimization algorithms is more crucial. At the same cumulative frequency, the error value corresponding to SA-RLS-GSA is significantly lower than that of other algorithms. The curve is steeper, indicating that the error values are more concentrated at lower levels. The advantage is more obvious on the “difficult” dataset, suggesting that this method has a stronger ability to adapt to the characteristics of the data. The performance is consistent across different datasets, with small fluctuations. Therefore, the algorithm we proposed has smaller error values, more concentrated error distributions, stronger robustness, and less performance fluctuations compared to other methods.

The CDF comparison chart of dataset 1.

The CDF comparison chart of dataset 2.
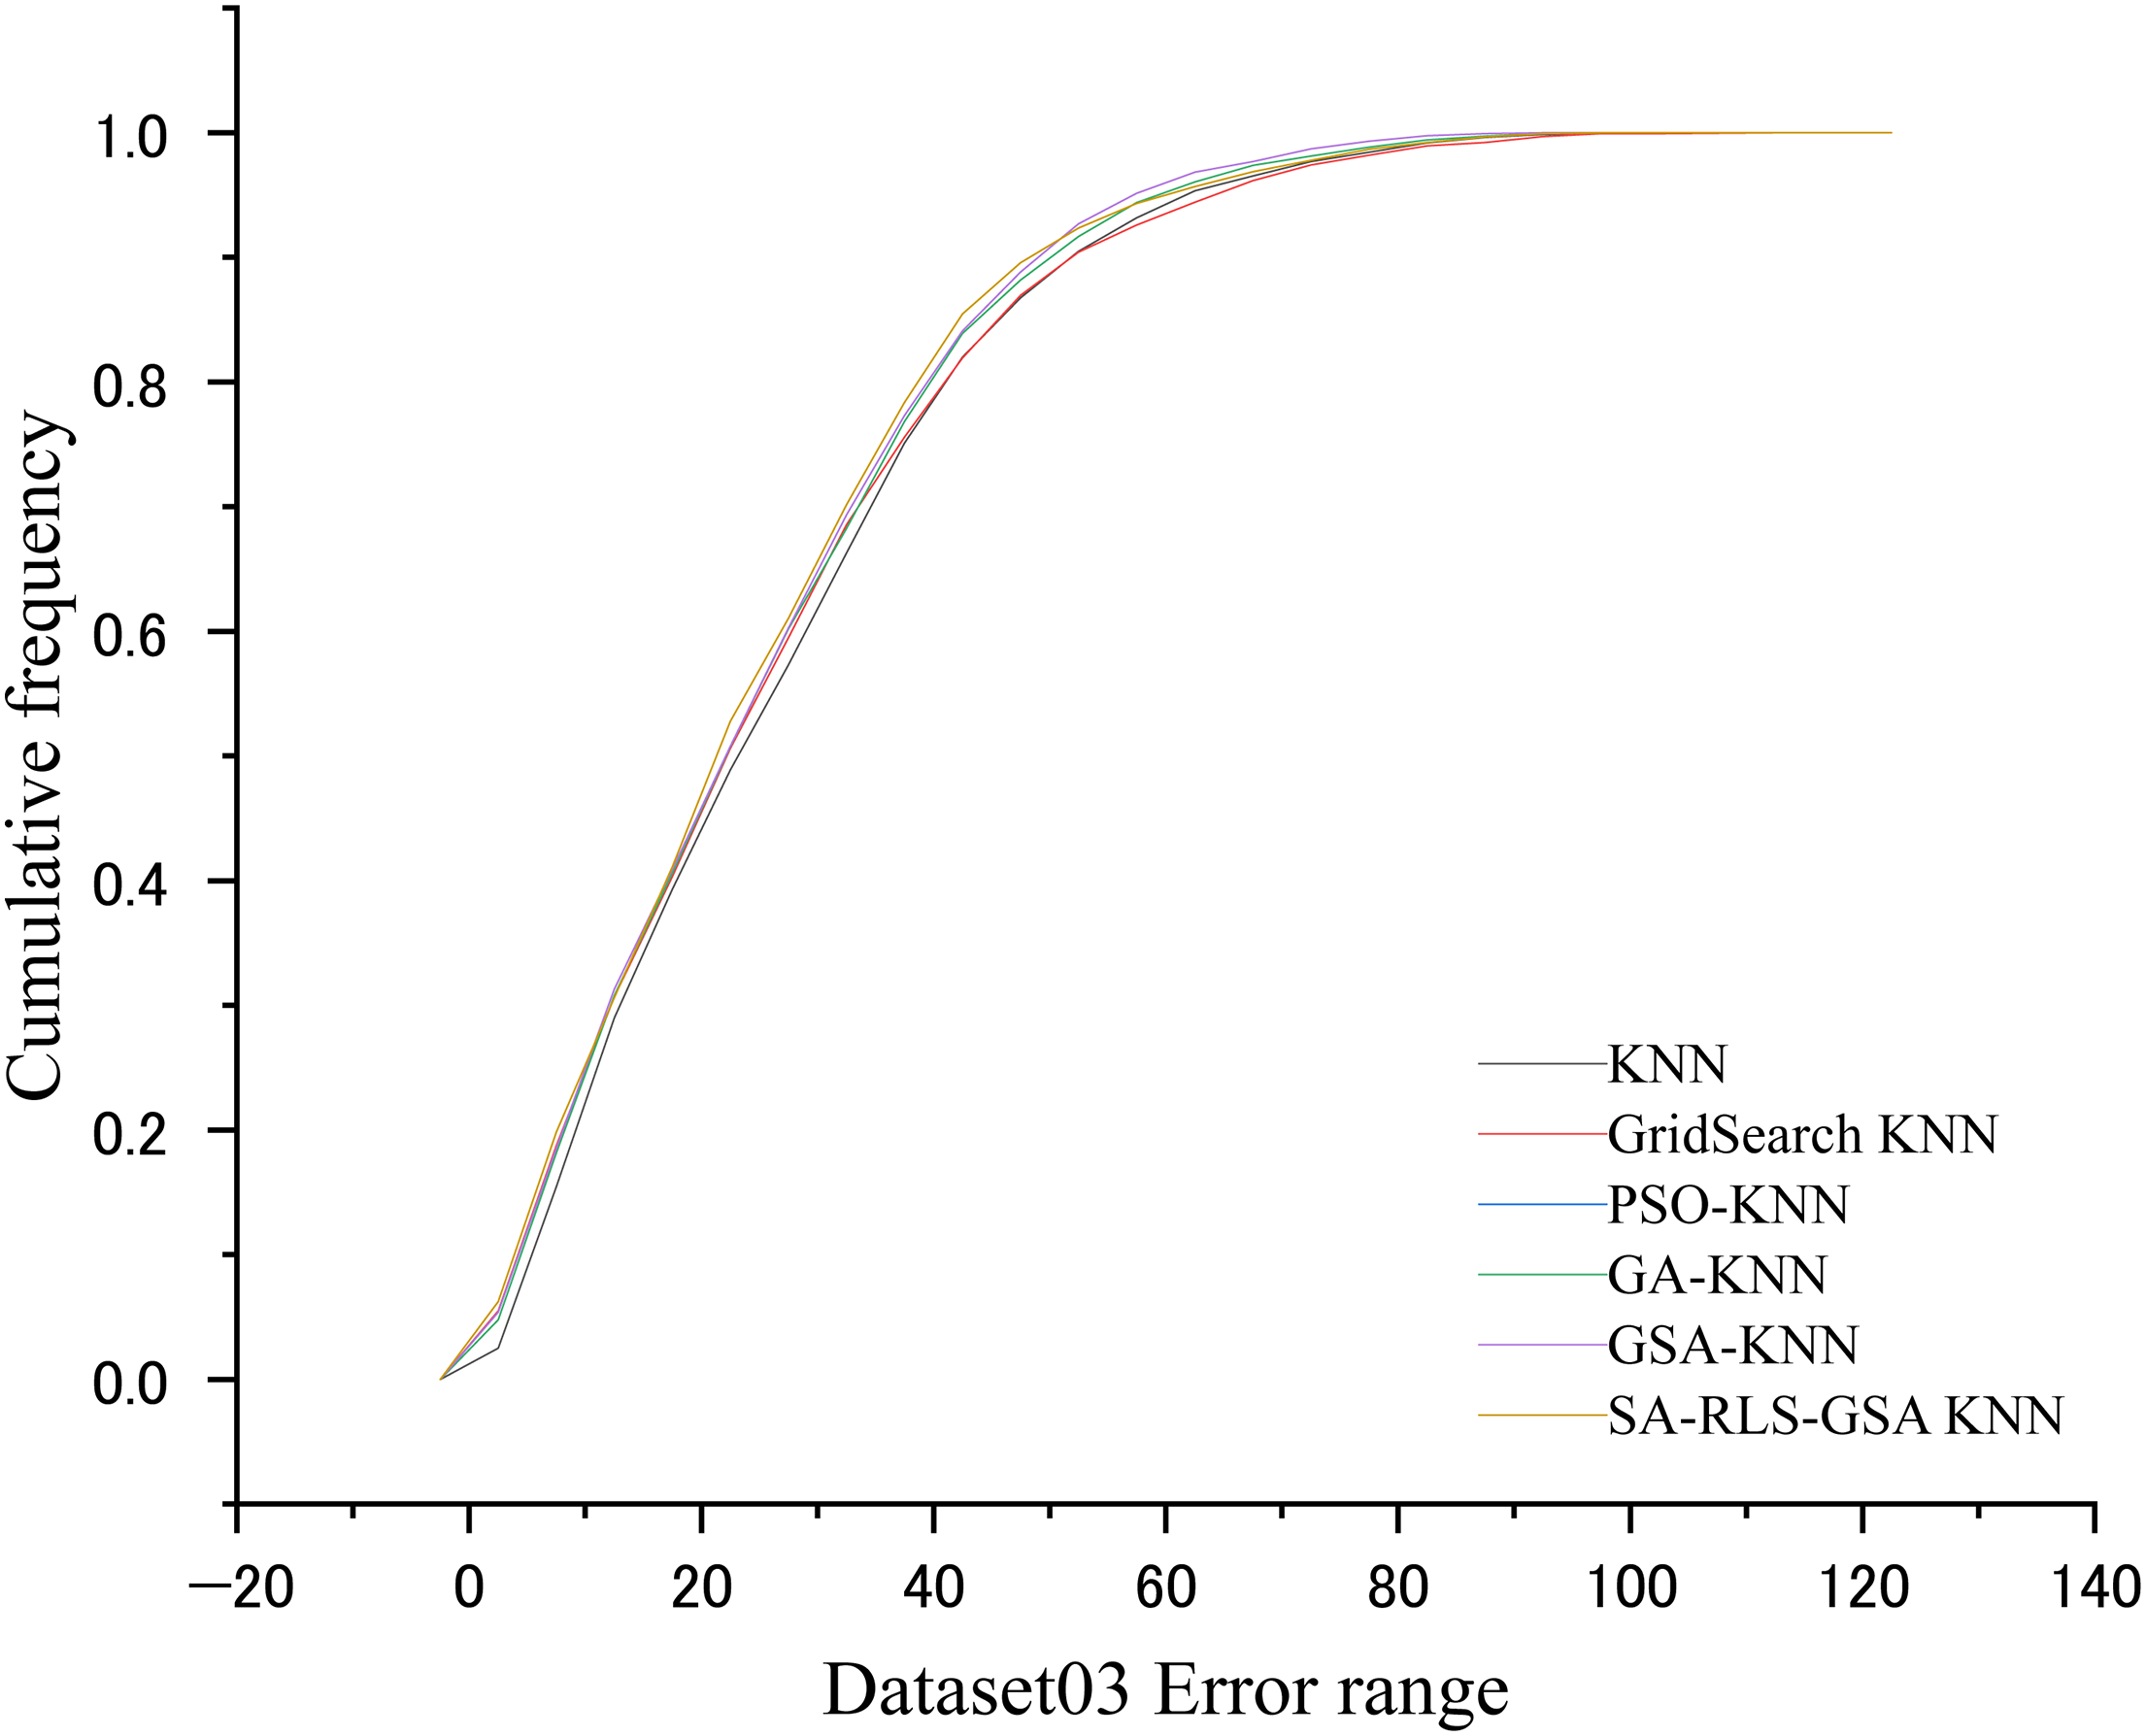
The CDF comparison chart of dataset 3.

The CDF comparison chart of dataset 4.

The CDF comparison chart of dataset 5.

The CDF comparison chart of dataset 6.
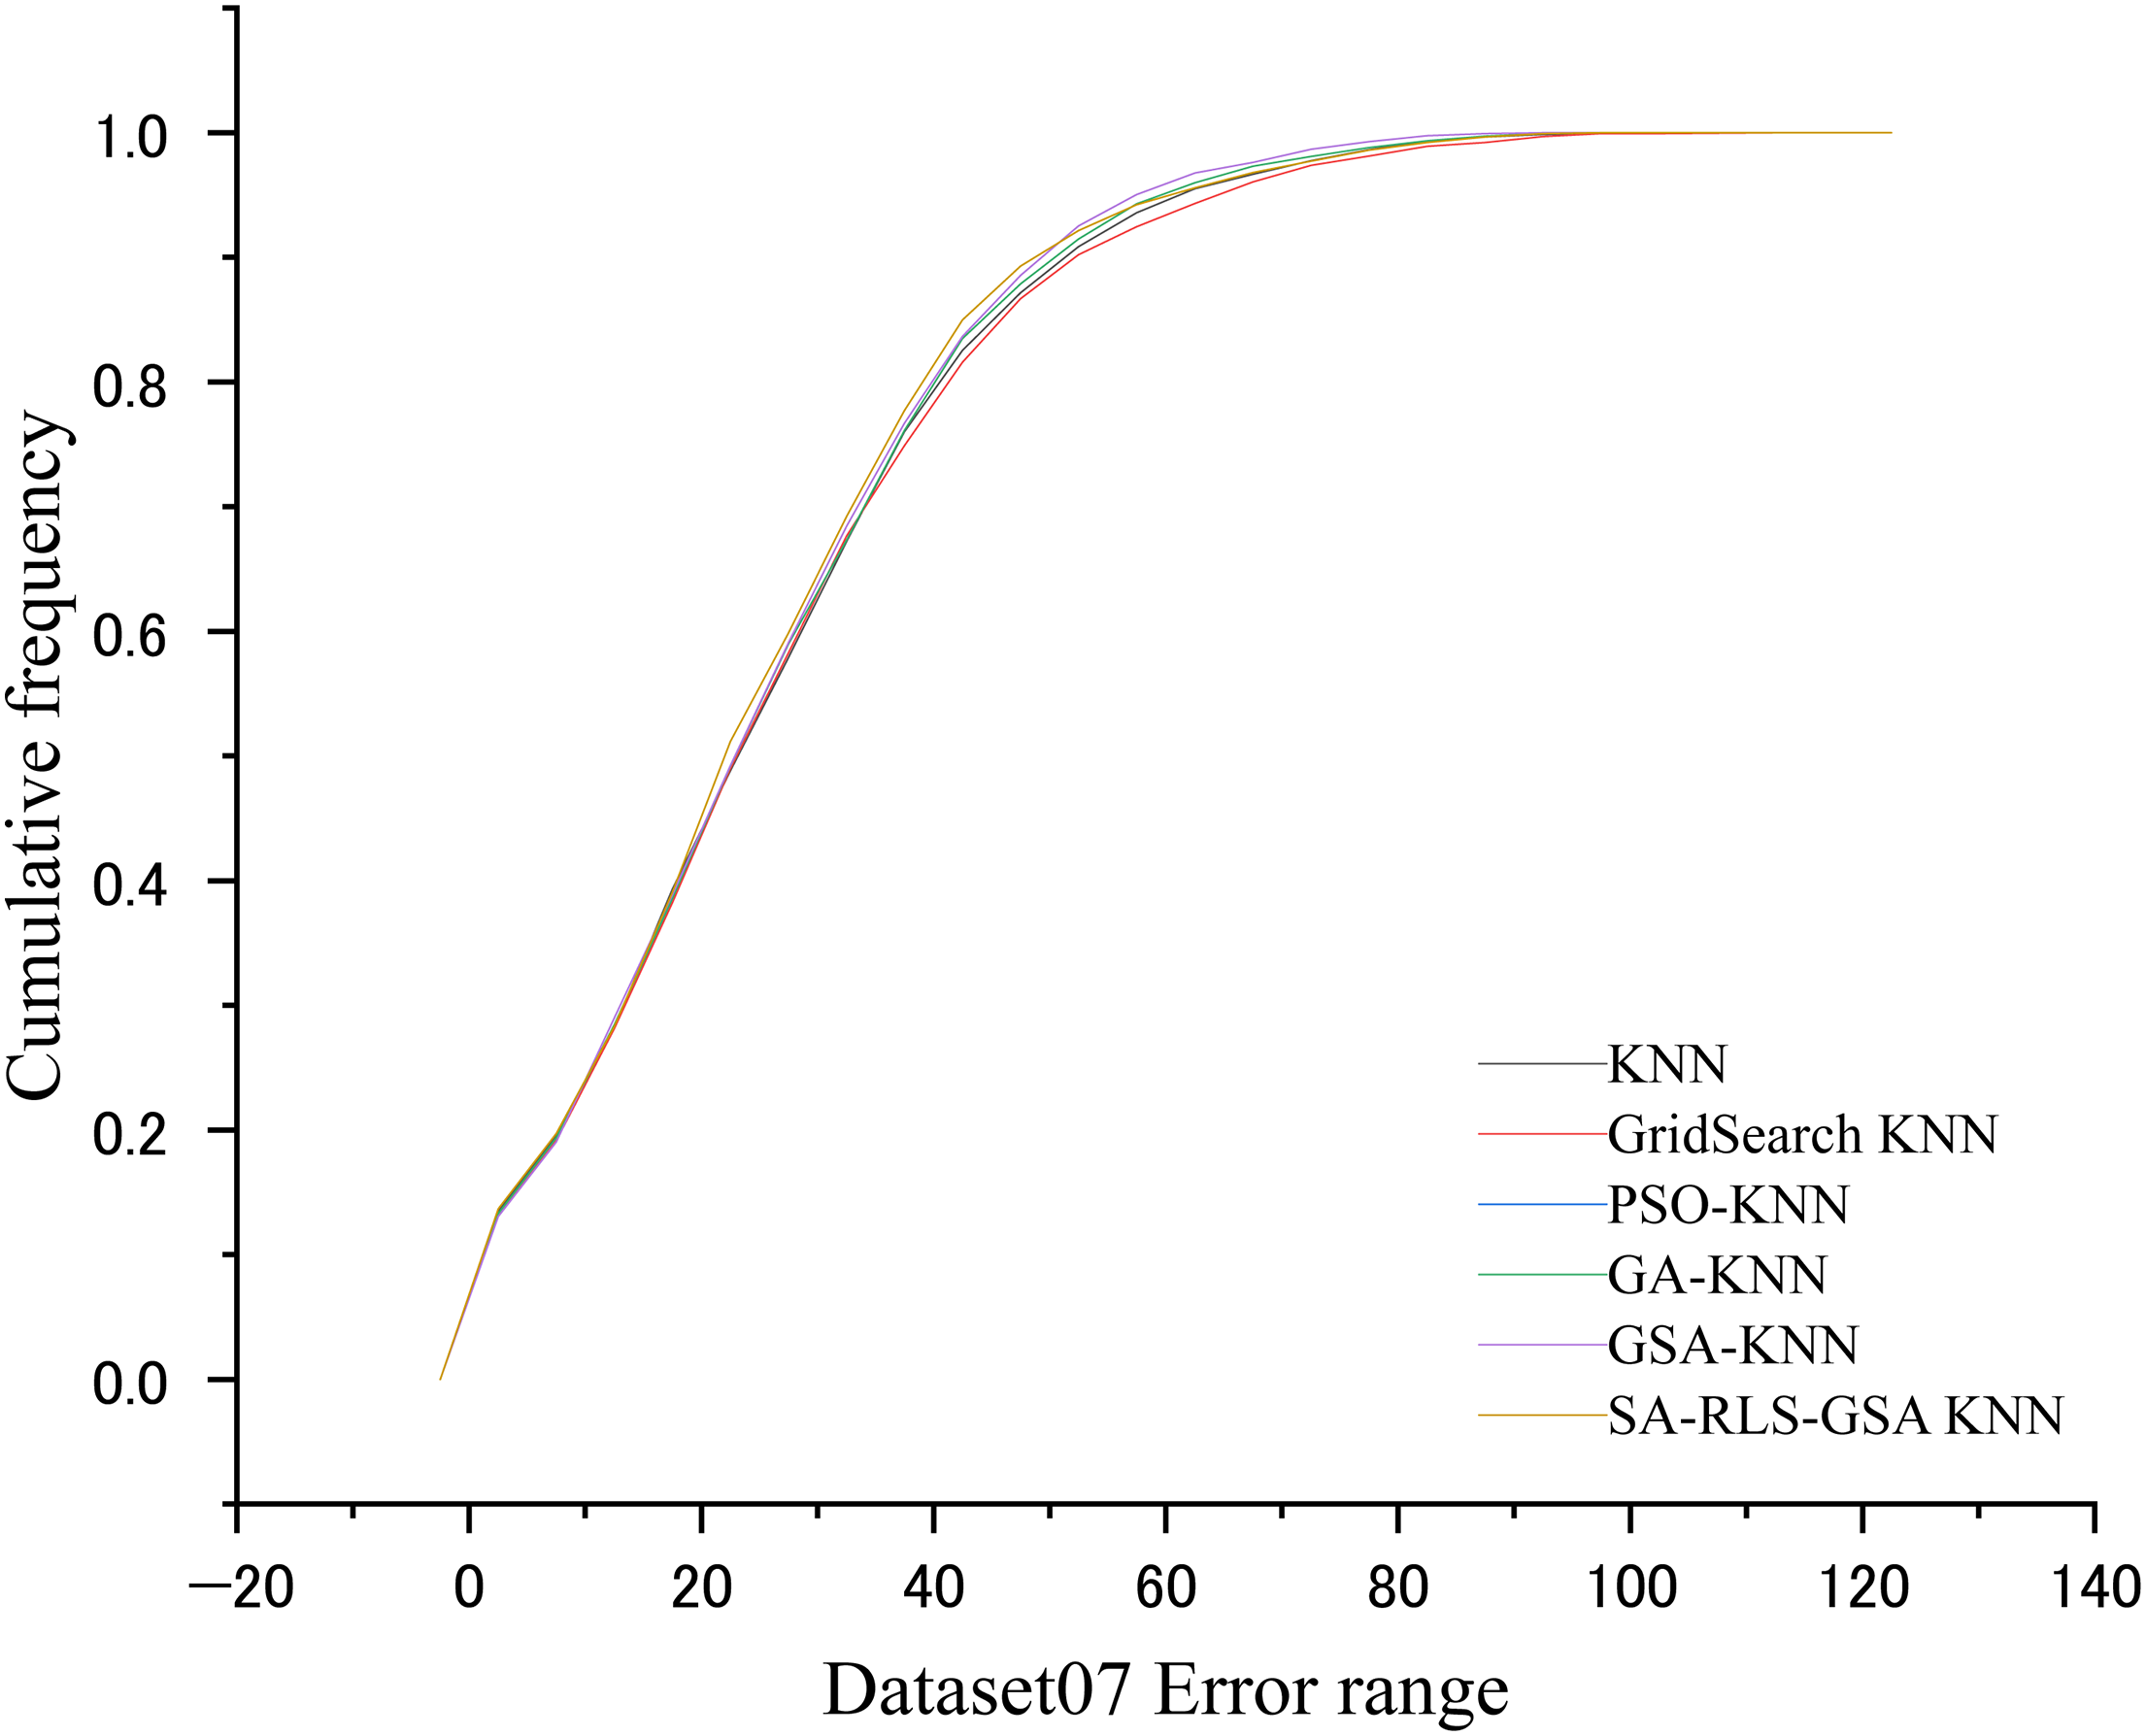
The CDF comparison chart of dataset 7.

The CDF comparison chart of dataset 8.
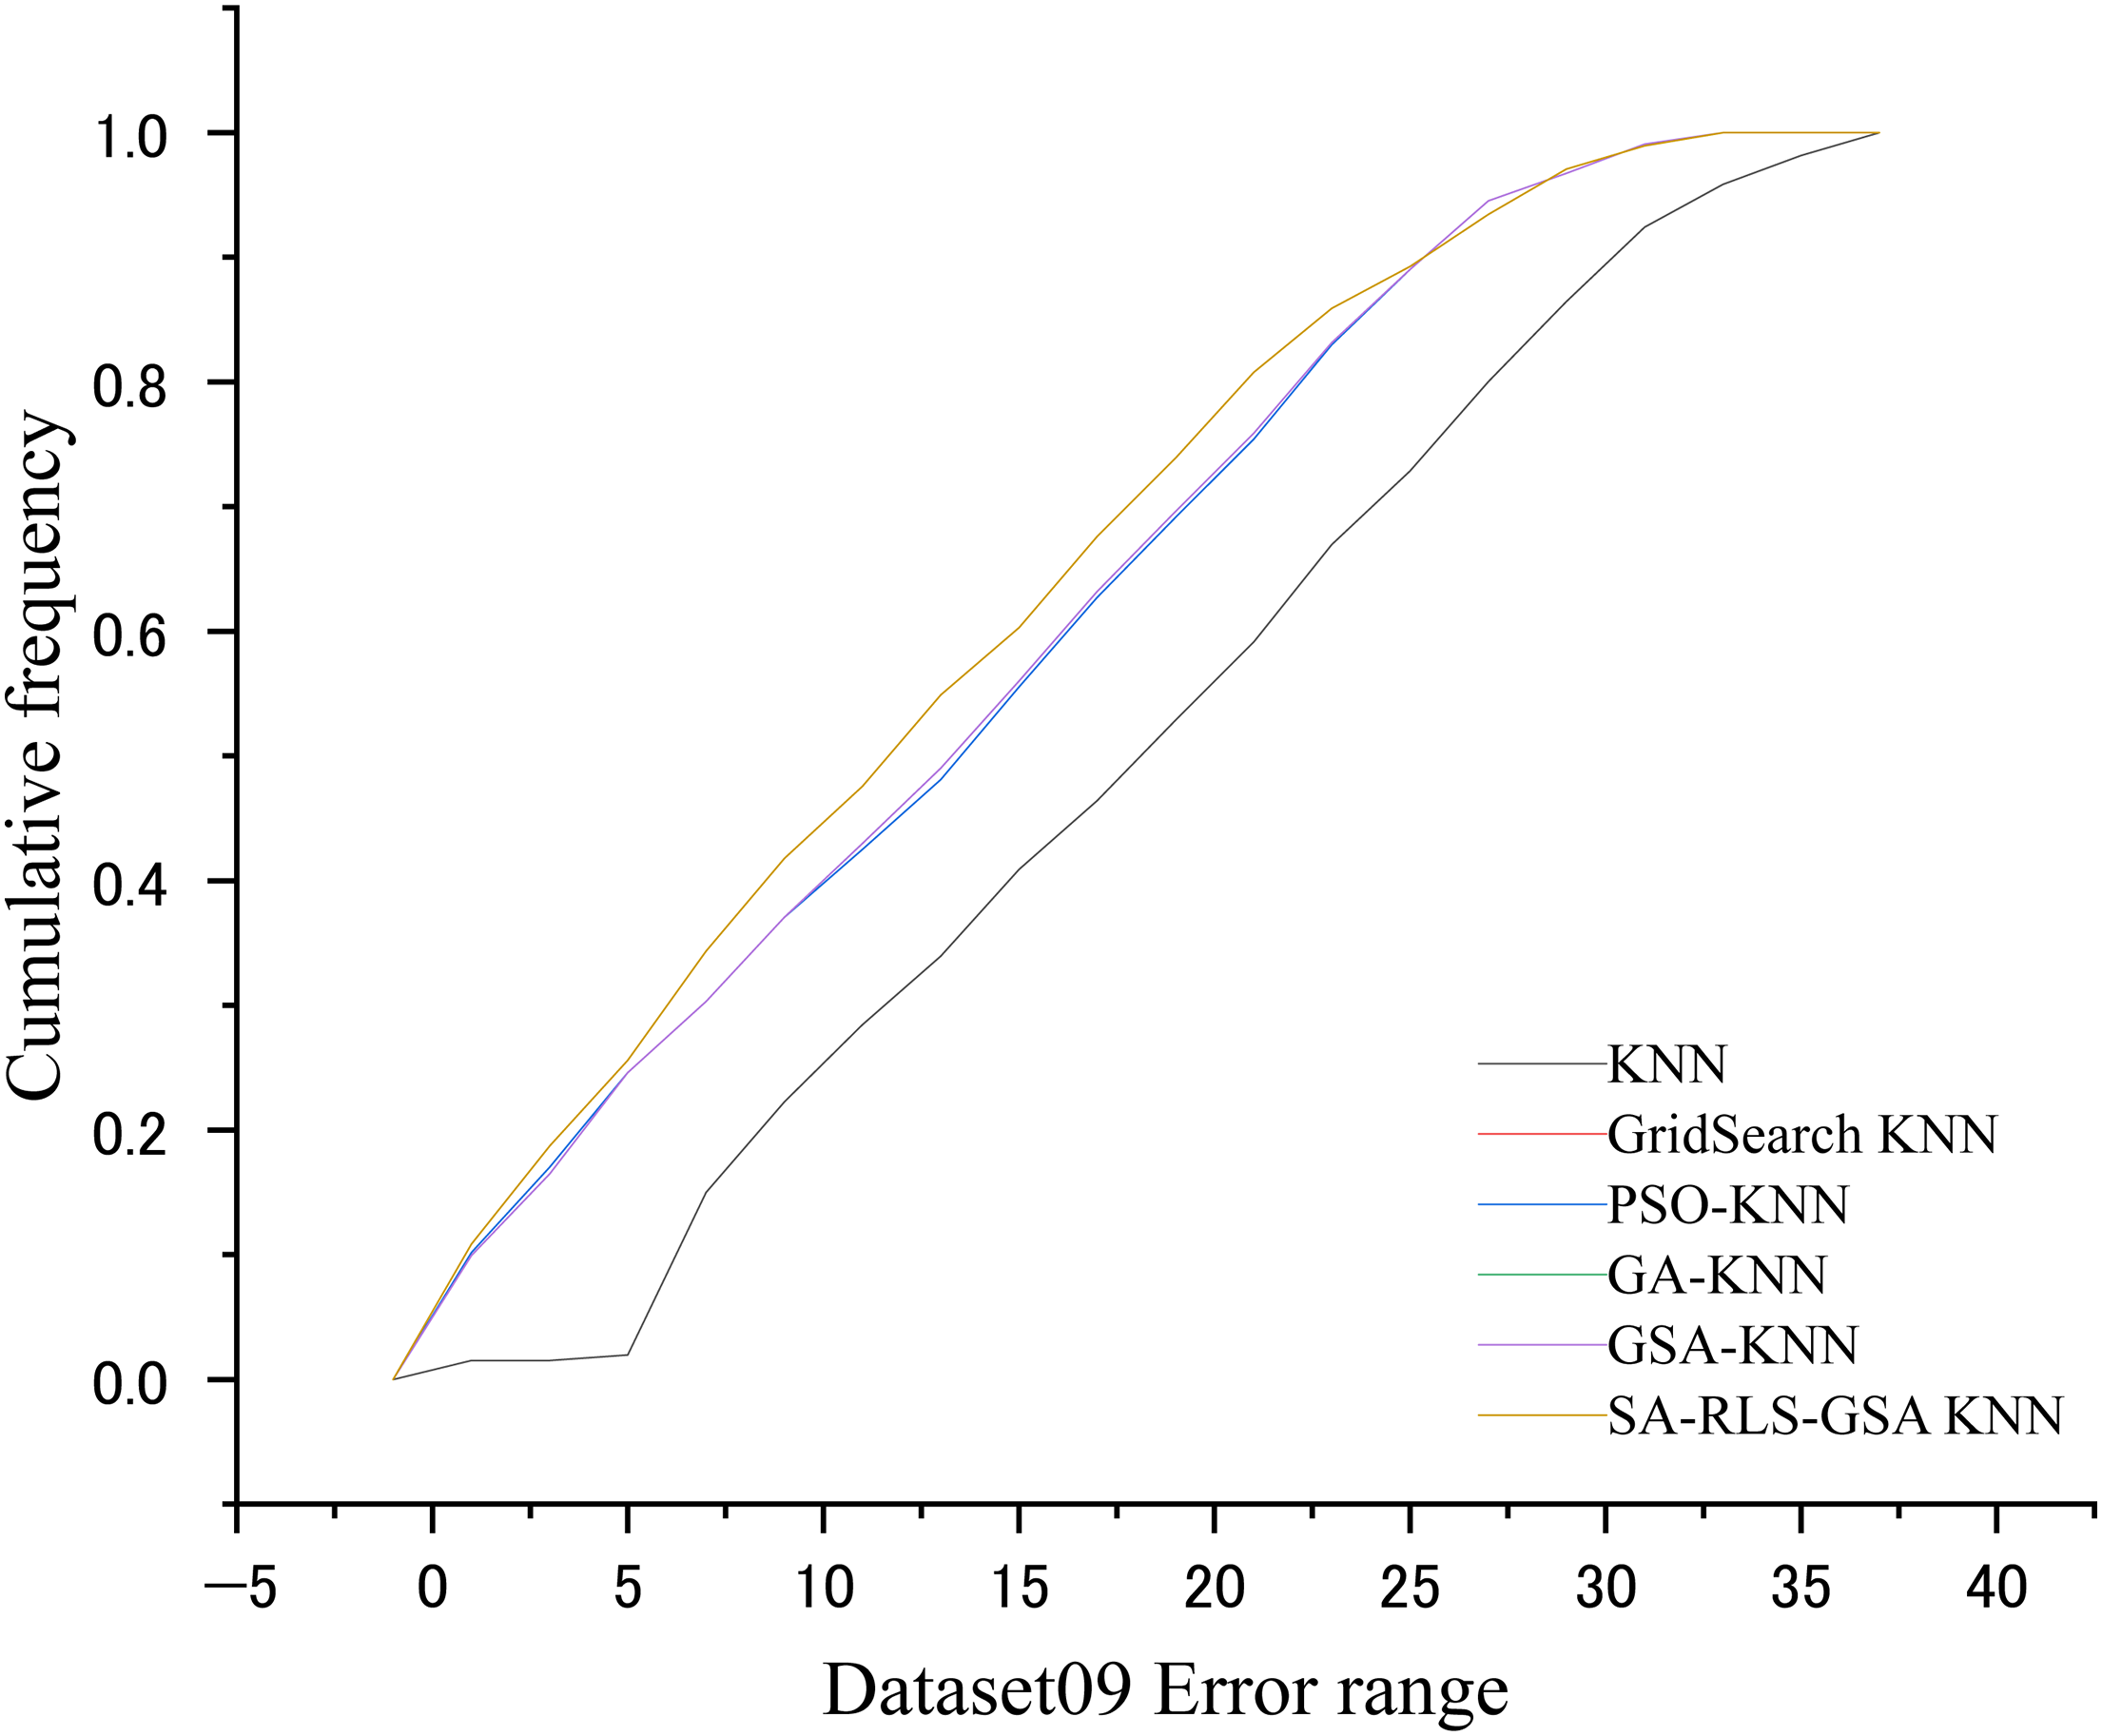
The CDF comparison chart of dataset 9.

The CDF comparison chart of dataset 10.

The CDF comparison chart of dataset 11.

The CDF comparison chart of dataset 12.

The CDF comparison chart of dataset 13.

The CDF comparison chart of dataset 14.

The CDF comparison chart of dataset 15.
Conclusions
In this paper, we introduced a method that uses a Sparse-aware RLS-driven gravitational search algorithm to optimize the dimension of the data set and determine the optimal K value for the KNN algorithm. By introducing Sparsity-aware RLS sparse filtering and NLOS suppression, the interference of invalid APs and NLOS signals is effectively eliminated. Through the analysis of 15 open-source datasets, the 15 WiFi datasets were compared with various algorithms. The algorithm's generalization ability and accuracy have been confirmed. Experimental results show that compared with baseline KNN, PSO-KNN, GA-KNN, and traditional GSA-KNN, the proposed method reduces MAE by an average of 20%, shortens running time by 50%, and has strong robustness in interference scenarios such as NLOS contamination, signal noise, and AP failure.
Footnotes
Acknowledgments
The author are very grateful to the “Research Project on the Architecture and Information Transmission Reliability of Multi-sensor Water Environment Monitoring System in Sanjiangyuan Area of Qinghai Province” and the “Kunlun Talents High-end Innovation and Entrepreneurship Plan of Qinghai Province” for their support.
Global research ethics and inclusion
Confirm that all research was conducted to the highest possible ethical standards, regardless of the requirements of the local setting.
Informed consent/patient consent
This article does not contain any studies with human or animal participants. There are no human participants in this article and informed consent is not required. All the data used in this paper are open-source datasets.
Author contributions
Haiming Lan: Methodology, Writing - Original Draft, Writing - Review \& Editing. Jun Ma: Validation, Formal analysis. Zhuang Xiong: Data curation, Software, Validation. Bohang Chen: Supervision, Project administration. Jinyu Fan: Project administration, Validation. Yong Niu: Formal analysis, Validation. All authors have read and approved the final version of the manuscript for publication.
Funding
The authors disclosed receipt of the following financial support for the research, authorship, and/or publication of this article: This work was supported by the Research project on the architecture of multi-sensing water environment monitoring system and its information transmission reliability in Sanjiangyuan area of Qinghai Province, the High-End Innovation and Entrepreneurship Talent Program of Kunlun Talents in Qinghai Province, (grant number 2021-ZJ-916, QHKLYC-GDCXCY-2020-056).
Declaration of conflicting interests
The authors declared no potential conflicts of interest with respect to the research, authorship, and/or publication of this article.
Data availability statement
The data is an open source dataset and is quoted in the article.