
Abstract
Regarding the pressure difference and time elements, this study innovatively employs indirect detection methods using the productivity/injectivity index to explore the related oil production mechanisms, the experimental process was strictly carried out according to standardized procedures, and the accuracy of the data was guaranteed. The comprehensive experimental results show that under carbon dioxide displacement conditions, two peaks appear on the trend line of the oil productivity index at 0.3/0.4 PV and beyond 0.3/0.4 PV. However, in different directions, one points toward breakthrough phenomena and the other toward extraction effects. Overall, the oil recovery index does not increase with pressure, and even shows a downward trend. This implies that although the final recovery rate increases in higher-pressure environments, the risk of wax-solid deposition blockage also rises significantly, impacting production capacity. In long rock core hot water displacement experiments, when the water injection ratio exceeds 1.2 PV, the cumulative effect of injected fluid at high pressure (53 MPa) effectively flushes out residual oil, differing from the effect observed at medium pressure (35 MPa). Comparing the two displacement modes, there is a significant difference stage in recovery rate exceeding 10% occurs after the displacement medium breakthrough. Therefore, the extraction effect of carbon dioxide should be continuously strengthened.
Keywords
Introduction
High pour point oil is a special type of crude oil, characterized by high wax content, high wax precipitation temperature, and high solidification point.1–3 In many mining scenarios, this oil reservoir is often found in low-permeability formations,4,5 making the mining process more complex.6–8 Traditionally, conventional cold water displacement mode is used for extracting such oils, but its recovery rates are usually low. However, carbon dioxide displacement offers advantages such as expansion, extraction, and improved fluidity.9–11 At the same time, hot water displacement can effectively avoid the adverse effects caused by lower temperatures. Therefore, for high pour point oil reservoirs, both carbon dioxide displacement and hot water displacement are methods worth exploring.12–14 Nevertheless, due to the unique properties of high pour point oil reservoir, carbon dioxide displacement may be conducted under high, medium, or low pressure conditions. Under these varying pressure states, the precipitation and deposition of wax substances may occur, which can clog the porous media and hinder effective crude oil extraction.15–17
The injection of carbon dioxide as a displacement medium into oil reservoirs has a dual significance of utilization and storage. 18 However, considering multiple factors such as pore-scale, heterogeneity, and variations in flow parameters, multiphase flow processes are often accompanied by complex physical and chemical reactions.19–21 The displacement system of carbon dioxide-crude oil usually has the characteristics of multistage reactions, and mass transfer studies provide quantitative evidence of intermediate-contact extraction mechanisms that directly govern miscibility development.22,23 The displacement mode covers both miscibility and immiscibility, and the special mode of near-miscibility. Studies have shown that the vicinity of the near-miscibility pressure range and the leading edge positon of the near-miscibility pressure range are also the pressure ranges with obvious characteristics of displacement phenomenon and worth exploring. The threshold-pressure dynamics and flow-transition mechanisms in near-miscibility mode were fully elucidated, especially for unconventional reservoirs, the oil displacement efficiency can also show excellent performance. 24 Relevant literature provides references for asphalt blockage problems in heavy oil carbon dioxide displacement processes. Thus, when studying blockage issues encountered by high pour point oil during carbon dioxide displacement, borrowing research methods from heavy oil asphalt blockage comes to mind first. According to relevant literature, solvents like n-heptane can be used to separate asphalt deposits from crude oil in porous media.25–27 However, in the case of wax-solid deposition blockages in high pour point oil, wax occupies an absolute dominant position in the blockage material. As wax is a part of hydrocarbons, its carbon number is usually above C15. 28 Thus, it is challenging to find a solvent that can distinctly separate this portion of hydrocarbons for independent mechanism studies. To facilitate research, this type of wax-based sedimentary material as wax-solid deposition is referred. Current literature rarely mentions effective methods for directly or indirectly exploring and feedbacking the mechanism of wax-solid deposition and blockage mechanism in the process of carbon dioxide displacement of high pour point oil. This study selects porous media (sand filled and coiled slim tube and long rock cores) as the main carrier for the displacement process and adopts an innovative indirect detection method to explore the mechanism of wax-solid deposition blockage. During the experimental testing phase, slim tube experiments and long rock core experiments are conducted separately. Through parameters such as oil recovery index, injectivity index, and final recovery rate, the mining performance of carbon dioxide displacement and hot water displacement under different pressure conditions are evaluated and analyzed from various angles. It is hoped that the research methodology and data patterns proposed in this article will fill gaps in related fields.
Experimental preparation
Properties of crude oil
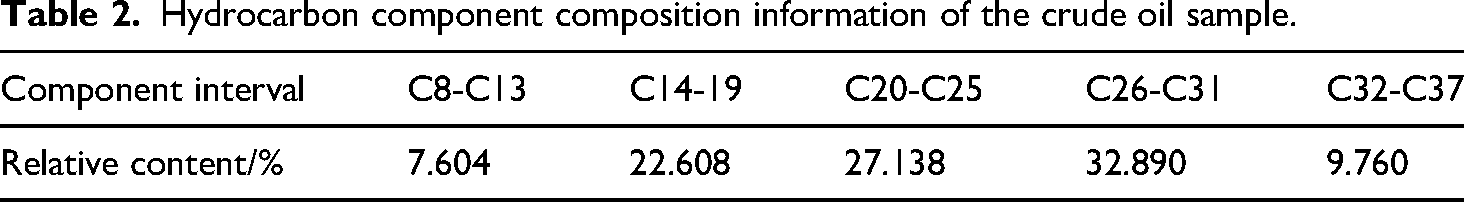
The crude oil sample used for configuring active oil in this experiment was collected from the typical high pour point oil block JG-2 in Liaohe Oilfield. The high pour point oil properties on the surface of JG-2 block are mainly high pour point and high wax content. The freezing point is above 43 °C, the wax content is greater than 35%, and the wax precipitation temperature is about 60 °C. The specific properties are shown in Tables 1 and 2.
Basic parameters of high pour point crude oil in the target block.

Hydrocarbon component composition information of the crude oil sample.
The crude oil in this block has lower fluidity than light oil due to its high wax content. However, the content of high pour point asphalt and resin in this block is not high. From Figure 1, it can be seen that the viscosity of crude oil is not high above the wax precipitation temperature, and the viscosity decreases significantly with increasing temperature. Under the same shear stress, the shear velocity increases and the fluidity improves, and the flow characteristics are no different from those of general Newtonian fluids.
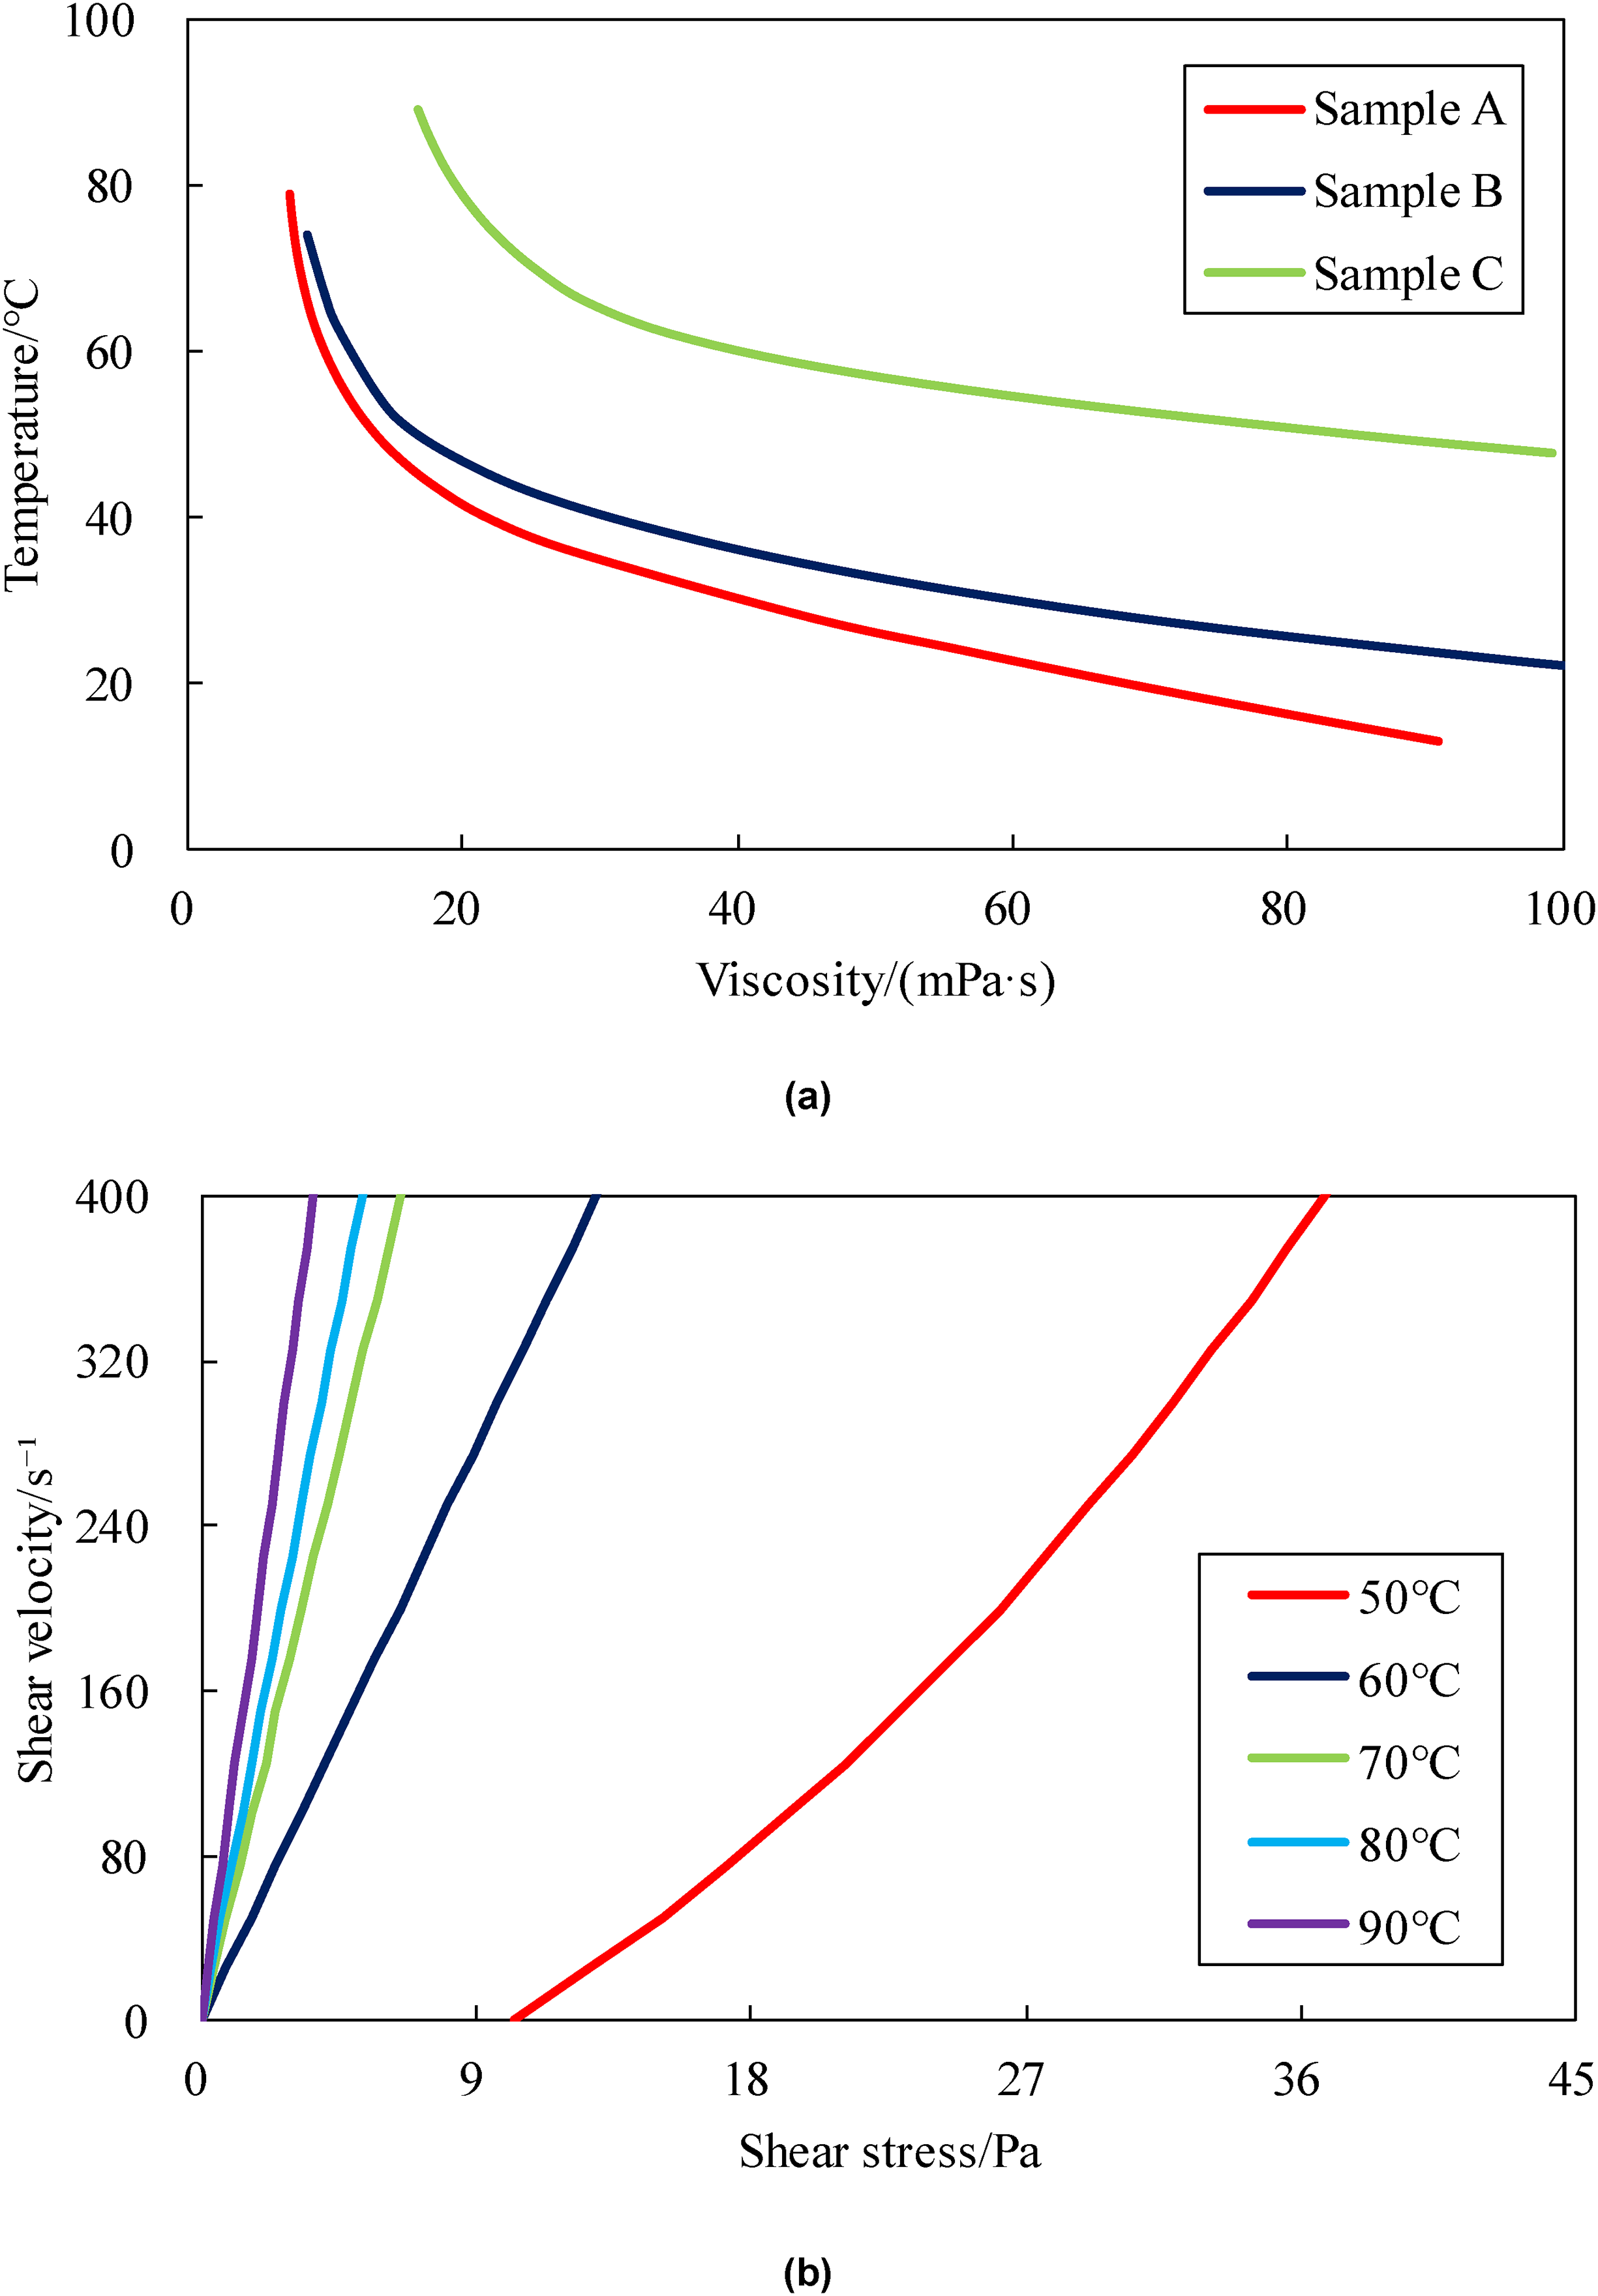
Crude oil property characteristic curves: (a) viscosity–temperature curve and (b) rheological curve.
Slim tube testing system
The core equipment of the slim tube testing system includes sand filled and coiled slim tubes, configurator of formation fluid, constant temperature air baths, high-pressure displacement pumps, back pressure controllers, and gas meters. Additionally, auxiliary equipment like gas booster pumps, electronic scales, and density meters are included. The total length of the slim tube model is 12 m, with porosity and permeability of 48% and 5553 × 10−3 μm2, respectively. The specific parameters are detailed in Table 3.
Detailed parameters of sand filled and coiled slim tube body.

Long rock core testing system
The long rock core testing system includes equipment such as long rock core clamps and intermediate containers, along with devices similar to those in the slim tube testing system. The length of the long rock core used in the experiments is approximately 50 cm, with porosity and permeability parameters consistent with the physical properties of the target layer in the reservoir. Specifically, the porosity and permeability use the actual parameters of the reservoir, with an average porosity of 20% and an average permeability of 350 × 10−3 μm2. The specific parameters are shown in Table 4.
Detailed parameters of long rock core.

Compound of active oil
Combining the total hydrocarbon composition information and the oil-to-gas ratio information of the formation crude oil, active crude oil is prepared. This batch of oil samples is used simultaneously for both the slim tube experiments and the long rock core experiments.
Formation water
The formation water is configured according to the composition of the water in the target formation, the total mineralization degree is about 3350 mg/L, and the specific ion composition information is shown in Table 5.
The specific ion composition information of formation water.

Carbon dioxide
Carbon dioxide with a purity of 99.999% is used.
Experimental procedures
Slim tube experiment plan
Carbon dioxide is injected into the pipeline until it reaches the inlet valve of the slim tube model, and the injection gas pressure is adjusted to 0.2∼0.3 MPa higher than the experimental pressure. The initial position of the pump at this pressure is recorded. The constant pressure method is used to conduct the oil displacement experiment at the experimental temperature and pressure. For each 0.1 PV injected, the output oil, gas volume, and pump position are measured. Once the cumulative injection amount exceeds the set PV number, the oil displacement process stops and the recovery rates for different injection volumes are calculated. A graph showing the relationship between recovery rate and injection volume is plotted.
To determine the minimum miscibility pressure (MMP), the experimental pressure at the same experimental temperature is adjusted, and the reserve recovery rate and final recovery rate under different experimental pressures are measured. Typically, the set experimental pressure points should include more than three points where the final recovery rate is greater than 90%, and others less than 90%. A scatter plot of the relationship between recovery rate and experimental pressure should be drawn, with trend lines intersecting at the MMP point. In this experiment, since the MMP exceeded the pressure capacity limit of the slim tube model, linear fitting was applied using points below 90% to obtain the MMP.
Experimental plan for long rock core displacement
The study was conducted according to industry standards (SY/T 6573-2016) 29 for slim tube experiments conduct research on slim tube experiments. Since the minimum miscibility pressure in this experiment surpassed the pressure limit of the slim tube model, a trend line for the scattered points with a recovery rate below 90% was determined. Through seven test points, the final MMP for the block was determined as 75 MPa (see Figure 2). Considering factors such as the fracture pressure limits of rocks, the design pressure in actual production usually does not exceed 75 MPa. Therefore, two sets of gas displacement experiments were arranged under long rock core conditions: One set was conducted at 35 MPa, referred to as the medium pressure condition, and the other set at 53 MPa, near the leading edge position of the near-miscibility pressure range, referred to as the high pressure condition. In the 35 MPa experiment, the displacement environment temperature was matched to the target reservoir, which is 60 °C. The experiment started by saturating the formation with water, followed by injecting compound active oil for carbon dioxide displacement, and stop injection when 1.2 PV was reached. Additionally, under the same long rock core specifications, two sets of hot water displacement experiments were designed, with the hot water temperature also set to 60 °C.

Find the minimum miscibility pressure point-line chart.
Productivity and injectivity index
To address the differences in production and injection volumes under various time and pressure conditions, the concepts of Ipm−c and Iim−c were introduced for parallel comparison of the extraction and injection stages. To summarize the relevant characteristics during the water displacement process and referencing the concept of indices under gas injection conditions, the concepts of Ipm−w and Iim−w were defined for water injection conditions to facilitate comparative analysis.


where I is the productivity/injectivity index (cm3/(MPa·min)), m the different injection media, including carbon dioxide and water, qp the production volume (cm3), qi the injection volume (cm3), and t and Δp the time (min) and pressure difference (MPa), respectively.
Results analysis
Index changes
Characteristics of changes in carbon dioxide displacement index
For the carbon dioxide displacement experiment, when we initially inject carbon dioxide into the rock core, the main role played by carbon dioxide is displacement. Carbon dioxide exhibits a piston-like flow of crude oil towards the outlet end. When a large amount of carbon dioxide appears at the outlet end, the gas behavior is called breakthrough. At this time, the ratio of gas to crude oil will increase sharply, that is, the gas oil ratio (GOR) value will suddenly become large. When calibrating the characteristic experimental data points, we also determine the breakthrough point by observing the sudden change in GOR. Figure 3 shows the variation characteristics of GOR curves under two different pressure conditions. We can clearly observe that the breakthrough points of carbon dioxide under 35 and 53 MPa pressure conditions are 0.3 and 0.4 PV, respectively. After the breakthrough of carbon dioxide, the continuous reaction between carbon dioxide and crude oil trapped in the porous medium increases the scattered contact frequency. The main role of carbon dioxide in this process after the breakthrough is extraction.

Gas oil ratio curves under two different pressure conditions: (a) 35 MPa and (b) 53 MPa.
After organizing the experimental data and applying the Ipm and Iim index calculation formulas, the productivity index and injectivity index under different PV conditions were obtained. Based on these results, Figure 4(a) and (b) were plotted to show the curves that change with increasing injection volume.

Comparison of trend curves of productivity/injectivity index under different pressure conditions (displacement medium: CO2): (a) productivity index and (b) injectivity index.
From Figure 4(a), it can be seen that the productivity index curves under both 53 and 35 MPa exhibit similar morphological characteristics, both containing two peaks with relatively large index values. However, these peaks have different physical meanings. With the 35 MPa curve as an example, the first peak corresponds to the gas breakthrough stage, while the second peak reflects the behavior when the extraction effect reaches a certain extent.
Figure 4(b) shows that in terms of postbreakthrough injectivity index, there is a more noticeable difference between the two pressure conditions. Overall, compared with the productivity index at 35 MPa conditions, both the productivity index and the injectivity index at 53 MPa show a decreasing trend. This indicates a significant wax-solid deposition phenomenon occurs in the range of 35 to 53 MPa, suggesting that the displacement effect does not increase linearly with pressure but is limited by deposition phenomena at a certain stage.
Characteristics of changes in hot water displacement index
Two sets of water displacement experiments were established using artificial cores with the same physical properties as those in the carbon dioxide displacement experiments, maintaining consistency in active oil and formation water. The displacement pressures for the two experiment sets were set at 35 and 53 MPa, with a temperature of 60 °C. The relevant index was calculated using index formulas, and the corresponding charts were drawn.
Figure 5(a) displays the trend line of the productivity index under hot water displacement conditions. It can be seen that the productivity index under hot water displacement conditions is lower than that under carbon dioxide displacement conditions, and their curve shapes also show different characteristics. The productivity index trend line under hot water displacement conditions has only one peak, which appears before the breakthrough and no peak after it. This phenomenon aligns with the mechanism of residual oil displacement, where hot water displacement lacks the extraction effect, hence no second peak appears on the productivity index trend line like in carbon dioxide displacement.

Comparison of trend curves of productivity/injectivity index under different pressure conditions (displacement medium: water): (a) productivity index and (b) injectivity index.
Figure 5(b) shows the injectivity index curve. For the injectivity index, the indicators under different pressure conditions actually display differences after the breakthrough, mainly due to changes in the flow field of the oil displacement environment after the breakthrough.
Comparison of recovery rates
Figure 6(a) presents the trend lines of recovery rates under carbon dioxide displacement. It shows significant differences in recovery rates after the breakthrough between the two conditions of 35 and 53 MPa. Specifically, in the postbreakthrough stage, the recovery rate at 53 MPa is about 10% higher than at 35 MPa. This implies that although wax-solid deposition is prominent at 53 MPa and affects the productivity index, it does not affect the final recovery rate.
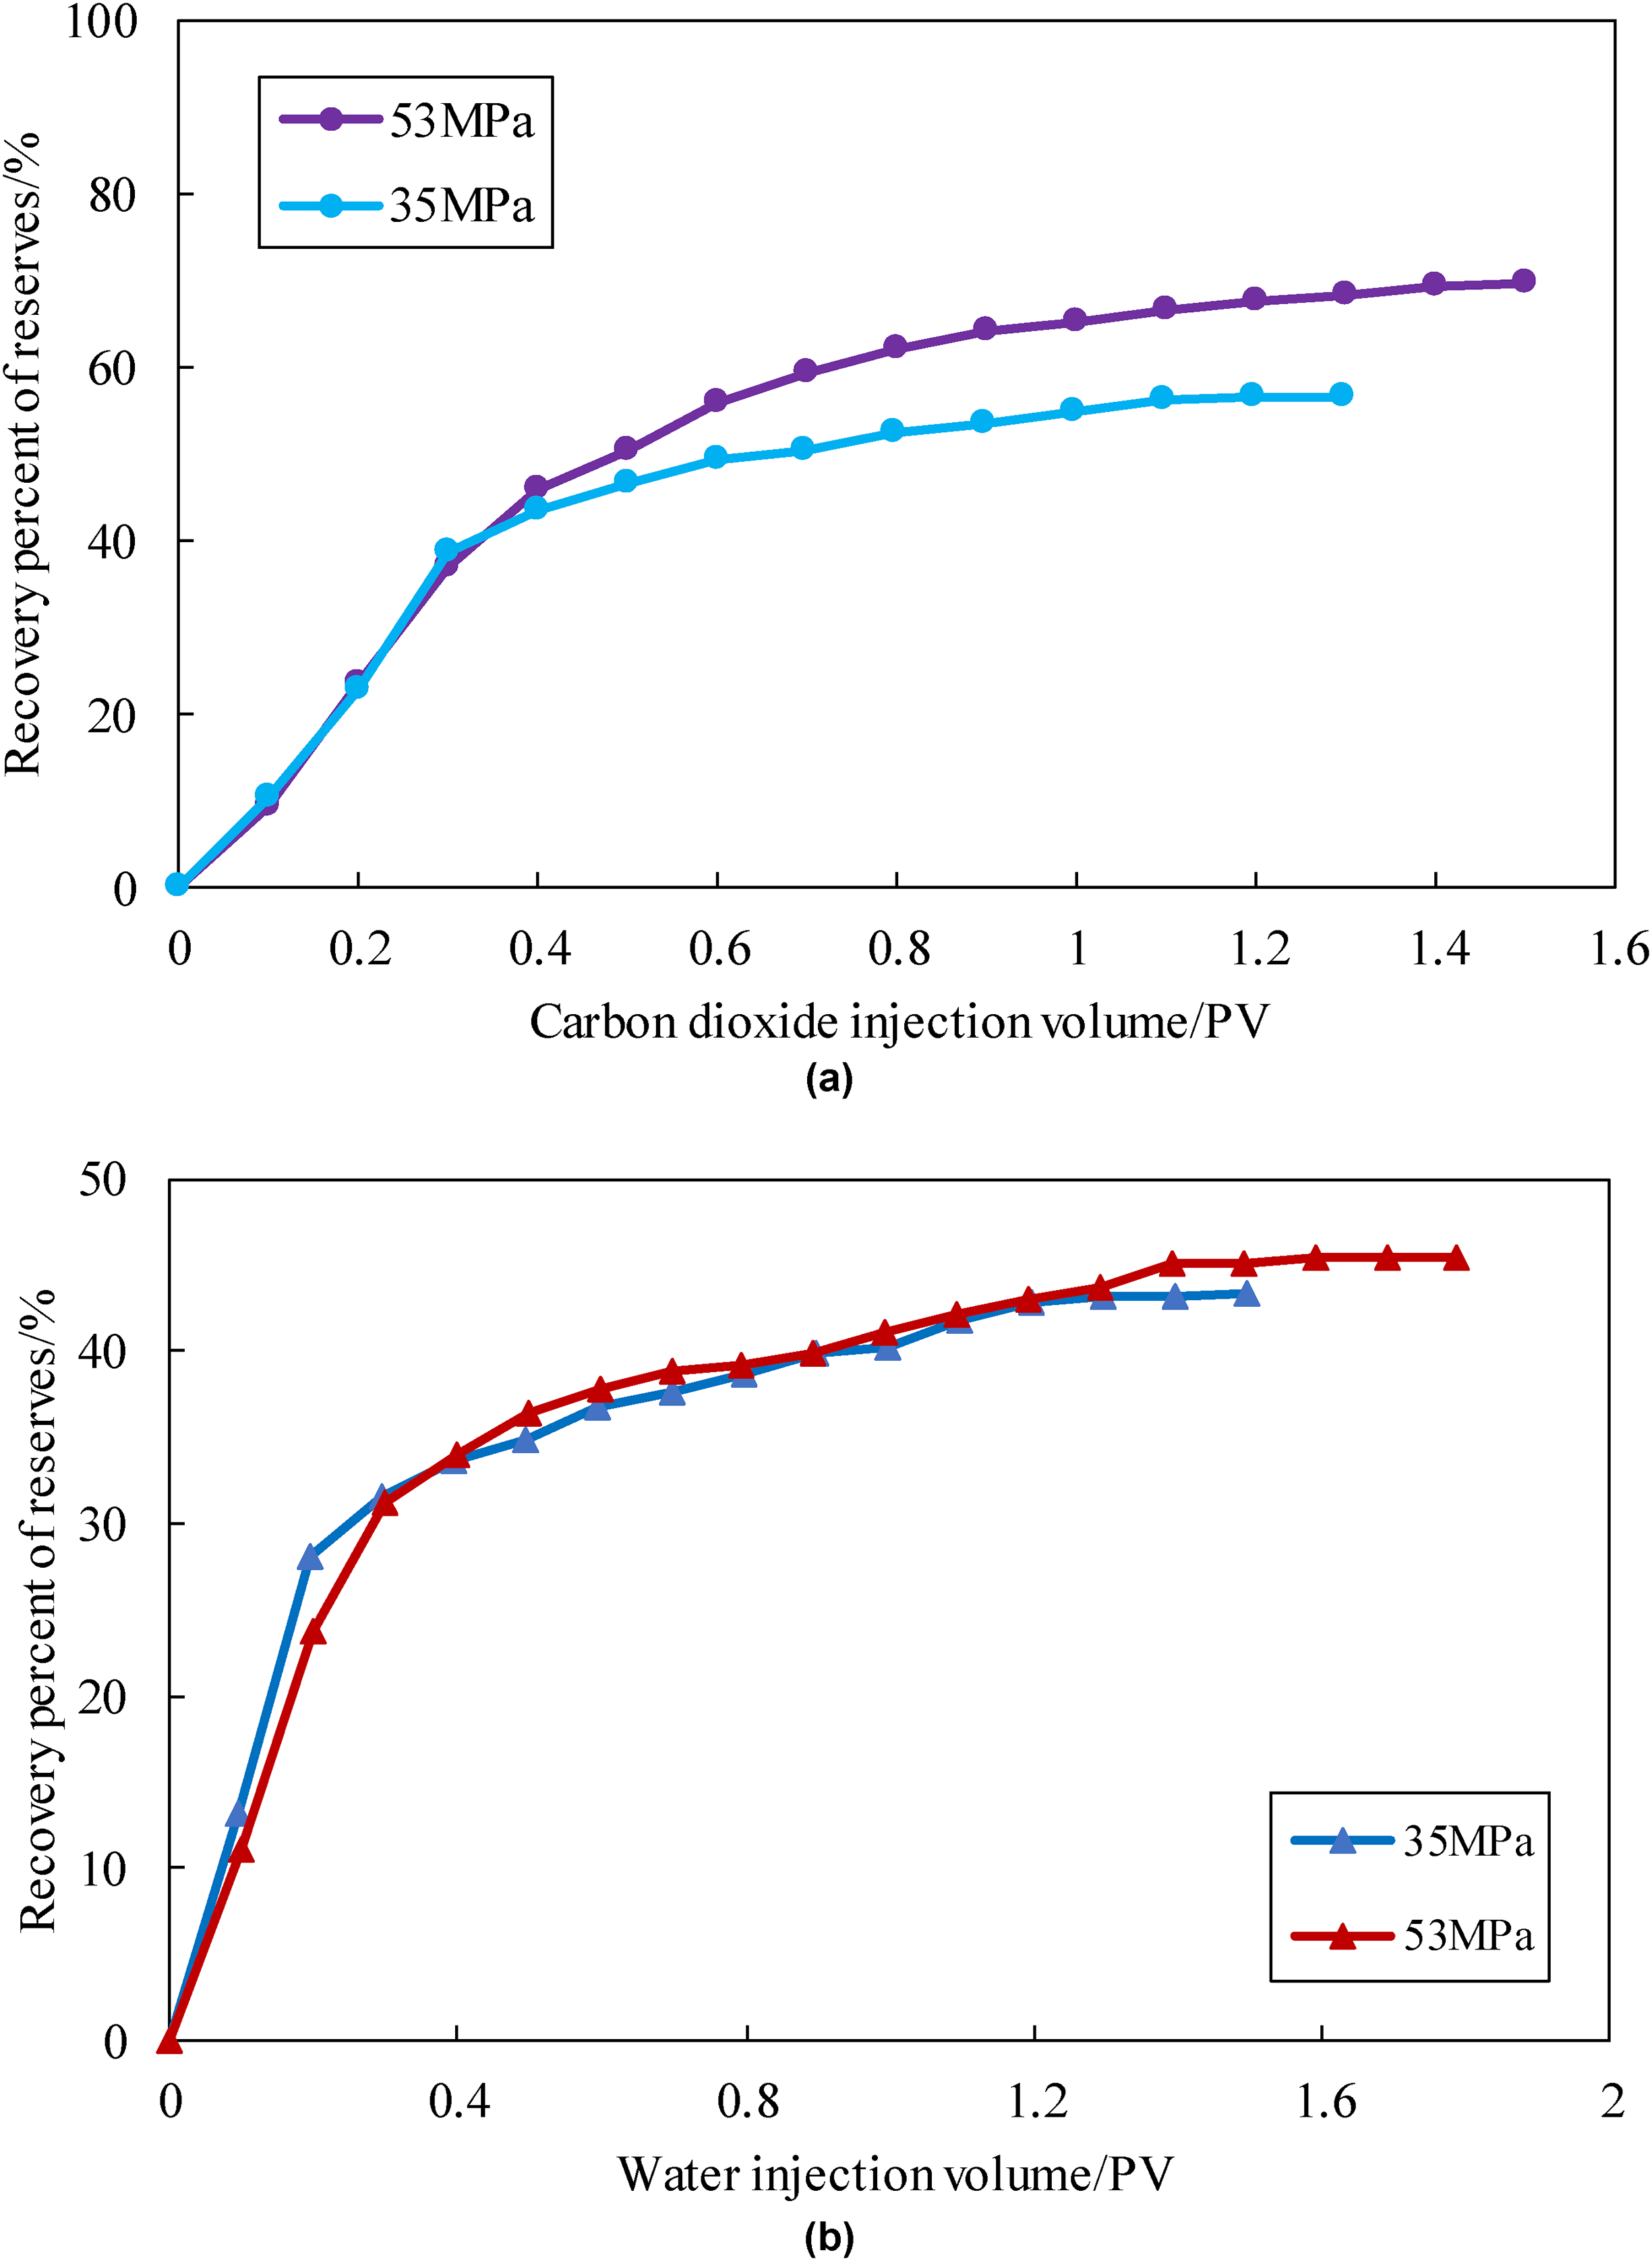
Comparison of recovery percent of reserves: (a) carbon dioxide displacement mode and (b) hot water displacement mode.
Figure 6(b) provides the trend lines of recovery rates under hot water displacement. In terms of recovery rates, the final recovery rates in both experiments are similar, around 45%, slightly below the ultimate development effect of the gas displacement mode. At 1.2 PV, the final recovery rates under both pressure conditions are comparable. However, when the water injectivity ratio exceeds 1.2 PV, the recovery rate under 53 MPa is slightly higher than that at 35 MPa. This is because, in the later stages of displacement, the cumulative effect of high-pressure injection fluid leads to more effective flushing of the residual oil.
Figure 7 shows the oil samples obtained at the outlet end under both pressure conditions at 1.3 PV. It is apparent that the oil content extracted at 53 MPa is significantly higher than at 35 MPa, further confirming the mechanism of the cumulative effect. In addition, it can be observed that the recovery rate differences between carbon dioxide displacement and hot water displacement are minor before the breakthrough, while the substantial differences are formed after the breakthrough. Therefore, in practical mining technology applications, it is necessary to deeply consider the enhanced recovery mechanisms following breakthroughs in carbon dioxide displacement technology. While the production cost of hot water displacement technology is relatively low, cost factors should be comprehensively considered in technology selection.
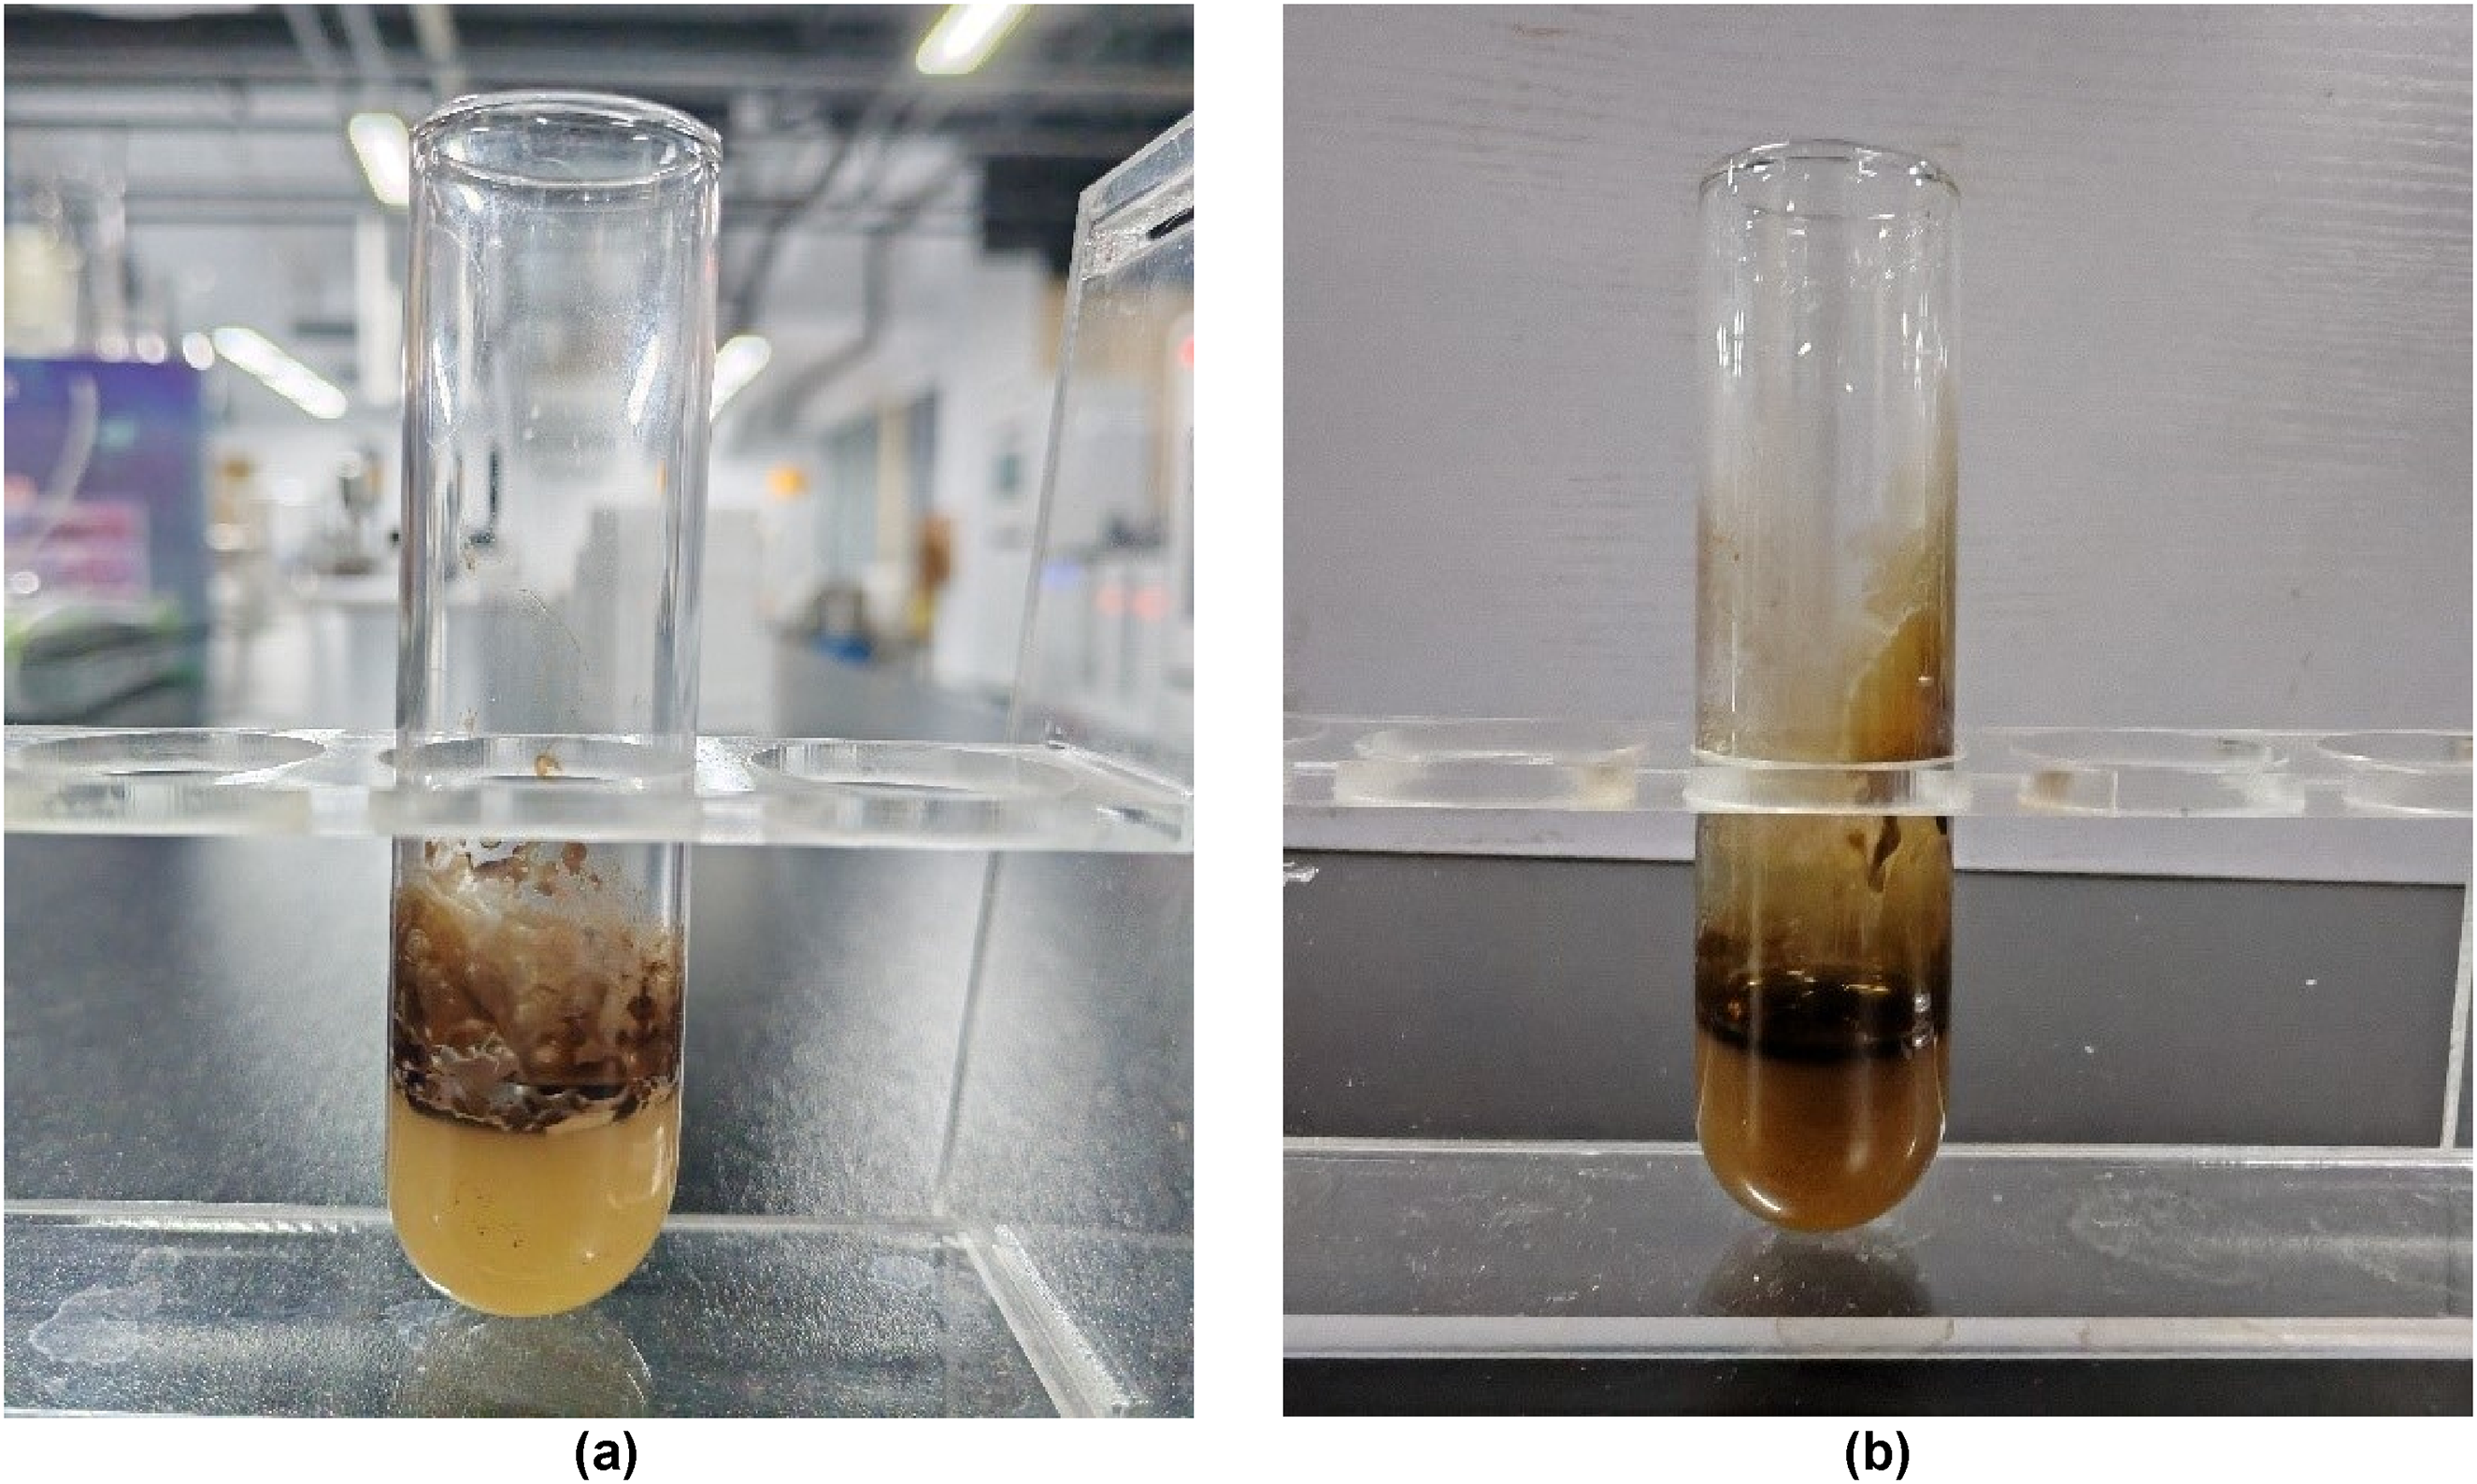
Display of oil sample effects at the outlet end under two different pressure conditions: (a) 35 MPa, 1.3 PV and (b) 53 MPa, 1.3 PV.
Discussion
The study first designed a slim tube experiment and predicted the accurate MMP of 75 MPa based on extrapolation method. Using this pressure as a benchmark, two pressure environments, 35 and 53 MPa, were designed for the long core displacement experiment of carbon dioxide. These two pressure values have certain representativeness and practical and theoretical significance. The rock fracture pressure in this block is around 35 MPa, which is the ultimate pressure in the development practice scenario. In addition, the design of 53 MPa pressure aims to make it as close as possible to the MMP. Due to the limitation of equipment pressure limit, we set this pressure at 53 MPa, which is the leading edge position of the near-miscibility pressure range. In the experiment, we were pleasantly surprised to find that under a relatively high-pressure displacement environment, the relevant index did not increase but decreased. This explains why the phenomenon of wax-solid deposition and blockage in high pour point oil still exists under high-pressure environment, and the production capacity will still be affected at this time.
The productivity index and injectivity index are usually used more in the evaluation and analysis of oilfield field data. In addition to calculating reservoir data, they can also be used to calculate unconventional reservoir system data. 30 From the perspective of well trajectory, these indices have very good application effects for both vertical and horizontal wells.31,32 However, we almost never use these indices in laboratory experiments. In this study, we innovatively transformed the elements in the index formula (such as production, injection volume, pressure difference, and time) into the elements in the displacement experiment. This index calculation model has a certain degree of accuracy in evaluating the flow characteristics of a single fluid. However, when facing special oil products such as high pour point oil and gas containing situations, we need to consider the strong migration ability of gas under multiphase flow conditions such as gas–liquid or even gas–liquid–liquid, because this may affect the uniform flow of fluid in the carrier and the applicability of the index formula. Therefore, the coupling between the index model and the fluid flow state in gas displacement experiments is the key problem we need to solve. In the selection stage of core samples, the heterogeneity parameters are strictly grasped. Based on the statistical information of this batch of core samples, the porosity specification belongs to the medium level, and its permeability and penetration ratio are 1.215 and 1.132, respectively, reflecting the weak heterogeneity of the core samples, which tend to be uniform as a whole. This batch of relatively homogeneous random pore carriers was reasonably used in the experiment. In addition, throughout the entire experimental operation, the industry standard SY/T 6573-2016 was strictly followed and executed, ensuring the reliability of every step and every link. Stabilizing pressure is another important factor in ensuring adaptability, for maintaining pressure during the experiment, the constant pressure mode was selected, which means that in the experiment, constant pressure pumps were used to control both the inlet and outlet ends, strictly maintaining the pressure difference. Figure 8 shows the pressure difference and pressure gradient characteristics under different PV number conditions. Except for the initial conditions, where the proportion of medium and heavy components in the oil results in a slightly higher pressure difference, the basic pressure difference is maintained within 0.4 MPa. Based on Figure 1, it can be observed that the formation temperature is within a relatively stable temperature range of the viscosity sensitivity characteristics and changes of crude oil. However, in order to minimize the subtle interference that temperature factors may cause, the displacement carrier was still considered to be placed in a constant temperature oven with a temperature accuracy of 0.1 °C, the experimental environment temperature was continuously monitored and strictly controlled at 60 °C. Figure 9 is a schematic diagram of the environment and design concept of the gas displacement carrier. The detailed data of the entire experimental process was recorded and evaluated, we found that the final set of data results has significant guiding significance for development and scheme design.

Pressure difference and gradient characteristics under different PV number conditions: (a) 35 MPa and (b) 53 MPa.

Schematic diagram of the environment and design concept of the gas displacement carrier.
Due to the previous index analysis being mostly applied to the macro data level of oil fields, most of the analysis results correspond to a single development mode, either gas displacement or water displacement, and it is rare to compare the two together. Conducting laboratory experiments is also an advantage of this study, it can simulate carbon dioxide displacement and hot water displacement for the same batch of fluid samples, and compare the differences between the two, such as recovery rate and index change characteristics. We can clearly see from the comparison results that the index change characteristics correspond to the displacement mechanism. The appearance of the secondary peak in the carbon dioxide displacement results precisely confirms the excellent extraction effect of carbon dioxide. The appearance of this secondary peak also reflects the huge difference in displacement mechanism between carbon dioxide displacement mode and hot water displacement mode.
Conclusions
This study, based on slim tube experiments, used extrapolation to determine the MMP (75 MPa) and designed four sets of core experiments focusing on carbon dioxide and hot water as injection media. By sorting and analyzing parameters such as productivity index, injectivity index, and recovery rate, a comparative analysis of oil production performance for high pour point oil was conducted. The specific conclusions are as follows:
Using formulas for productivity/injectivity index, it was found that when the pressure is below 53 MPa, severe blockage occurs in the porous media. Wax-solid deposition may lead to blockages, which seriously affects the productivity index under medium-pressure conditions. However, in terms of final recovery rate, wax-solid deposition impacts only productivity but does not affect the final oil displacement efficiency. The productivity index curve for carbon dioxide displacement shows two peaks: one at the breakthrough stage and the other after the breakthrough, related to the extent of extraction effect overlap. In the actual mining process, more attention should be paid to the second peak by continuing carbon dioxide injection to enhance extraction effects. In contrast, the productivity index curve for hot water displacement has only one peak. It can be observed that the recovery percent of reserves gradually began to show differences after the breakthrough of carbon dioxide, and the differences in later stage of water displacement are mainly attributed to cumulative effect of high-pressure injected fluid flushing residual oil. And the oil recovery effect of hot water displacement is lower than that of gas injection. Cost factors still need consideration in the actual displacement process. In the future, considering the advantages of geothermal resources near the target block, further compression of thermal extraction costs will be considered, and the concept design and prepilot experiments of geothermal resource utilization will be organically integrated into the mining plan.
Footnotes
Symbols
Acknowledgement
I appreciate the Liaohe Oilfield Company of China National Petroleum Corporation for providing all related research samples and some of the geological data.
Ethics statement
This study did not involve human or animal subjects, and thus, no ethical approval was required. The study protocol adhered to the guidelines established by the journal.
Funding
The author disclosed receipt of the following financial support for the research, authorship, and/or publication of this article: This work was supported by the National Natural Science Foundation of China [grant numbers: 42202164].
Declaration of conflicting interests
The author declared no potential conflicts of interest with respect to the research, authorship, and/or publication of this article.
Data availability statement
The data that support the findings of this study are available from the corresponding author upon reasonable request.