
Abstract
Due to the high frequency of fifth-generation (5G) signals, which leads to an extremely large computational scale when traditional algorithms solve the channel path loss, it is necessary to seek a fast solution method for the 5G channel path loss in substations in order to achieve a fast adaptation of the channel to the signal receiver and to ensure the reception quality of the 5G signals. Aiming at the problem that traditional algorithms suffer from extremely high computational complexity when dealing with the dyadic reflection–diffraction coefficients, a method based on singular value decomposition is proposed to reduce the dimensionality of the channel matrix for solution. Firstly, the ray tube model is used to divide the channel, and the incident angle information within the channel matrix is chunked through the nodes to discard the duplicates and those that contribute very little to the channel path loss. Then, matrix dimensionality reduction is achieved by the singular value decomposition algorithm, and the dimensionality-reduced channel matrix is substituted into the sum-vector inverse wrap-around coefficient solution formula to achieve the fast solution of 5G channel path loss. Finally, a comparison of the computational results of the proposed algorithm with those of the traditional algorithm is carried out by taking the 5G base station antenna of AAU5270E as an example and using the computational results of the experimental measurement data as a benchmark. The results show that the accuracy loss of the method proposed in the paper is only 1.31%, the compression of the data is 84.89, and the order of magnitude of the computation is 105 lower than that of the traditional algorithm. Future research could further integrate real-time channel data to achieve dynamic adaptive optimization, while extending this dimensionality reduction framework to high-dimensional complex channel modeling such as the sixth generation (6G), thereby promoting the continuous development of the algorithm in terms of real-time performance and generalization capability.
Keywords
Introduction
In recent years, fifth-generation (5G) communication technology has been widely adopted in substations, bringing its communication quality issues into sharp focus. 1 In engineering applications, 5G channel path loss is commonly used to characterize the communication quality of 5G signals, 2 and the ray tracing algorithm is employed to solve it. 3 The solving speed directly determines the adaptation speed between the channel and the signal receiver, thereby affecting the transmission quality of 5G signals. 4 However, due to the high frequency of 5G signals, they exhibit poorer penetration compared to signals in other frequency bands and are more prone to reflection and refraction on the surfaces of numerous electrically large metal equipment obstacles within substations. Consequently, when using this algorithm to solve for channel path loss, a significantly higher number of segmented ray tracings is required, leading to excessive computational loads that become impractical. 5 Therefore, reducing the number of ray tracings in traditional channel path loss algorithms is key to solving the challenge of 5G channel loss calculation in substations.
The initial approach for determining wireless signal channel path loss employed empirical formulas, 6 whose accuracy relies heavily on extensive experimental data from specific substations, often leading to significant generalization errors when applied to different substations. 7 To address this limitation, a stochastic geometry-based mathematical model was proposed in Huang et al. 8 ; however, its use of time-independent expectation and variance parameters in the Rayleigh distribution probability density function fails to capture the relative time-delay characteristics of 5G channels, resulting in limited computational accuracy. Subsequent research9,10 introduced more sophisticated ray tracing techniques incorporating geometrical optics (GO) and uniform theory of diffraction (UTD), which utilize comprehensive ray-path intersection testing 11 to accurately trace reflected and refracted 5G signal paths. Nevertheless, the algorithm's iterative segmented ray tracing approach requires repeated intersection testing with all obstacle surfaces for each path segment, creating computationally prohibitive overhead. 12 Consequently, effective application of ray tracing algorithms for 5G channel path loss analysis in substations necessitates substantial reduction in ray tracing iterations.
In practical engineering applications, similar challenges in rapid 5G channel path loss calculation have been encountered as those in substation scenarios. Existing research 13 on urban subway systems and high-speed drone communications has addressed this by utilizing the multipath effects of 5G signals 14 to construct sparse channel matrices, which were then reduced in dimension based on eigenvalues from multiple segmented ray-intersection tests to improve ray tracing efficiency. However, substations present unique characteristics where 5G signals maintain relatively fixed positions relative to obstacles, making ray-intersection tests for reflected/refracted paths unavoidable. This results in dense channel matrices with large condition numbers 15 that are particularly challenging for extracting the intrinsic low-dimensional space of 5G channels. To effectively apply matrix dimensionality reduction techniques for substation 5G path loss calculation, a specialized approach is required: the time-delay characteristics must be properly parameterized and combined with channel matrix completion to reduce matrix rank, thereby enabling accelerated ray tracing convergence while maintaining solution accuracy—a critical requirement for practical substation deployments.
To address this challenge, this paper proposes an enhanced ray tracing algorithm that builds upon traditional approaches while incorporating channel matrix construction concepts. By leveraging the unique path distribution characteristics of 5G signal reflections/refractions in substation equipment, we introduce singular value decomposition (SVD) 16 for 5G channel path matrix dimensionality reduction, enabling rapid calculation of path loss in substation environments. The proposed algorithm has been successfully implemented and validated at the Henan Guandu 500-kV substation, demonstrating practical effectiveness while providing valuable insights for future algorithmic improvements.
5G channel path loss and analysis of existing algorithms
5G channel path loss in substation environments
In practical engineering applications, 5G base station antennas are typically installed on the roof of the main control building. During normal operation, the directionally transmitted high-frequency electromagnetic waves propagate through two distinct paths: a portion is received directly by the signal receiver, 17 while the remaining signals undergo multiple reflections and diffractions at the surfaces and edges of densely distributed metallic equipment within the substation before being captured by the receiver. This complex propagation mechanism ultimately forms the characteristic 5G channel environment in substations as illustrated in Figure 1, where the superposition of direct and multipath components creates unique signal propagation characteristics that significantly influence communication performance in these electromagnetically complex industrial settings.
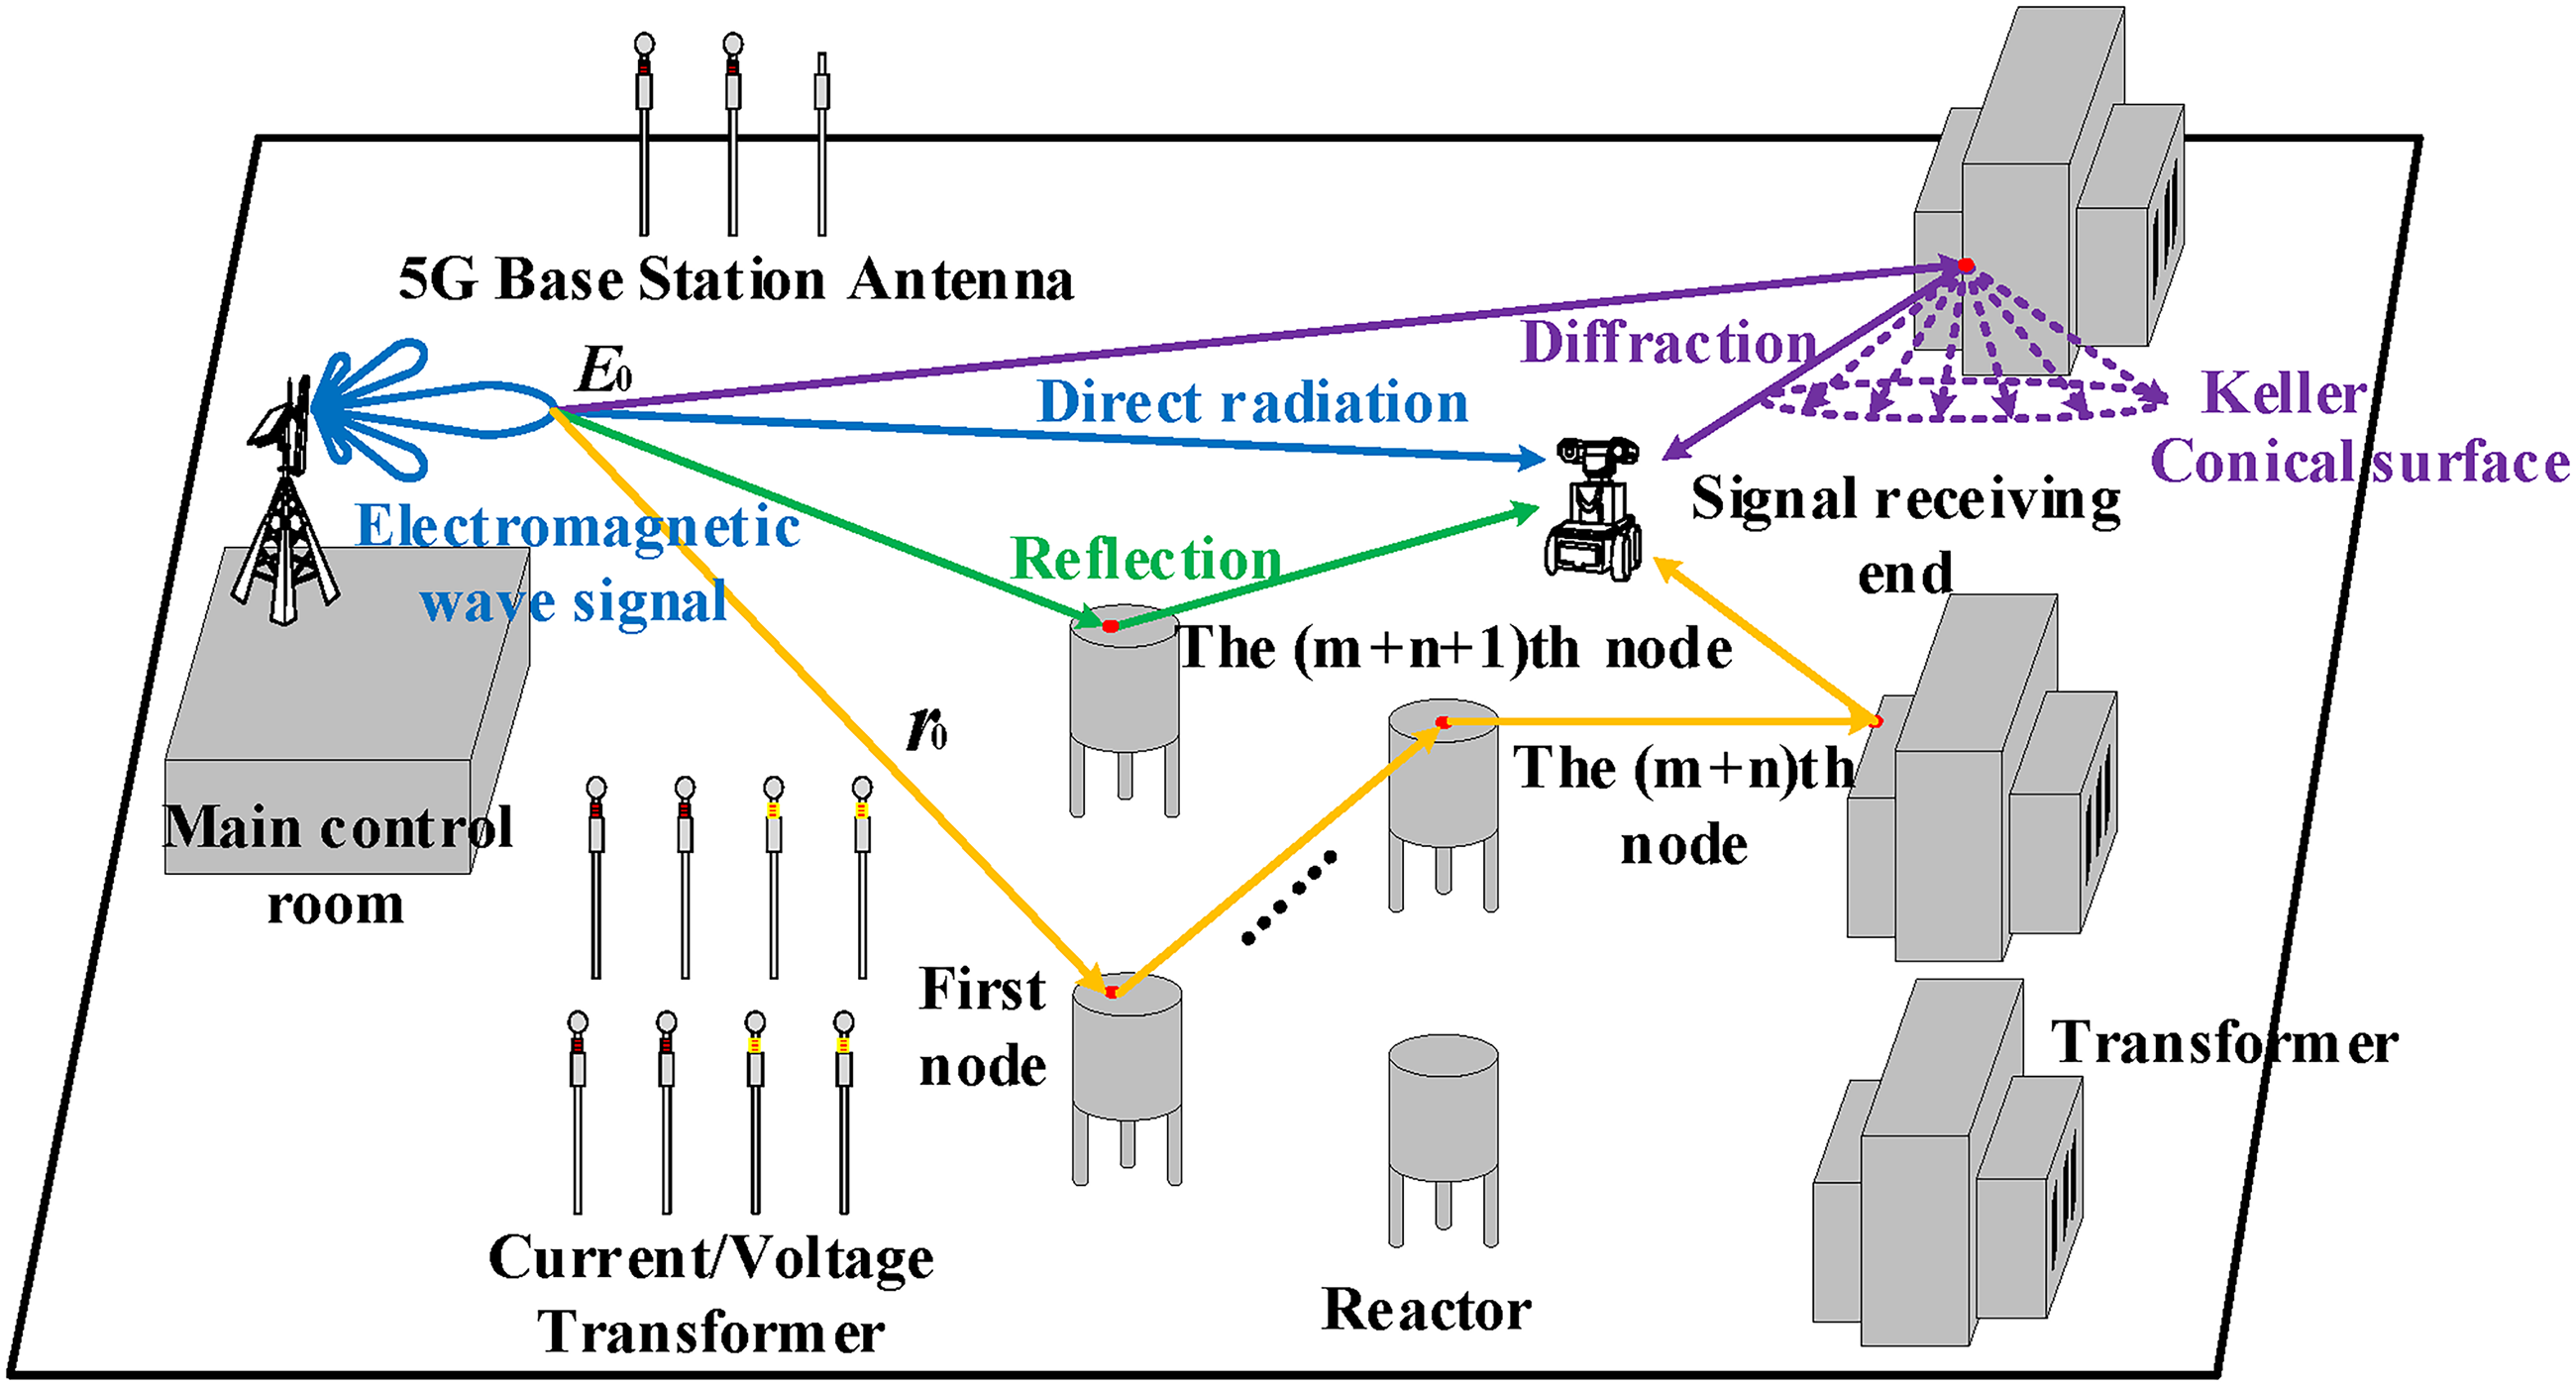
Schematic of 5G channel in substation.
According to the ray-tube model, the 5G channel can be divided into various electromagnetic wave propagation paths as illustrated in Figure 1. 18 The points where electromagnetic waves interact with equipment surfaces or edges are defined as nodes, and the angle between the wave propagation direction and the surface normal at each node is termed the incident angle—both the node coordinates and incident angles can be calculated based on Fermat's principle.19,20 Using this nodal information, the number and locations of direct, reflected, and diffracted propagation segments along each path can be precisely determined. When waves propagate directly to the endpoint, the resulting path loss (termed direct loss 20 ) is solely affected by the atmospheric medium. For reflected paths, the dominant loss mechanism (reflection loss 20 ) stems from thermal effects of induced surface currents on equipment. Diffraction at edge nodes generates Keller cones, 20 where phase differences among diffracted waves cause interference patterns, producing characteristic diffraction losses 20 that significantly influence overall channel behavior in substation environments.
The total energy loss of electromagnetic wave signals during propagation, namely, the path loss of the 5G channel, can be obtained based on the aforementioned loss sources in the propagation process.
Traditional ray tracing algorithm and its limitations
At present, the most commonly used algorithm for solving channel path loss in substations is the ray tracing method. This algorithm first stores the incident angle information of all electromagnetic wave signals in the substation in matrix form, defined as the channel matrix. The channel matrix is then used to calculate reflection and diffraction loss parameters. Finally, the total radiated field strength of the electromagnetic wave signals at the receiver is determined from these loss parameters to characterize the channel path loss. 21
The calculation formula for the total radiated field strength is given by Liu
21
as

In the equation,
In equation (1), the most complex computational process lies in solving for
Moreover, the energy distribution across channels is nonuniform, with the majority of energy concentrated in only a few channels. 22 Channels with minimal energy distribution contribute negligibly to the total radiated field calculation, 22 making full path loss computations for these channels practically insignificant. The conventional approach unnecessarily performs iterative calculations on both redundant information and low-contribution data in the channel matrix, consuming substantial computational resources that could otherwise be reduced.
This reveals the primary limitation of traditional ray tracing algorithms: they store and compute incident angle information from low-energy channels, resulting in an excessively large channel matrix and introducing unnecessary computational overhead.
Overall solution approach for improving the ray tracing algorithm
As analyzed in Section “Traditional ray tracing algorithm and its limitations”, the key to addressing the limitations of conventional ray tracing algorithms lies in developing a method capable of eliminating the substantial redundant information in the channel matrix, thereby reducing the computational scale for iteratively solving
Eliminating the substantial redundant information in the channel matrix essentially means discarding the incident angle data stored for electromagnetic wave channels with minimal energy distribution. This requires precisely determining each channel's energy distribution impact on the total path loss, represented by its corresponding eigenvalue in the channel matrix. The presence of extensive redundant information causes the channel matrix dimensionality to expand dramatically and its numerical stability to degrade significantly, becoming a singular matrix, 23 where the eigenvalues convert to singular values. Therefore, for dimensionality reduction of the channel matrix, an SVD-based matrix reduction method can be employed to obtain the left and right singular vector matrices along with the singular value diagonal matrix. 23 The singular value diagonal matrix clarifies the magnitude of singular values corresponding to each channel and determines the number of singular values to be discarded based on the matrix rank. Finally, to verify that the reduced diagonal matrix can substitute the original, the mapping relationship between them can be validated using the norm ratio property of SVD. 23
Although the singular value diagonal matrix has now discarded redundant information, the left and right singular vector matrices remain undimensioned, resulting in dimensional mismatch with the diagonal matrix. This prevents reconstruction of the reduced-dimension channel matrix and consequently obscures the remaining channel path incident angle information. Therefore, the solution must additionally incorporate reconstruction of the left and right singular vector matrices to achieve dimensional correspondence with the singular value diagonal matrix, enabling derivation of the reduced channel matrix. Building on this, the iterative solution for
After these issues are addressed, the computational load of conventional ray tracing algorithms can be effectively reduced, thereby enabling the application of the improved ray tracing method for rapid 5G channel path loss calculation in substation environments.
Method for calculating 5G channel path loss in substations based on SVD–improved ray tracing
Construction of 5G channel matrix for substations
When calculating low-frequency signals, the total radiated field strength can typically be characterized by a single channel. However, 5G signals operate at high frequencies where wave fluctuations are prominent—a single channel proves insufficient to describe both amplitude spreading and phase variations during propagation. To address this, ray tracing algorithms employ vector superposition of multiple channel fields to determine the total radiated field strength, making channel segmentation the critical technical consideration.
Due to the spherical wavefront expansion of 5G signals, the transmitter is typically modeled as an ideal spherical source. Research shows that the inscribed icosahedron emission model facilitates precise subdivision and control of wavefront dimensions, making it the preferred ray tube model for signal transmission. As shown in Figure 2, this approach first divides the entire spherical surface into sectors and determines whether electromagnetic propagation paths fall within these divided regions. When multiple propagation paths exist within the same ray tube boundary, the algorithm normalizes their energy values uniformly and identifies them as a single channel. Therefore, the sector division scheme directly governs both the number of channels and the accuracy of channel calculations.

Schematic division of the ray tube model.
However, considering this study's objective of eliminating redundant and low-energy channels while maintaining calculation accuracy, increasing the number of channels inherently enhances the precision of the remaining channel calculations. The conventional division method proves overly coarse, potentially causing significant energy variations among actual propagation paths to be diminished during the normalization process. This may lead to the erroneous elimination of channels that should have been calculated, ultimately introducing substantial errors in the path loss determination. To improve the accuracy of the remaining channel calculations, further subdivision of the icosahedron can be implemented to enhance computational precision.
As illustrated in Figure 3, since the ray tube approximates signal propagation through tubular sections, the node R (where the signal interacts with equipment surfaces) must lie within the corresponding contact area abcd.

Range of contact between radiation tubes and metal equipment.
Based on this foundation, the GO-based optical path function is applied in conjunction with Fermat's principle to derive all node coordinates by optimizing the optical path function under the boundary constraints of the contact area.
20
Subsequently, the cosine values of the incident angles at each node are obtained using the vector inner product principle.
24
After the incident angles for all nodes are acquired, given a system with w channels where each channel undergoes m reflections and n diffractions (resulting in m + n nodes per channel), the channel matrix
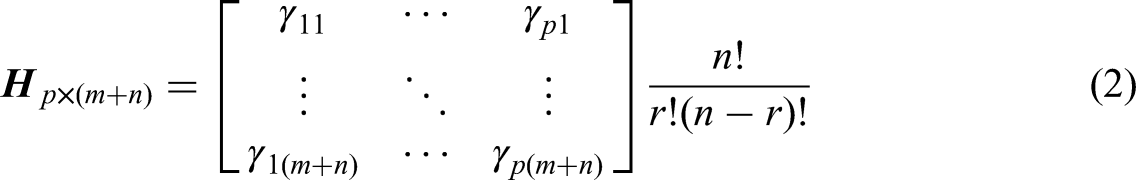
In the equation, p > w due to the increased matrix dimensionality caused by diffraction effects.
Selection of channel matrix dimensionality reduction algorithms
As analyzed in Section “Traditional ray tracing algorithm and its limitations”, the channel matrix serves as a critical parameter for determining the dyadic reflection–diffraction coefficients of 5G signals. When 5G signals undergo reflection or diffraction at nodal points within the channel matrix, GO and UTD establish the vector relationship between incident fields and receiver-side field strength. However, this process requires constructing third-order matrix equations for dyadic reflection–diffraction coefficients at each node, resulting in high computational complexity.
20
To address this, the ray tracing algorithm adopts a ray-based coordinate system, yielding the following simplified form of dyadic reflection–diffraction coefficients in this coordinate system:
20

In the equation,
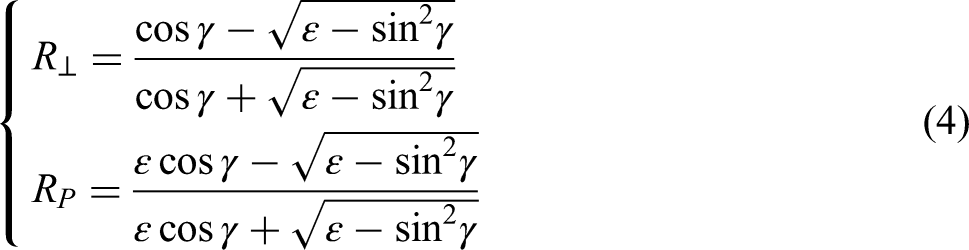

The equation parameters are defined as follows: R⊥ denotes the orthogonal polarization reflection coefficient, R∥ represents the horizontal polarization reflection coefficient, De indicates the orthogonal electric polarization diffraction coefficient, Dm signifies the horizontal magnetic polarization diffraction coefficient, and De,m is the uniform diffraction coefficient. For reflection terms, γ is the 5G signal's incident angle, and ε is the equipment's relative permittivity. For diffraction terms, φ1 and φ2 respectively represent the exterior angles between the incident/diffracted waves and the incident plane, with the effective incident angle calculated as γ = π − |φ1 − φ2|, while k is the wavenumber parameter.
Therefore,
Since the incident angles of 5G signals are stored within the channel matrix, a matrix partitioning approach can be implemented as illustrated in Figure 4(a). During the calculation of
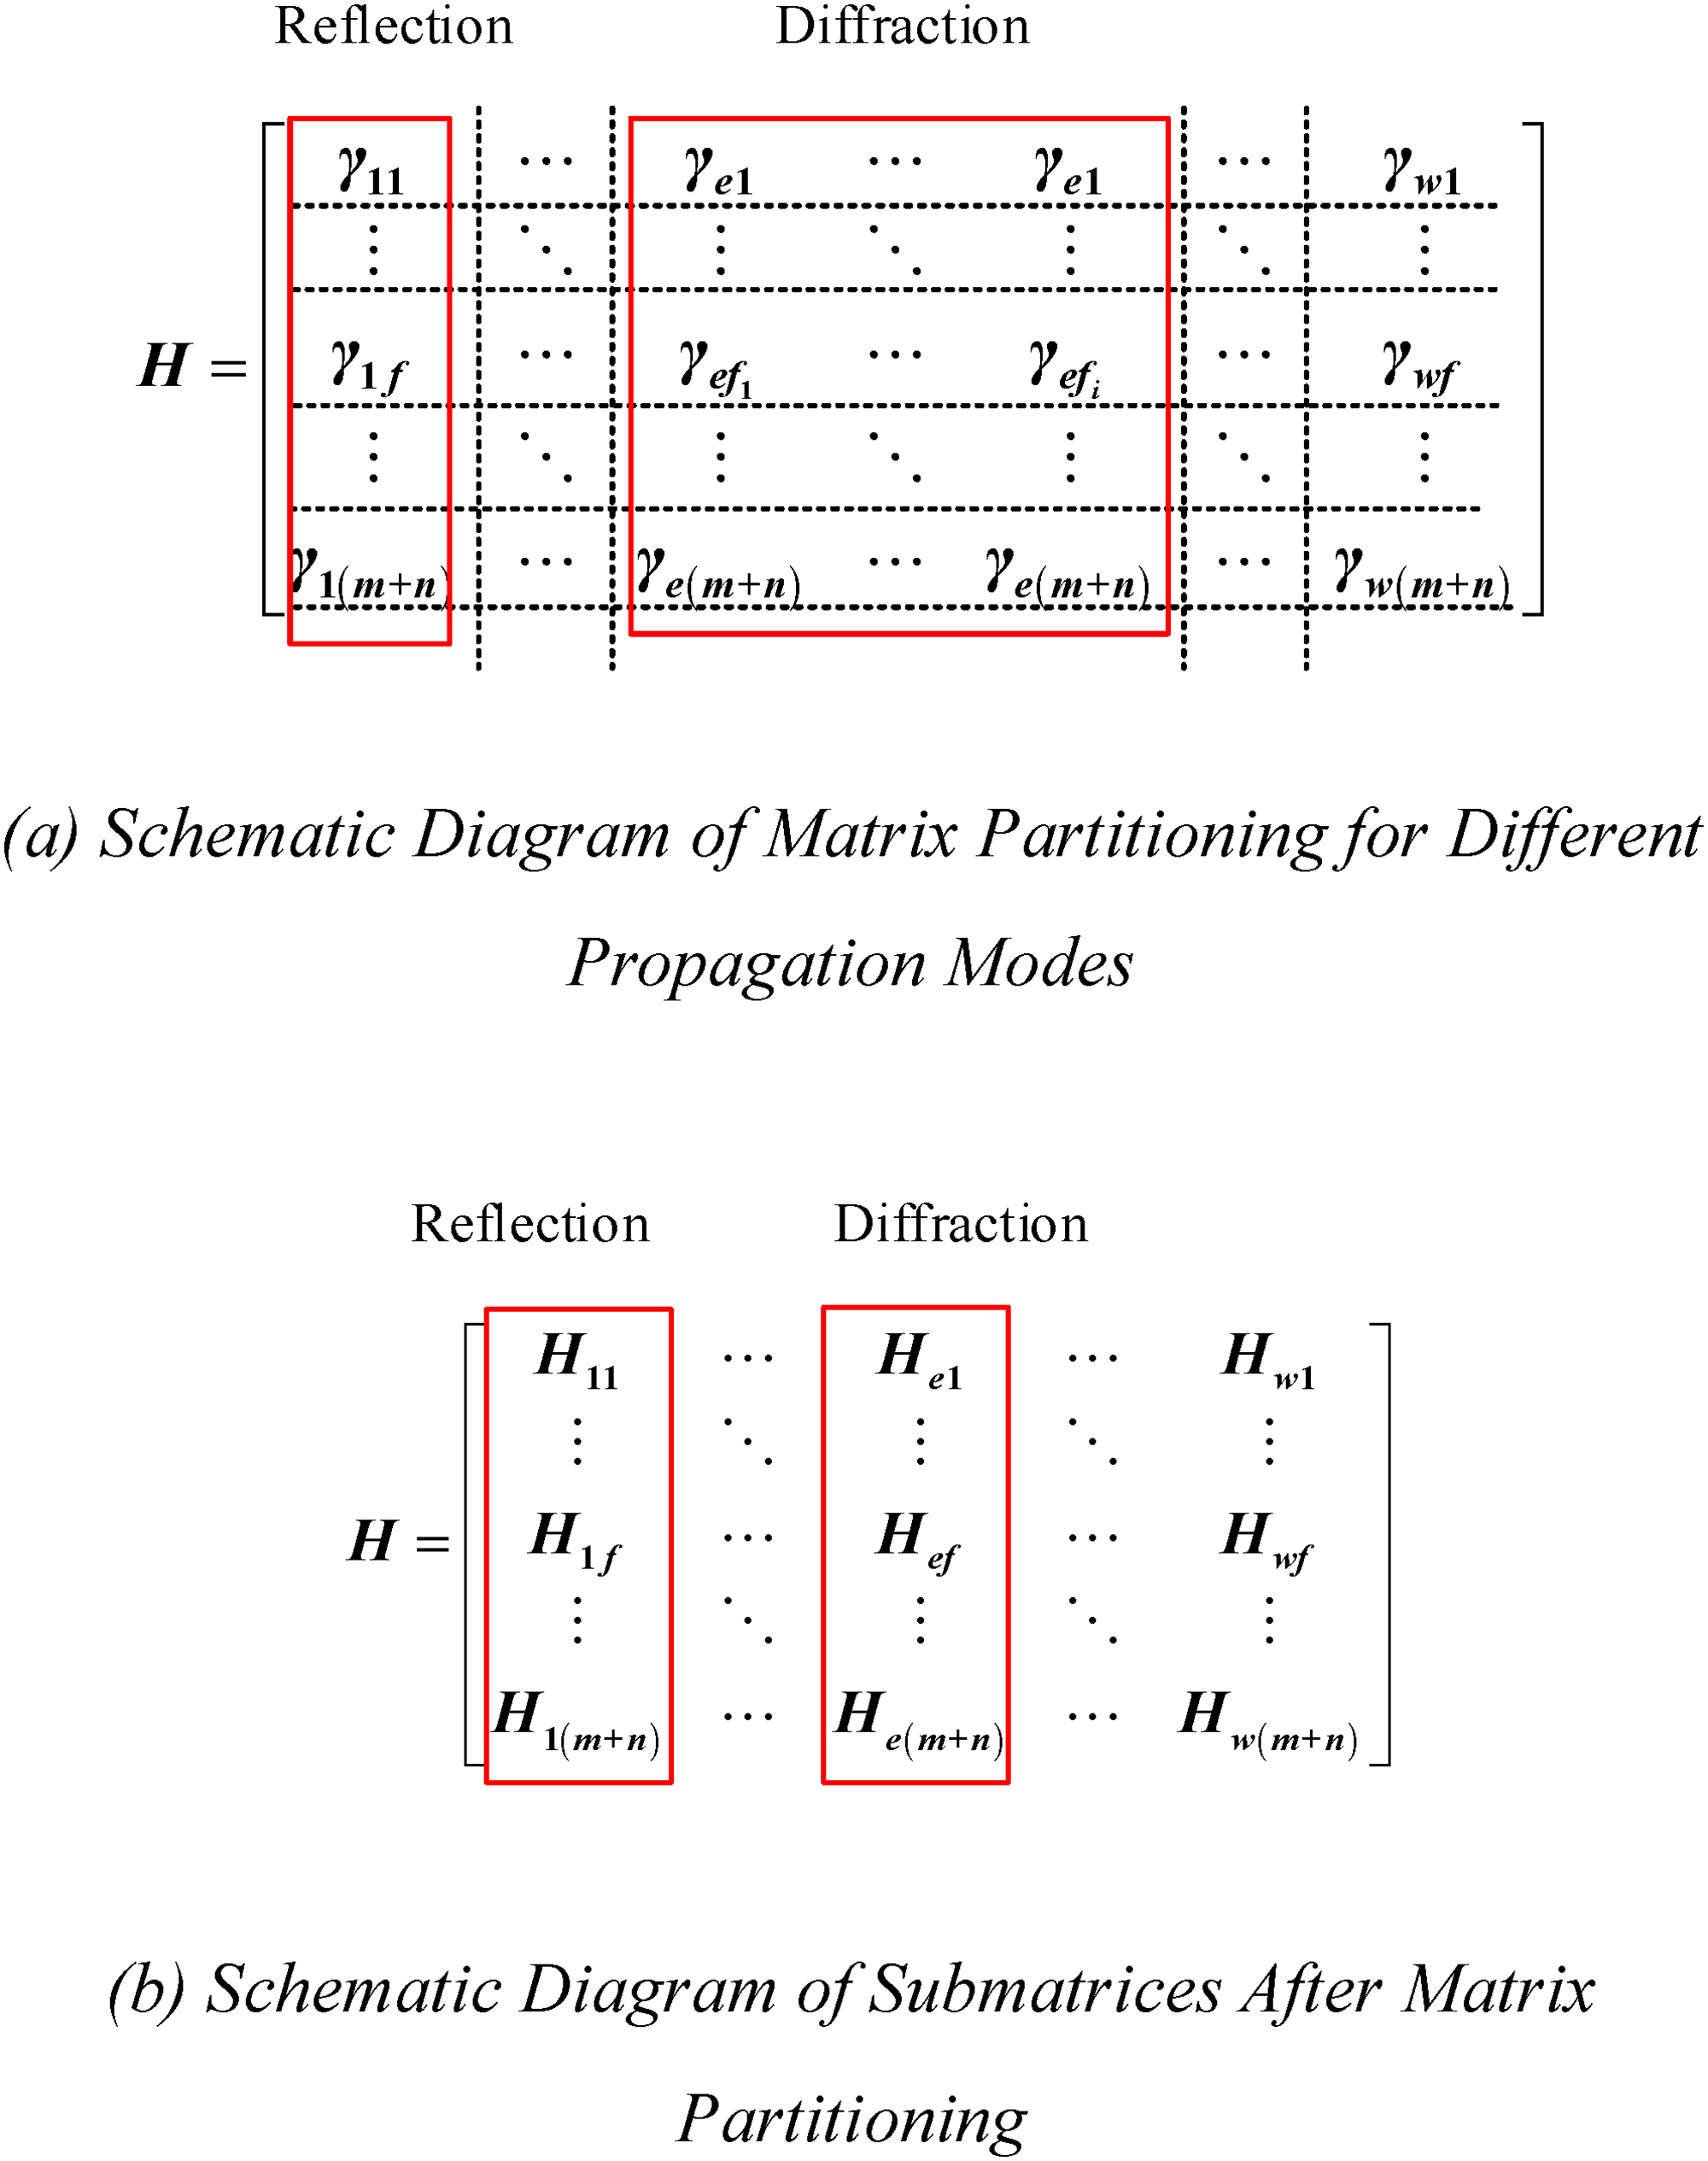
Schematic diagram of channel matrix chunking.
The partitioning process is shown in Figure 4. For reflected 5G signals, each submatrix contains only one incident angle element and can be directly substituted into equation (4) to calculate
Moreover, the computation of equations (4) and (5) for nodes in low-energy channels has negligible impact on the final results of total radiated field determination. Therefore, reducing the calculations of
SVD serves as a fundamental technique in modern signal processing, capable of efficiently extracting algebraic properties and underlying features from high-dimensional ill-conditioned matrices. In signal processing applications, channels with higher energy exhibit correspondingly larger singular values, enabling rapid identification of each channel's relative contribution to the final results while effectively eliminating redundant and nonessential information. Unlike alternative matrix dimensionality reduction methods, SVD maintains universal applicability to arbitrary matrices, 23 making it particularly suitable for handling non-square-asymmetric matrices like those encountered in substation 5G channel modeling. These characteristics collectively establish SVD as the preferred method for channel matrix dimensionality reduction.
5G channel path loss in substations based on SVD–improved ray tracing
According to the definition of SVD, for the channel matrix Hp×(m +
n
), there must exist orthogonal matrices U and V satisfying the following relationship:

In the equation,

In the equation,
In equation (7), the singular values of each channel path in the diagonal singular value matrix are arranged along the diagonal. When diffraction occurs at a node, it generates numerous consecutive and repeated singular values. In this case, retaining one singular value suffices to characterize the contribution of that node's incident angle information to the total radiated field, while the remaining values can be discarded as redundant information.
Although the resulting matrix discards repeated redundant information and reduces computational scale to some extent, it still contains numerous singular values that are zero or approach zero. The incident angle information corresponding to these negligible singular values contributes minimally to the total radiated field, making their calculations essentially insignificant. Therefore, a method can be developed to eliminate these trivial incident angle data, thereby further reducing computational complexity.
In the field of matrix analysis, there exists a method for determining effective rank by discarding singular values approaching zero. This approach first constructs an intermediate matrix by eliminating redundant information and then sorts its singular values in descending order. The method proceeds by iteratively removing the smallest singular value, computing the Frobenius norm ratio between each resulting matrix and the original matrix. The intermediate matrix whose ratio is closest to 1 is ultimately selected as the effective-rank matrix for retention.
The calculation of the Frobenius norm, while computationally intensive, can be simplified by leveraging the orthogonal invariance property of the singular value diagonal matrix, as shown in equation (8):

In the equation, ||
The relationship between the effective-rank matrix and the intermediate matrix in terms of Frobenius norm is given by

In the equation, ||
From a numerical perspective, if two matrices are similar, their norm ratio will asymptotically approach 1. Therefore, the maximum integer satisfying the inequality in equation (9) represents the effective rank of the channel matrix. At this point, singular values beyond the effective rank can be discarded, effectively eliminating the channel incident angle information that contributes minimally to the total radiated field.
Since the dimensionality-reduced singular value diagonal matrix now has mismatched dimensions with the original left/right singular vector matrices, reconstruction of these vector matrices becomes necessary. The dimensionality reduction process employed least squares estimation for effective rank determination; thus, we can utilize the least squares solution properties of matrix equations to establish the relationship between the singular vectors and channel matrix as

In the equation,
At this stage, the dimensionality-reduced channel matrix can be obtained through inverse SVD. By eliminating redundant information, the partitioned submatrices for diffraction now contain only single-incident-angle elements, allowing direct substitution into equation (5) to solve for
Computational complexity analysis based on the SVD fast algorithm
To demonstrate the efficiency of the SVD-based fast algorithm for 5G channel path loss calculation in substations the evaluation metrics include data compression ratio computational complexity and solution error with the data compression ratio defined by the following formula:
In the equation, Δε represents the data compression ratio, κdata denotes the memory space occupied by the channel matrix using conventional ray tracing algorithms, and χdata indicates the memory space occupied by the dimensionality-reduced channel matrix based on the SVD algorithm.
Since the channel matrix is the solution to a vector matrix equation, it inherently contains both real and imaginary components, necessitating storage in 8-byte double-precision floating-point format. As established in Section “Construction of 5G channel matrix for substations” the presence of diffraction at nodes results in a p × (m + n)-dimensional channel matrix. Consequently, the conventional ray tracing approach requires 8p(m + n) bytes of disk space. When applying SVD-based dimensionality reduction, only t critical incident angle components (excluding redundant data and minimally contributing field information) need storage. The reconstructed square channel matrix then occupies 8t2 bytes, yielding a data compression ratio of 8p(m + n)/8t2.
From the perspective of computational complexity, the channel matrix
The accuracy loss ΔS is defined as the absolute difference between the channel path loss calculated by the traditional ray tracing method and that obtained by the SVD approach.
Experimental validation of 5G channel path loss at the Henan Guandu 500-kV substation
Experimental overview and channel path loss calculation
To validate the engineering applicability of the improved ray tracing algorithm for solving 5G channel path loss in substations, this section employs the improved algorithm proposed in this paper alongside the traditional ray tracing algorithm described by Yifeng et al., 3 with experimentally measured data serving as the benchmark for comparison. To ensure a fair and consistent basis for comparison, the experimental setup—including the substation environment, equipment layout, and measurement point configuration—adopts the same arrangement as detailed by Yifeng et al., 3 thereby focusing the validation specifically on the performance gains of the proposed algorithmic improvements. Field strength measurements were taken at seven test points near metallic equipment in a 500-kV substation in Henan Province to calculate channel path loss. The experimental setup refers to the work of Yifeng et al., 3 where the 5G antenna (model AAU5270E) was installed on the roof of the southern control building, positioned 10 m above ground level and 15 m from the boundary of the substation equipment area. The antenna operated with 15-W transmission power at 2.5-GHz frequency, while measurements were performed using a 3075X-R spectrum analyzer and EST3117 receiving antenna. The specific experimental layout is shown in Figure 5.

Antenna location and receiving equipment arrangement.
The distribution of the seven measurement points within the substation is the same as in the work of Yifeng et al., 3 all located in metal-equipment-intensive areas with sequentially increasing distances from the transmitting antenna. During field measurements, the receiving antenna was positioned at 1.7-m height and connected to the spectrum analyzer; the schematic diagram of the specific distribution is shown in Figure 6.
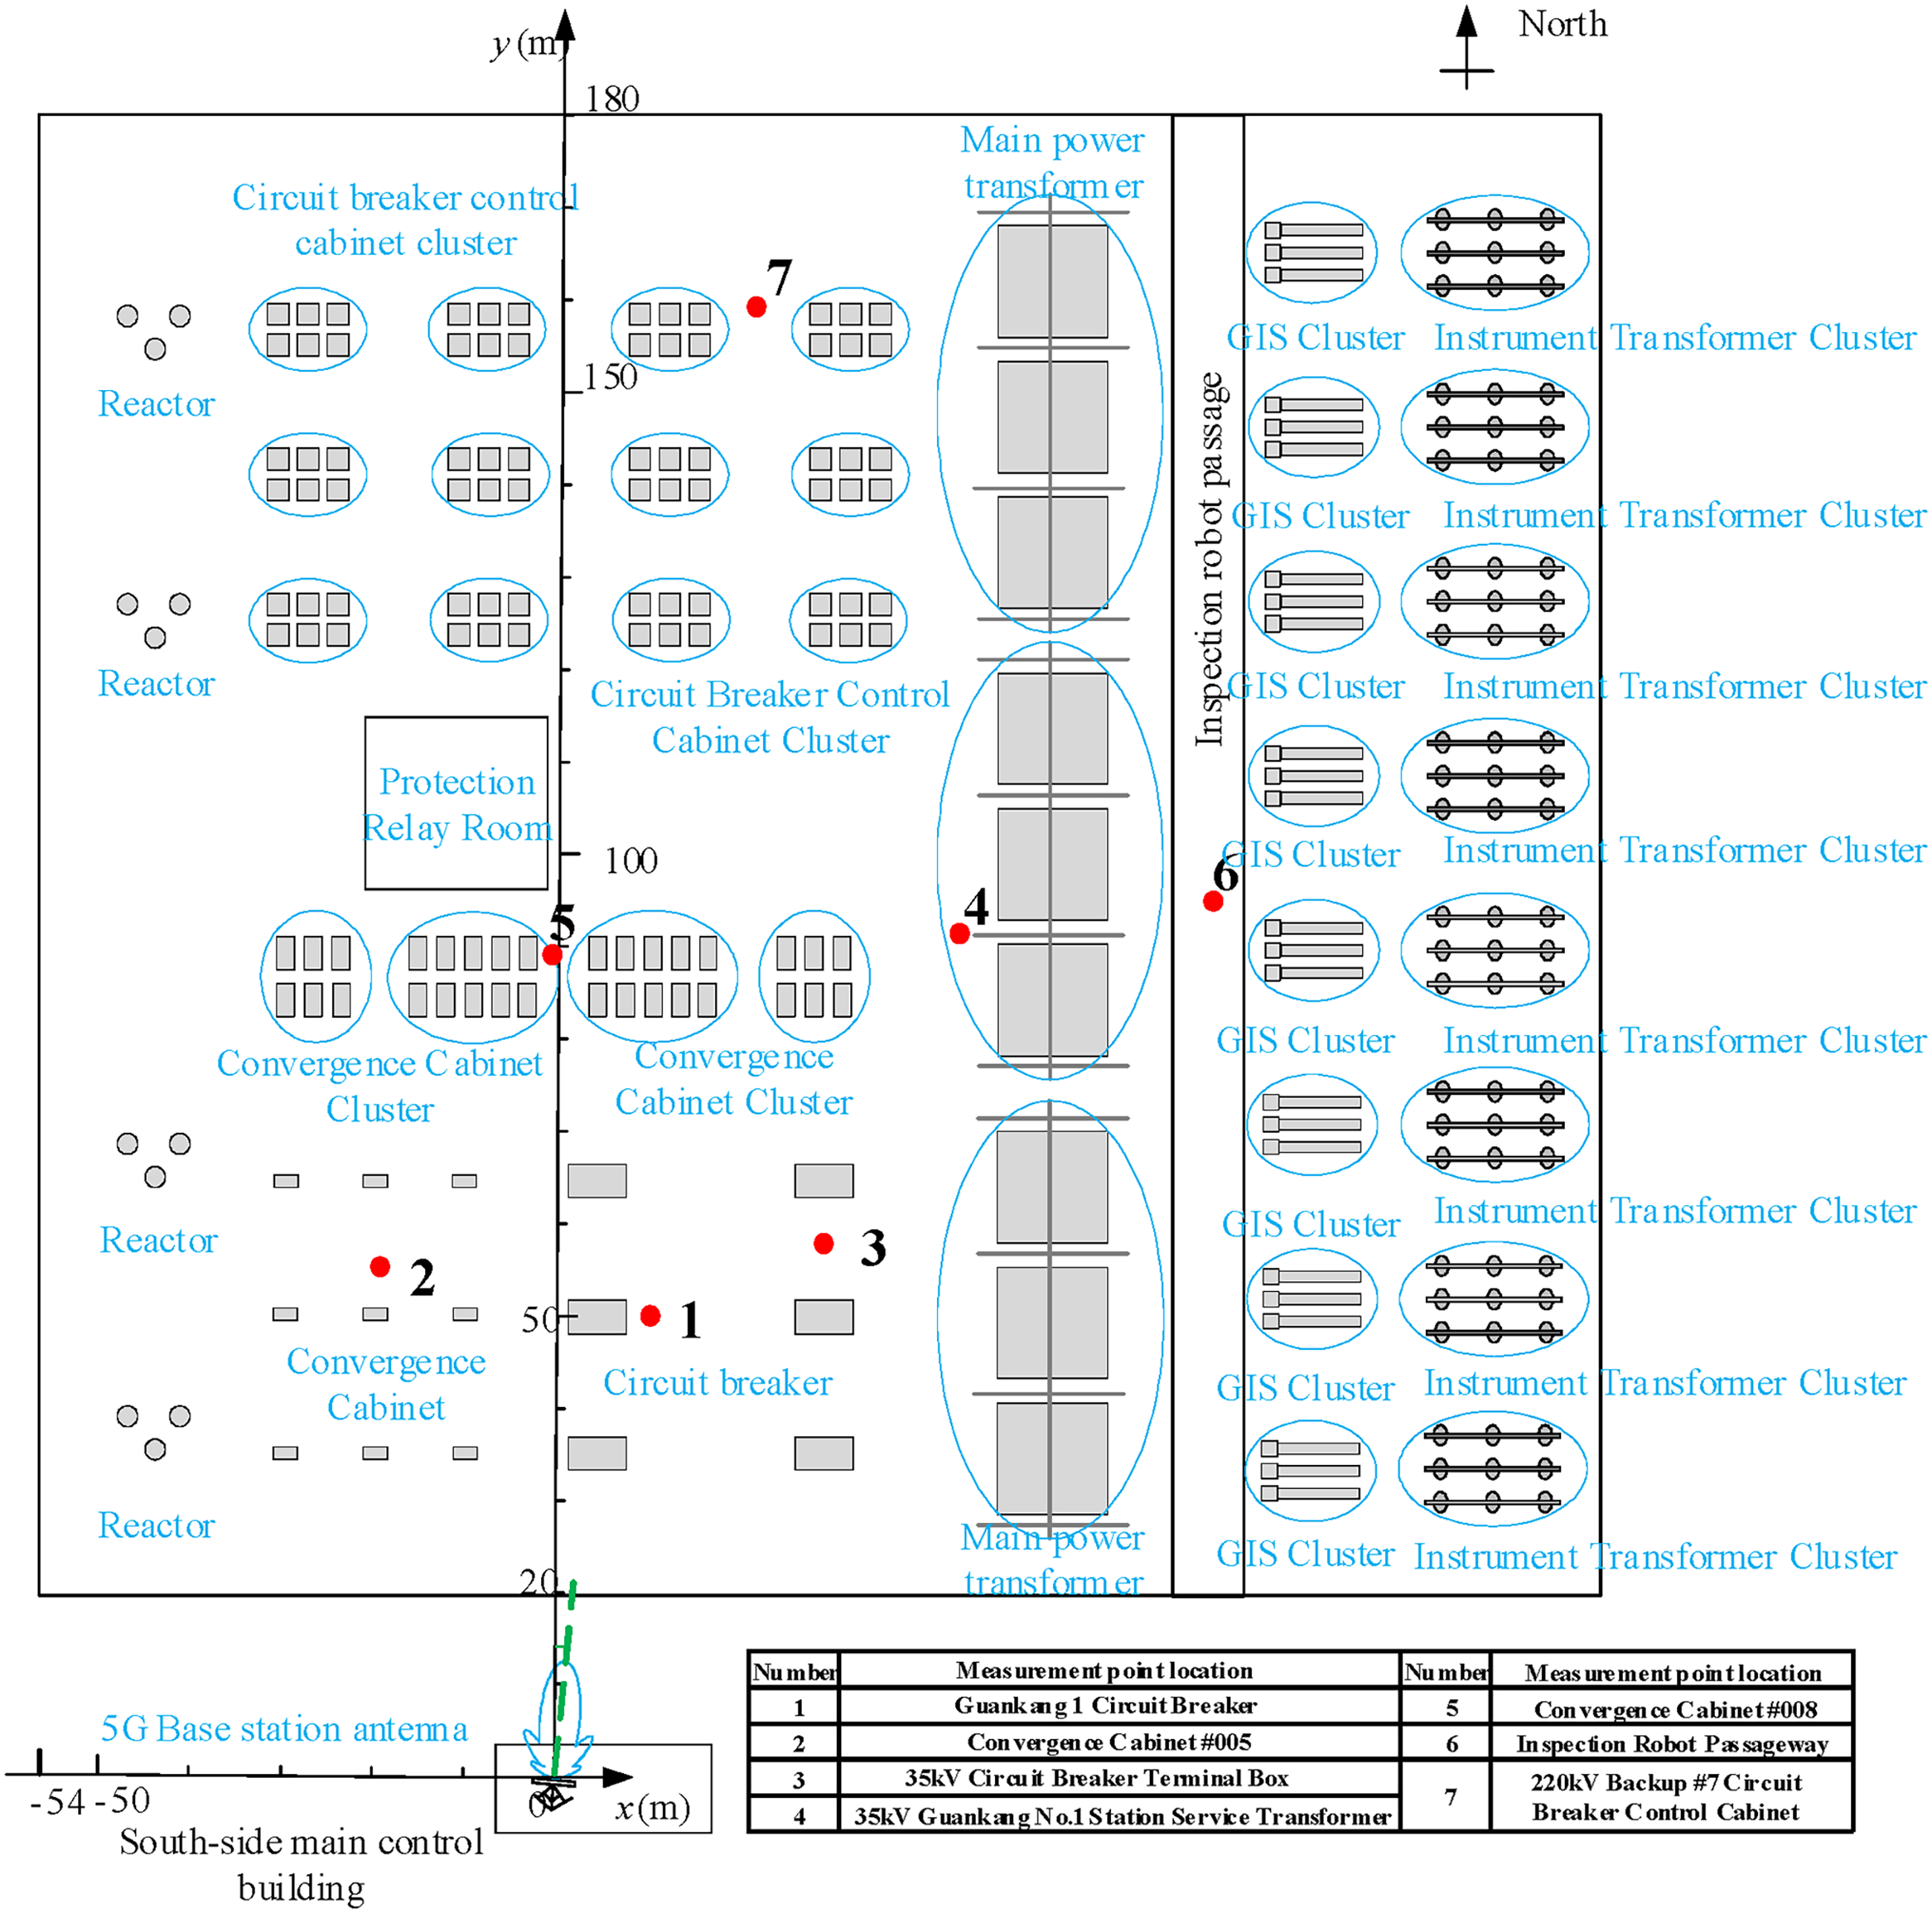
Distribution of the seven measurement points within the substation.
The path loss is calculated from the received signal power Pr and the transmitted power Pt according to

In this experiment, the transmitted power Pt is 15 W.
The data–processing procedure for each measurement point includes the following steps.
Data acquisition: At each measurement point, a spectrum analyzer records the received power spectrum over a period (e.g. 30 s) and extracts the received power values at the 2.5-GHz frequency point with a high sampling rate (e.g. 10 samples per second).
Pre–processing: Outliers caused by transient interference are removed based on a standard–deviation threshold.
Averaging: The arithmetic mean of the pre–processed power values is computed to obtain a stable average received power
Path loss calculation:
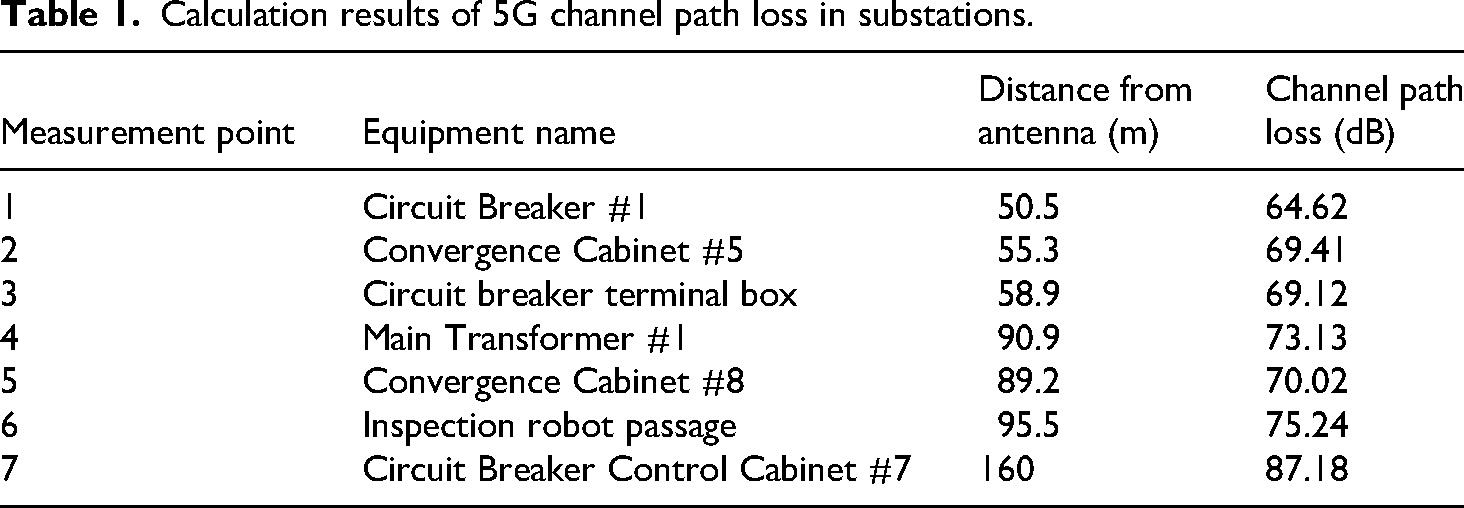
Calculation results of 5G channel path loss in substations.
This study improved the ray tracing algorithm. To verify that the enhanced algorithm can increase the computation speed of channel path loss while maintaining accuracy, the measured path loss values from the seven test points in the experimental setup were used as benchmark references. The path loss values calculated by the ray tracing algorithm served as control values, enabling computation of the accuracy loss ΔS.
Calculation results and analysis
Based on the equipment and measurement point distribution shown in Figure 6, a 3D substation model was constructed in Altair FEKO, with certain equipment simplifications implemented according to Yifeng et al. 3 Both conventional and improved ray tracing algorithms were then applied to calculate the channel path loss at each receiver point, with results compared against experimentally measured path loss values. The comparative results are presented in Figure 7, while the error distribution is detailed in Table 2.

Comparison of two algorithms and test results.
Calculation results and errors of channel path loss at each measurement point.

To more rigorously evaluate algorithm performance, based on absolute error analysis, root mean square error (RMSE), mean absolute error (MAE), and the coefficient of determination (R2) are introduced as quantitative evaluation metrics. RMSE and MAE are used to measure the deviation between predicted and measured values, with smaller values indicating higher accuracy; R2 is used to measure the model's ability to explain the variation in measured data, with values closer to 1 indicating better goodness of fit. Based on the data in Table 2, the performance metrics of the two algorithms are calculated and compared in Table 3.
Calculation results and errors of channel path loss at each measurement point.

To demonstrate the accelerated computation achieved by the improved ray tracing algorithm for channel path loss, Figure 8 compares the processed channel data volume at Test Point 1 (nearest to the 5G base station antenna) and Test Point 7 (farthest) before and after algorithm enhancement. Table 4 quantitatively summarizes the data volume reduction between conventional and improved ray tracing implementations.

Comparison of the two algorithms at two measurement points.
Comparison of the effectiveness of the two algorithms in solving 5G channel path loss.

According to the analysis in Tables 3 and 4, the redundant information calculation in the traditional ray tracing algorithm occupies up to 80 % of the memory. After adopting the improved ray tracing algorithm, the average compression ratio of the channel matrix reaches 84.89, and the computational load drops sharply from 2.592 × 10⁹ in the conventional method to 3.44 × 10⁴, representing a reduction of five orders of magnitude (105). This enables fast calculation of 5G channel path loss.
In terms of accuracy, the RMSE and MAE of the improved algorithm (about 4.6 dB) are slightly higher than those of the traditional algorithm (about 3.7 dB), consistent with the trend shown in Figure 7 and Table 2 where the improved algorithm generally yields slightly higher results. This minor accuracy loss (approximately 0.9 dB) remains within the acceptable engineering range and meets the tolerance requirement for field strength prediction error specified in the standard GB/Z 17799.6–2017.
Regarding the goodness of fit, the R2 values of both algorithms exceed 0.96, indicating that whether the traditional algorithm or the improved one is used, the calculated results exhibit high linear correlation with the measured values, and the models can accurately capture the attenuation trend of signals with distance and environmental changes.
In summary, at the cost of a modest increase in MAE (about 1 dB) and a slight decrease in R2 (0.012), the improved algorithm achieves a remarkable efficiency gain: a five–order–of–magnitude reduction in computational load and a storage compression ratio of 84.89. For the application scenario of rapid deployment and real–time assessment of 5G channels in substations, this represents an efficiency–accuracy trade–off with significant engineering value.
Conclusion
The 5G channel path loss solution method based on the improved ray tracing algorithm proposed in this paper discards the repeated and minimally contributive channel paths within the channel matrix of the traditional ray tracing algorithm, thereby substantially reducing the required computational resources. Taking the AAU5270E 5G base station antenna as an example, the 5G channel path loss was calculated using both the original and the improved ray tracing algorithms. Comparative analysis reveals that, while maintaining a high explanatory power of the model (R2 = 0.966), the improved algorithm achieves a MAE of 4.61 dB. Although this value is slightly higher than that of the traditional algorithm, it remains well below the error tolerance specified by engineering standards. Moreover, the algorithm attains a significant efficiency improvement: a data compression ratio of 84.89 and a reduction by five orders of magnitude in computational load. This successfully addresses the core issue of excessive computational scale inherent in the conventional method.
Future research could focus on several promising directions: (1) integrating real-time channel measurement data with the proposed algorithm to develop adaptive optimization strategies for dynamic substation environments; (2) extending the application of this dimensionality-reduction framework to more complex scenarios, such as channel modeling for upcoming 6G communication systems with higher frequency bands; and (3) exploring hybrid acceleration techniques that combine the proposed matrix decomposition method with parallel computing architectures to achieve real-time or near-real-time path loss prediction for large-scale, ultra-dense networks.
Footnotes
Authors’ contribution
Zhang Chi: Conceived the research idea, designed the algorithmic framework, drafted the initial manuscript, conducted experimental simulations and data analysis, and revised and finalized the manuscript.
Zhu Zhendong: Contributed to the algorithm design and theoretical derivation and assisted in data processing and result validation.
Liu Yi: Designed the experimental protocol and conducted field data acquisition and participated in result analysis and discussion.
Shang Zhiyu: Participated in literature review and initial manuscript drafting and assisted in figure preparation and formatting.
Yang Yuening: Assisted in experimental simulations and data organization and contributed to manuscript revision and language polishing.
All authors have read and approved the final manuscript.
Funding
The authors received no financial support for the research, authorship, and/or publication of this article.
Declaration of conflicting interests
The authors declared no potential conflicts of interest with respect to the research, authorship, and/or publication of this article.
Data availability statement
The datasets generated and analyzed during the current study are available from the corresponding author on reasonable request.